


Languages
Pages
Legal

The State of ADAPsReview of the 2011 National ADAP Monitoring Project Annual Report and Update on the ADAP CrisisBritten PundNational Alliance of State & Territorial AIDS DirectorsJuly 5, 2011

Presentation Agenda
Highlights from the 2011 National ADAP Monitoring Project Annual Report
Update on the ADAP Crisis
Questions and Answers

National Alliance of State & Territorial AIDS Directors (NASTAD)
Represents the nation’s chief health agency HIV/AIDS and viral hepatitis staff in all 50 states, the District of Columbia, Puerto Rico, the U.S. Virgin Islands and the U.S. Pacific Islands– Provides technical assistance and other support to
health department HIV/AIDS and viral hepatitis programs
– Provides national leadership on HIV/AIDS and viral hepatitis policy and programs
– Educates about and advocates for necessary federal funding

Highlights from the
2011 National ADAP Monitoring Project
Annual Report

Methodology
Respondents
All ADAPs receiving federal ADAP earmark funding through the Ryan White Program were surveyed.– 57 jurisdictions were surveyed in September 2010; 52
responded.– 57 jurisdictions were surveyed in February 2011; 49
responded.
Non-responders represent <1% of estimated living HIV and AIDS cases in the United States.

Requested Data
Survey requests data and other program information for:– A one-month period (June 2010 or December 2010)– The current fiscal year (FY2010)– Other periods as specified
Data offers a monthly “snapshot” comparison from previous survey periods.

The Report

Module One
Detailed information related to :– ADAP budgets– Client enrollment and utilization– Client demographics– Program eligibility– Program management and administration
Module Two and Module Two Supplement
Detailed information related to:– Prescription distribution and payment methods– Expenditures and prescriptions filled– Insurance coordination– ADAP coordination with Medicare Part D– ADAP coordination with Pre-existing Condition
Insurance Plans (PCIPs)– Updated client enrollment and utilization– Hepatitis treatments

Highlights from Module One

The National ADAP Budget
In FY2010, the national ADAP budget grew to $1.79 billion, a 13% increase from FY2009.
All funding streams increased incrementally over the last year.
Part B ADAP Earmark$800,033,562
(45%)
Part B ADAP Supplemental$41,750,000
(2%)
Part B Base Contribution Directed to ADAP
$20,573,517(1%)
Part B Supplemental Contribution Directed to ADAP
$12,500,358(1%)
ADAP Emergency Funding $24,999,313
(1%)
State Contribution$346,239,277
(19%)
Part A Contribution Directed to ADAP
$15,288,430(1%)
Other State or Federal$5,018,513
(<1%)
Drug Rebates$522,589,581
(29%)
The National ADAP Budget, by Source, FY2010
Total = $1.79 billion

The National ADAP Budget
FY1996 $200 m
FY1997 $413 m
FY1998 $544 m
FY1999 $712 m
FY2000 $779 m
FY2001 $870 m
FY2002 $962 m
FY2003 $1,071 m
FY2004 $1,187 m
FY2005 $1,299 m
FY2006 $1,386 m
FY2007 $1,428 m
FY2008 $1,522
m
FY2009 $1,582 m
FY2010 $1,789 m
26%
40%
53%
65% 68% 66% 64% 65%61% 59% 56% 54% 51% 49%
45%
25%
28%
22%
18%17%
17% 17% 16%19%
19%22%
21%21%
14% 19%6%
5%
6%
7%7% 7% 9% 10% 12% 15% 17%
18% 21%
31% 29%43%
26%19%
11% 9% 10% 10% 9% 7% 7% 5% 7% 7% 7% 6%
National ADAP Budget, by Source, FY1996-FY2010
ADAP Earmark State Rebates Other
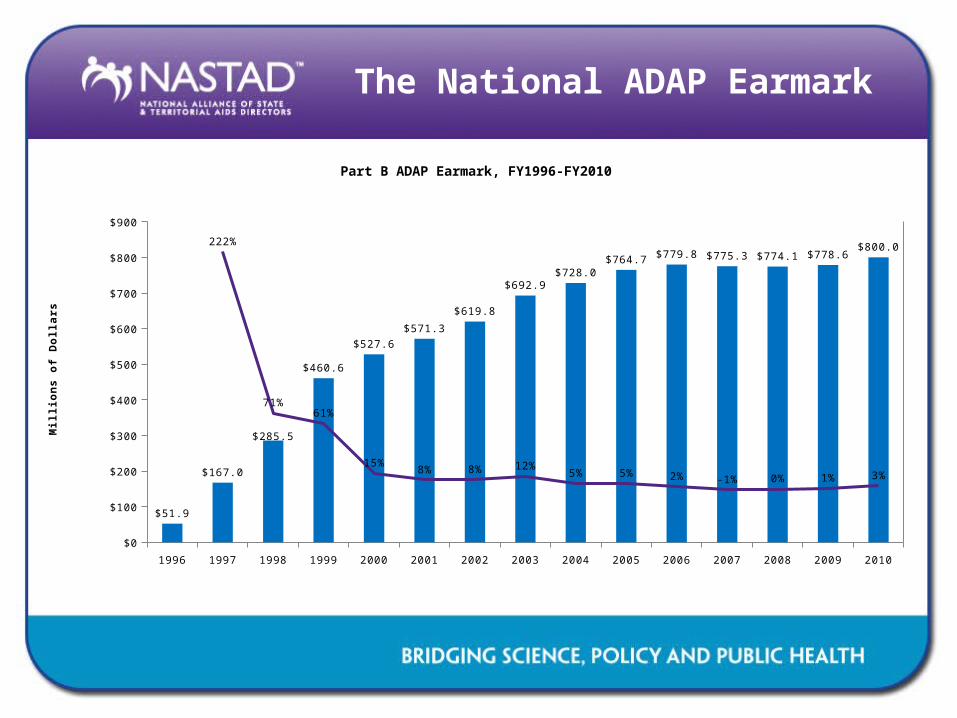
The National ADAP Earmark
1996 1997 1998 1999 2000 2001 2002 2003 2004 2005 2006 2007 2008 2009 2010
$0
$100
$200
$300
$400
$500
$600
$700
$800
$900
$51.9
$167.0
$285.5
$460.6
$527.6
$571.3
$619.8
$692.9$728.0
$764.7 $779.8 $775.3 $774.1 $778.6$800.0222%
71%61%
15%8% 8% 12%
5% 5% 2% -1% 0% 1% 3%
Part B ADAP Earmark, FY1996-FY2010
Mil
lio
ns o
f D
oll
ars
ADAP Emergency Funding
In August 2010, the Obama Administration reprogrammed $25 million to address ADAP waiting lists and other unmet ADAP needs.
Funding awards were made to 30 states.
Funding amounts ranged from $38,111 in Alaska to $6.9 million in Florida.

State Funding
1996 1997 1998 1999 2000 2001 2002 2003 2004 2005 2006 2007 2008 2009 2010
$0
$50
$100
$150
$200
$250
$300
$350
$400
$50.4
$117.4 $119.4 $125.5 $128.8$149.6
$160.4$171.9
$226.6
$252.8
$304.9$294.1
$328.5
$215.3
$346.2
133%
2% 5% 3%
16%7% 7%
32%
12%21%
-4%
12%
-34%
61%
State Funding, FY1996-FY2010
Mil
lio
ns o
f D
oll
ars
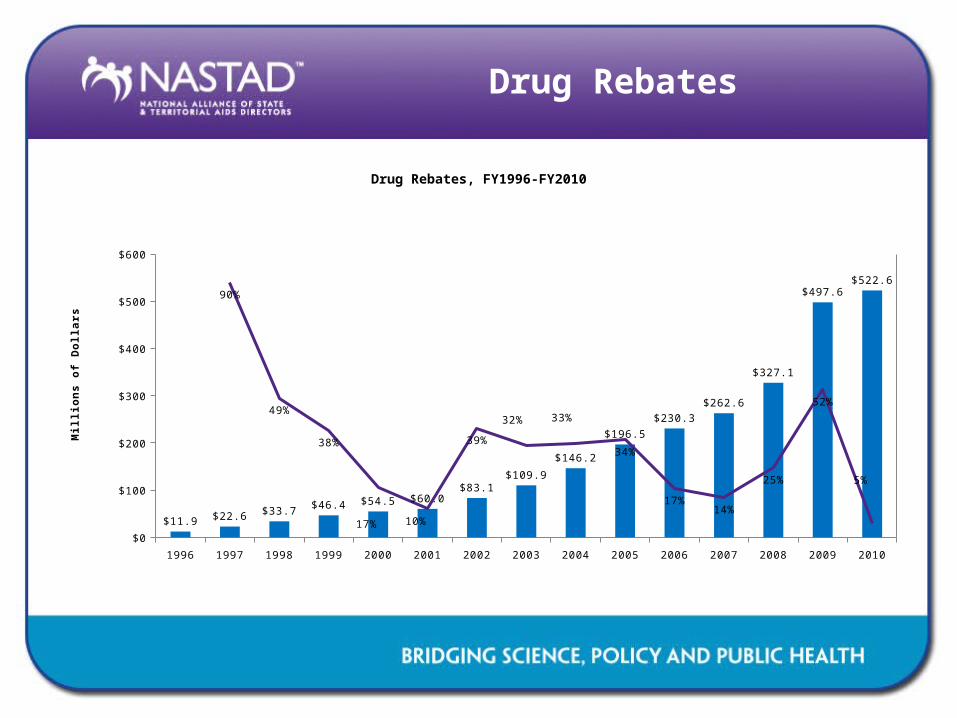
Drug Rebates
1996 1997 1998 1999 2000 2001 2002 2003 2004 2005 2006 2007 2008 2009 2010
$0
$100
$200
$300
$400
$500
$600
$11.9 $22.6 $33.7 $46.4 $54.5 $60.0$83.1
$109.9
$146.2
$196.5
$230.3$262.6
$327.1
$497.6$522.6
90%
49%
38%
17% 10%
39%
32% 33%
34%
17%14%
25%
52%
5%
Drug Rebates, FY1996-FY2010
Mil
lio
ns o
f D
oll
ars

Cost-recovery
“Cost-recovery” for medications purchased through ADAP (other than drug rebates) represented $50.5 million in FY2010.
Private insurance recovery represented 58% of all cost-recovery.
Private Insurance$29,176,302
(58%)
Medicaid$15,764,359
(31%)
Other $5,570,345 (11%)
Cost Recovery and Other Cost-Saving Mechanisms (Excluding Drug Rebates), FY2010
Total = $50.5 million

ADAP Expenditures, FY2009
In FY2009, ADAPs expended $1.4 billion on prescription drugs, representing 85% of all ADAP expenditures.
ADAPs expended $176.1 million on insurance payments, representing 10% of all ADAP expenditures.
Two percent of ADAP funds were expended for program administration costs.
Prescription Drugs $1,430,230,842 (85%)Prescription Dispensing
Costs $17,090,460 (1%)
Insurance Premiums $101,623,665 (6%)
Insurance Co-payments and Deductibles $74,457,786
(4%)
Client Outreach $1,363,314 (<1%)
Adherence and Monitoring $10,791,413 (1%)
Quality Management $3,373,897 (<1%)
Program Administration $27,146,476 (2%)
Client Enrollment Costs $4,537,753 (<1%)
Other $6,923,355 (<1%)
ADAP Expenditures, FY2009
Total = $1.7 billion
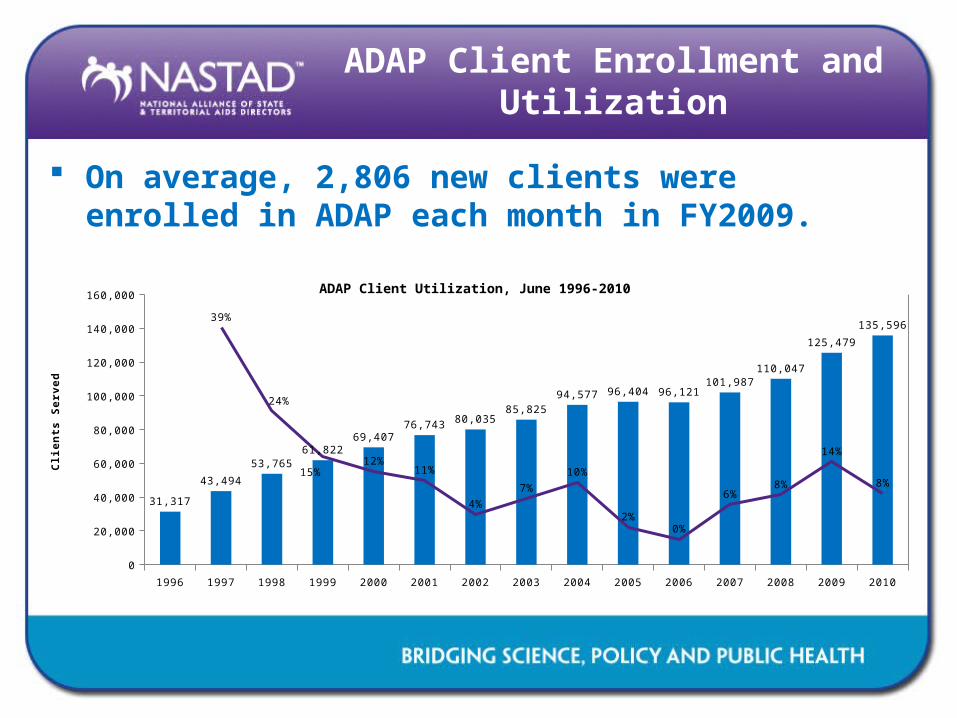
ADAP Client Enrollment and Utilization
On average, 2,806 new clients were enrolled in ADAP each month in FY2009.
1996 1997 1998 1999 2000 2001 2002 2003 2004 2005 2006 2007 2008 2009 2010
0
20,000
40,000
60,000
80,000
100,000
120,000
140,000
160,000
31,317
43,494
53,76561,822
69,40776,743 80,035
85,82594,577 96,404 96,121
101,987110,047
125,479
135,59639%
24%
15%12%
11%
4%
7%
10%
2%0%
6%8%
14%
8%
ADAP Client Utilization, June 1996-2010
Cli
en
ts S
erv
ed

ADAP Client Gender, Race/Ethnicity, and Age
Seventy-seven percent (77%) of ADAP clients are male.
Blacks and Hispanics comprise 55% (33% and 22% respectively) of ADAP clients served.
Almost half (48%) of ADAP clients are between the ages of 45 and 64.
Seventy-five percent (75%) of ADAP clients had income levels at or below 200% of the Federal Poverty Level (FPL).
Non-Hispanic Black/African
American33%
Non-Hispanic White35%
Hispanic22%
Asian1%
Native Hawaiian/Pacific Islander
<1%
American Indian/Alaskan
Native<1%
Multi-Racial5%
Other1%
Unknown2%
ADAP Clients Served, by Race/Ethnicity, June 2010

≤100% FPL
101-133% FPL
134-200% FPL
201-300% FPL
301-400% FPL
>400% FPL
Unknown
0% 5% 10% 15% 20% 25% 30% 35% 40% 45% 50%
45%
11%
19%
14%
5%
1%
3%
ADAP Clients Served, by Income Level, June 2010
Percent of Clients
Fed
era
l P
overt
y L
evel
ADAP Client Demographics

ADAP Client Insurance Status
Twenty-two percent (22%) of ADAP clients had private insurance.
Seven percent (7%) of ADAP clients were dual beneficiaries of both Medicaid and Medicare.
Uninsured
Private Insurance
Dually Eligible (Medicaid & Medicare)
Medicare
Medicaid
0% 10% 20% 30% 40% 50% 60% 70%
61%
22%
7%
13%
9%
ADAP Clients Served, by Insurance Status, June 2010
Percent of Clients

ADAP Eligibility Criteria
ADAP income eligibility in June 2010 ranged from 200% FPL in eight states to 500% FPL in six.
Fourteen ADAPs reported having asset limits in place in June 2010.

ADAP Management Policies
Thirty-three ADAPs have specific ADAP management policies in place, including:– Three ADAPs (6%) require client cost-sharing– Three ADAPs (6%) limit clients to a maximum number
of prescriptions per client per month– Twelve ADAPs (24%) maintain a clinical criteria for
client access to some medications on the ADAP formulary
– Twenty-six ADAPs (51%) require prior authorization for clients access to some medications on the ADAP formulary

Highlights from Module Two

ADAP Client Utilization
ADAPs provided medications to 127,998 clients in December 2010.
Client utilization increased by 2% between June 2009 and December 2010; client utilization decreased by 2% between June 2010 and December 2010.
June 2009 June 2010 December 2010
125,479
135,5967127,998
ADAP Clients Served, June 2009, June 2010 and De-cember 2010
Nu
mb
er
of
Cli
en
ts
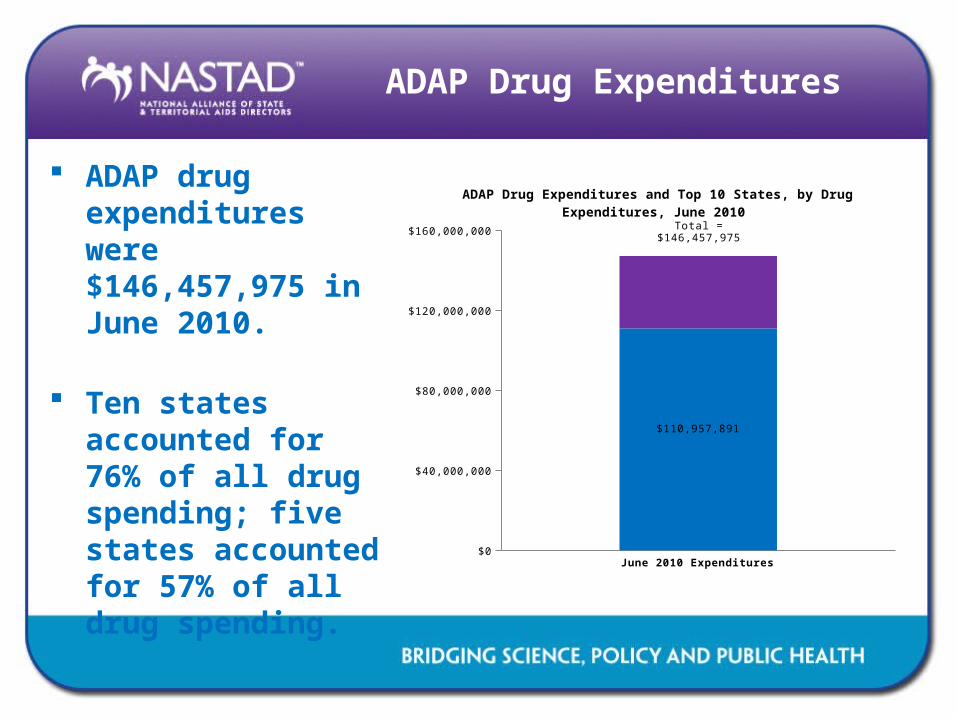
ADAP Drug Expenditures
ADAP drug expenditures were $146,457,975 in June 2010.
Ten states accounted for 76% of all drug spending; five states accounted for 57% of all drug spending.
$0
$40,000,000
$80,000,000
$120,000,000
$160,000,000
$110,957,891
ADAP Drug Expenditures and Top 10 States, by Drug Expenditures, June 2010
June 2010 Expenditures
Total = $146,457,975

Average Monthly Cost Per Client
1996 1997 1998 1999 2000 2001 2002 2003 2004 2005 2006 2007 2008 2009 2010
$0
$200
$400
$600
$800
$1,000
$1,200
$471
$611
$758 $757
$842 $831
$883 $902
$1,024$1,064
$991 $982$1,005 $995
$949
ADAP Average Monthly Cost Per Client, June 1996-2010
Per
Cap
ita E
xp
en
dit
ure
s

ADAP Prescriptions Filled
In June 2010, the average expenditure per prescription was $325, compared to $302 in June 2009, representing an 8% increase.
Average expenditures per prescription was significantly higher for antiretrovirals ($491) than non-antiretrovirals ($67 for “A1” OIs and $64 for all other drugs).
ADAPs filled a total of 451,148 prescriptions in June 2010, representing an increase of 8% compared to June 2009.

ADAP Drug Expenditures and Prescriptions Filled (Including Drug Purchases and Co-Payments), by Drug Category, June 2010
ARVs$133,379,390
(92%)
"A1" OIs$2,581,031
(2%)
All Other $9,211,929 (6%)
Total = $147.2 million
ARVs271,503(60%)
"A1" OIs38,418(9%)
All Other 141,327, (31%)
Total = 451,148 prescriptions filled

ADAP Drug Expenditures and Prescriptions Filled (Including Drug Purchases and Co-
Payments), June 2010
Drug Purchases$139,168,395
(95%)
Co-Payment Expenditures$7,289,580
(5%)
Total = $147.2 million
Drug Purchases Rx354,650(79%)
Co-Payment Rx96,498(21%)
Total = 451,148 prescriptions (Rx) filled
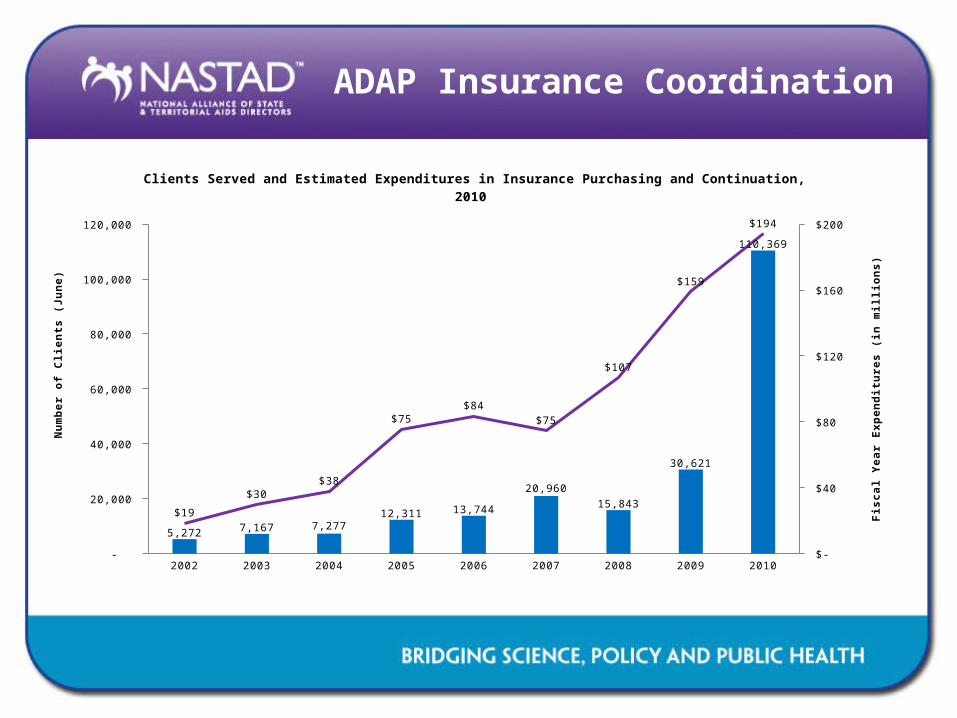
ADAP Insurance Coordination
2002 2003 2004 2005 2006 2007 2008 2009 2010 -
20,000
40,000
60,000
80,000
100,000
120,000
$-
$40
$80
$120
$160
$200
5,272 7,167 7,277 12,311 13,744
20,960 15,843
30,621
110,369
$19
$30 $38
$75 $84
$75
$107
$159
$194
Clients Served and Estimated Expenditures in Insurance Purchasing and Continuation, 2010
Nu
mb
er
of
Cli
en
ts (
Jun
e)
Fis
cal
Year
Exp
en
dit
ure
s (
in m
illi
on
s)

ADAP Insurance Coordination
In June 2010, 110,338 ADAP clients were served through insurance coordination.
Clients served through insurance coordination more than tripled since June 2009.
Spending on insurance purchasing/continuation represented an estimated $139 per capita in June 2010, about 15% of the average monthly cost per client, based on drug expenditures, in that month ($949).

ADAP Coordination with Pre-existing Condition Insurance
Plans
As of December 2010, 12 ADAPs reported having the ability to enroll clients in PCIPs.
Eleven states had 151 clients enrolled with plans to continue enrolling additional clients.
The average monthly cost per client served in a PCIP was $529 in December 2010, approximately 56% of the annual average cost per client, based on drug expenditures ($949) in that month.

ADAP Coordination with Medicare Part D
To meet the federal requirements and maintain appropriate medication coverage for their clients, 53 ADAPs have developed policies to coordinate with the Part D benefit.
ADAP Pays Part D Pre-miums
ADAP Pays Part D Deductible
ADAP Pays Part D Co-Pays Standard Beneficiary Clients Eligible for ADAP
ADAP Provides Medications During Donut Hole
23
44
3639
36
ADAP Policies Related to Medicare Part D, February 2011
Nu
mb
er
of
AD
AP
s

Twenty-six ADAPs reported signing a data sharing agreement with CMS in December 2010 (see Table 13).
Twenty-three ADAPs, including 9 who do not have a data sharing agreement with CMS, have a data sharing agreement with at least one other entity, including Medicaid, Medicare, private insurance providers, and other entities (e.g. Pharmacy Benefits Managers).
ADAP Coordination with Medicare Part D

Highlights from Module Two Supplement

ADAP Coverage of Hepatitis B Treatment, December 2010

ADAP Coverage of Hepatitis C Treatment, December 2010

ADAP Coverage of Hepatitis A and B Vaccines, December 2010

Year in Review

The “Perfect Storm”
ADAP
Minimal increases in federal appropriations
Fluctuations in state funding
Increased demand due to unemployment and
other economic challenges
Heightened national efforts on HIV testing and linkages into care
High drug costs
Revised HIV treatment guidelines

Patient Protection and Affordable Care Act
Patient Protection and Affordable Care Act (PPACA) signed into law in March 2010.
Some portions of reform that will impact ADAPs specifically are:– Medicaid eligibility expansion (2014); – Increase in the number of individuals covered by insurance plans
(2014);– ADAPs’ Medicare Part D expenditures counting toward True Out
Of Pocket (TrOOP) expenditures (2011); – Narrowing and closing of the Medicare Part D “doughnut hole
(ongoing);”– An increase in the Medicaid rebate amount for purchased drugs;
and (2010)– 340B pricing transparency.

Pharmaceutical Partners Contributions
In May 2010, pharmaceutical partners augmented current agreements with ADAPs including:– Providing deeper discounts;– Increased rebates; and/or– Price freezes to ADAP.
Pharmaceutical partners expanded the reach of Patient Assistance Programs (PAPs) and participated in Welvista for waiting list clients.
ADAP Waiting Lists
Over the course of 2010, 19 ADAPs reported a waiting list.
Several ADAPs decreased income eligibility requirements and disenrolled clients from ADAP in order to address shortfalls.
In FY2010, some ADAPs began transitioning clients off of ADAP and onto PAPs as a means of cost-containment. These clients were directed to seek access to medications through PAPs.

ADAP Waiting Lists and Cost-containment, as of May 2011

ADAP Waiting Lists, as of June 30, 2011
8,615 individuals in 13 states*Alabama: 73 individualsArkansas: 40 individualsFlorida: 3,562 individualsGeorgia: 1,630 individuals
Idaho: 20 individualsLouisiana: 824 individuals**
Montana: 29 individualsNorth Carolina: 292 individuals
Ohio: 485 individualsSouth Carolina: 810 individuals
Utah: 25 individualsVirginia: 817 individualsWyoming: 8 individuals
*As a result of ADAP emergency funding, Hawaii, Idaho, Iowa, Kentucky, South Dakota, and Utah eliminated their waiting lists; Idaho reinstituted a waiting list in February 2011 and Utah reinstituted a waiting list in May 2011.
**Louisiana has a capped enrollment on their program. This number represents their current unmet need.

ADAPs with Cost-containment, as of April 13, 2011
Arizona: reduced formularyArkansas: reduced formulary, lowered financial eligibility to 200% FPL
(disenrolled 99 clients in September 2009) Colorado: reduced formulary
Florida: reduced formulary, transitioned 5,403 clients to Welvista from February 15, 2011 to March 31, 2011
Georgia: reduced formulary, implemented medical criteria,participating in the Alternative Method Demonstration Project (AMDP)
Idaho: capped enrollmentIllinois: reduced formulary, instituted monthly expenditure cap ($2,000 per
client per month)Kentucky: reduced formulary
Louisiana: discontinued reimbursement of laboratory assaysNorth Carolina: reduced formulary

ADAPs with Cost-containment, as of April 13, 2011 (continued)
North Dakota: capped enrollment, instituted annual expenditure cap, lowered financial eligibility to 300% FPL (grandfathered in current clients
above 300%FPL) Ohio: reduced formulary, lowered financial eligibility to 300% FPL
(disenrolled 257 clients in July 2010)Puerto Rico: reduced formulary
South Carolina: lowered financial eligibility to 300% FPL (grandfathered in current clients above 300% FPL)
Utah: reduced formulary, lowered financial eligibility to 250% FPL (disenrolled 89 clients in FY2010)
Virginia: reduced formulary, transitioned 207 clients onto waiting list and PAPs, only distributing 30-day prescription refills
Washington: instituted client cost sharing, reduced formulary (for uninsured clients only), only paying insurance premiums for clients currently on
antiretroviralsWyoming: reduced formulary, instituted client cost sharing

Coordinated Strategy to Save America’s ADAPs
Secure additional resources for ADAP from the federal government:– The HIV/AIDS community is advocating for an
increase of $106 million for ADAPs for a total funding of $991 million in FY2012.
Maintain, restore and increase resources for ADAPs from state governments.
Continue agreements between ADAPs and pharmaceutical manufacturers to provide financial stability and augment existing agreements, when possible.

The Outlook for the Future
A bridge to 2014 is slowly being built and will require much construction before ADAPs can fully take advantage of health reform provisions.
Weathering the current storm to reach 2014 will take collaboration from all stakeholders involved in the administration of the program.

Questions and Answers
Resources
For an electronic copy of the 2011 National ADAP Monitoring Project Annual Report, please visit www.NASTAD.org.
For more information about the National ADAP Monitoring Project or the ADAP Crisis, please contact Britten Pund at [email protected].

Contact Information
Britten PundManager, Health Care Access
NASTADPhone: (202) 434.8044 [email protected]
www.NASTAD.org
Top Related