


Languages
Pages
Legal


Primary funding is provided by
The SPE Foundation through member donations
and a contribution from Offshore Europe
The Society is grateful to those companies that allow their
professionals to serve as lecturers
Additional support provided by AIME
Society of Petroleum Engineers
Distinguished Lecturer Programwww.spe.org/dl
1

Society of Petroleum Engineers
Distinguished Lecturer Programwww.spe.org/dl
Lawrence CAMILLERIProduction Optimization Advisor
Artificial Lift Domain Head
Production Optimisation of Conventional &
Unconventional Wells with ESP Real Time Data
2

Unconventional Well Case Studies:
• Additional case studies for unconventional wells
are not included in this slide deck, however they
can be viewed via skype upon request to the
author, who can be reached at [email protected].
• The skype session can also enable a more
detailed Q&A where required.
3

The Digital Transformation Is Growing Fast
Enablers:
▪ Declining costs of sensors and
data storage
▪ Rapid progress in advanced
analytics (e.g. machine learning)
▪ Greater connectivity of people
and devices
▪ Faster & cheaper data
transmission
4
Global Digital Oilfield Market ($bn)
Global Digital Oilfield Market 2017-2021
Technavio.com
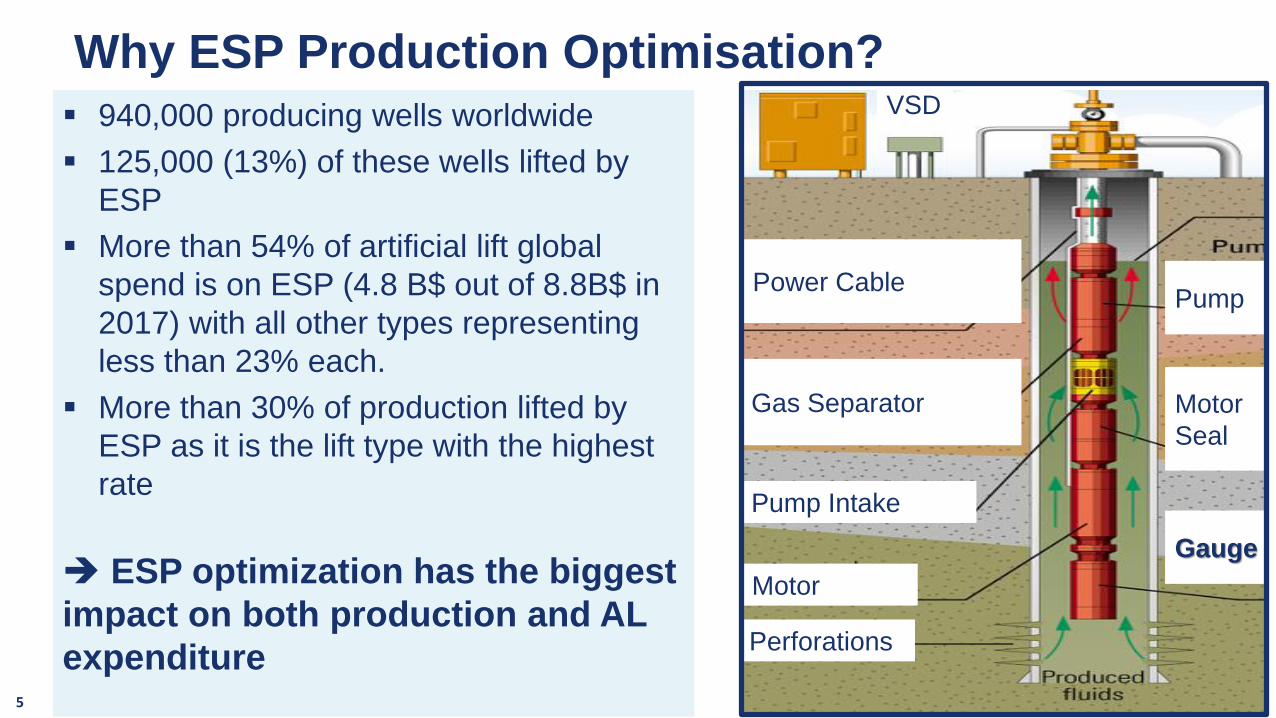
Why ESP Production Optimisation?
▪ 940,000 producing wells worldwide
▪ 125,000 (13%) of these wells lifted by
ESP
▪ More than 54% of artificial lift global
spend is on ESP (4.8 B$ out of 8.8B$ in
2017) with all other types representing
less than 23% each.
▪ More than 30% of production lifted by
ESP as it is the lift type with the highest
rate
➔ ESP optimization has the biggest
impact on both production and AL
expenditure5
Power CablePump
Gas Separator
Motor
Pump Intake
Perforations
Motor
Seal
Gauge
VSD

Operator’s View
BP Technology Outlook: 2015
RossneftSPE 112238, Real Time Optimisation Approach for 15,000 ESP Wells
BP Believes that digital technologies can deliver
• 4% Production Enhancement
• 13% Cost Savings
▪ “Calculations showed economical efficiency of system implementation on 7451 wells out of over 11,000 working ESP wells, with possible annual oil production increase of 11 million bbls.”
▪ This justified the investment of 6400 US$ per well in automation hardware i.e. Variable Speed Drive, Gauges and real time data transmission
▪ The first step is identifying the well max. potential
▪ What is the actual IPR curve? Pr and PI?
▪ What could be the PI after possible stimulation?6

7
Commonly Available ESP
Real Time Data
5- Pump Discharge Pressure
6- Pi = Intake Pressure
7- Ti = Intake Temperature
8 - Tm = Motor Temperature
4- Tubing Head Pressure
1- Frequency
2- Current
3- Voltage
1. Uptime
2. Run Life
3. Power
Consumption
4. Production
Enhancement
VALUE OBJECTIVESGeneric Concepts:
▪ Gauge metrology
▪ Data visualization
▪ Slow & Fast Loop
▪ Data to Value Chain
▪ The importance of high frequency flowrate in addition to pressure data
Agenda

ESP Gauges…mature technology
8
1. Reliability – MTBF >10 years
2. No need for instrument line ➔low cost
3. Metrology of ESP gauges
▪ Accuracy +/- 5 psi
▪ Resolution 0.1 psi
▪ Drift 5 psi / year
➔INFLOW ANALYSIS IS POSSIBLE

Data Visualisation ➔ Solution = Multiple Tracks
Challenge = Large Production Sets- 6 to 15 analogue signals per well
- 1 million points / year /signal
Solution- Separate tracks for signal groups
- User defined filtering
9
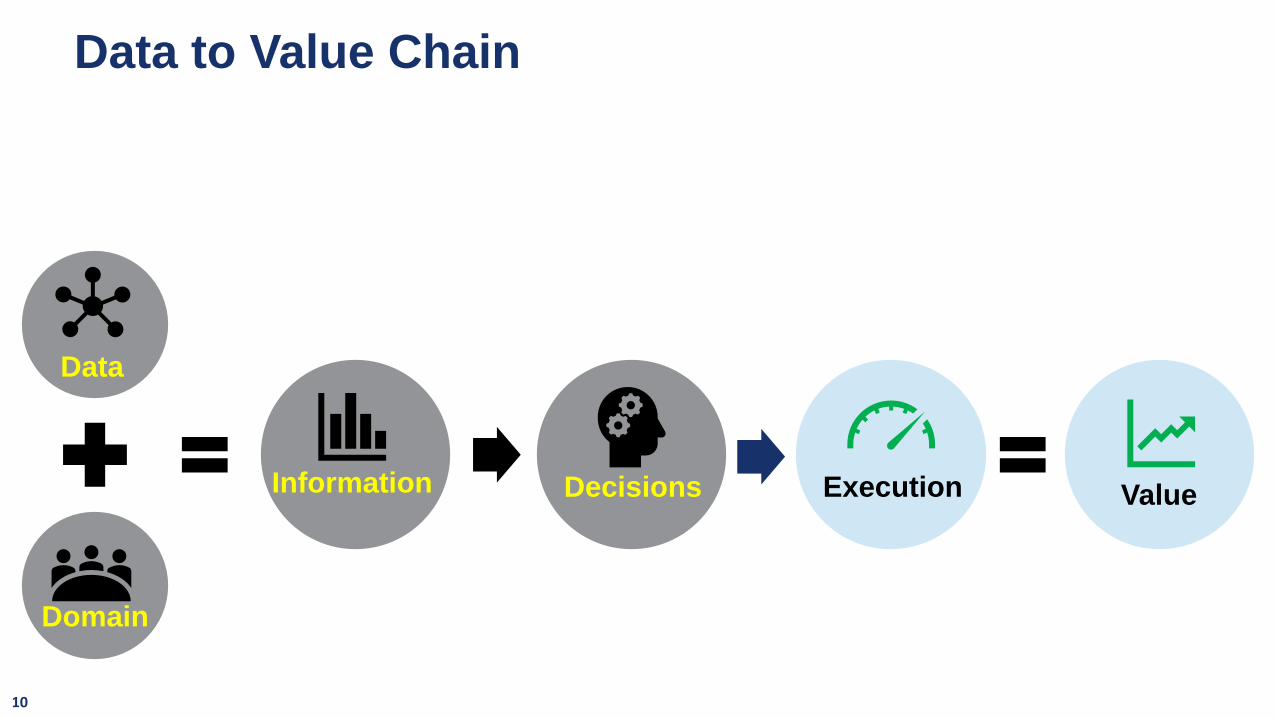
Data to Value Chain
10
Execution Value
Domain
Information Decisions
Data

How Real Time Data & Automation
11
Proactive
Execution
Maximized
Value
Automation
Data
Information Decisions
Domain
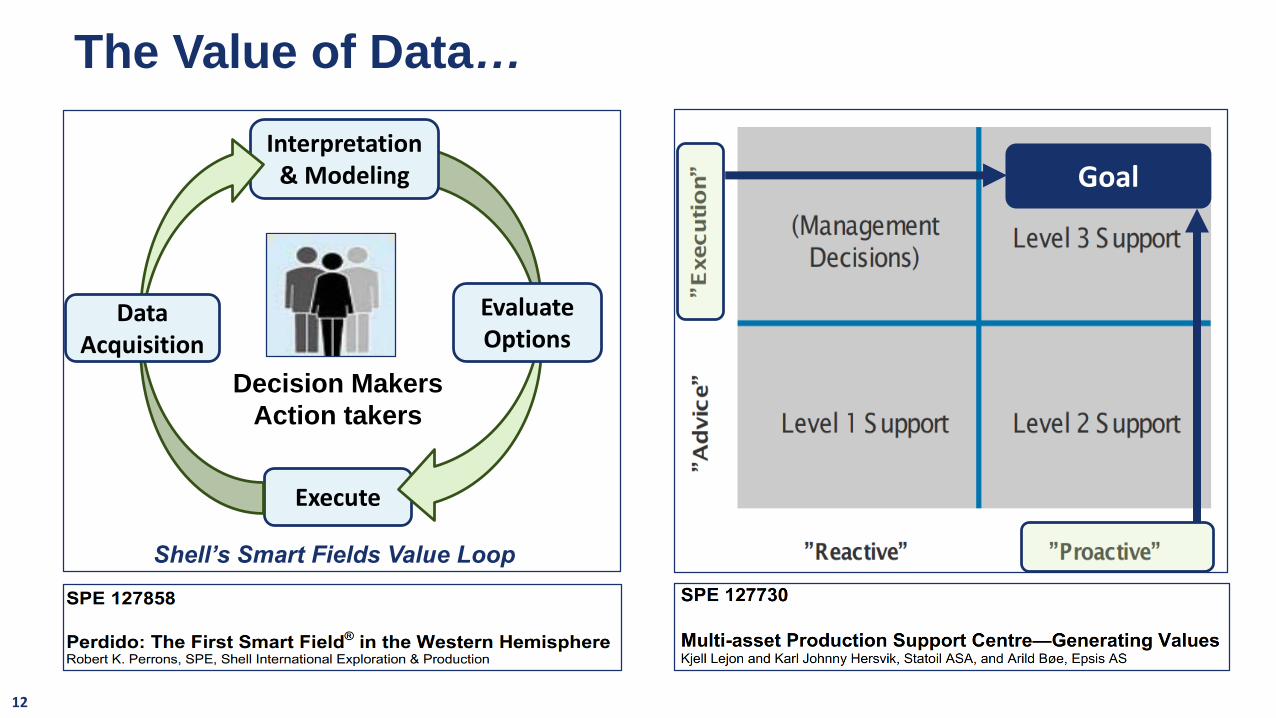
The Value of Data…
12
Goal
Execute
Interpretation & Modeling
Evaluate Options
Data Acquisition
Decision Makers
Action takers
Shell’s Smart Fields Value Loop

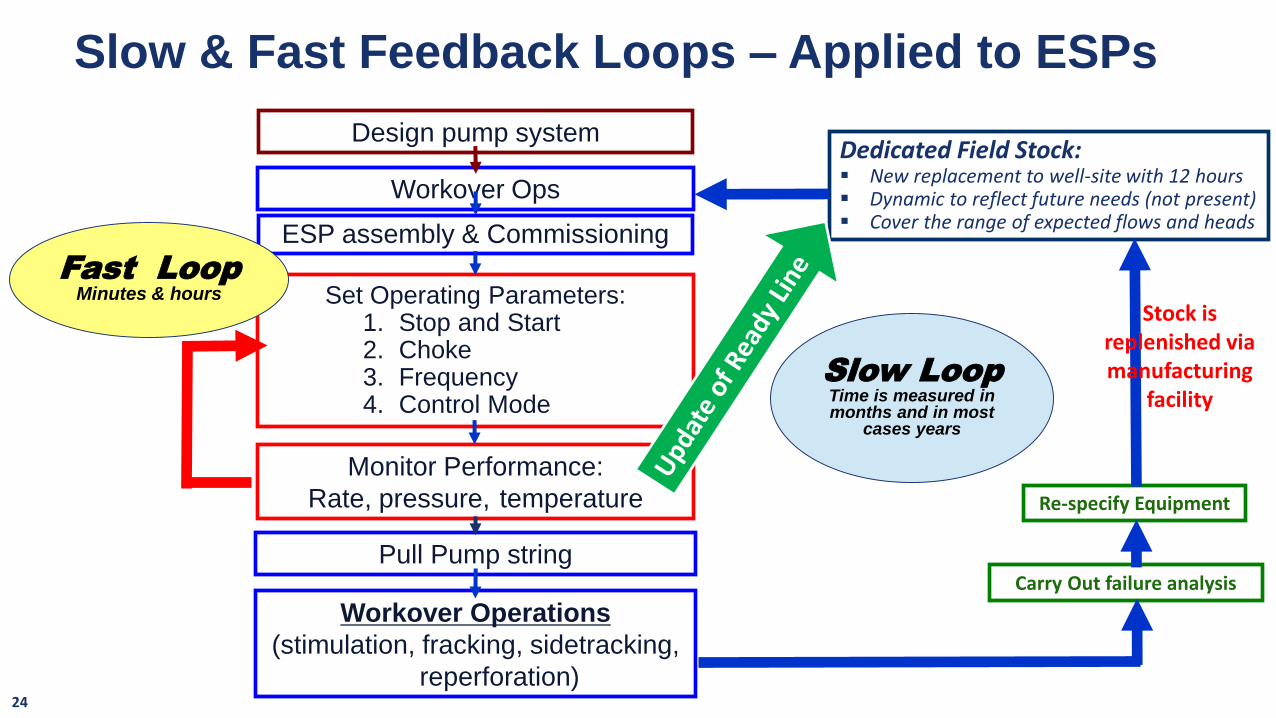
Dedicated Field Stock:▪ New replacement to well-site with 12 hours▪ Dynamic to reflect future needs (not present)▪ Cover the range of expected flows and heads
Set Operating Parameters:1. Stop and Start2. Choke3. Frequency4. Control Mode
Monitor Performance:
Rate, pressure, temperature
Workover Ops
Design pump system
Pull Pump string
Workover Operations
(stimulation, fracking, sidetracking,
reperforation)
Carry Out failure analysis
Re-specify Equipment
ESP assembly & Commissioning
Stock is replenished via manufacturing
facilitySlow LoopTime is measured in months and in most
cases years
Fast LoopMinutes & hours
Slow & Fast Feedback Loops – Applied to ESPs
13
1.Uptime
2. Run Life
3. Power
Consumption
4. Production
Enhancement
VALUE OBJECTIVES

The Main Causes of ESP Downtime
The main two causes are:
1. Facility shut-downs e.g. electrical power interruption.
2. ESP stops automatically triggered by the motor controller to
protect the ESP from misoperation, which would otherwise lead
to failure. The main types are:
– Deadheading: Usually caused by inadvertent valve closure
– Pump-Off: Loss of submergence caused by pump rate greater
than inflow potential
– Gas Lock: performance is degraded by large volumes of free
gas, which initially leads to low flowrate events.
15
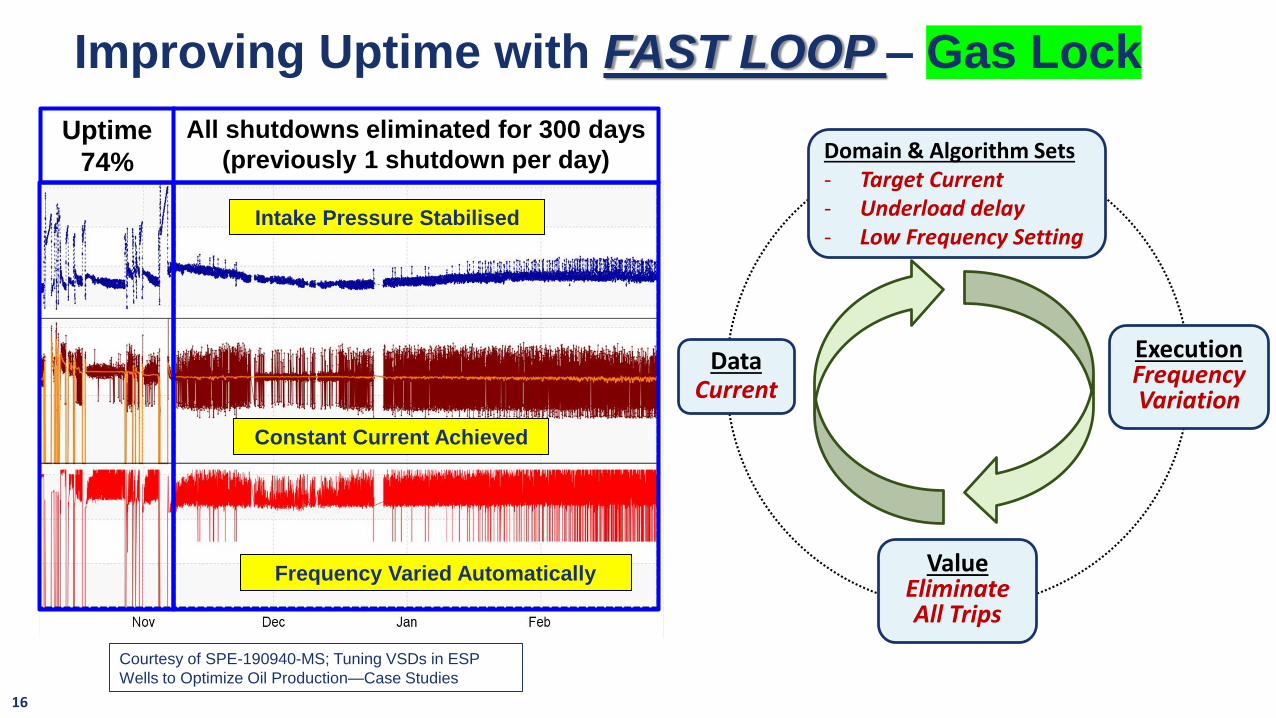
Improving Uptime with FAST LOOP – Gas Lock
16
Courtesy of SPE-190940-MS; Tuning VSDs in ESP
Wells to Optimize Oil Production—Case Studies
Frequency Varied Automatically
Constant Current Achieved
DataCurrent
Domain & Algorithm Sets- Target Current- Underload delay- Low Frequency Setting
ExecutionFrequency Variation
ValueEliminate All Trips
Uptime
74%
Intake Pressure Stabilised
All shutdowns eliminated for 300 days
(previously 1 shutdown per day)

200
400
300
500
2200
2000
1600
860
900
900
920
60
40
20
30
10
1800
We
llhe
adP
ress
.,p
sia
Fre
qu
en
cy, H
zC
urr
en
t, A
mp
sP
um
p I
nta
ke
Pre
ss.,
psi
aP
um
p D
isch
arge
Pre
ss.,
psi
aPeriod with no
flow to wellhead
Underload Trip
Setting 15 A
Current
Increasing
12:00 12:15 12:3011:4
5
Gas Lock Current = 20 A
Gas Lock Protection
18

PHI & Real Time Modelling Detecting GasFr
eq
uen
cy, H
z
4000
60
50
40
Q/Q
_BEP
PIP
& P
d, p
sia
2000
MayFeb Mar Apr June
PH
I
1.0
1.5
2.0
1.0
1.5
0.5
• When frequency is increased, there is a step decrease in discharge pressure, this is due to gas degradation
• PHI provides advanced warning of gas degradation, which is not detected by discharge pressure, which also provides an alarm as to when flowrate calculation overestimates rate
• Operating point relative to BEP has an impact on pump gas handling (SPE 163048)
• Frequency can be tuned to eliminate severe gas degradation.
• Also in constant current mode, when frequency is not “flat toping”, PHI is 1.0, thereby confirming gas degradation is quasi eliminated. When PHI is ~1.5, there is severe gas degradation
JanDecNov
0
0
Do
wn
ho
le
Pu
mp
Rat
e
• PCL pump flowrate is higher and the difference with measured rate provides a measure of gas degradation.
• PCL provides confirmation that transient downhole pump rate reaches zero rate when in gas lock mode.
Early identification of
gas degradation
Gas degradation
impact on rate
No “flat Toping” =
current target reached “flat toping” = current target
not reached = PHI = 1.5, PD
low

No “flat Toping” =
current target
reached = PHI=1.0
“flat toping” = current target not reached = PHI =
1.5
• PCL provides confirmation that transient downhole pump rate reaches zero rate when in gas lock mode.
• While this is OK occasionally to avoid a gas lock trip and motor overheating, the frequency of these events is high and causing additional stress to the ESP.

Increased Gas Degradation at Operating Point < BEP
Single Stage – Tulsa UniversityCourtesy of Gamboa, J. and Prado, M., 2012, Experimental
Study of Two-Phase Performance of an Electric-Submersible-
Pump Stage, SPE-163048-PA.
Multiple Stages – Schlumberger TestLess severe as the GVF is lower closer to discharge
of pump as gas is compressed
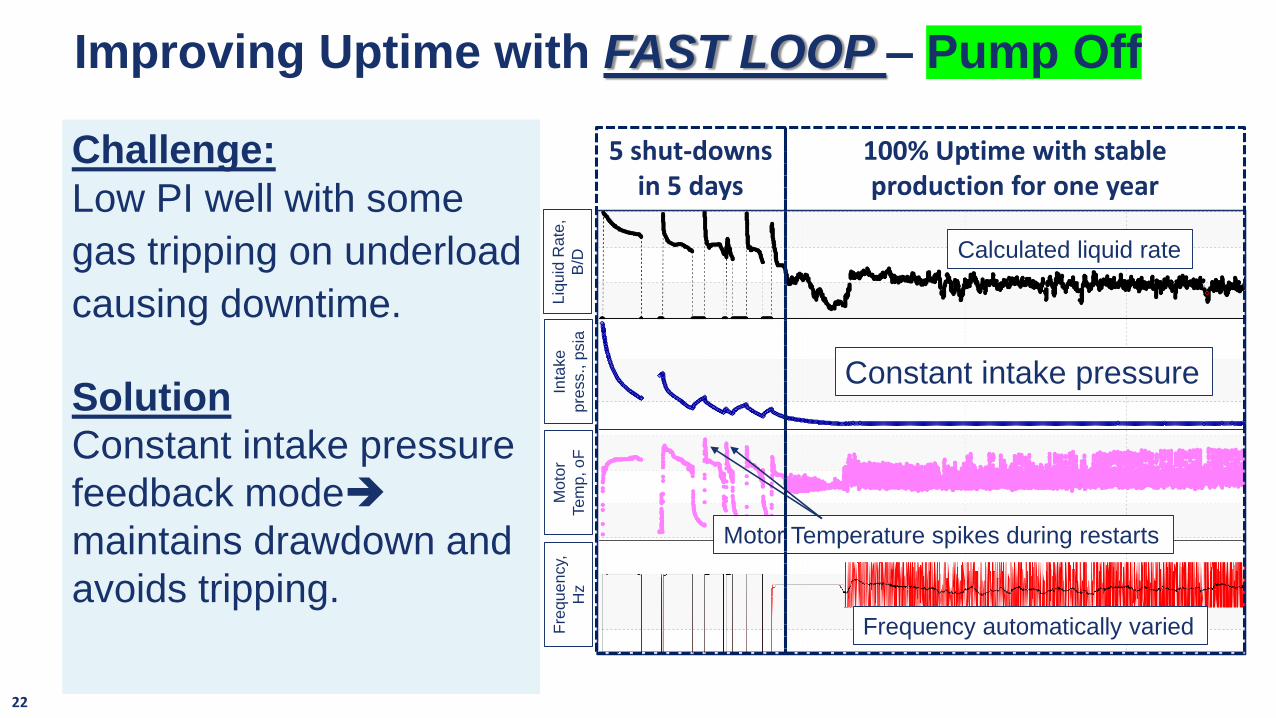
Challenge:
Low PI well with some
gas tripping on underload
causing downtime.
Solution
Constant intake pressure
feedback mode➔
maintains drawdown and
avoids tripping.
Constant intake pressure
Motor Temperature spikes during restarts
Frequency automatically varied
5 shut-downs in 5 days
Calculated liquid rate
100% Uptime with stable production for one year
Fre
qu
en
cy,
Hz
Mo
tor
Te
mp
, o
F
Inta
ke
pre
ss.,
psia
Liq
uid
Rate
,
B/D
22
Improving Uptime with FAST LOOP – Pump Off
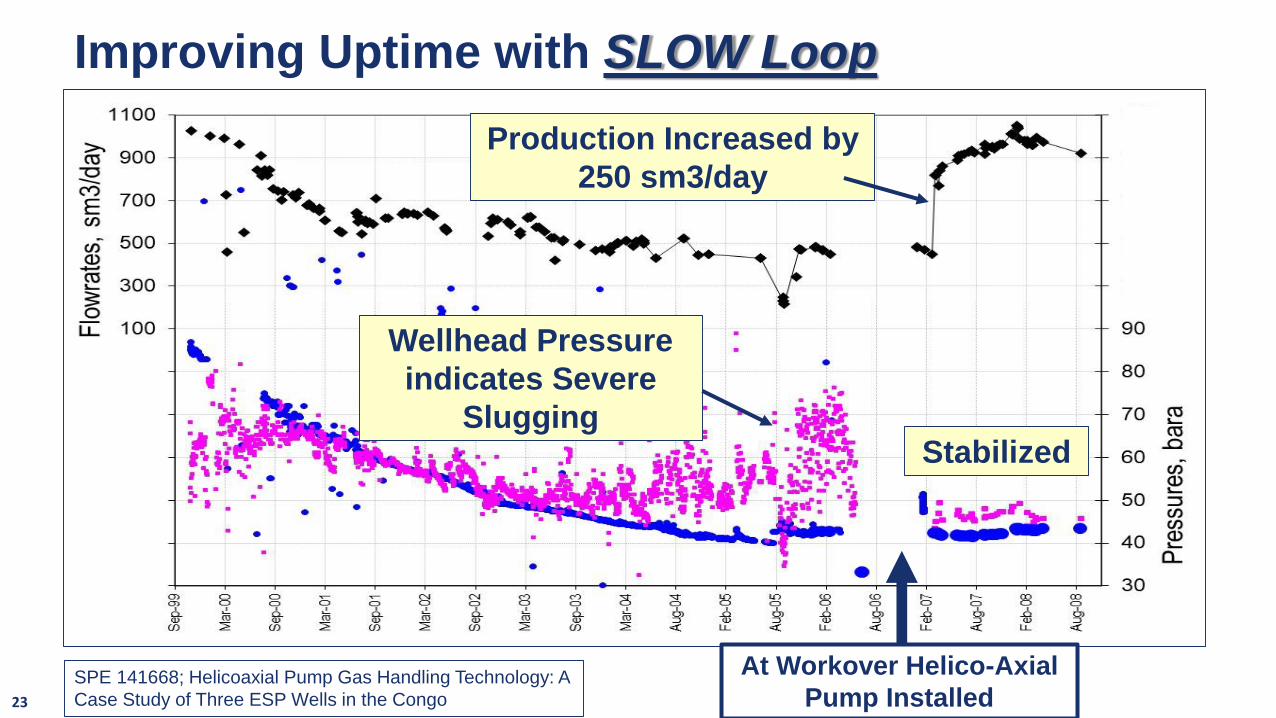
Improving Uptime with SLOW Loop
At Workover Helico-Axial
Pump Installed
Wellhead Pressure
indicates Severe
SluggingStabilized
Production Increased by
250 sm3/day
23
SPE 141668; Helicoaxial Pump Gas Handling Technology: A
Case Study of Three ESP Wells in the Congo
Dedicated Field Stock:▪ New replacement to well-site with 12 hours▪ Dynamic to reflect future needs (not present)▪ Cover the range of expected flows and heads
Set Operating Parameters:1. Stop and Start2. Choke3. Frequency4. Control Mode
Monitor Performance:
Rate, pressure, temperature
Workover Ops
Design pump system
Pull Pump string
Workover Operations
(stimulation, fracking, sidetracking,
reperforation)
Carry Out failure analysis
Re-specify Equipment
ESP assembly & Commissioning
Stock is replenished via manufacturing
facilitySlow LoopTime is measured in months and in most
cases years
Fast LoopMinutes & hours
Slow & Fast Feedback Loops – Applied to ESPs
24

1. Uptime
2.Run Life
3. Power
Consumption
4. Production
Enhancement
VALUE OBJECTIVES

Measure, Classify and Record….➔ Slow Loop
❑ Run life improvement
requires continuous
monitoring and failure
analysis in the slow loop i.e.
years as opposed to minutes
❑ “Classification” is a key
enabler
❑ This principle can also be
applied to:
▪ Uptime Improvement
▪ Power Optimisation
▪ Production Enhancement
26
Slow Loop
“Implementation of a comprehensivemonitoring and failure investigation systemwas essential in the optimization of NorthKaybob ESP Performance” SPE 19379 – ESP
Improving Run Lives in the North Kaybob BHL Unit No 1, by C.G.Bowen and R.J Kennedy, Chevron Canada Resources.
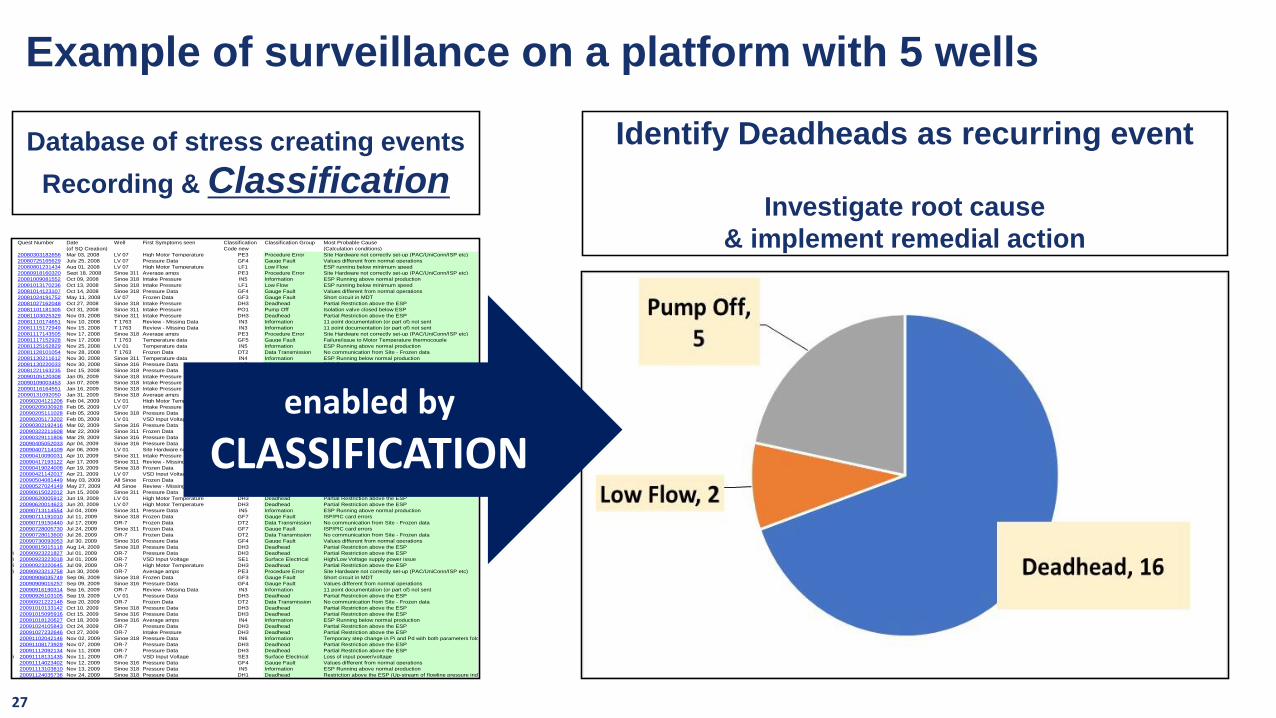
Example of surveillance on a platform with 5 wells
Originator Quest Number Date
(of SQ Creation)
Well First Symptoms seen Classification
Code new
Classification Group Most Probable Cause
(Calculation conditions)
Paul McKay 20080303182656 Mar 03, 2008 LV 07 High Motor Temperature PE3 Procedure Error Site Hardware not correctly set-up (PAC/UniConn/ISP etc)
Leila Hamza 20080725165629 July 25, 2008 LV 07 Pressure Data GF4 Gauge Fault Values different from normal operations
Paul McKay 20080801231434 Aug 01, 2008 LV 07 High Motor Temperature LF1 Low Flow ESP running below minimum speed
Keith Rennie 20080918160320 Sept 18, 2008 Sinoe 311 Average amps PE3 Procedure Error Site Hardware not correctly set-up (PAC/UniConn/ISP etc)
Paul McKay 20081009081552 Oct 09, 2008 Sinoe 318 Intake Pressure IN5 Information ESP Running above normal production
Paul McKay 20081013170236 Oct 13, 2008 Sinoe 318 Intake Pressure LF1 Low Flow ESP running below minimum speed
Keith Rennie 20081014123107 Oct 14, 2008 Sinoe 318 Pressure Data GF4 Gauge Fault Values different from normal operations
John MacDonald 20081024191752 May 11, 2008 LV 07 Frozen Data GF3 Gauge Fault Short circuit in MDT
Stewart McIntosh 20081027162048 Oct 27, 2008 Sinoe 318 Intake Pressure DH3 Deadhead Partial Restriction above the ESP
Austin Mordi 20081101181305 Oct 31, 2008 Sinoe 311 Intake Pressure PO1 Pump Off Isolation valve closed below ESP
Keith Rennie 20081103025329 Nov 03, 2008 Sinoe 311 Intake Pressure DH3 Deadhead Partial Restriction above the ESP
Stewart McIntosh 20081110174651 Nov 10, 2008 T 1763 Review - Missing Data IN3 Information 11 point documentation (or part of) not sent
Keith Rennie 20081115172949 Nov 15, 2008 T 1763 Review - Missing Data IN3 Information 11 point documentation (or part of) not sent
Zi Qi Lian 20081117143505 Nov 17, 2008 Sinoe 318 Average amps PE3 Procedure Error Site Hardware not correctly set-up (PAC/UniConn/ISP etc)
Zi Qi Lian 20081117152928 Nov 17, 2008 T 1763 Temperature data GF5 Gauge Fault Failure/issue to Motor Temperature thermocouple
Zi Qi Lian 20081125162829 Nov 25, 2008 LV 01 Temperature data IN5 Information ESP Running above normal production
Zi Qi Lian 20081128101054 Nov 28, 2008 T 1763 Frozen Data DT2 Data Transmission No communication from Site - Frozen data
Keith Rennie 20081130211612 Nov 30, 2008 Sinoe 311 Temperature data IN4 Information ESP Running below normal production
Keith Rennie 20081130220033 Nov 30, 2008 Sinoe 316 Pressure Data IN5 Information ESP Running above normal production
Zi Qi Lian 20081221163235 Dec 15, 2008 Sinoe 318 Pressure Data PE1 Procedure Error Client operators not following recognized procedures
John MacDonald 20090105120308 Jan 05, 2009 Sinoe 318 Intake Pressure PE1 Procedure Error Client operators not following recognized procedures
Austin Mordi 20090109003453 Jan 07, 2009 Sinoe 318 Intake Pressure DH3 Deadhead Partial Restriction above the ESP
Stewart McIntosh 20090116164551 Jan 16, 2009 Sinoe 318 Intake Pressure IN4 Information ESP Running below normal production
Paul McKay 20090131092050 Jan 31, 2009 Sinoe 318 Average amps SE1 Surface Electrical High/Low Voltage supply power issue
Keith Rennie 20090204121206 Feb 04, 2009 LV 01 High Motor Temperature PO1 Pump Off Isolation valve closed below ESP
Austin Mordi 20090205030928 Feb 05, 2009 LV 07 Intake Pressure PO1 Pump Off Isolation valve closed below ESP
Keith Rennie 20090205111028 Feb 05, 2009 Sinoe 318 Pressure Data PO1 Pump Off Isolation valve closed below ESP
Keith Rennie 20090205173202 Feb 05, 2009 LV 01 VSD Input Voltage SE1 Surface Electrical High/Low Voltage supply power issue
Austin Mordi 20090302192416 Mar 02, 2009 Sinoe 316 Pressure Data IN4 Information ESP Running below normal production
Paul McKay 20090322211608 Mar 22, 2009 Sinoe 311 Frozen Data GF2 Gauge Fault Short Circuit above MDT
Austin Mordi 20090329111806 Mar 29, 2009 Sinoe 316 Pressure Data IN4 Information ESP Running below normal production
Stewart McIntosh 20090405052033 Apr 04, 2009 Sinoe 316 Pressure Data GF7 Gauge Fault ISP/PIC card errors
Zi Qi Lian 20090407114109 Apr 06, 2009 LV 01 Site Hardware not configured PE3 Procedure Error Site Hardware not correctly set-up (PAC/UniConn/ISP etc)
Keith Rennie 20090410090031 Apr 10, 2009 Sinoe 311 Intake Pressure PO2 Pump Off Reduction to Inflow (PI dropping)
Paul McKay 20090417193122 Apr 17, 2009 Sinoe 311 Review - Missing Data IN3 Information 11 point documentation (or part of) not sent
Paul McKay 20090419024008 Apr 19, 2009 Sinoe 318 Frozen Data GF3 Gauge Fault Short circuit in MDT
Zi Qi Lian 20090421142017 Apr 21, 2009 LV 07 VSD Input Voltage SE1 Surface Electrical High/Low Voltage supply power issue
Paul McKay 20090504081449 May 03, 2009 All Sinoe Frozen Data DT2 Data Transmission No communication from Site - Frozen data
Stewart McIntosh 20090527024149 May 27, 2009 All Sinoe Review - Missing Data IN3 Information 11 point documentation (or part of) not sent
Paul McKay 20090615022012 Jun 15, 2009 Sinoe 311 Pressure Data IN4 Information ESP Running below normal production
Keith Rennie 20090620005912 Jun 19, 2009 LV 01 High Motor Temperature DH3 Deadhead Partial Restriction above the ESP
Keith Rennie 20090620014623 Jun 20, 2009 LV 07 High Motor Temperature DH3 Deadhead Partial Restriction above the ESP
Stewart McIntosh 20090713114554 Jul 04, 2009 Sinoe 311 Pressure Data IN5 Information ESP Running above normal production
Paul McKay 20090711191010 Jul 11, 2009 Sinoe 318 Frozen Data GF7 Gauge Fault ISP/PIC card errors
Madjiid Remita 20090719150440 Jul 17, 2009 OR-7 Frozen Data DT2 Data Transmission No communication from Site - Frozen data
Stewart McIntosh 20090728005730 Jul 24, 2009 Sinoe 311 Frozen Data GF7 Gauge Fault ISP/PIC card errors
Stewart McIntosh 20090728013600 Jul 26, 2009 OR-7 Frozen Data DT2 Data Transmission No communication from Site - Frozen data
Keith Rennie 20090730093053 Jul 30, 2009 Sinoe 316 Pressure Data GF4 Gauge Fault Values different from normal operations
Keith Rennie 20090815015118 Aug 14, 2009 Sinoe 318 Pressure Data DH3 Deadhead Partial Restriction above the ESP
Lawrence Camilleri 20090923221827 Jul 01, 2009 OR-7 Pressure Data DH3 Deadhead Partial Restriction above the ESP
Lawrence Camilleri 20090923223018 Jul 01, 2009 OR-7 VSD Input Voltage SE1 Surface Electrical High/Low Voltage supply power issue
Lawrence Camilleri 20090923220645 Jul 09, 2009 OR-7 High Motor Temperature DH3 Deadhead Partial Restriction above the ESP
Lawrence Camilleri 20090923213758 Jun 30, 2009 OR-7 Average amps PE3 Procedure Error Site Hardware not correctly set-up (PAC/UniConn/ISP etc)
Paul McKay 20090906035749 Sep 06, 2009 Sinoe 318 Frozen Data GF3 Gauge Fault Short circuit in MDT
Keith Rennie 20090909015257 Sep 09, 2009 Sinoe 316 Pressure Data GF4 Gauge Fault Values different from normal operations
Stewart McIntosh 20090916190314 Sep 16, 2009 OR-7 Review - Missing Data IN3 Information 11 point documentation (or part of) not sent
Keith Rennie 20090926103105 Sep 19, 2009 LV 01 Pressure Data DH3 Deadhead Partial Restriction above the ESP
Stewart McIntosh 20090921222148 Sep 20, 2009 OR-7 Frozen Data DT2 Data Transmission No communication from Site - Frozen data
Elshan Hasanov 20091010133142 Oct 10, 2009 Sinoe 318 Pressure Data DH3 Deadhead Partial Restriction above the ESP
Paul McKay 20091015095916 Oct 15, 2009 Sinoe 316 Pressure Data DH3 Deadhead Partial Restriction above the ESP
Paul McKay 20091018120627 Oct 18, 2009 Sinoe 316 Average amps IN4 Information ESP Running below normal production
Keith Rennie 20091024105843 Oct 24, 2009 OR-7 Pressure Data DH3 Deadhead Partial Restriction above the ESP
Paul McKay 20091027232646 Oct 27, 2009 OR-7 Intake Pressure DH3 Deadhead Partial Restriction above the ESP
Paul McKay 20091102042146 Nov 02, 2009 Sinoe 318 Pressure Data IN6 Information Temporary step change in Pi and Pd with both parameters folowing the same trend (typical of change in surface process)
Ricky Rae 20091108173929 Nov 07, 2009 OR-7 Pressure Data DH3 Deadhead Partial Restriction above the ESP
Paul McKay 20091112092134 Nov 11, 2009 OR-7 Pressure Data DH3 Deadhead Partial Restriction above the ESP
Lawrence Camilleri 20091118131435 Nov 11, 2009 OR-7 VSD Input Voltage SE3 Surface Electrical Loss of input power/voltage
Stewart McIntosh 20091114023402 Nov 12, 2009 Sinoe 316 Pressure Data GF4 Gauge Fault Values different from normal operations
Paul McKay 20091113103810 Nov 13, 2009 Sinoe 318 Pressure Data IN5 Information ESP Running above normal production
Keith Rennie 20091124035736 Nov 24, 2009 Sinoe 318 Pressure Data DH1 Deadhead Restriction above the ESP (Up-stream of flowline pressure indicator)
Database of stress creating events
Recording & Classification
27
Identify Deadheads as recurring event
Investigate root cause
& implement remedial action
enabled by
CLASSIFICATION

Run-Life Improvement powered by data
29
FAST LOOP; Infant Mortality
Half Year Survivability Improved
from 78% to 85%
SLOW LOOP;
Five-year Survivability
Improved from 15% to 30%
SPE 134702 - How 24/7 Real-
Time Surveillance Increases
ESP Run Life and Uptime
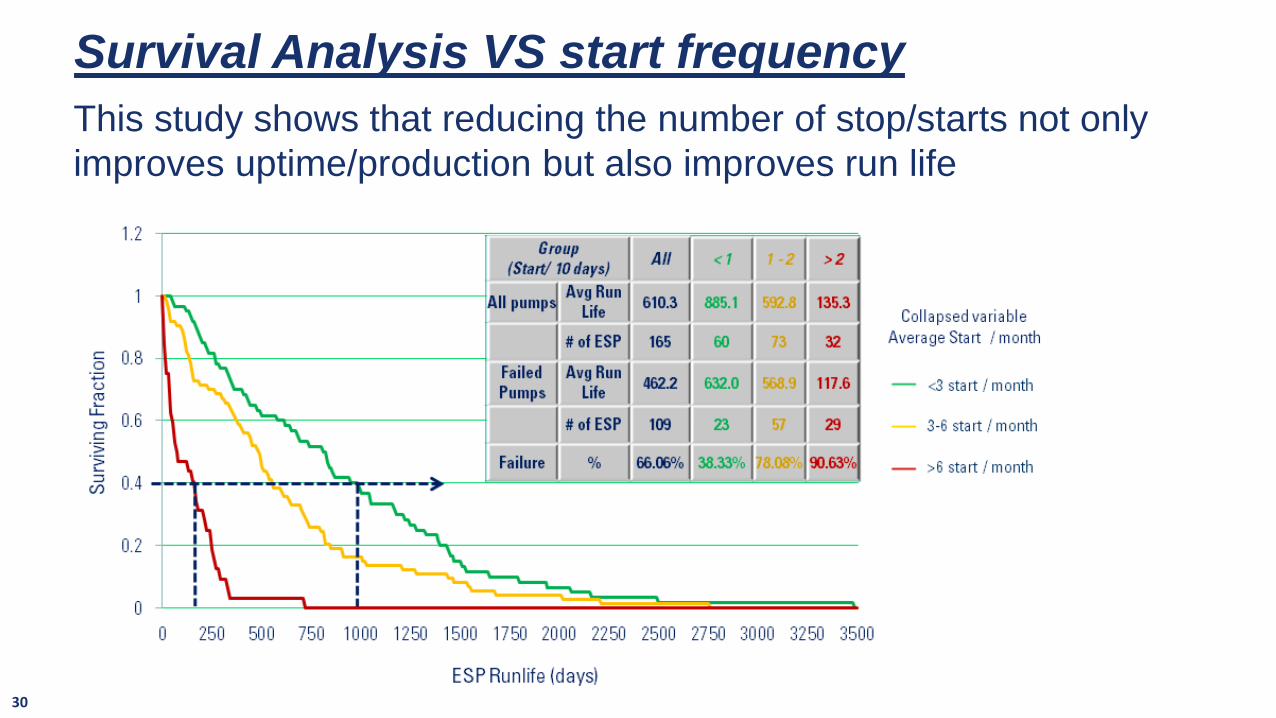
Survival Analysis VS start frequency
10/18/2019 Fabien PEYRAMALE
This study shows that reducing the number of stop/starts not only
improves uptime/production but also improves run life
30
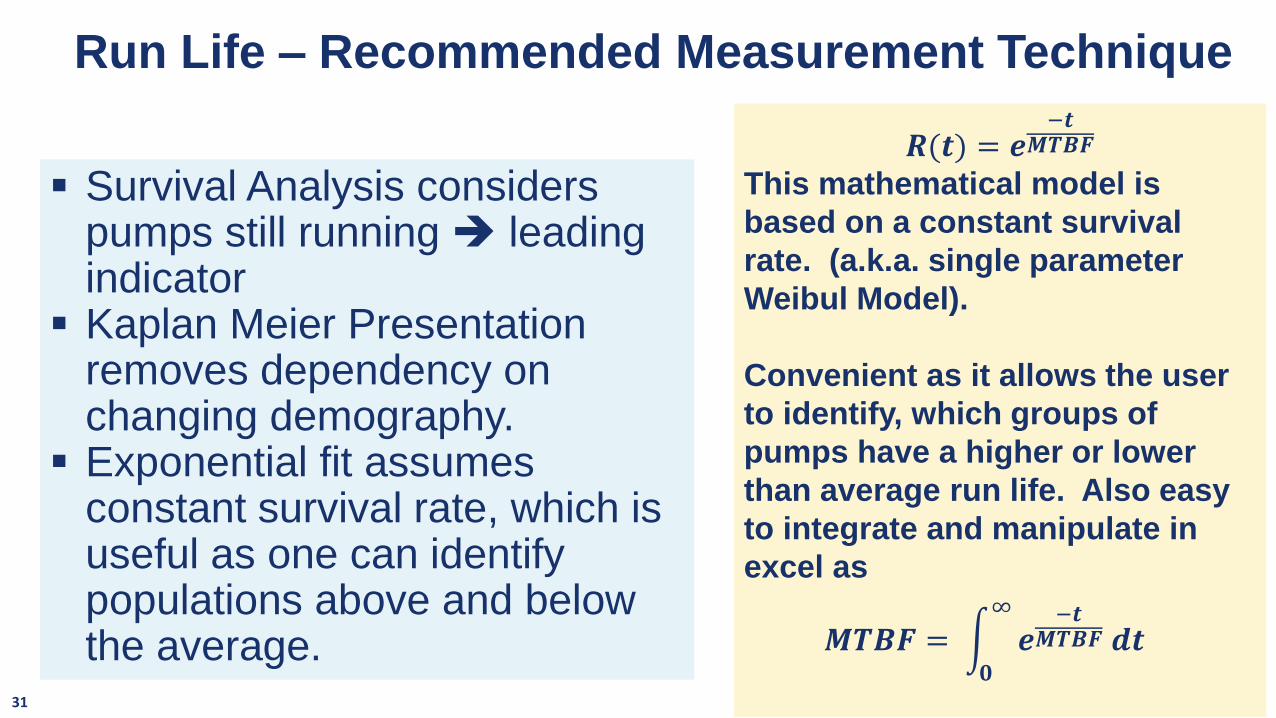
Run Life – Recommended Measurement Technique
▪ Survival Analysis considers pumps still running ➔ leading indicator
▪ Kaplan Meier Presentation removes dependency on changing demography.
▪ Exponential fit assumes constant survival rate, which is useful as one can identify populations above and below the average.
31
𝑹(𝒕) = 𝒆−𝒕
𝑴𝑻𝑩𝑭
This mathematical model is
based on a constant survival
rate. (a.k.a. single parameter
Weibul Model).
Convenient as it allows the user
to identify, which groups of
pumps have a higher or lower
than average run life. Also easy
to integrate and manipulate in
excel as
𝑴𝑻𝑩𝑭 = න𝟎
∞
𝒆−𝒕
𝑴𝑻𝑩𝑭 𝒅𝒕

Illustration of Shape factor “b”
• All these survival curves
have the same MTBF,
chosen arbitrarily as 8
years to illustrate the shape
factor concept.
• Low shape factor will have
increased infant mortality.
• High shape factor will have
reduced infant mortality.
R(t) = 𝒆−𝒕
𝒂
𝒃
If it is not possible to model using a classic
exponential function which assumes a constant failure
rate. A shape factor is required (=b), which is also
known as a 2 parameter Weibull function.

Types of Analysis that can be performed
Time Lapsed Analysis shows improvement in MTBF
Courtesy of SPE Paper 134702
❑ Single Section Motor in Low
Temperature (~50 to 75 oC) –
MTBF = 4.9 years
❑ All Wells – MTBF = 3.2 years
❑ Tandem Section Motor in Higher
BHT (~100 oC) – MTBF = 2.4
years
Comparing Population Types; Here we prove that
temperature impacts average run life but has a reduced
effect on infant mortality
• Time lapsed to monitor evolution of run life
• Comparing population sub-sets to identify cause of reduced overall run life
33

1. Uptime
2. Run Life
3.Power
Consumption
4. Production
Enhancement
VALUE OBJECTIVES

Power Optimisation ➔ Minimise PF x EFF
Voltage 100%(Voltage Range from 0.7 to 1.2
of nominal)
746
3PFIVPower
=
EFF
V Voltage
I Current
PF Power Factor
EFF Efficiency
The power equation shows that
for a given pump load, when the
(PFxEFF) is maximized, the
current is minimized.➔ Minimise Power consumption
➔ Minimise Motor Temperature, which
maximises run life
This is achieved by controlling
voltage35

01
-May
02
-May
03
-May
04
-May
05
-May
Reduction in voltage:
▪ 38% power saving
(156 KVA vs 248 KVA)
▪ Run Life Increase
• Motor Temperature
reduction
• Motor Voltage
reduction
Achieved without any loss
in production
ESP Power Optimisation ➔ Double Benefit
36
Current Reduced by 14 A
Motor Temperature
Reduced by 10 F
Constant Production rate
Voltage Reduced by 250 V
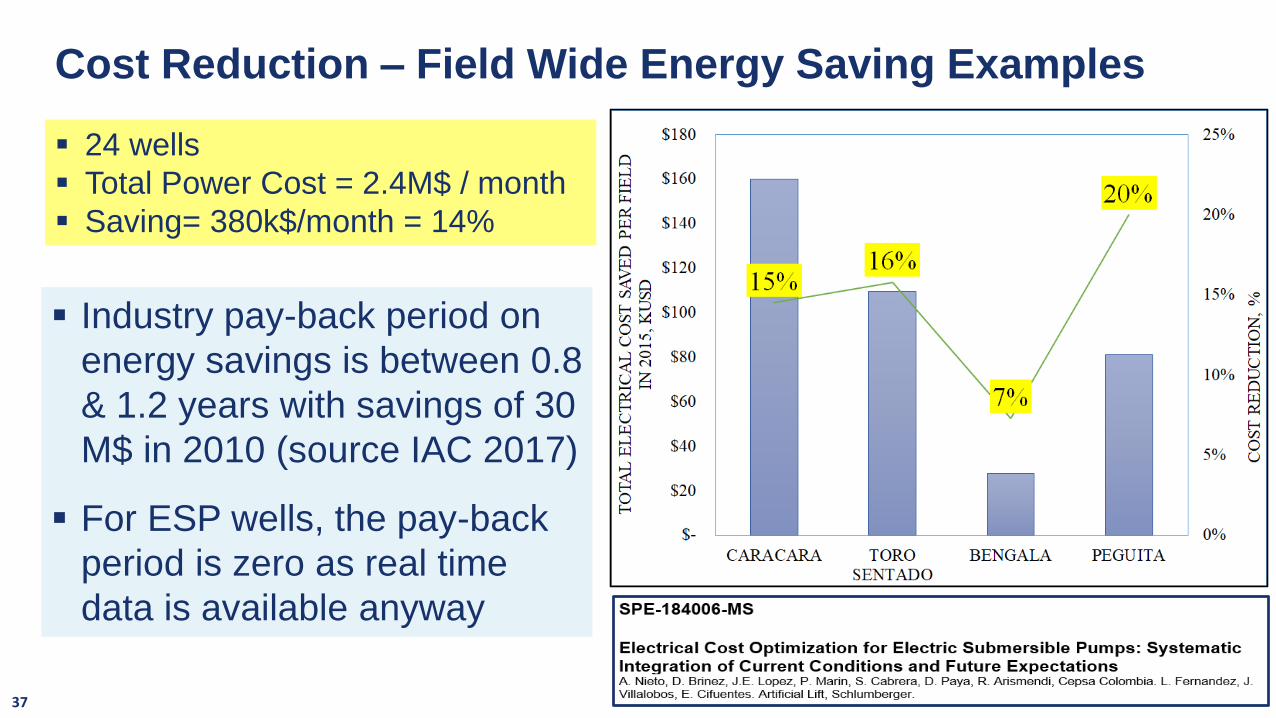
Cost Reduction – Field Wide Energy Saving Examples
▪ Industry pay-back period on
energy savings is between 0.8
& 1.2 years with savings of 30
M$ in 2010 (source IAC 2017)
▪ For ESP wells, the pay-back
period is zero as real time
data is available anyway
37
▪ 24 wells
▪ Total Power Cost = 2.4M$ / month
▪ Saving= 380k$/month = 14%
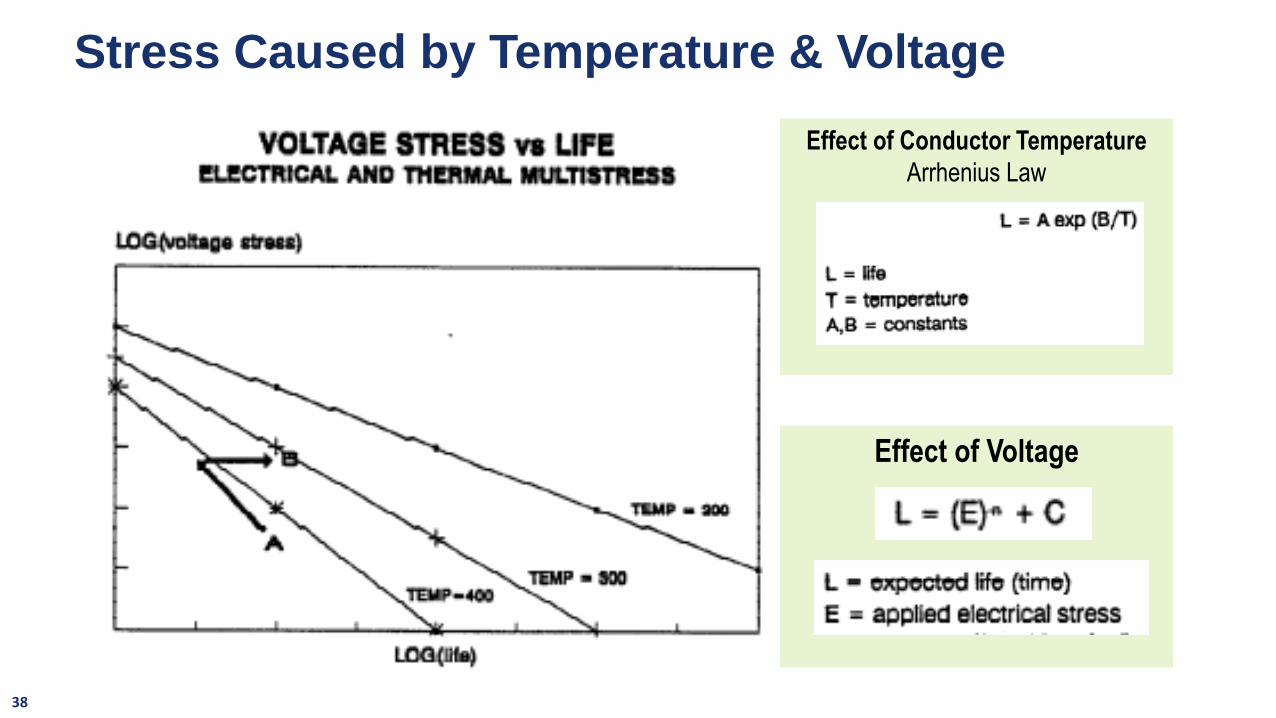
Stress Caused by Temperature & Voltage
Effect of Conductor Temperature
Arrhenius Law
Effect of Voltage
38

1. Uptime
2. Run Life
3. Power
Consumption
4.Production
Enhancement
VALUE OBJECTIVES

The Value of High Frequency Flowrate & Pressure
Without Build-ups
Liquid Rate
Pressure
Downhole Measurement with:- High Frequency- High Resolution- High Repeatability
IPR
on the fly
Reserves &
Drainage
area
evolution
Reservoir
Flow regime
(e.g.
Fractures)
Skin and
depletion
evolution
PTA in
drawdown
Fast Loop Slow Loop40

Flowrate trends….
Liquid rate from test separator
Frequency 1/month
Accuracy ±5%
Resolution ?
Repeatability Poor
Discernible Trend
NO
▪High frequency▪High resolution▪High repeatability
Discernible Trend
Accuracy not
required for a trend
41
Test SeparatorLiquid rate from test separator
Calculated using real time data
Frequency 1/month 1/min
Accuracy ±5% same
Resolution ? <100 bbl/d
Repeatability Poor HIGH
Discernible Trend
NO YES
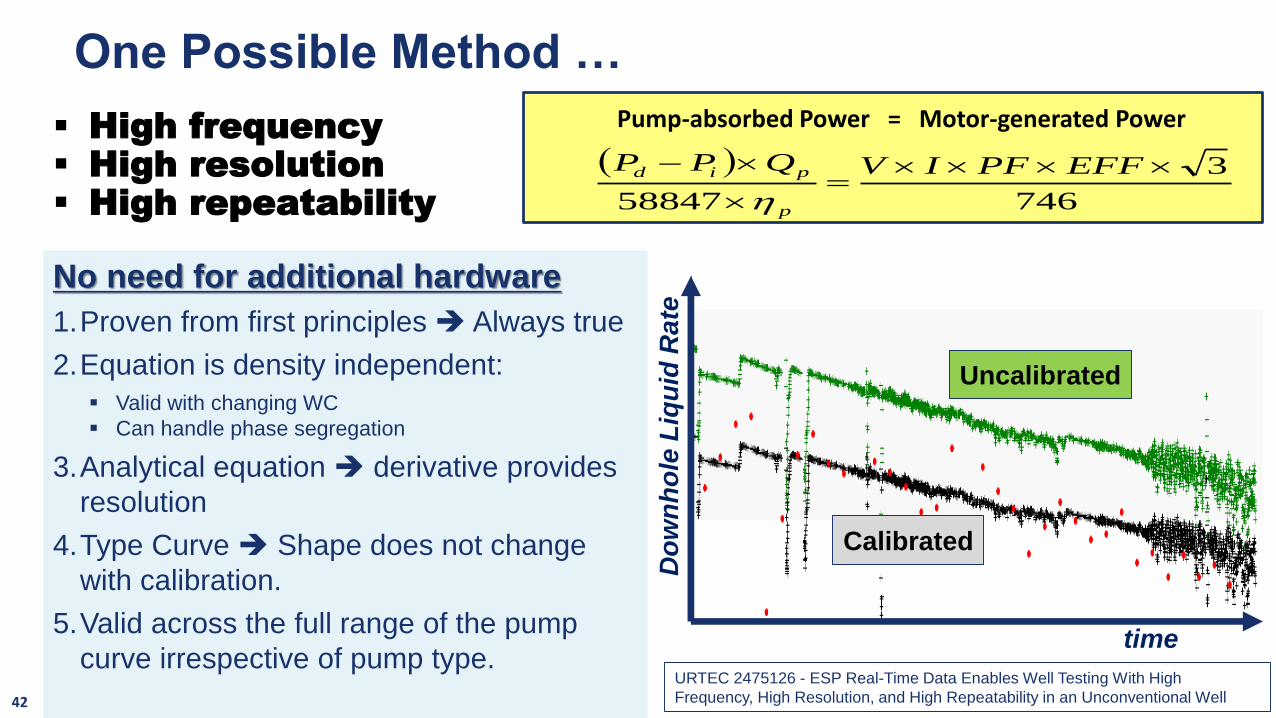
No need for additional hardware
1.Proven from first principles ➔ Always true
2.Equation is density independent:
▪ Valid with changing WC
▪ Can handle phase segregation
3.Analytical equation ➔ derivative provides
resolution
4.Type Curve ➔ Shape does not change
with calibration.
5.Valid across the full range of the pump
curve irrespective of pump type.
42
Do
wn
ho
le L
iqu
id R
ate
Uncalibrated
Calibrated
time
One Possible Method …
URTEC 2475126 - ESP Real-Time Data Enables Well Testing With High
Frequency, High Resolution, and High Repeatability in an Unconventional Well
( )
746
3
58847
=
− EFFPFIVQPP
p
pid
Pump-absorbed Power = Motor-generated Power▪ High frequency▪ High resolution▪ High repeatability
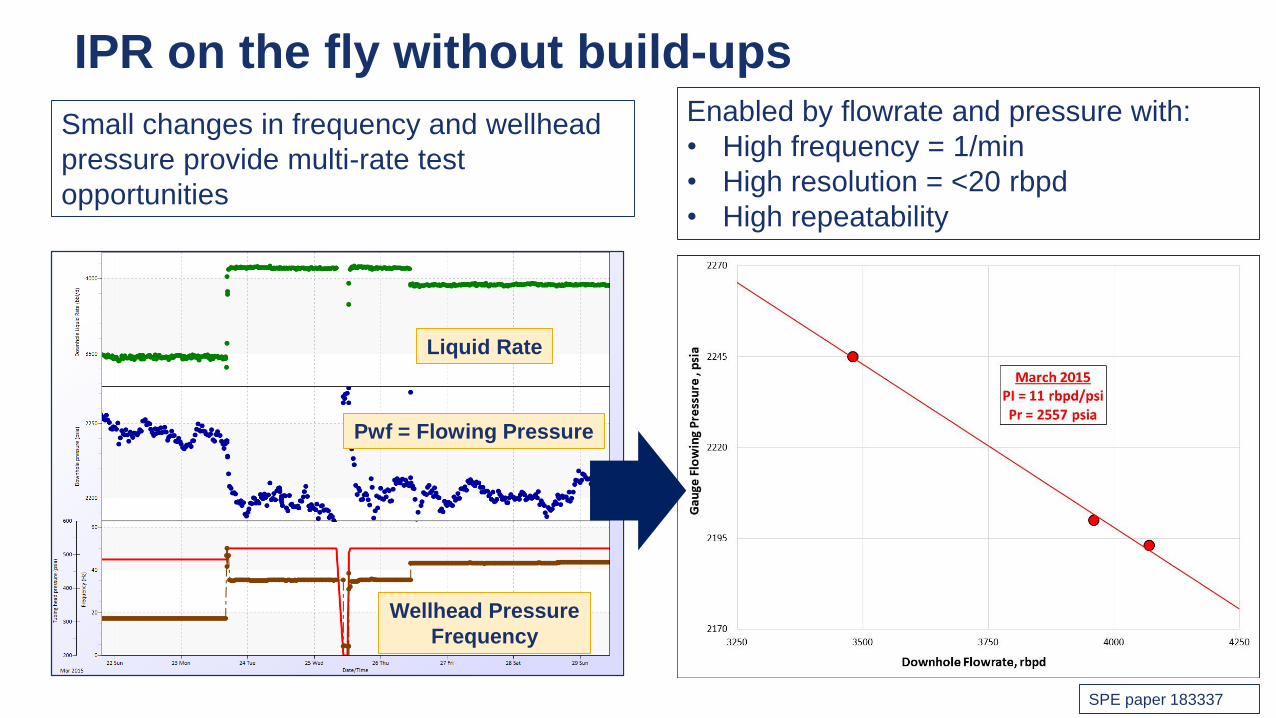
IPR on the fly without build-ups
Liquid Rate
Pwf = Flowing Pressure
Wellhead Pressure
Frequency
Enabled by flowrate and pressure with:
• High frequency = 1/min
• High resolution = <20 rbpd
• High repeatability
SPE paper 183337
Small changes in frequency and wellhead
pressure provide multi-rate test
opportunities

IPR Measurement on the fly
March 2015 May 2016
TIME LAPSED ANALYSIS1. PI increase ➔ no skin increase
2. Depletion is circa 145 psi over this
14 month period using SIP
technique
Liquid Rate
Pwf = Flowing Pressure
Wellhead Pressure
Frequency
44 SPE paper 183337

PTA (Pressure Transient Analysis) in drawdown ▪ Problem Statement:
– PTA has a huge value for skin and boundary characterization, however traditionally requires build-ups due to lack of downhole transient rate.
– However build-ups are associated with production deferment.– Also build-ups are rarely long enough to see boundaries.
▪ The challenge: Drawdown PTA is mathematically equivalent to build-ups, however presents the following challenges:– Requires transient flowrate– High resolution ESP gauges ➔ Noisy derivative– Slugging wells
▪ The Solution: – Virtual flowmetering can provide downhole flowrate with high frequency and resolution– As flowrate is measured at the same point as pressure, there is no time lag between flow
and pressure measurements.– Superposition time is enabled and provides natural smoothing– Drawdown means that one can wait to see boundary conditions.
45

A common Problem
Derivative is too noisy in drawdown to identify IARF
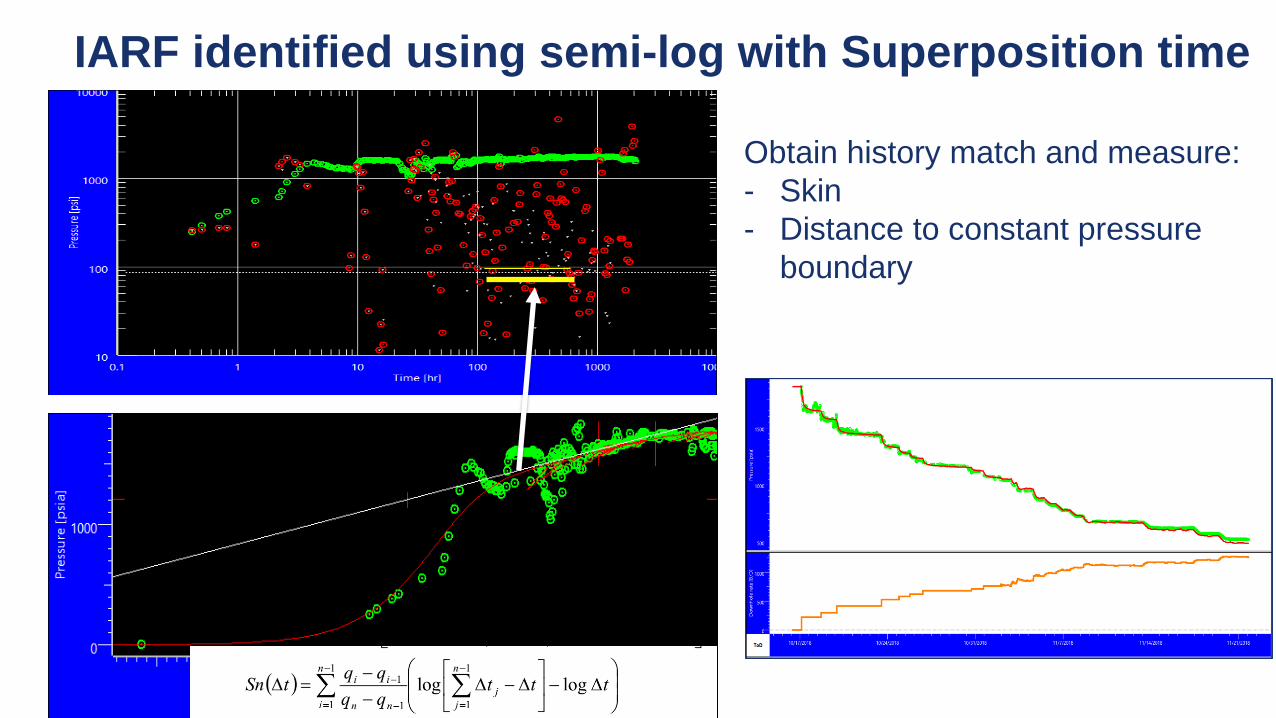
IARF identified using semi-log with Superposition time
Obtain history match and measure:
- Skin
- Distance to constant pressure
boundary
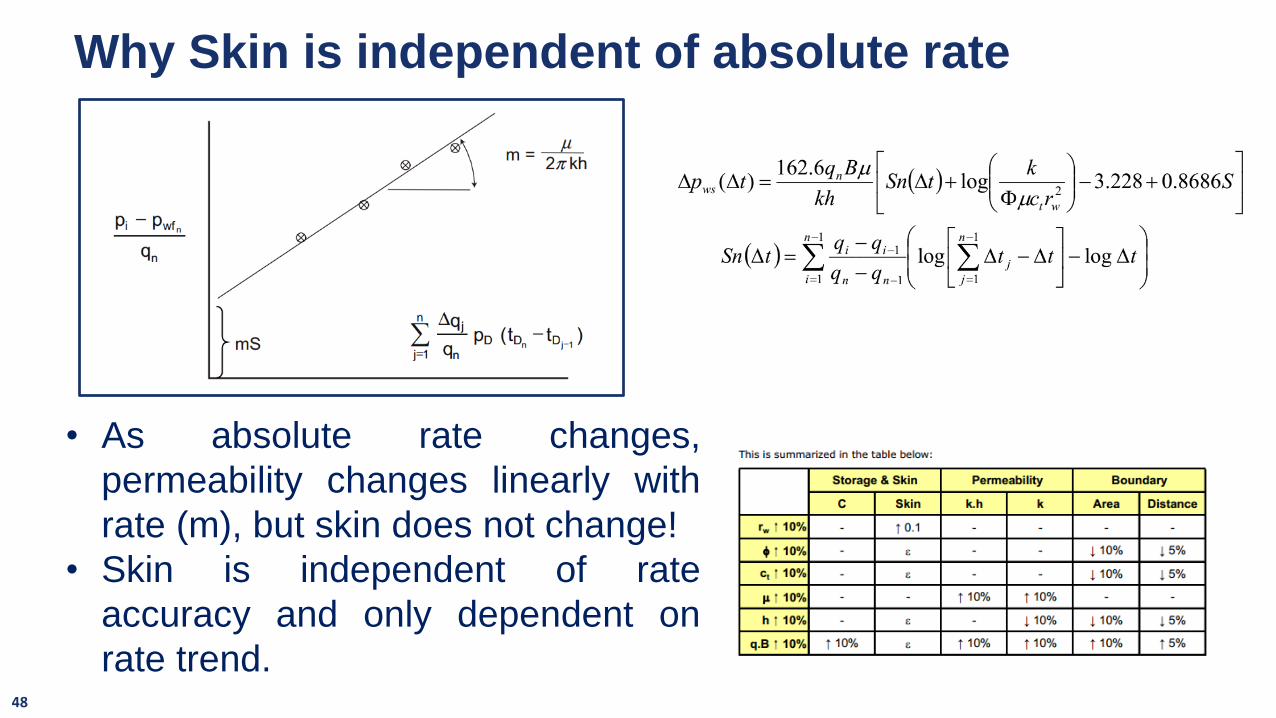
Why Skin is independent of absolute rate
• As absolute rate changes,
permeability changes linearly with
rate (m), but skin does not change!
• Skin is independent of rate
accuracy and only dependent on
rate trend.48
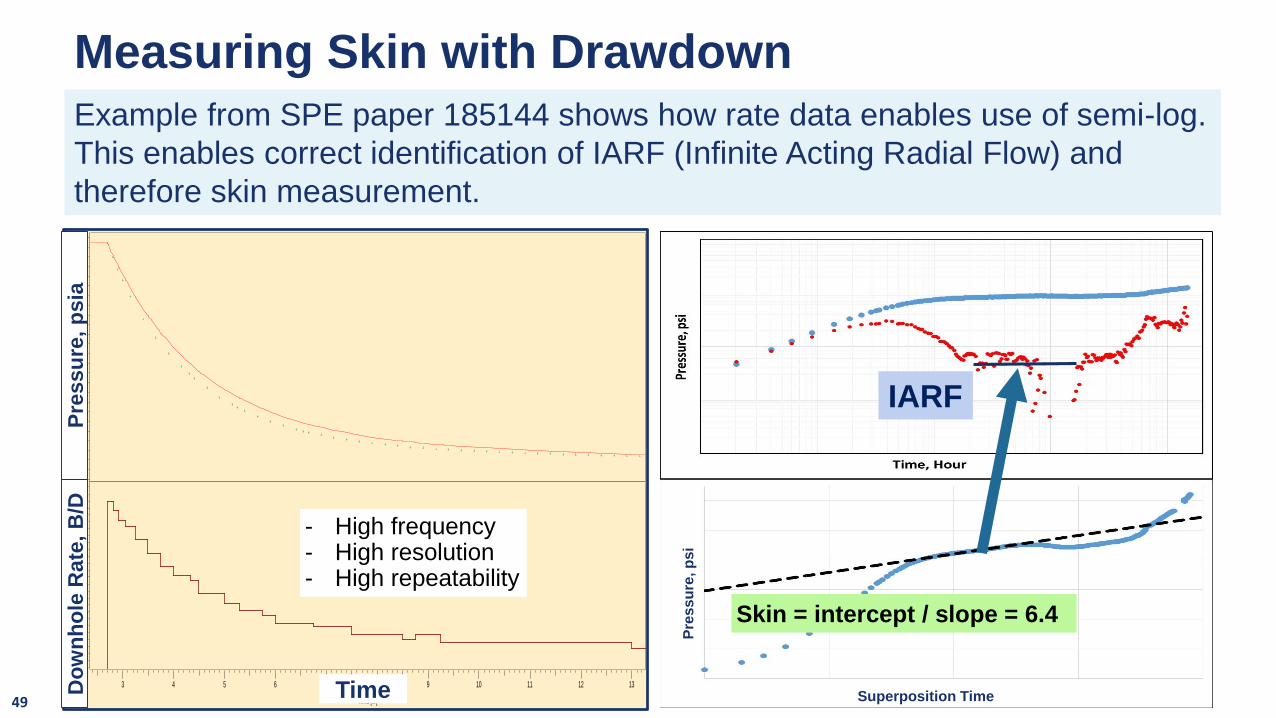
Measuring Skin with Drawdown
49
900
1300
Pressure [psia
]
3 4 5 6 7 8 9 10 11 12 13
Time [hr]
1300
1400
Dow
nhole
rate [B
/D
]
- High frequency- High resolution- High repeatability
Skin = intercept / slope = 6.4
IARF
Example from SPE paper 185144 shows how rate data enables use of semi-log.
This enables correct identification of IARF (Infinite Acting Radial Flow) and
therefore skin measurement.
Superposition TimeP
res
su
re, p
si
TimeDo
wn
ho
le R
ate
, B
/DP
res
su
re,
psia
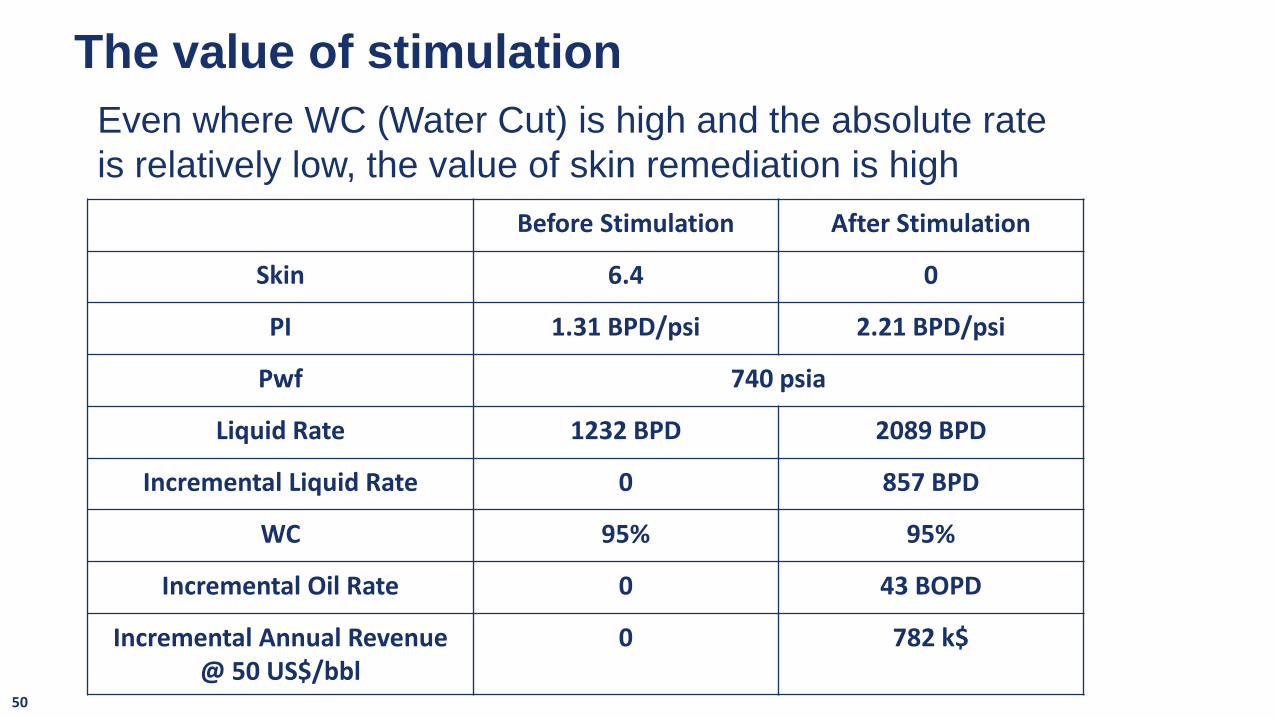
The value of stimulation
Before Stimulation After Stimulation
Skin 6.4 0
PI 1.31 BPD/psi 2.21 BPD/psi
Pwf 740 psia
Liquid Rate 1232 BPD 2089 BPD
Incremental Liquid Rate 0 857 BPD
WC 95% 95%
Incremental Oil Rate 0 43 BOPD
Incremental Annual Revenue @ 50 US$/bbl
0 782 k$
Even where WC (Water Cut) is high and the absolute rate
is relatively low, the value of skin remediation is high
50
51
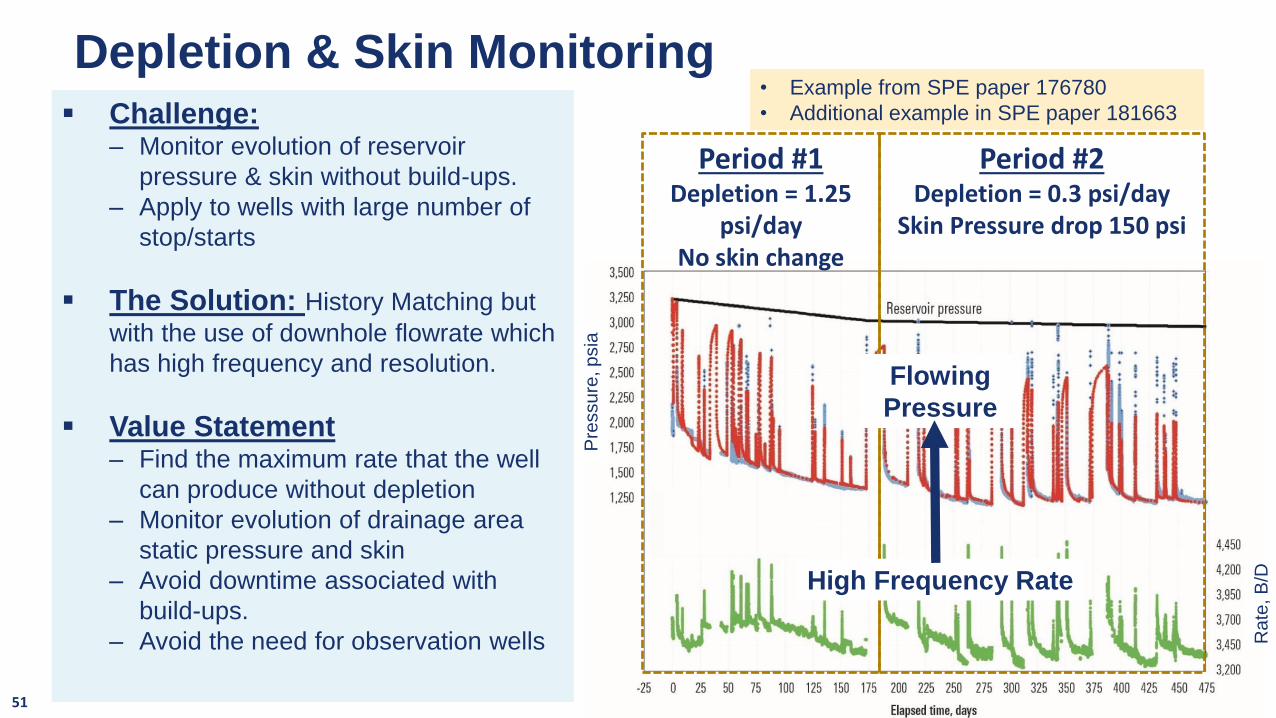
• Example from SPE paper 176780
• Additional example in SPE paper 181663▪ Challenge:– Monitor evolution of reservoir
pressure & skin without build-ups.
– Apply to wells with large number of
stop/starts
▪ The Solution: History Matching but
with the use of downhole flowrate which
has high frequency and resolution.
▪ Value Statement– Find the maximum rate that the well
can produce without depletion
– Monitor evolution of drainage area
static pressure and skin
– Avoid downtime associated with
build-ups.
– Avoid the need for observation wells
Period #2Depletion = 0.3 psi/day
Skin Pressure drop 150 psi
Period #1Depletion = 1.25
psi/dayNo skin change
High Frequency Rate
Flowing
Pressure
Pre
ssu
re, p
sia
Ra
te, B
/D
Depletion & Skin Monitoring

Before & After History Matching
Because of high frequency rate capturing transients, the match can be
achieved even where the well experiences numerous shut-downs
Before History Matching After History Matching
High Frequency Rate
Flowing
Pressure
Reservoir Pressure
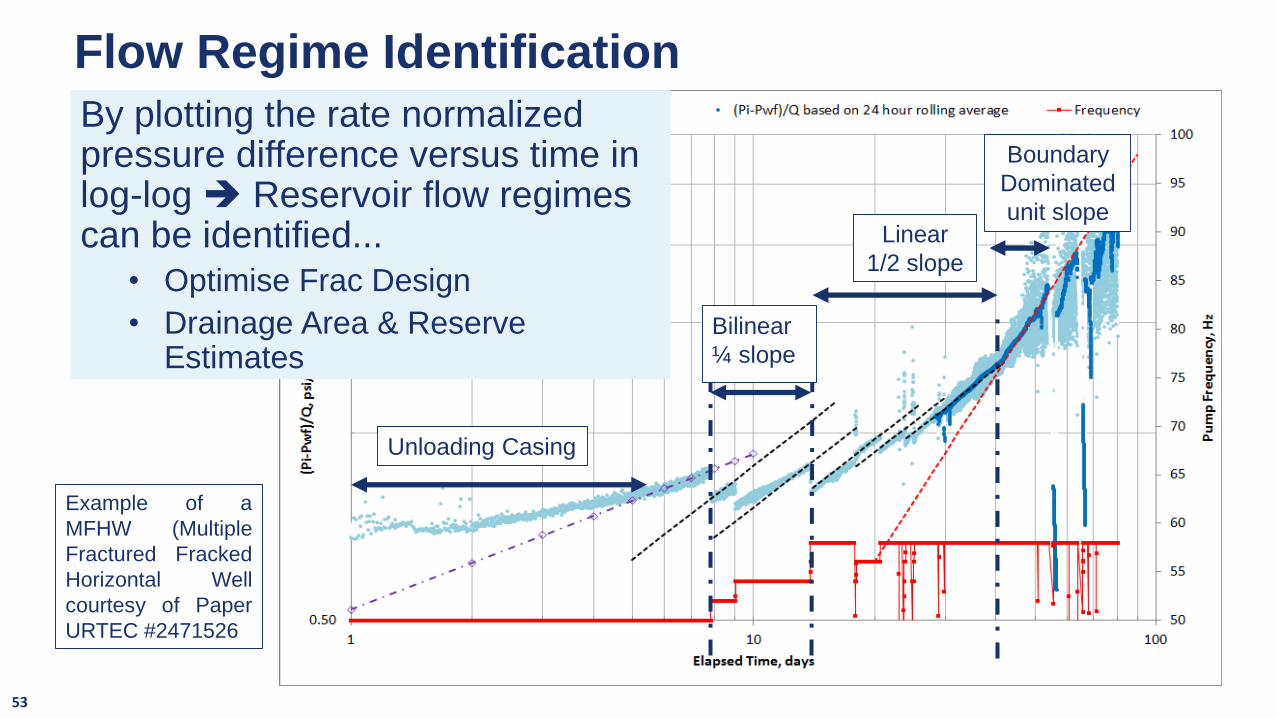
Flow Regime Identification
Bilinear
¼ slope
Boundary
Dominated
unit slopeLinear
1/2 slope
Unloading Casing
By plotting the rate normalized pressure difference versus time in log-log ➔ Reservoir flow regimes can be identified...
• Optimise Frac Design
• Drainage Area & Reserve Estimates
Example of a
MFHW (Multiple
Fractured Fracked
Horizontal Well
courtesy of Paper
URTEC #2471526
53

High Frequency vs. Test Separator Flowrate
One cannot see transient fracture flow regimes with low frequency &
low repeatability test separator data, even daily data is insufficient.
54
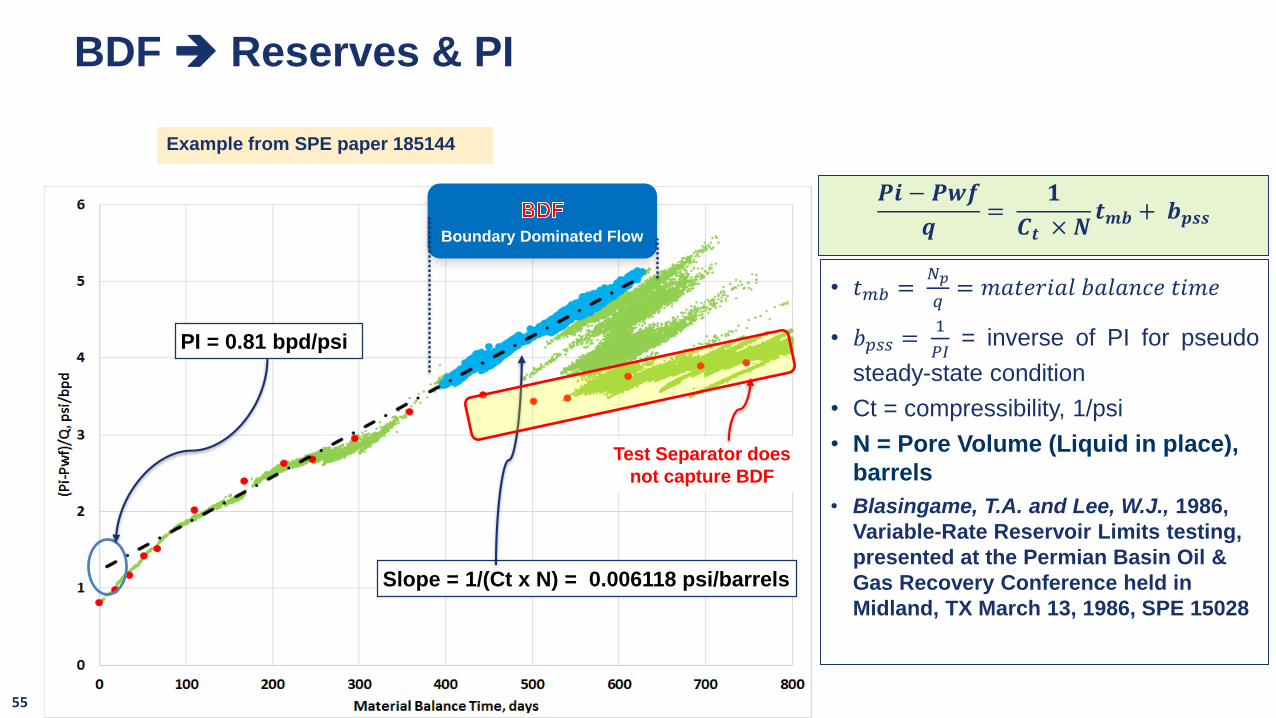
BDF ➔ Reserves & PI
𝑷𝒊 − 𝑷𝒘𝒇
𝒒=
𝟏
𝑪𝒕 × 𝑵𝒕𝒎𝒃 + 𝒃𝒑𝒔𝒔
Boundary Dominated Flow
Slope = 1/(Ct x N) = 0.006118 psi/barrels
PI = 0.81 bpd/psi
Test Separator does
not capture BDF
• 𝑡𝑚𝑏 =𝑁𝑝
𝑞= 𝑚𝑎𝑡𝑒𝑟𝑖𝑎𝑙 𝑏𝑎𝑙𝑎𝑛𝑐𝑒 𝑡𝑖𝑚𝑒
• 𝑏𝑝𝑠𝑠 =1
𝑃𝐼= inverse of PI for pseudo
steady-state condition
• Ct = compressibility, 1/psi
• N = Pore Volume (Liquid in place),
barrels
• Blasingame, T.A. and Lee, W.J., 1986,
Variable-Rate Reservoir Limits testing,
presented at the Permian Basin Oil &
Gas Recovery Conference held in
Midland, TX March 13, 1986, SPE 15028
Example from SPE paper 185144
55
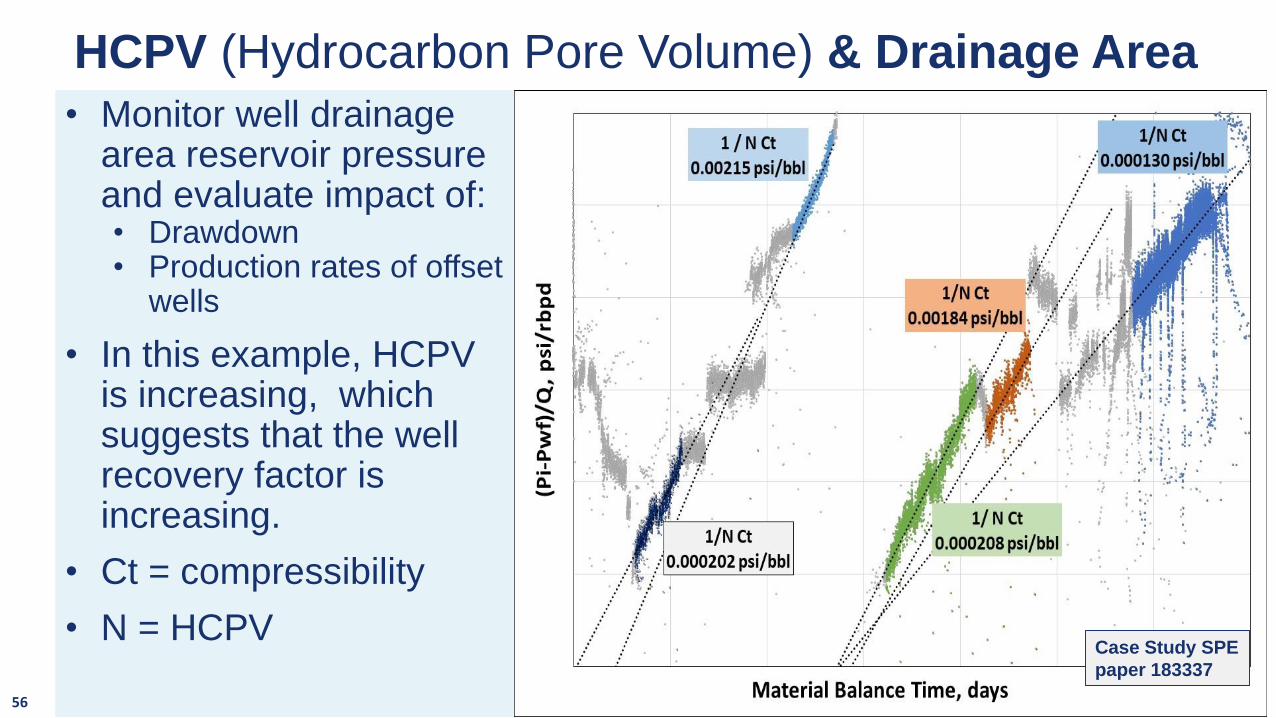
HCPV (Hydrocarbon Pore Volume) & Drainage Area
56
• Monitor well drainage area reservoir pressure and evaluate impact of:• Drawdown• Production rates of offset
wells
• In this example, HCPV is increasing, which suggests that the well recovery factor is increasing.
• Ct = compressibility
• N = HCPVCase Study SPE
paper 183337
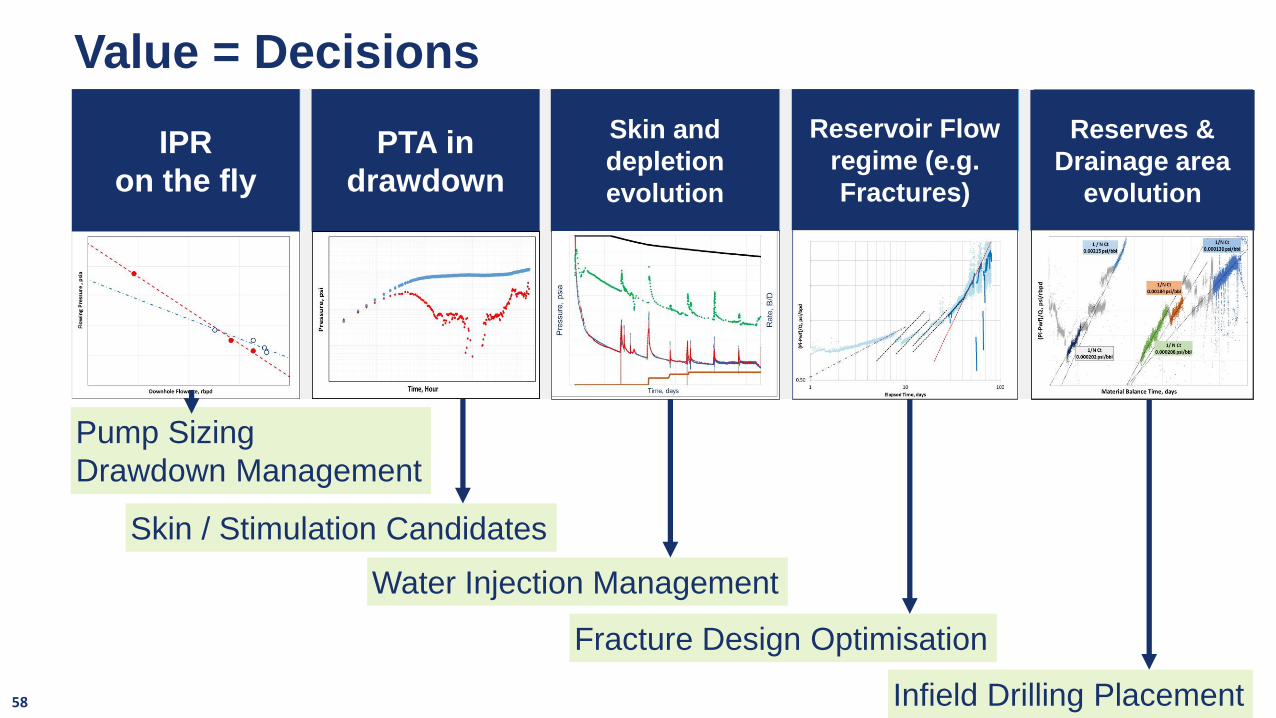
Value = Decisions
58
IPR
on the fly
Reserves &
Drainage area
evolution
Reservoir Flow
regime (e.g.
Fractures)
Skin and
depletion
evolution
PTA in
drawdown
Skin / Stimulation Candidates
Water Injection Management
Fracture Design Optimisation
Infield Drilling Placement
Pump Sizing
Drawdown Management

Data
1. Openhole logs
2. Geological maps
3. PVT data
4. Permanent Gauges (P,
T, Q, etc…)
5. Rate history
6. Cased Hole (PLT,
RST)
7. Build-ups
Information
1. Equipment health check
2. IPR curve3. Skin4. Pr trend5. Recovery factor6. Scale Treatment7. Etc…
Real-time Data
Static, Contextual
Data
Episodic DataData which does not stream
automatically in real-time
and requires intervention
Data to Information Map
Analytical Tools
◼ Equipment Models
◼ NODAL
◼ Pressure transient
◼ Rate transient
◼ Simulation
◼ Lab analysis
◼ Etc…
Will episodic data become a thing of
the past to be replaced by high
frequency data available on all wells,
especially for flowrate?
Digital Twins
Virtual Flowmeters
59
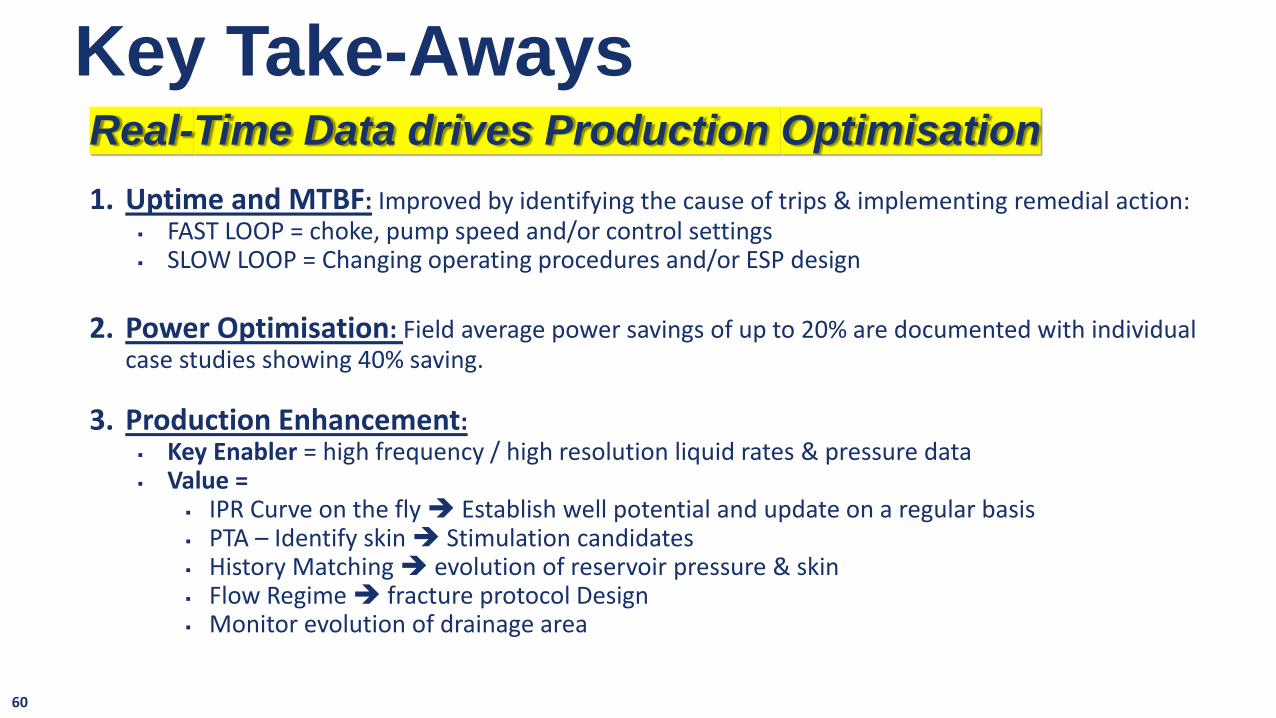
Key Take-AwaysReal-Time Data drives Production Optimisation
1. Uptime and MTBF: Improved by identifying the cause of trips & implementing remedial action:▪ FAST LOOP = choke, pump speed and/or control settings▪ SLOW LOOP = Changing operating procedures and/or ESP design
2. Power Optimisation: Field average power savings of up to 20% are documented with individual case studies showing 40% saving.
3. Production Enhancement:▪ Key Enabler = high frequency / high resolution liquid rates & pressure data▪ Value =
▪ IPR Curve on the fly ➔ Establish well potential and update on a regular basis▪ PTA – Identify skin ➔ Stimulation candidates▪ History Matching ➔ evolution of reservoir pressure & skin▪ Flow Regime ➔ fracture protocol Design▪ Monitor evolution of drainage area
60

Bibliography• Bowen, C.G. and Kennedy, R.J., 1989. Electric Submersible Pumps Improving Run Lives in the North Kaybob BHL Unit No.1, Paper SPE 19379.
• Blasingame, T.A. and Lee, W.J., 1986, Variable-Rate Reservoir Limits Testing, presented at the Permian Basin Oil & Gas Recovery Conference, held in Midland, Texas, 13 March. SPE 15028
• Camilleri, L., Brunet, L., and Segui, E. 2011. Poseidon Gas Handling Technology: A Case Study of Three ESP Wells in the Congo. Presented at the SPE Middle East Oil and Gas Show and Conference, Manama, Bahrain, 6–9 March. SPE 141668-MS.
• Camilleri, L. and MacDonald, J., 2010, How 24/7 Real-Time Surveillance Increases ESP Run Life and Uptime, SPE 134702 presented at ATCE in 2010 in Florence, Italy.
• Camilleri, L., El Gindy, M., and Rusakov, A. 2015. Converting ESP Real-Time Data to Flow Rate and Reservoir Information for a Remote Oil Well. Presented at the SPE Middle East Intelligent Oil & Gas Conference & Exhibition, Abu Dhabi, UAE, 15–16 September. SPE-176780-MS.
• Camilleri, L., El Gindy, M., and Rusakov, A. 2016. ESP Real-Time Data Enables Well Testing with High Frequency, High Resolution, and High Repeatability in an Unconventional Well. Presented at the Unconventional Resources Technology Conference, San Antonio, Texas, USA, 1–3 August 2016. URTEC 2471526.
• Camilleri, L., El Gindy, M., and Rusakov, A. 2016. Providing Accurate ESP Flow Rate Measurement in the Absence of a Test Separator presented at the SPE Annual Technical Conference held in Dubai, UAE, 26 – 28 September 2016, SPE – 181663 – MS
• Camilleri, L., El Gindy, M., and Rusakov, A. 2016. Testing the Untestable... Delivering Flowrate Measurements with High Accuracy on a Remote ESP Wellresented at the Abu Dhabi International Petroleum Exhibition and Conference held in Abu Dhabi, UAE, 7–10 November 2016 – SPE-183337-MS
• Camilleri, L., El Gindy, M., and Rusakov, I. et al. 2017. Increasing Production with High-Frequency and High-Resolution Flow Rate Measurements from ESPs. Presented at the SPE Electric Submersible Pump Symposium, The Woodlands, Texas, USA, 24–28 April 2017. SPE-185144-MS.
• Camilleri, L., and G. Hua, N. H. Al-Maqsseed and A. M. Al Jazzaf, 2018, Tuning VSDs in ESP Wells to Optimize Oil Production—Case Studies, SPE 190940
• Lejon, K.; Hersvik, K.J.; Boe, A; 2010, Multi-asset Production Support Center – Generating Values, paper SPE 127730 presented at the SPE Intelligent Energy Conference and Exhibition held in Utrecht, the Netherlands, 23-25 March 2010.
• Nieto, A., Brinez, D., Lopez, J.E., Marin, P., Cabrera, S., Paya, D., Fernandez, L., Villalobos, J., Cifuentes, E., 2017 Electrical Cost Optimization for Electric Submersible Pumps: Systematic Integration of Current Conditions and Future Expectations. SPE 184006
• Yero, J. and Moroney, T.A., 2010, Exception Based Surveillance, SPE 127860, 2010
• Zdolnik, S., Pashali, A., Markelov, D., Volkov, M., 2008, Real Time Optimisation Approach for 15,000 ESP Wells, SPE 112238
Society of Petroleum
Engineers Distinguished
Lecturer Programwww.spe.org/dl
62
Your Feedback is
Important
Enter your section in the DL Evaluation
Contest by completing the evaluation
form for this presentation
Visit SPE.org/dl
62
Real-Time Data can truly drive
Production Optimisation

BACK-UP SLIDES

UPTIME: Measurement, Diagnostic, Resolution

Automation Delivers Value
65
High
Frequency
Flowmeter
Well Model
VSD Control
Data
Digital Twin
Execution
35 psia
Flowing
Pressure
Without
Pump-Off
60%
MET
HA
NE
PR
OD
UC
TIO
N
Increased PCP run life
SPE 181218
Using Liquid Inflow Method to Optimize
Progressive Cavity Pumps
Fast Loop
Automatic Feedback
Loop
Proactive

Example of how uptime can be measured
Statistically, more than
3 starts per month has
a negative impact on
run life (see back-up
slide for explanation)
Highest Frequency of stop/start
with 10 restarts in 15 days
Continuous measurement provides the evolution of uptime,
this is made possible by high frequency real time data.
Operational Days 514
Downtime Days 46
Uptime 91%
Number of stops 108
Stops / month 6.4
66
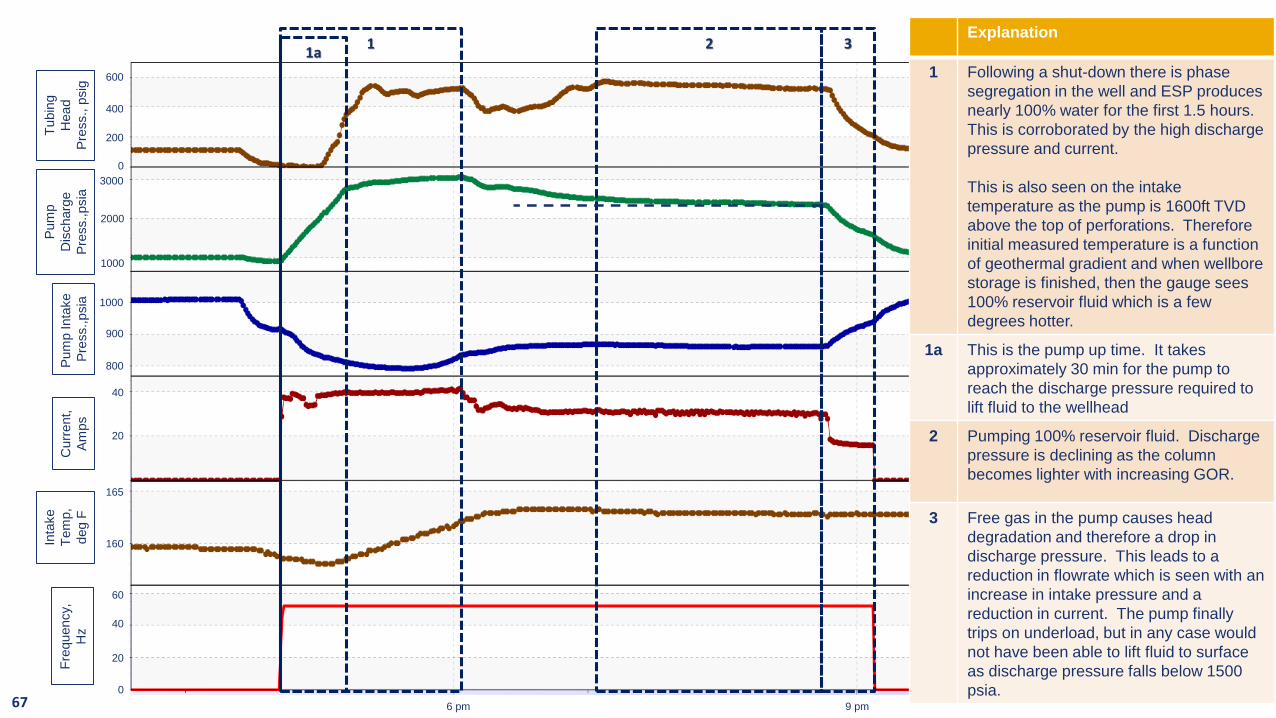
1 2 31a
Explanation
1 Following a shut-down there is phase
segregation in the well and ESP produces
nearly 100% water for the first 1.5 hours.
This is corroborated by the high discharge
pressure and current.
This is also seen on the intake
temperature as the pump is 1600ft TVD
above the top of perforations. Therefore
initial measured temperature is a function
of geothermal gradient and when wellbore
storage is finished, then the gauge sees
100% reservoir fluid which is a few
degrees hotter.
1a This is the pump up time. It takes
approximately 30 min for the pump to
reach the discharge pressure required to
lift fluid to the wellhead
2 Pumping 100% reservoir fluid. Discharge
pressure is declining as the column
becomes lighter with increasing GOR.
3 Free gas in the pump causes head
degradation and therefore a drop in
discharge pressure. This leads to a
reduction in flowrate which is seen with an
increase in intake pressure and a
reduction in current. The pump finally
trips on underload, but in any case would
not have been able to lift fluid to surface
as discharge pressure falls below 1500
psia. 6 pm 9 pm
200
400
600
3000
1000
800
900
1000
160
60
165
20
40
2000
40
Fre
quency,
Hz
Curr
ent,
Am
ps
Pum
p Inta
ke
Pre
ss.,psia
Pum
p
Dis
charg
e
Pre
ss.,psia
Tubin
g
Head
Pre
ss., p
sig
0
20
0
Inta
ke
Tem
p,
deg
F
67

Resolution both in the “fast” loop
▪ Fast Loop SolutionEliminate trips through diagnostics (aka
Root Cause Analysis) and remedial action:
– Choke setting change
– Speed change
– Or operating the ESP on a feedback loop
using a VSD to maintain either constant
current or intake pressure.
– Or defeating traditional current underload
and only shutting down on motor
temperature (previously not possible
before the advent of ESP gauges)
▪ Slow Loop SolutionThese observations are subsequently used
in the redesign of the ESP (see example in
back-up slides of addition of helicoaxial
pump which eliminates slugging).
Schlumberger Case Study from Kazakhstan shows 27% downtime reduction
Paper by OXY Permian and Schlumberger
68

Run Life: Measurement, Diagnostic, Resolution
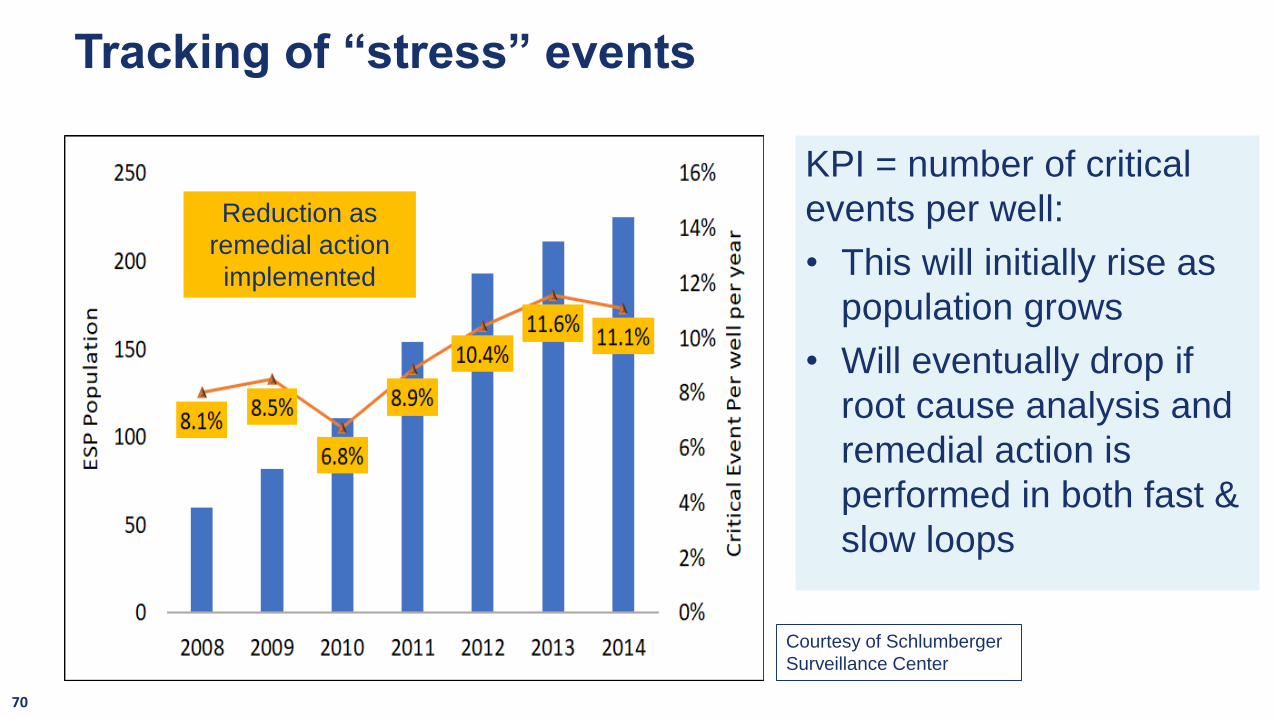
Tracking of “stress” events
70
KPI = number of critical
events per well:
• This will initially rise as
population grows
• Will eventually drop if
root cause analysis and
remedial action is
performed in both fast &
slow loops
Reduction as
remedial action
implemented
Courtesy of Schlumberger
Surveillance Center
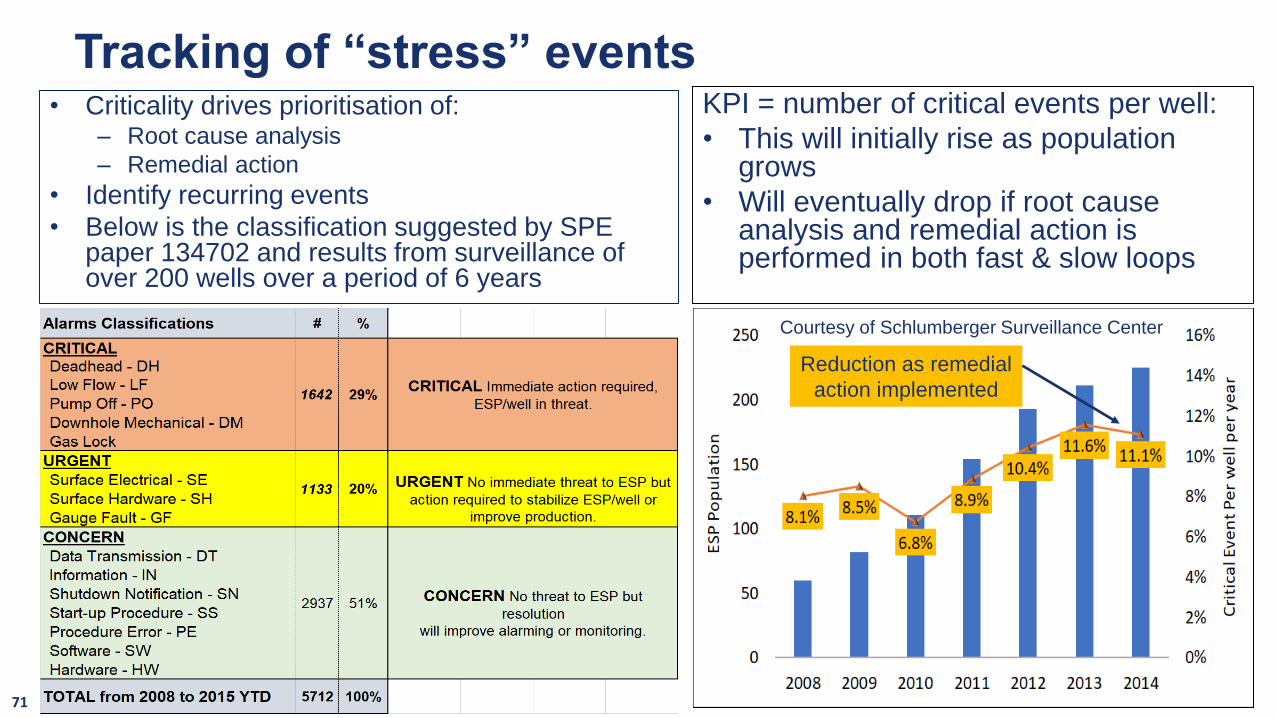
Tracking of “stress” events• Criticality drives prioritisation of:
– Root cause analysis
– Remedial action
• Identify recurring events
• Below is the classification suggested by SPE paper 134702 and results from surveillance of over 200 wells over a period of 6 years
KPI = number of critical events per well:
• This will initially rise as population grows
• Will eventually drop if root cause analysis and remedial action is performed in both fast & slow loops
Courtesy of Schlumberger Surveillance Center
Reduction as remedial
action implemented
71

Power: Measurement, Diagnostic, Resolution

Production Enhancement
❑The main objectives are:▪ Increase drawdown▪ Reduce skin▪ Maximise drainage area i.e. recoverable
reserves
❑The levers available are:▪ Manage drawdown (choke and pump speed)▪ Stimulate to remove skin▪ Manage pressure support e.g. water injection
❑Constraints are understanding the well potential in terms of:▪ Inflow Performance▪ Pressure support▪ Well interference▪ Skin – formation damage▪ Reservoir size (boundaries)
Testing is essential to:
- Determine well
potential
- Take the right action
(use the right lever) to
increase production
73
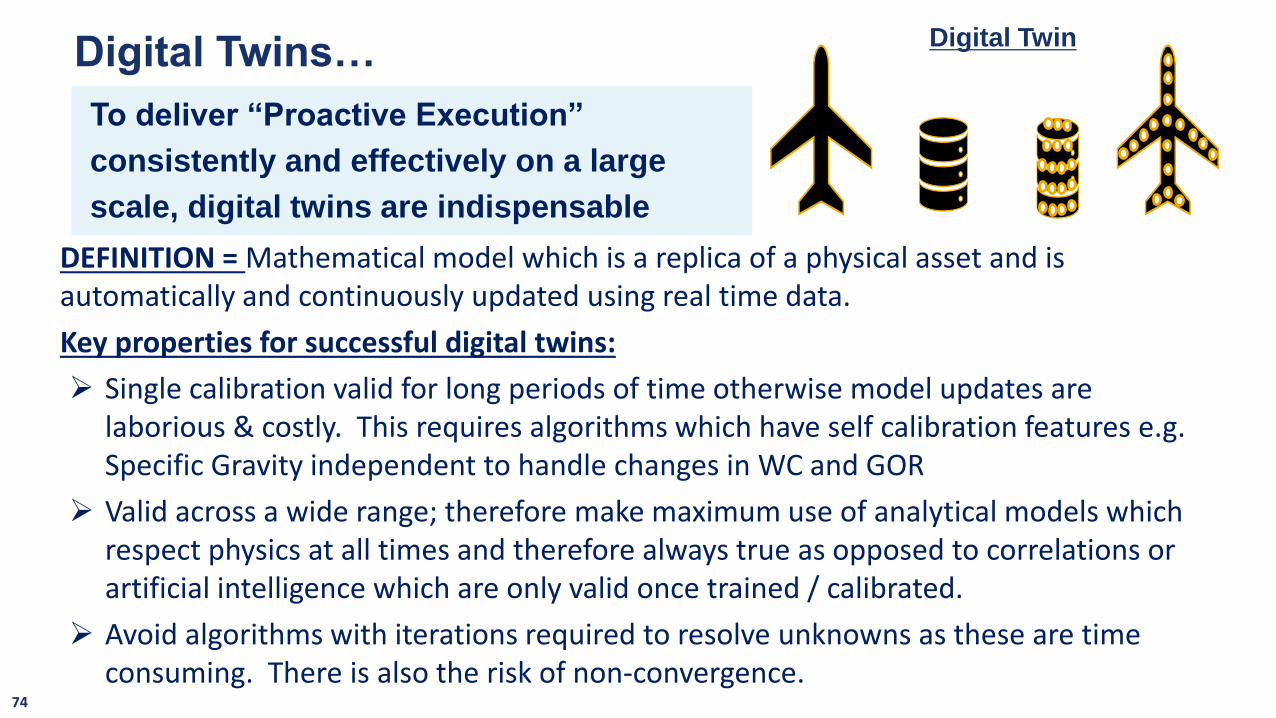
Digital Twins…
DEFINITION = Mathematical model which is a replica of a physical asset and is automatically and continuously updated using real time data.
Key properties for successful digital twins:
➢ Single calibration valid for long periods of time otherwise model updates are laborious & costly. This requires algorithms which have self calibration features e.g. Specific Gravity independent to handle changes in WC and GOR
➢ Valid across a wide range; therefore make maximum use of analytical models which respect physics at all times and therefore always true as opposed to correlations or artificial intelligence which are only valid once trained / calibrated.
➢ Avoid algorithms with iterations required to resolve unknowns as these are time consuming. There is also the risk of non-convergence.
Digital Twin
To deliver “Proactive Execution”
consistently and effectively on a large
scale, digital twins are indispensable
74

On the fly IPR with Multirate Test, SPE 185144
75
2600
2800
1680
3000
1660
1640
1620
Liq
uid
Rat
e, r
bp
dES
P In
take
Pre
ssu
re,
psi
aFr
eq
ue
ncy
, H
zTu
bin
g H
ead
P
ress
ure
, psi
a
Day 1 Day 7 Day 14
▪ IPR is obtained on-the-fly without a build-up to measure static pressure.
▪ Made possible by liquid rate with high frequency, high resolution and high repeatability.
▪ Difficult with test separator data.
PI = 14 rbdps/psi
Pr = 1856 psia
5 Hz
150 psi

ESP Condition Monitoring - Digital Twin Example
Digital Twin provides
A. Real time High Frequency
Flowrate
B. Real Time ESP Management
– Health Monitoring
– Operating Point
– Power Optimisation
Engine is located in the cloud with
the following advantages:
▪ Collaborative workspace.
▪ Can interface any data historian.
▪ Cost of engine maintenance is shared
by multiple users.76

PHI* - Pump Health Indicator
Identify degradation WITHOUT:
▪ Without flowrate
▪ Use commonly available real-time data
Enables:
▪ Monitor Pump Health in Real Time
▪ Calibrate Flowrate Models where well tests is not available fro calibration
77

Compares actual measured differential head
to theoretical factory curve head at a given
flowrate…usually the production test rate.
This method requires knowledge of:
1) Rates
2) Fluid ➔ SG
3) PVT
Traditional ESP Diagnostic & Health Monitoring
Not Available
without a well
test
PiPdPPW −=
FluidPHeadDiff /. =
Discharge
Pressure
Intake
Pressure
78
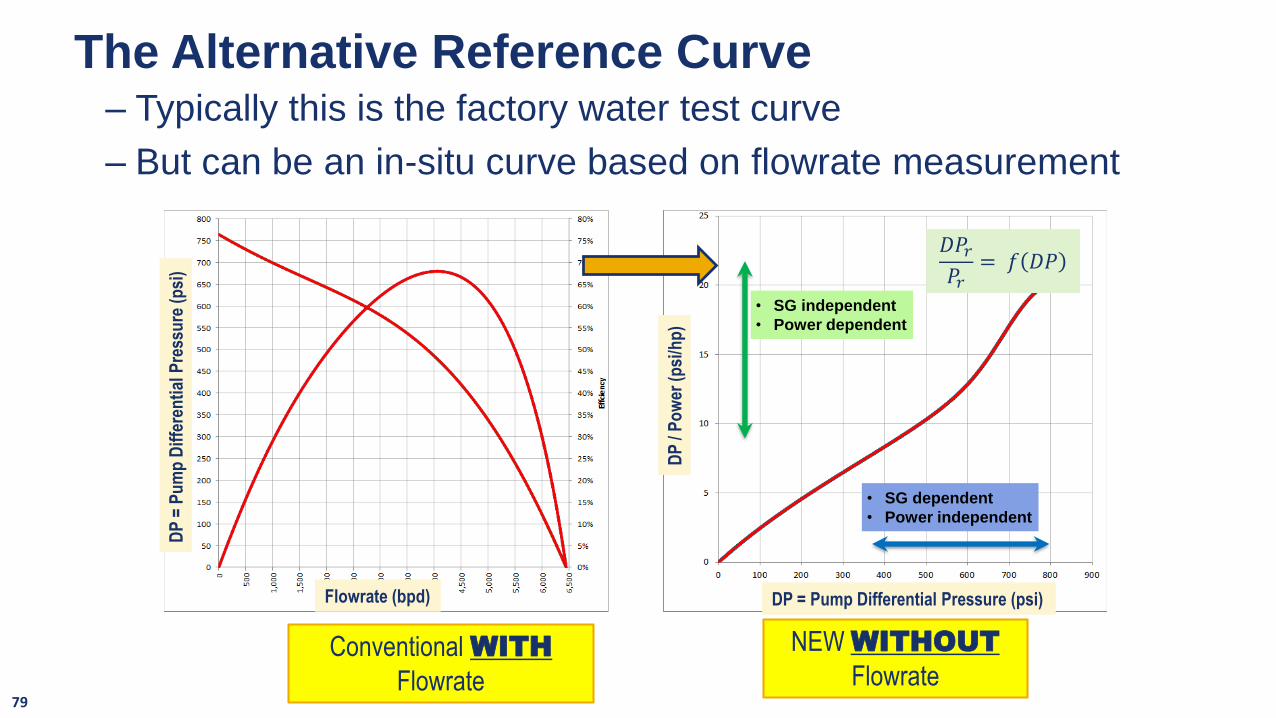
The Alternative Reference Curve– Typically this is the factory water test curve
– But can be an in-situ curve based on flowrate measurement
Conventional WITH
Flowrate
NEW WITHOUT
Flowrate
𝐷𝑃𝑟𝑃𝑟
= 𝑓 𝐷𝑃
DP
/ P
ow
er (
psi
/hp
)
DP
= P
um
p D
iffe
ren
tial
Pre
ssu
re (
psi
)
Flowrate (bpd) DP = Pump Differential Pressure (psi)
• SG independent
• Power dependent
• SG dependent
• Power independent
79
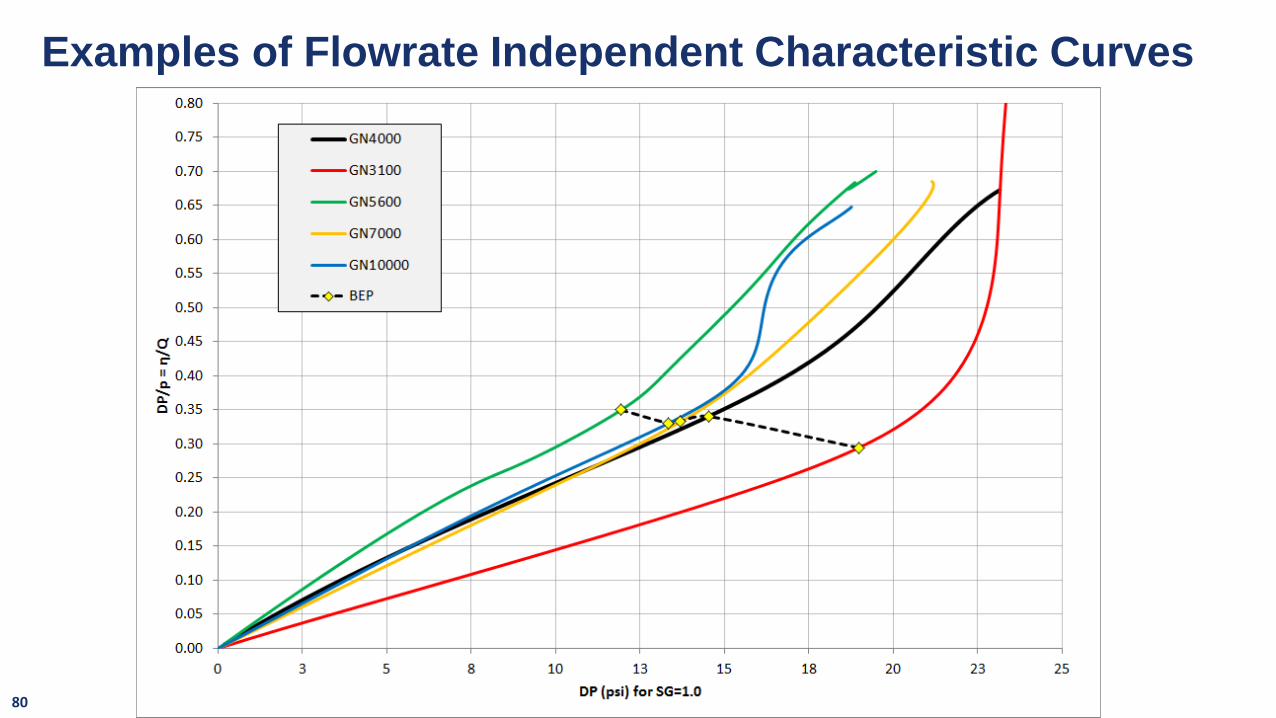
Examples of Flowrate Independent Characteristic Curves
80

PHI=1.0
Calibration
Mode #2: For a few weeks following ESP
start-up:
• Pump is new ➔ no wear
• Based on PVT ➔ No Viscosity
degradation
• High intake pressure, GOR ~ Rs ➔ no
gas degradation
Mode #1: Provides identification of
change in pump performance change
independently of flowrate due to:
• Wear
• Gas Degradation
• Viscosity Degradation
PHI has two modes
PHI =
𝑫𝑷
𝑷 𝒂𝒄𝒕𝒖𝒂𝒍𝑫𝑷
𝑷 𝒓𝒆𝒇𝒆𝒓𝒆𝒏𝒄𝒆
=𝑪𝜼
𝑪𝒒
Cη = ηa / ηr Efficiency Degradation
Cq = Qa / Qr Flow Degradation
DP = Pd-Pi Pump Differential Pressure
P Pump Absorbed Power
81

PHI Example, SPE paper 176780
PHI
PH
I =
𝑫𝑷 𝑷
𝒂𝒄𝒕𝒖𝒂𝒍
𝑫𝑷 𝑷
𝒓𝒆𝒇𝒆𝒓𝒆𝒏𝒄𝒆
=𝑪𝜼
𝑪𝒒
PHI over 16 months PHI zoom-in on last 5 days
Insulation
Degradation
predicting Motor Burn
PHI = 1.0 ➔ good condition
82

Calibration Achieves Rate Accuracy < 2.5%
Courtesy of SPE-183337- Testing the Untestable... Delivering Flowrate Measurements with High
Accuracy on a Remote ESP Well
PHI =
𝑫𝑷
𝑷 𝒂𝒄𝒕𝒖𝒂𝒍𝑫𝑷
𝑷 𝒓𝒆𝒇𝒆𝒓𝒆𝒏𝒄𝒆
=𝑪𝜼
𝑪𝒒
Cη = ηa / ηr Efficiency Degradation
Cq = Qa / Qr Flow Degradation
DP = Pd-Pi Pump Differential Pressure
P Pump Absorbed Power
PHI = = 1.0 ➔ Liquid Rate model calibrated
Calibrated downhole liquid rate
Well test results
DP
/ P
ow
er (
psi
/hp
)
DP = Pump Differential Pressure (psi)
Actual matched to
Reference (pump
curve) to achieve
PHI=1.0
▪ Following ESP start-up initial calibration based on PHI (Pump Health Indicator) =1.0 as➢ Pump is new ➔ no wear➢ Based on PVT ➔ No Viscosity or gas degradation
▪ If PHI remains constant at 1.0 ➔calibration is maintained.
▪ Verified against well tests & accuracy achieved• SPE 183337 Accuracy <2.5%• SPE 2471526: Accuracy < 1%
83

PHI =1.0, liquid rate & WC are
calibrated
PHI Detecting Wear(SPE 185144)
Rise in PHI detects pump mechanical wear after prolonged operation in downthrust in sandy environment
Pump Operating in downthrust in sandy environment cause of wear
Intake pressure rising with drop in production
Liquid rate trend is correct despite losing calibration (rise in PHI)
PHI = 1.0 ➔ good condition
84
Top Related