


Languages
Pages
Legal


the society of motor manufacturers and traders motor industry facts 2013

about smmt What is SMMT? 04 Policy priorities for 2013 05 SMMT group companies 06 The Automotive Council 07
industry performance Did you know? 08 UK sector profile 09 New investment to support growth 10 The UK supply chain 11 Automotive employment, skills and training 12 Legislation in the automotive industry 13 SMMT European and National Type Approval Guide 15 (SENTA) Export and trade 16
uK automotive manufacturing UK top five manufacturers 17 Key UK manufacturing sites 19 UK car manufacturing annual totals 20 UK CV manufacturing annual totals 21
contents
Engine output by manufacturer 22 International context 23
new car registrations Annual UK totals and top 10 cars 24 2012 total new car registrations across the UK 25 Alternatively-fuelled vehicle registrations 26 Registrations by sales type 27 Segment totals and market share 28 Best sellers by segment 29 International registration data 32
commercial vehicle registrations Annual UK van and truck registrations 33 Annual UK bus and coach registrations 34
vehicles in use Used car sales 35 Annual totals of cars on UK roads 35 Number of cars on UK roads 36 Age of cars on the road 37 Colours of cars on the road 37 Commercial vehicles on the road 38
environmental performance UK CO2 emissions by source 39 UK manufacturing facility performance 40 Carbon footprint through the lifecycle 41 Average new car CO2 emissions 42 Change in average new car CO2 g/km emissions 43 by segment New car market by VED band 44 Electric car technology and policy in the UK 45 Ultra-low carbon innovation and the future of UK 46 automotive
Key issues Vehicle security and road safety 47 Fuel costs 48 Vehicle Excise Duty (VED) 48
smmt information Glossary of terms 49 SMMT reports and publications 50 Useful links 50
www.smmt.co.uk 2

smmt automotive information services (ais) is the definitive source for data on the uK motor industry. from manufacturing and first registration to vehicles on the road (parc), smmt provides the most up-to-date and accurate industry data available.
to find out more, go to: www.smmt.co.uk/data.
www.smmt.co.uk 3

about smmt
what is smmt?The Society of Motor Manufacturers and Traders (SMMT) supports and promotes the interests of the UK automotive industry at home and abroad. Working closely with member companies, SMMT acts as the voice of the motor industry, promoting its position to government, stakeholders and the media.
As a membership organisation, SMMT represents more than 550 automotive companies in the UK, providing them with a forum to voice their views on issues affecting the automotive sector, helping to guide strategies and build positive relationships with government and regulatory authorities.
One of the largest and most influential trade associations operating in the UK, SMMT’s resources, reputation and unrivalled automotive data place it at the heart of the UK automotive industry. It undertakes a variety of activities to support and represent the interests of the industry and has a long history of achievement.
To find out how to join SMMT and for more information, visit www.smmt.co.uk/memberservices or e-mail [email protected].
www.smmt.co.uk 4

smmt policy priorities for 2013SMMT will concentrate its work with government and stakeholders in 2013 on delivering the automotive industry’s priorities for growth and industrial strategy. It will focus on: • Buildinglastingcapabilities,structuresand
supportive policies for automotive in the UK and EU. • SupportingtheAutomotiveCouncilagendafor
maximising the UK benefit from the global shift to ultra-low carbon vehicles.
• HelpingtheUKtoexploitthesupplychainopportunities arising from £6bn of automotive investment announced during the past two years.
The six key priority areas in 2013 will be:
industrial strategy and delivery for automotive • Workingcloselyonasectorstrategytoinclude
government/industry collaboration and support for the Automotive Council.
• Helpingtoshapealeadingultra-lowcarbonvehicle(ULCV) market.
• Deliveringsupplychainopportunitiesandaccess to finance.
• MaintainingastrongvoiceinEurope.
low carbon vehicles and technologies • DeliveryontheAutomotiveCouncil’stechnology
roadmaps and five strategic technologies. • Strongandstableframeworkofultra-lowcarbon
incentives beyond 2015.
reform of motoring taxes and energy efficiency regimes • VehicleExciseDutyandCompanyCarTaxmust
maintain the important diversity of the UK market, incentivise the uptake of ULCVs and not undermine fleet renewal.
• Minimisingcostandnegativeimpactonindustrycompetitiveness from changes to UK energy efficiency schemes and energy taxes.
intensive environmental agenda on co2, air quality, noise and biofuels • Lobbyingstronglyacrossafullenvironmental
agenda at UK and EU level, covering CO2, air quality,
noise and alternative fuels, working collaboratively with European and UK stakeholders.
technology and innovation • ContinuingsupportfortheAutomotiveCouncil
Technology Group. • ParticipatingintheworkoftheTransportKnowledge
Transfer Network and high value manufacturing catapult.
• Co-ordinatingsupportforanultra-lowcarbon vehicle catapult.
vehicle legislation • HelpingUK-basedtrailermakersandbodybuilders
comply with new European Whole Vehicle Type Approval requirements through SENTA tools and roadshows.
• CoveringL5-7categoryvehicles,bothinregardtotype approval legislation and other key issues in SMMT’s wider lobbying and influencing.
about smmt
www.smmt.co.uk 5

smmt group companiesmotor codes The government-backed industry self-regulator, Motor Codes operates codes of practice outlining clear-cut customer service level expectations in the new car and service and repair sectors. It serves as a business driver for subscribing garages and offers reassurance to motorists through transparent online garage ratings and an independent advisory service.
The new car code covers over 99% of all new cars sold in the UK and regulates the advertising, sale, warranty, replacement parts availability and complaint handling processes for new cars.
The service and repair code helps motorists identify responsible garages committed to providing the highest standardsofcustomerservice,fromaround7,000ratedgarages in the UK.
Garages can be identified through the online Garage Finder, helping motorists to identify fair and honest traders based on the feedback of other users.
Motor Codes provides a free garage and customer advice line (0800 692 0825) offering advice, arbitration, conciliation and, ultimately, peace of mind for motorists.
For more information, visit www.motorcodes.co.uk.
smmt industry forum Industry Forum was formed in 1994, initially as a unique collaboration between leading vehicle manufacturers, SMMT and government to improve the performance and competitiveness of the UK’s automotive supply chain.
Continued measurable success has led to sustained growth into many other sectors including aerospace, construction, domestic appliances, electronics and food. Industry Forum now
provides support to blue chip organisations in more than 30 countries across five continents.
industry forum delivers significant results in three ways: • practical solutions – providing knowledge,
hands-on experience and guidance to improve business performance.
• learning and development – inspiring people through structured training and development programmes to deliver business excellence.
• audit and assessment – using globally recognised objective assessment criteria to understand, measure and monitor business performance.
To find out more about Industry Forum, visit: www.industryforum.co.uk.
about smmt
www.smmt.co.uk 6
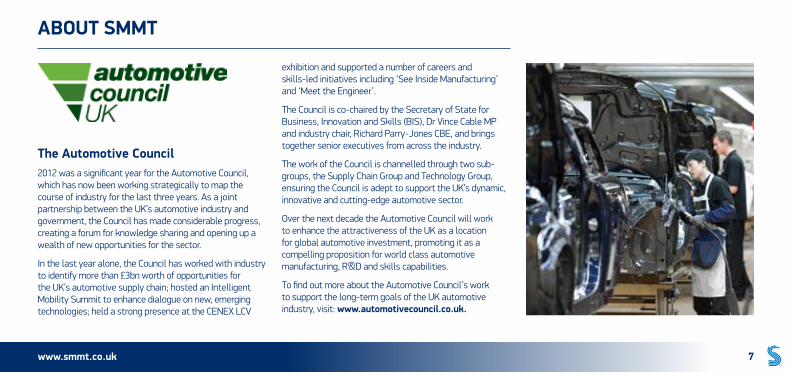
the automotive council2012 was a significant year for the Automotive Council, which has now been working strategically to map the course of industry for the last three years. As a joint partnership between the UK’s automotive industry and government, the Council has made considerable progress, creating a forum for knowledge sharing and opening up a wealth of new opportunities for the sector.
In the last year alone, the Council has worked with industry to identify more than £3bn worth of opportunities for the UK’s automotive supply chain; hosted an Intelligent Mobility Summit to enhance dialogue on new, emerging technologies; held a strong presence at the CENEX LCV
exhibition and supported a number of careers and skills-led initiatives including ‘See Inside Manufacturing’ and ‘Meet the Engineer’.
The Council is co-chaired by the Secretary of State for Business, Innovation and Skills (BIS), Dr Vince Cable MP and industry chair, Richard Parry-Jones CBE, and brings together senior executives from across the industry.
The work of the Council is channelled through two sub-groups, the Supply Chain Group and Technology Group, ensuring the Council is adept to support the UK’s dynamic, innovative and cutting-edge automotive sector.
Over the next decade the Automotive Council will work to enhance the attractiveness of the UK as a location for global automotive investment, promoting it as a compelling proposition for world class automotive manufacturing, R&D and skills capabilities.
To find out more about the Automotive Council’s work to support the long-term goals of the UK automotive industry, visit: www.automotivecouncil.co.uk.
about smmt
www.smmt.co.uk 7
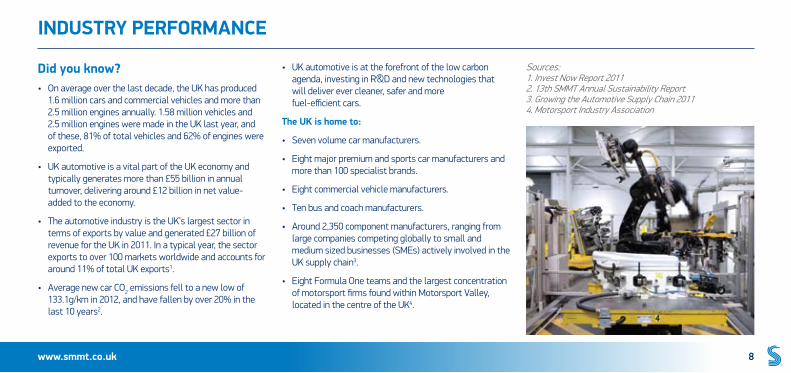
did you know?• Onaverageoverthelastdecade,theUKhasproduced
1.6 million cars and commercial vehicles and more than 2.5 million engines annually. 1.58 million vehicles and 2.5 million engines were made in the UK last year, and of these, 81% of total vehicles and 62% of engines were exported.
• UKautomotiveisavitalpartoftheUKeconomyandtypically generates more than £55 billion in annual turnover, delivering around £12 billion in net value-added to the economy.
• TheautomotiveindustryistheUK’slargestsectorintermsofexportsbyvalueandgenerated£27billionofrevenue for the UK in 2011. In a typical year, the sector exports to over 100 markets worldwide and accounts for around 11% of total UK exports1.
• AveragenewcarCO2 emissions fell to a new low of 133.1g/km in 2012, and have fallen by over 20% in the last 10 years2.
• UKautomotiveisattheforefrontofthelowcarbonagenda, investing in R&D and new technologies that will deliver ever cleaner, safer and more fuel-efficient cars.
the uK is home to:
• Sevenvolumecarmanufacturers.
• Eightmajorpremiumandsportscarmanufacturersandmore than 100 specialist brands.
• Eightcommercialvehiclemanufacturers.
• Tenbusandcoachmanufacturers.
• Around2,350componentmanufacturers,rangingfromlarge companies competing globally to small and medium sized businesses (SMEs) actively involved in the UK supply chain3.
• EightFormulaOneteamsandthelargestconcentrationof motorsport firms found within Motorsport Valley, located in the centre of the UK4.
Sources: 1. Invest Now Report 2011 2. 13th SMMT Annual Sustainability Report 3. Growing the Automotive Supply Chain 2011 4. Motorsport Industry Association
industry performance
www.smmt.co.uk 8

industry performance
2007 2008 2009 2010 2011
Automotive manufacturing sector turnover (£bn) 53.2 53.2 41.0 49.0 56.0
Share of total transport manufacturing turnover (%) 67.0 72.1 64.0 65.8 66.2
Total net capital investment (£bn) 0.9 1.3 1.2 1.4 1.5
Automotive sector value added (£bn) 10.3 10.8 6.6 10.6 12.3
Total employees directly dependent on the UK automotive sector 840,000 807,000 736,000 737,000 720,000
Value of exports (£bn) 26.1 28.0 23.8 29 27
Percentage of total UK exports (%) 11.8 11.8 10.5 10.9 9.2
All automotive sectors - value added share of GVA (%) 3.3 2.6 2.2 2.6 2.8
UK share of global passenger car production (%) 2.4 2.3 1.8 1.8 2.3
Number of UK volume car manufacturers 7 7 7 7 7
Number of UK volume commercial vehicle manufacturers 9 9 9 8 8
research and development, technology and innovationThe automotive industry has been a constant innovator of new products to encourage safer and greener motoring. At €20 billion per year, the automotive sector is Europe’s largest investor in R&D, driving industry forward and helping to deliver more sustainable motoring for the 21st century.
In 2012, the government confirmed that an ‘above the line’ R&D tax credit will be introduced from April 2013 with a minimum rate of 9.1% before tax. The change is likely to make projects more affordable at the relevant decision making point by an R&D team, which should encourage higher spend in the UK.
The 2012 Budget also outlined that non-profit making companies will be able to claim a payable credit. Sending a strong signal to international investors, the move could see an additional £390 million of R&D investment in the UK each year and increased economic output of £665 million in the short term.
Source: R&D tax relief reform – an economic study (EEF, SMMT and PwC) 2011
To highlight the varied challenges facing the automotive industry and its response to them, SMMT launched its annual ‘Award for Automotive Innovation’ to encourage and recognise the creation
and development of new innovative products, technologies and ideas that could change the face of the UK automotive industry. For more information, visit: www.smmt.co.uk/aai.
uK sector profile
www.smmt.co.uk 9

Financière SNOP Dunois Group, SunderlandRe-opening of a factory in Washington, Sunderland, to supply vehicle parts to Nissan. The company is investing £5 million and creating 130 new jobs, with plans for further expansion.
8
1
242
2
3
77
1118
16
13
5
5
6
10
10
9
10
12
14
15
3
17
AAM Europe, GlasgowNew manufacturing and engineering centre of excellence in Glasgow, supporting around 80 jobs. The company announced a £3.6m investment, with more than £500,000 from the Scottish government.
BMW Group, Hams Hall
BMW Group, Oxford
Ford, LondonDTR VMS, Trowbridge
MG, Longbridge
BMW Group, SwindonToyoda Gosei, Swansea
Honda, Swindon
GKN, BirminghamIAC, Solihull
Jaguar Land Rover, Castle BromwichJaguar Land Rover, Solihull
IAC, Scunthorpe
GKN, Telford
Futaba Industrial UK, Derbyshire
Calsonic Kansei, North East
ElringKlinger, Teeside
Unipres, Wearside
Infiniti, SunderlandLear Corporation, SunderlandNissan, Sunderland
Cartwright, AltrinchamPirelli, Carlisle
Jaguar Land Rover, Halewood
Jaguar Land Rover, Ellesmere PortAdditional £1 billion to the UK automotive supply chain over the next four years and a new logistics facility in Ellesmere Port, creating around 300 new jobs.
Vauxhall, Ellesmere Port
Brose, North Warwickshire
McLaren, WokingNew facility in Woking for its F1 and sports car operations, creating 400 new jobs.
BMW GroupHams Hall, Oxford and Swindon£250 million investment by the end of 2015 at Hams Hall, Oxford and Swindon plants.
industry performance
new investment to support growthThe automotive industry is truly global. Attracting inward investment to the UK remains a high priority for industry and government.
2012 saw a number of high-profile announcements from global OEMs regarding investment in the UK automotive sector.
For details, visit www.smmt.co.uk/investment
2012 investment announcements
www.smmt.co.uk 10

industry performance
the uK supply chain• OfallUKsuppliers,morethan70%manufacturetheir
products in the UK.
• Atpresent,about80%ofallcomponenttypesrequiredfor vehicle assembly operations can be procured from UK suppliers.
• TheUKautomotivesupplychaintypicallygenerates£4.8bn of added value annually.
• Therearearound2,350UKcompaniesthatregardthemselves as ‘automotive’ suppliers, employing around 82,000 people (2009 data).
• ItisestimatedthateveryjobinUKvehicleassemblysupports7.5elsewhereintheeconomy.
• UK-basedOEMsareactivelycommittedtoincreasinglocal sourcing practices to support new model programmes and facility expansion.
growing the supply chainThe strength and capability of the automotive supply chain is a crucial factor in driving growth and attracting inward investment. In 2012, the Automotive Council identified more than £3bn worth of opportunities available to domestic suppliers and international companies wishing to invest in the UK. The report Growing the Automotive Supply Chain: The road forward found that increasing high-value international investment in UK automotive has created a wealth of new opportunities at every level of the supply chain. To maximise these opportunities UK automotive suppliers need:
• Accesstospecialistfinanceoptionstosupportgrowth.
• Tobuildaglobally-competitiveskillset.
• Toinvestininnovation,R&Dandcapitalequipment.
• Toachieveglobalquality,costanddelivery.
For more information on strengthening the UK supply chain, visit www.automotivecouncil.co.uk.
SMMT is committed to strengthening the UK supply chain and hosts a number of events and activities to support suppliers and encourage greater levels of local sourcing. To find out more about SMMT’s supply chain activities, visit: www.smmt.co.uk/supply-chain.
www.smmt.co.uk 11

employment, skills and training did you know? • Fromdesignandmanufacturingtoretailand
aftermarket services, the UK automotive industry offers a range of fantastic career opportunities.
• Therearearound720,000peopleemployedacrossthe automotive industry, with 140,000 people directly employed in manufacturing1.
• Newinvestmentpledgedbyglobalvehiclemanufacturers during the last two years has created more than 19,000 new jobs at facilities and in the supply chain, safeguarding thousands more2.
• Approximately50,000peopleareemployedinUKmotorsportandmorethan7,500jobsarewithinautomotive R&D1.
skills, apprenticeships and training in the automotive sector Industry fully recognises the importance of attracting the brightest and best talent into the sector, and invests heavily in apprenticeships as well as long-term training and development programmes.
Key facts: • Morethan75,000youngpeoplehavebeenemployed
as apprentices in engineering and manufacturing industries during the last five years, maintaining a large, highly-skilled talent pool3.
• ApprenticeshipstartsinUKengineeringandadvanced manufacturing industries have increased by more than 85% in the past two years3.
• Thereareapproximately18,000apprenticesworkingin automotive retail at any one time4.
• TosupportthedevelopmentofapprenticeshipsintheUK,thegovernmentlaunchedtheHigherApprenticeship Fund in 2012. The fund is available to a number of key sectors identified by government including automotive and is worth £6 million.
see inside manufacturing See Inside Manufacturing is a careers-focused initiative designed to give young people a behind-the-scenes glimpse of life in the manufacturing sector, the potential for jobs and the rewards it offers.
UK automotive trail-blazed this programme in 2011 with more than 40 companies inviting pupils, teachers and careers advisors to experience first-hand some of the UK’s world-class automotive and motorsport facilities and research centres.
In 2012, the UK automotive industry once again played a significant role in the initiative alongside two other sectors that were introduced - aerospace and defence and food and drink.
The programme is returning again in 2013 and is open to all young people in the UK, providing a unique opportunity to learn about modern manufacturing and the range of jobs available in these diverse sectors.
Sources:1. SMMT’s 13th Annual Sustainability Report2. www.smmt.co.uk/investment 3. Semta, www.semta.org 4. IMI Automotive Skills Sector Qualifications Strategy, Nov 2011
industry performance
www.smmt.co.uk 12

industry performance
legislation in the automotive industryThe automotive industry is subject to numerous national, EU and global laws and regulations including those relating to vehicle safety and environmental issues such as emissions levels, fuel economy and manufacturing practices.
Key environmental legislation There are several recent environmental policies that are now impacting the automotive industry including:
• new car co2 regulation In 2009, legislation was passed that committed European car manufacturers to cut fleet average CO2 emissions from new cars to 130g/km by 2015 and 95g/km by 2020. The legislation sets out a progressive phase-in for car manufacturers with 65% of new cars averagingthe130g/kmtargetby2012,75%by2013,80% by 2014 and 100% by 2015. Derogations exist for niche and small volume manufacturers.
• van co2 regulation The Van (Light Commercial Vehicle) CO2 Regulation setsaEuropeanfleetaveragetargetof175CO2 g/km, phased in between 2014-2016 and a long-term targetof147g/kmin2020.Eachmanufacturer’starget is based on the weight of each new van it registers in the EU in a given year.
• euro standards Euro engine emission standards were introduced in the early 1990s to reduce pollutants from vehicles. They have led to significant improvements in emissions of nitrogen oxides, particulates and hydrocarbons from passenger cars, vans and trucks. Euro V is already standard for all new cars and commercial vehicles. Euro VI will apply to newly-registered heavy commercial vehicles from 2014, cars from September 2015, and vans from September 2016.
• energy efficiency regimes In addition to efforts to reduce CO2 from vehicle tailpipes, industry is also committed to reducing emissions from the manufacturing process. There are several energy efficiency regimes that the industry is covered by including the mandatory EU Emissions Trading Scheme (EUETS), the voluntary UK Climate Change Agreements (CCAs), and the UK Carbon Reduction Commitment (CRC) energy efficiency scheme.
For more information on how the automotive industry is reducing its environmental impacts, visit www.smmt.co.uk/sustainability.
The 14th edition of SMMT’s Annual Sustainability Report will be published in 2013.
www.smmt.co.uk 13

industry performance
other key legislation• vehicle safety - esc
From 1 November 2011 all new type approved vehicles were required to have Electronic Stability Control fitted as standard and from 1 November 2014 all newly-registered vehicles must also comply. ESC helps significantly to reduce the risk of a vehicle sliding if a bend is taken too fast or skidding during a sudden emergency manoeuvre. ESC identifies the risk early and stabilises the car by managing braking and/or power delivery to individual wheels.
• tyre pressure monitoring systems (tpms) From 1 November 2012 all new type approved vehicles were required to have Tyre Pressure Monitoring Systems fitted as standard and from 1 November 2014 all newly-registered vehicles must also comply. By continuously monitoring the pressure of the tyres, TPMS alerts the driver to under-inflation. Failure to maintain the correct tyre pressure leads to increased fuel consumption and shorter tyre life.
www.smmt.co.uk 14
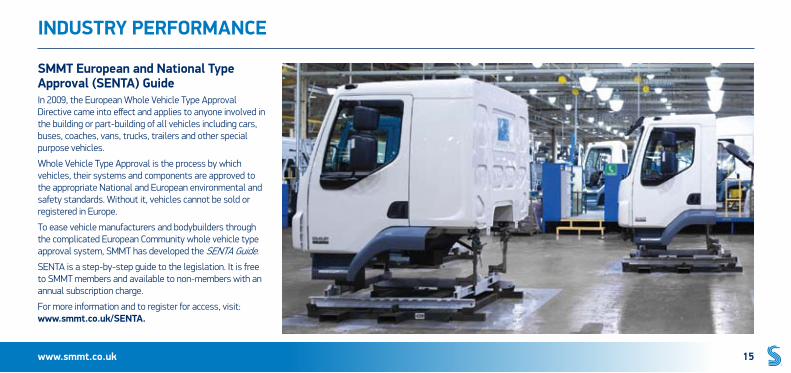
smmt european and national type approval (senta) guideIn 2009, the European Whole Vehicle Type Approval Directive came into effect and applies to anyone involved in the building or part-building of all vehicles including cars, buses, coaches, vans, trucks, trailers and other special purpose vehicles.
Whole Vehicle Type Approval is the process by which vehicles, their systems and components are approved to the appropriate National and European environmental and safety standards. Without it, vehicles cannot be sold or registered in Europe.
To ease vehicle manufacturers and bodybuilders through the complicated European Community whole vehicle type approval system, SMMT has developed the SENTA Guide.
SENTA is a step-by-step guide to the legislation. It is free to SMMT members and available to non-members with an annual subscription charge.
For more information and to register for access, visit: www.smmt.co.uk/senta.
industry performance
www.smmt.co.uk 15
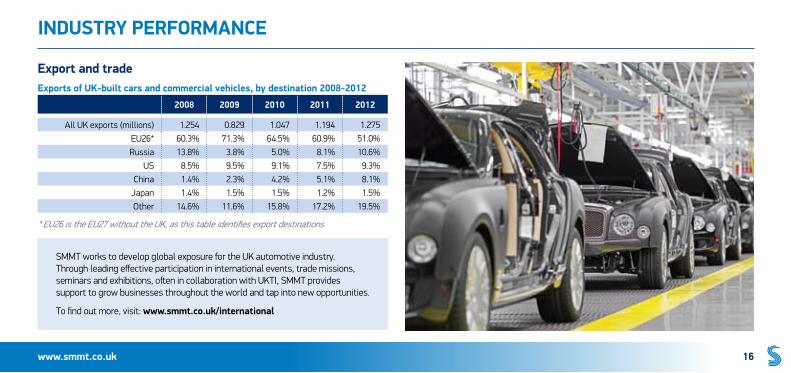
export and tradeexports of uK-built cars and commercial vehicles, by destination 2008-2012
industry performance
www.smmt.co.uk 16
SMMT works to develop global exposure for the UK automotive industry. Through leading effective participation in international events, trade missions, seminars and exhibitions, often in collaboration with UKTI, SMMT provides support to grow businesses throughout the world and tap into new opportunities.
To find out more, visit: www.smmt.co.uk/international
2008 2009 2010 2011 2012
All UK exports (millions) 1.254 0.829 1.047 1.194 1.275EU26* 60.3% 71.3% 64.5% 60.9% 51.0%Russia 13.8% 3.8% 5.0% 8.1% 10.6%
US 8.5% 9.5% 9.1% 7.5% 9.3%China 1.4% 2.3% 4.2% 5.1% 8.1%
Japan 1.4% 1.5% 1.5% 1.2% 1.5%Other 14.6% 11.6% 15.8% 17.2% 19.5%
*EU26istheEU27withouttheUK,asthistableidentifiesexportdestinations

uK automotive manufacturing
top five uK automotive manufacturers 2012
car
make volume
Nissan 510,572
Land Rover 305,467
MINI 207,530
Honda 165,630
Toyota 109,429
model
make model volume
Nissan Qashqai 310,837
MINI MINI 207,530
Nissan Juke 154,759
Land Rover Evoque 112,331
Vauxhall Astra 90,187
commercial vehicle
make volume
Vauxhall 59,472
Ford 28,031
Leyland Trucks 14,685
Land Rover 6,281
Alexander Dennis 1,762
www.smmt.co.uk 17

Key uK manufacturing sites
uK automotive manufacturing
www.smmt.co.uk 18
Key manufacturer location sector model
1 Alexander Dennis Falkirk and Guildford
Bus and coach Enviro bus range
2 Aston Martin Gaydon Car Cygnet, DB9, Rapide, Vanquish, Vantage
3 Bentley Crewe Car, engine Continental and Mulsanne
4 BMW HamsHall Engine Engine range
5 Caterham Dartford Car Seven
6 Cummins Darlington Engine Engine range
7 Dennis Eagle Warwick CV N and W truck range
8 Euromotive Hythe Bus and coach Minibus range
9 FordBridgend, Dagenham and Southampton
Engine Engine range
10 Honda Swindon Car, engine Civic, CR-V and Jazz
Key manufacturer location sector model
11 Jaguar Castle Bromwich Car XJ, XF, XK
12 John Dennis Coachbuilders Guildford Bus and
coach Minibus range
13 Land Rover HalewoodandSolihull Car and CV
Defender CV, Defender, Discovery, Evoque, Freelander and Range Rover
14 Leyland Trucks Leyland CV DAF CF, LF and XF truck range
15 Lotus Norwich Car Elise, Evora and Exige
16 LTI Coventry CV TX Taxi
17 Mellor Coachcraft Bolton Bus and coach Minibus range
18 McLaren Automotive Woking Car MP4-12C
19 MG Motors Longbridge Car MG6
20 MichelinBallymena (NI), Dundee and Stoke-on-Trent
Tyre Car, Truck and Truck remould tyre range

1218
18
16
2
3
22
20
2110
4
6
7 26
8
9 5
3031
1113
1314
15
17
19
23
24
28
25
26
27
1
1
20
29
3029
20
921
200032
9
www.smmt.co.uk 19
uK automotive manufacturingKey manufacturer location sector model
21 MINI Oxford and Swindon Car and CV MINI range
22 Minibus Options Whaley Bridge Bus and coach Minibus range
23 Morgan Malvern Car Aero, 4/4, Plus 4, Plus 8, Roadster
24 Nissan Sunderland Car, engine Juke, LEAF, Note and Qashqai
25 Optare Leeds Bus and coach Solo,Tempo and Versa bus range
26 Plaxton Scarborough Bus and coach
Cheetah, Elite, Panther, Paragon coach bodies and Enviro bus range
27 Rolls-Royce Goodwood Car Ghost and Phantom
28 Smith (Tanfield) Tyne and Wear CV Newton and Edison
29 Toyota Burnaston and Deeside Car, engine Auris and Avensis
30 Vauxhall Ellesmere Port and Luton
Car, CV and Bus and coach
Astra, Vivaro van and minibus range
31 Warnerbus Dunstable Bus and coach Minibus range
32 Wrightbus Ballymena (NI) Bus and coach Bus range

uK car manufacturing output annual totals
uK automotive manufacturing
year production % change home market % change % of total export
market % change % of total
2003 1,657,558 1.7% 523,799 -10.1% 31.6% 1,143,759 9.2% 69.0%
2004 1,646,750 -0.7% 463,994 -11.4% 28.2% 1,179,756 3.1% 71.6%
2005 1,595,697 -3.1% 411,194 -11.4% 25.8% 1,184,503 0.4% 74.2%
2006 1,442,085 -9.6% 343,937 -16.4% 23.8% 1,106,093 -6.6% 76.7%
2007 1,534,567 6.4% 349,108 1.5% 22.7% 1,185,459 7.2% 77.3%
2008 1,446,619 -5.7% 318,033 -8.9% 22.0% 1,128,586 -4.8% 78.0%
2009 999,460 -30.9% 237,226 -25.4% 23.7% 762,234 -32.5% 76.3%
2010 1,270,444 27.1% 309,024 30.3% 24.3% 961,420 26.1% 75.7%
2011 1,343,810 5.8% 219,134 -29.1% 16.3% 1,124,676 17.0% 83.7%
2012 1,464,906 9.0% 252,875 15.4% 17.3% 1,212,031 7.8% 82.7%
UKcarmanufacturingpeakedin1972at1.92millionunits,and 2003 saw the highest car output in recent years, totalling 1.65 million units. Although car manufacturing levels have not yet matched pre-recession levels, full year
2012 figures confirm that UK car manufacturing reached its highest since 2008 and broke all-time export records. The volume of cars sent overseas exceeded 1.2 million units, up 8% on 2011.
www.smmt.co.uk 20

uK commercial vehicle manufacturing output annual totals
uK automotive manufacturing
year production % change home market % change % of total export
market % change % of total
2003 188,871 -1.3% 85,954 11.6% 45.5% 102,917 -9.9% 54.5%
2004 209,293 10.8% 81,186 -5.5% 38.8% 128,107 24.5% 61.2%
2005 206,753 -1.2% 76,480 -5.8% 37.0% 130,273 1.7% 63.0%
2006 207,704 0.5% 71,485 -6.5% 34.4% 136,219 4.6% 65.6%
2007 215,686 3.8% 84,124 17.7% 39.0% 131,562 -3.4% 61.0%
2008 202,896 -5.9% 77,285 -8.1% 38.1% 125,611 -4.5% 61.9%
2009 90,679 -55.3% 24,225 -68.7% 26.7% 66,454 -47.1% 73.3%
2010 123,019 35.7% 37,472 54.7% 30.5% 85,547 28.7% 69.5%
2011 120,189 -2.3% 50,813 35.6% 42.3% 69,376 -18.9% 57.7%
2012 112,039 -6.8% 48,306 -4.9% 43.1% 63,733 -8.1% 56.9%
In the last decade, commercial vehicle manufacturing peakedat215,686unitsin2007,with61%ofvehiclesexported overseas. CV and engine manufacturing output
last year reflects weak demand in European economies as instability in the eurozone and fresh austerity measures impact on consumer confidence.
www.smmt.co.uk 21

engine output by manufacturer
uK automotive manufacturing
2008 2009 2010 2011 2012
Bentley 7,675 3,596 4,791 7,528 9,108
BMW 371,269 362,300 385,051 433,689 385,410
Ford (Bridgend) 704,181 683,340 680,717 714,709 741,754
Ford (Dagenham) 1,047,570 746,426 959,480 987,078 812,791
Honda 203,647 60,125 136,658 97,368 154,228
Nissan 112,829 108,955 105,766 135,958 267,839
Toyota 297,398 88,714 114,254 127,724 124,241
total 3,164,569 2,053,456 2,386,717 2,504,054 2,495,371
www.smmt.co.uk 22

global automotive manufacturing european manufacturing
uK automotive manufacturing
rank country cars cv total vehicles % change
1 Germany 5,388,456 260,813 5,649,269 -8.1%2 Spain 1,539,680 439,499 1,979,179 -16.6%3 France 1,682,814 284,951 1,967,765 -12.3%4 UK 1,464,906 112,039 1,576,945 7.7%5 Czech Republic 1,171,774 7,164 1,178,938 -1.7%6 Slovakia 900,000 0 900,000 40.7%7 Italy 396,817 274,951 671,768 -15.0%8 Poland 540,000 107,803 647,803 -22.7%9 Belgium 507,204 34,670 541,874 -8.9%
10 Romania 326,556 11,209 337,765 0.8%
Source: OICA 2013 – some data based on provisional estimates
in 2012, data collected by oica indicates a total of 63,069,541 cars and 21,071,668 commercial vehicles were manufactured around the world.
rank country cars cv total vehicles % change
1 China 15,523,658 3,748,150 19,271,808 4.6%2 US 4,105,853 6,223,031 10,328,884 19.3%3 Japan 8,554,219 1,388,492 9,942,711 18.4%4 Germany 5,388,456 260,813 5,649,269 -8.1%5 South Korea 4,167,089 390,649 4,557,738 -2.1%6 India 3,285,496 859,698 4,145,194 5.5%7 Brazil 2,623,704 718,913 3,342,617 -1.9%8 Mexico 1,810,007 1,191,967 3,001,974 12.0%9 Thailand 957,623 1,525,420 2,483,043 70.3%
10 Canada 1,040,298 1,423,434 2,463,732 15.4%11 Russia 1,968,789 262,948 2,231,737 12.1%12 Spain 1,539,680 439,499 1,979,179 -16.6%13 France 1,682,814 284,951 1,967,765 -12.3%14 UK 1,464,906 112,039 1,576,945 7.7%15 Czech Republic 1,171,774 7,164 1,178,938 -1.7%
www.smmt.co.uk 23

annual uK totals and top 10 cars
AFVDieselPetrol 0
0.5
1.0
1.5
2.0
2.5
3.0Vo
lum
e (m
illio
ns)
Year
2011
Tota
l 1,9
41,2
53
934,203
981,594
25,456
2012
Tota
l 2,0
44,6
09
978,089
1,038,679
27,841
2003
Tota
l 2,5
79,0
50
1,870,147
704,637
4,266
2004
Tota
l 2,5
67,2
691,727,717
835,334
4,218
2005
Tota
l 2,4
39,7
17
1,535,575
897,887
6,255
2006
Tota
l 2,3
44,8
64
1,436,904
898,521
9,439
2007To
tal 2
,404
,007
1,419,931
967,436
16,640
2008
Tota
l 2,1
31,7
95
1,187,360
928,605
15,830
2009
Tota
l 1,9
94,9
99
1,147,580
832,456
14,963
2010
Tota
l 2,0
30,8
46
1,071,574
936,407
22,865
top 10 cars registered in 2012
make and model volume
1 Ford Fiesta 109,265
2 Vauxhall Corsa 89,434
3 Ford Focus 83,115
4 Vauxhall Astra 63,023
5 Volkswagen Golf 62,021
6 Nissan Qashqai 45,675
7 BMW 3 Series 44,521
8 Volkswagen Polo 41,901
9 Mercedes-Benz C-Class 37,261
10 BMW 1 Series 34,488
2003 2004 2005 2006 2007 2008 2009 2010 2011 2012
registered 2,579,050 2,567,269 2,439,717 2,344,864 2,404,007 2,131,795 1,994,999 2,030,846 1,941,253 2,044,609
% change 0.6 -0.5 -0.5 -3.9 2.5 -11.3 -6.4 1.8 -4.4 5.3
www.smmt.co.uk 24
new car registrations

2012 total new car registrations across the uK
% change 2012 vs 2011
West Midlands 9.8%
Scotland 8.9%
Wales 7.1%
North East 6.8%
YorkshireandtheHumber 6.4%
East of England 6.1%
South East 5.4%
North West 4.2%
South West 2.9%
Northern Ireland 0.6%
East Midlands -2.1%
Isle of Man -2.9%
Channel Islands -23.4%
total uK 5.3% channel islands
7,186
2012 total new car registrations across the uK
2,044,609East of England 69,223
East midlands
147,435
isle of man
1,322
north West
184,614northern ireland
47,519
south East
632,586south West
177,691
Wales
66,564West midlands
273,956
yorks/Humberside
169,647
north East
85,081
scotland
181,785
www.smmt.co.uk 25
new car registrations

20,000
25,000
30,000
15,000
new car registrations
alternatively-fuelled vehicle registrations by fuel typeAlternatively-Fuelled Vehicles (AFVs) include any vehicle that is not powered solely by a petrol or diesel engine.
fuel type 2008 2009 2010 2011 2012
Diesel/Electric - - - 25 1,284
Pure Electric 70 20 138 1,082 1,262
Petrol/Alcohol 240 140 429 884 639
Petrol/Electric 15,385 14,645 22,148 23,373 24,086
Petrol/Gas 26 156 121 76 48
Electric
Petrol/alcohol
Diesel/electric
Petrol/electric
Petrol/gas
volu
me
year
afv registrations by fuel type
201020092008 2011 2012
Note: Quadricycles are not counted in SMMT’s Pure Electric classification.
www.smmt.co.uk 26

new car registrations
registration typesbusiness If the vehicle is being sold to/registered by a company that operates up to 24 vehicles, it should be designated a business sale. This includes dealer demonstrators.
fleet If the vehicle is being registered by a company that operates a fleet of 25 or more vehicles, it should be designated a fleet sale. This includes dealer demonstrators and Motability-leased vehicles.
private If the vehicle is being registered primarily for the personal use of a private individual, it should be designated a private sale.
www.smmt.co.uk 27
business, fleet and private registrations top 10 fleet and business registrations
registrations by sales type
2008 2009 2010 2011 2012
Business 129,571 98,282 99,608 99,033 89,668
Fleet 1,109,964 882,413 973,233 1,019,126 1,025,501
Private 892,260 1,014,304 958,005 823,094 929,440
make range volume
Ford Focus 60,522
Ford Fiesta 50,357
Vauxhall Corsa 49,670
Vauxhall Astra 45,651
Volkswagen Golf 38,103
BMW 3 Series 30,757
Nissan Qashqai 30,220
Vauxhall Insignia 29,315
Mercedes-Benz C-Class 22,485
Ford Mondeo 20,477

new car registrations
segment totals and market sharesegment 2003 2004 2005 2006 2007 2008 2009 2010 2011 2012
Mini (A) %
38,940 1.5
36,171 1.4
27,195 1.1
23,297 1.0
21,512 0.9
28,094 1.3
68,098 3.4
53,388 2.6
42,061 2.2
64,866 3.2
Supermini (B) %
873,690 33.9
839,604 32.7
732,756 30.0
752,872 32.1
783,686 32.6
726,006 34.1
742,153 37.2
739,615 36.4
703,925 36.3
743,488 36.4
Lower Medium (C) %
719,163 27.9
729,690 28.4
761,328 31.2
695,436 29.7
708,927 29.5
605,817 28.4
530,849 26.6
539,403 26.6
489,900 25.2
508,262 24.9
Upper Medium (D) %
480,220 18.6
459,061 17.9
427,278 17.5
393,999 16.8
386,414 16.1
340,796 16.0
283,552 14.2
264,251 13.0
256,437 13.2
237,664 11.6
Executive (E) %
118,579 4.6
109,667 4.3
111,112 4.6
100,339 4.3
104,468 4.3
98,572 4.6
90,114 4.5
99,079 4.9
110,246 5.7
117,292 5.7
Luxury (F) %
13,500 0.5
13,620 0.5
11,678 0.5
13,227 0.6
13,120 0.5
9,977 0.5
6,547 0.3
8,140 0.4
8,647 0.4
8,088 0.4
Specialist Sports (G) %
65,179 2.5
73,940 2.9
64,681 2.7
65,039 2.8
65,731 2.7
50,256 2.4
46,467 2.3
46,210 2.3
44,389 2.3
46,127 2.3
DualPurpose(H) %
159,144 6.2
179,439 7.0
187,392 7.7
175,805 7.5
176,290 7.3
136,525 6.4
132,472 6.6
156,552 7.7
165,997 8.6
201,102 9.8
Multi-Purpose (I) %
110,635 4.3
126,077 4.9
116,297 4.8
124,850 5.3
143,859 6.0
135,752 6.4
94,747 4.7
124,208 6.1
119,651 6.2
117,720 5.8
total 2,579,050 2,567,269 2,439,717 2,344,864 2,404,007 2,131,795 1,994,999 2,030,846 1,941,253 2,044,609
www.smmt.co.uk 28

new car registrations
mini lower medium
model registrations market share
Hyundaii10 23,135 35.7%
Volkswagen up! 14,705 22.7%
Suzuki Alto 5,416 8.4%
Vauxhall Agila 4,656 7.2%
smart fortwo coupé 4,481 6.9%
segment total - 64,866
model registrations market share
Ford Fiesta 109,265 14.7%
Vauxhall Corsa 89,434 12.0%
Volkswagen Polo 41,901 5.6%
Fiat 500 32,973 4.4%
MINI 32,729 4.4%
segment total - 743,488
model registrations market share
Ford Focus 83,115 16.4%
Vauxhall Astra 63,023 12.4%
Volkswagen Golf 62,021 12.2%
Nissan Qashqai 45,675 9.0%
BMW 1 Series 34,488 6.8%
segment total - 508,262
top cars registered by segment
supermini
www.smmt.co.uk 29

new car registrations
upper medium executive luxury saloon
model registrations market share
BMW 3 Series 44,521 18.7%
Vauxhall Insignia 32,610 13.7%
Volkswagen Passat 21,957 9.2%
Ford Mondeo 21,662 9.1%
Audi A4 20,089 8.5%
segment total – 237,664
model registrations market share
Mercedes-Benz C-Class 37,261 31.8%
Mercedes-Benz E-Class 23,594 20.1%
BMW 5 Series 21,566 18.4%
Audi A6 13,097 11.2%
Jaguar XF 11,726 10.0%
segment total – 117,292
model registrations market share
Mercedes-Benz S-Class 1,864 23.1%
Jaguar XJ 1,286 15.9%
BMW7Series 1,278 15.8%
Audi A8 1,172 14.5%
Bentley Continental 1,139 14.1%
segment total – 8,088
top cars registered by segment
www.smmt.co.uk 30

new car registrations
specialist sports dual purpose mpv
model registrations market share
Mercedes-Benz SLK 6,668 14.5%
Audi TT 6,170 13.4%
Volkswagen Scirocco 5,173 11.2%
Mazda MX-5 3,342 7.3%
MINI Coupé 2,592 5.6%
segment total – 46,127
model registrations market share
Range Rover Evoque 18,143 9.0%
Kia Sportage 14,964 7.4%
HondaCR-V 13,649 6.8%
Land Rover Freelander 11,139 5.5%
Hyundaiix35 11,053 5.5%
segment total – 201,102
model registrations market share
Vauxhall Zafira 18,401 15.6%
Ford C-MAX 16,712 14.2%
Ford S-MAX 8,839 7.5%
Ford Galaxy 7,828 6.7%
Mercedes-Benz B-Class 6,594 5.6%
segment total – 117,720
top cars registered by segment
www.smmt.co.uk 31

country volume
china1 13,196,128
Eu272 12,046,189
usa3 7,248,910
Japan4 4,572,333
Germany2 3,082,580
russia5 2,935,111
Brazil6 2,851,540
india7 2,654,835
uK2 2,044,609
france2 1,898,760
italy2 1,402,089
spain2 699,589
international new car registrations 2012
Sources: 1: China Association of Automobile Manufacturers (CAAM) 2: Association des Constructeurs Européens d’Automobiles (ACEA) 3: Alliance of Automobile Manufacturers (Auto Alliance) 4: Japan Automobile Manufacturers Association (JAMA) 5: Association of European Business in the Russian Federation (AEB) 6: Associação Nacional dos Fabricantes de Veículos Automotores (ANFAVEA) 7:SocietyofIndianAutomobileManufacturers(SIAM)
new car registrations
www.smmt.co.uk 32

annual uK van and truck registrations total uK cv registrations
year lcvs up to 3.5t
% change on year before
rigids% change on year before
artics% change on year before
2003 303,755 14.0% 36,788 4.7% 18,802 12.0%
2004 329,599 8.5% 37,461 1.8% 18,851 0.3%
2005 322,930 -2.0% 38,957 4.0% 19,884 5.5%
2006 327,162 1.3% 36,973 -5.1% 18,601 -6.5%
2007 337,741 3.2% 35,614 -3.7% 15,133 -18.6%
2008 289,463 -14.3% 38,651 8.5% 18,759 24.0%
2009 186,386 -35.6% 24,973 -35.4% 9,773 -47.9%
2010 222,915 19.6% 22,383 10.4% 12,075 23.6%
2011 260,153 16.7% 24,524 9.6% 18,420 52.5%
2012 239,641 -7.9% 28,605 16.6% 17,097 -7.2%
225
250
275
300
325
350
375
400
volu
me
(tho
usan
ds)
year
2006
386,
968
0.25
%
2005
385,
969
-1.0
%
2011
306,
488
17.6
%
2010
260,
599
15.5
9%
2012
293,
445
-4.2
6%
2003
363,
687
12.9
%
2004
389,
923
2.8%
2007
392,
481
1.5%
2008
351,
384
-10.
5%
2009
225,
455
-35.
8%
www.smmt.co.uk 33
commercial vehicle registrations

annual uK bus and coach registrations
2500
3000
3500
4000
4500
5000
volu
me
2006
4,23
20.
8%
2005
4,19
84.
6%
2011
3,39
15.
1%
20103,
226
-25.
4%2012
3,81
112
.4%
2003
4,34
210
.7%
2004
4,01
2-7
.6%
2007
3,99
3-5
.4%
2008
4,51
112
.9%
2009
4,32
3-4
.2%
year
www.smmt.co.uk 34
commercial vehicle registrations

used car sales 2008-2012
number of cars on the road 2003-2012
0
5
10
15
20
25
30
volu
me
(mill
ions
)
2012
31,4
81,8
23
2003
29,7
21,2
16
2004
30,0
89,7
12
2005
30,4
77,0
58
2006
30,8
17,0
36
2007
31,1
05,9
88
2008
31,2
52,4
76
209
31,0
35,7
91
2010
31,2
58,1
97
year volume
2008 7,186,286
2009 6,798,864
2010 6,797,789
2011 6,778,759
2012 6,743,080
in 2012, some 15% of the car parc emitted 130g/km co2 or less.
Source: ©Experian Ltd. All rights reserved. Reproduced by SMMT with permission. No third party reproduction without prior written consent from copyright owner.
year
2011
31,3
62,7
16
www.smmt.co.uk 35
vehicles in use

cars on uK roads by region in 2012
% change 2012 vs 2011
South West 0.9%
East Anglia 0.8%
South East 0.7%
Scotland 0.6%
Northern Ireland 0.5%
YorkshireandHumberside 0.3%
East Midlands 0.3%
Wales 0.3%
North East -0.2%
North West -0.4%
West Midlands -0.4%
uK total 0.4%
East anglia
1,316,165
East midlands
2,253,814
north West
3,027,000northern ireland
996,273
south East
9,759,012south West
3,035,396
Wales
1,570,575
West midlands
3,160,304
yorkshire and Humberside
2,477,796
north East
1,399,216
scotland
2,485,999
vehicles in use
total number of cars on uK roads in 2012
31,481,823
www.smmt.co.uk 36

top five colours in 2012
colour volumes % of total parc
Silver 8,000,859 25.4%
Blue 6,643,045 21.1%
Black 5,606,104 17.8%
Red 3,483,638 11.1%
Grey 3,261,933 10.4%
age of cars on the road colours of cars on the road 2003 versus 2012top five colours in 2003
colour volumes % of parc
Blue 7,235,456 24.9%
Red 5,790,899 20.0%
Silver 5,033,852 17.4%
Green 3,358,334 11.6%
Black 2,348,798 8.1%
TheaverageageofacaronUKroadsis7.25years
years old year volume
Less than three 2012-2010 5,934,404
Three to six 2009-2007 6,338,691
Six to nine 2006-2004 6,948,141
Nine to twelve 2003-2001 6,584,857
More than twelve Pre-2001 5,675,730
total 31,481,823
vehicles in use
the average car on the road in the uK is silver, from the supermini segment and aged 7.6 years.
www.smmt.co.uk 37

2003 2004 2005 2006 2007 2008 2009 2010 2011 2012
LCV 2,979,759 3,109,744 3,227,461 3,420,620 3,545,724 3,600,116 3,534,664 3,566,460 3,614,664 3,631,595
HCV 587,862 580,718 586,129 595,266 598,447 589,129 558,076 563,295 563,872 557,128
Bus and coach 101,069 102,978 103,175 102,401 103,817 95,961 88,779 90,700 91,105 90,355
total cv 3,668,690 3,793,440 3,916,765 4,118,287 4,247,988 4,285,206 4,181,519 4,220,455 4,269,641 4,279,078
annual totals of commercial vehicles on uK roads 2003-2012
vehicles in use
www.smmt.co.uk 38

Business
Cars
Energy supply
Other
Other road transport
Other transport
Residence
uK co2 emissions by source (mtco2e) mtco2e = million tonnes carbon dioxide equivalent
source category 2009 2010 % change
Cars 69.7 67.4 -3.3
Other road transport 41.4 43.7 5.5
Other transport 52.8 49.7 -5.8
Energy supply 189.8 195.7 5.9
Business 76 75.6 -0.4
Residence 74.7 86.5 15.8Other 16.4 17.4 6.0
environmental performance
12.6%
8.2%
36.5%
14.1%
16.1%Business
Cars
Energy supply
Other
Other road transport
Other transport
Residence
Source: Department of Energy and Climate Change (DECC)
3.2%
9.3%
www.smmt.co.uk 39

environmental performance
sustainable manufacturing Since SMMT began collating data on sustainable manufacturing processes in 1999, vehicle manufacturers have made great strides in reducing the environmental impact of their UK facilities, making more efficient use of natural resources.
Despite an inherent link between production volumes and resource consumption, the automotive industry has improved energy efficiency considerably and applied a closed loop approach to materials management.
In 2011, UK vehicle manufacturers reduced energy consumption per vehicle produced by 14%.
2010 2011 percentage change
production inputs
Total combined energy use (GWh) (AS) 4,659 4,381 -6.0
Energy used per vehicle produced (MWh/unit) (VMs) 2.6 2.2 -14.0
Total combined water use (000m3) (AS) 5,468 4,875 -10.8
Water use per vehicle produced (m3/unit) (VMs) 3.2 2.8 -14.9
material output
Total combined CO2 equivalents (tonnes) (AS) 1,442,896 1,395,233 -3.3
CO2 equivalents per vehicle produced (tonnes/unit) (VMs) 0.8 0.7 -13.3
Volatile Organic Compounds emissions (cars) (g/m2) (VMs) 36 35 -0.6
Volatile Organic Compounds emissions (vans) (g/m2) (VMs) 64 61 -4.1
Total combined waste to landfill (tonnes) (AS) 18,302 13,971 -23.7
Waste to landfill per vehicle produced (kg/unit) (VMs) 8.8 7.1 -19.8
vehicle use
Average new car CO2 emissions (g/km) (AC) 144.2 138.1 -4.2
environmental performance
www.smmt.co.uk 40

carbon footprint through the life cycleThe ‘use’ phase is one of the most significant environmental, social and economic impacts in a vehicle’s life cycle. These proportions are expected to change as alternative fuels and new technologies, such as hybrids and pure electric vehicles, penetrate the market further.
production includes: • Manufacturing • Logistics • Energyforsalesandsupportfunctions
use includes: • CO2 from distance driven • CO2 from servicing and aftermarket functions
recycling includes: • CO2 from managing end-of-life vehicles (ELVs)
end-of-life vehicles (elvs)The UK automotive industry is not only committed to sustainable manufacturing, but also sustainability at the end of the product’s life. The ELV Directive aims to reduce the amount of waste going to landfill from vehicles (cars and LCVs) when they are finally scrapped.
Vehicle manufacturers’ recycling networks have achieved the 85% (by weight) recycling/recovery target imposed by the End-of-Life Vehicle Directive since its introduction in 2006. The automotive industry also supports the recycling industry’s moves to develop new processes to meet the challenging 95% recycling/recovery target by 2015. 10% of this target can be met through energy recovery.
Production 10%
Recycling 5%
Use 85%
85%
5% 10%
co2 emissions through the vehicle life cycle
www.smmt.co.uk 41
environmental performance

uK average new car co2 emissions
140
145
135
130
150
155
160
165
170
175
180
185
co2 g
/km
-1.2
%
-0.4
%
-1.2
%
-1.3
%
-1.4
%
-4.2
%
144.
2 -3
.5%-5
.4%
172.
1
171.
4
169.
4
167.
2
164.
9
158.
0
149.
5
138.
1 -4
.2%
In 2009, a new EU regulation on emissions targets was passed which committed European vehicle manufacturers to cut average CO2 emissions from new cars to 130g/km by 2015 and about 95g/km by 2020. The average CO2 emissions of new cars sold in the UK in 2012 was 133.1g/km.
helping motorists to save fuelIn addition to producing ever more efficient powertrains, manufacturers have designed various innovations to help drivers save fuel and lower CO2 emissions.
• stop-start technologies automatically cut the engine when a vehicle is stationary. The engine is re-started by releasing the brake or depressing the clutch.
• tyre pressure monitoring systems measure the pressure of each of the tyres and will give a warning through the dashboard display if they become under-inflated.
• Gear shift indicators show the driver the optimum time to change gear (up and down) while driving.
• Low rolling resistance tyres are designed to improve the fuel efficiency of a vehicle by minimising the energy wasted when the tyre rolls down the road. The new industry tyre labelling scheme indicates fuel efficiency using a rating scale from A (most efficient) to G (least efficient). The difference between an A rating and a G rating could beareductioninfuelconsumptionofupto7.5%.
2003 2004 2005 2006 2007 2008 2009 2010 2011 2012
133.
1
-3.
6%
www.smmt.co.uk 42
environmental performance

change in average new car g/km co2 emissions by segment 2012 v 2011 and 2003
-5%
-10%
-15%
-20%
-25%
-30%
-35%
% change 2012 versus 2011
% change 2012 versus 2003
0%mini
supermini
Lower medium
upper medium
Executive
Luxuryspecia
list sports
dual Purpose 4x4
mPV
% c
hang
e in
co
2g/k
m
total
www.smmt.co.uk 43
environmental performance

new car market by ved band
For cars registered since 2001, Vehicle Excise Duty (VED or ‘road tax’) is based on tailpipe CO2 emissions with the amount payable scaling with the level of emissions. For more detail on VED refer to page 49.
ved band 2012 market share (%)
Volume Average CO2 2012 2011 2003
A (up to 100g/km) 175,056 95.8g/km 8.6% 3.4% 0.0%
B (101-110g/km) 227,869 107.4g/km 11.1% 10.6% 0.3%
C (111-120g/km) 357,840 116.7g/km 17.5% 17.0% 2.7%
D (121-130g/km) 371,300 127.1g/km 18.2% 14.9% 1.9%
E (131-140g/km) 352,397 136.3g/km 17.2% 18.4% 10.0%
F (141-150g/km) 194,570 146.5g/km 9.5% 10.5% 19.3%
G (151-165g/km) 164,492 157.3g/km 8.0% 11.9% 21.2%
H(166-175g/km) 59,145 170.7g/km 2.9% 3.8% 9.7%
I(176-185g/km) 40,491 180.5g/km 2.0% 3.7% 8.1%
J (186-200g/km) 48,475 192.8g/km 2.4% 2.7% 9.1%
K (201-225g/km) 18,755 213.6g/km 0.9% 1.2% 8.4%
L (226-255g/km) 25,279 235.9g/km 1.2% 1.5% 5.4%
M (over 255g/km) 8,940 307.6g/km 0.4% 0.6% 4.0%
www.smmt.co.uk 44
environmental performance

Electric Vehicle (EV) is the umbrella term for any vehicle that is powered, in part or in full, by a battery that can be directly plugged into mains electricity. The term EVincludesPure-ElectricVehicles,Plug-InHybridVehiclesandExtended-RangeElectric Vehicles.
pure-electric vehicles (pure evs) – These are wholly electric vehicles operated by a battery. Most Pure-Electric Vehicles have a range of about 100 miles.
plug-in hybrid vehicles (phevs) – These are vehicles which have a battery range in excess of 10 miles, after which they revert to hybrid capability, using battery and Internal Combustion Engine (ICE) power for propulsion.
extended-range electric vehicles (e-revs) – These vehicles are similar to pure EVs, but they have a shorter battery range of around 40 miles which is extended by an ICE on-board generator, providing additional mileage capability. Unlike PHVs,whichcanuseelectricorfullhybridforpropulsion,E-REVsalwaysuseelectricity for propulsion.
For the automotive industry to achieve and exceed emissions targets set by the EU, all technologies will play a part. Electric vehicles (EVs) represent one option in a range of technologies being developed by the motor industry.
electric car technology and policy in the uKthe plug-in car grantIn January 2011, the government announced that motorists would be entitled to 25% (up to £5,000) off the list price of an eligible car, through the Office for Low Emission Vehicles’ (OLEV) Plug-In Car Grant. Carswithtailpipeemissionsof75gCO2/km or less, including electric, plug-in hybrid and hydrogen models, are all potentially eligible for the subsidy. Full details are available on the OLEV website.
By the end of 2012, 3,021 claims had been made through the Plug-In Car Grant scheme, with SMMT data showing that 3,293 cars eligible for the Grant were registered over the same period.
the plug-in van grantIn January 2012, government introduced a new Plug-In Van Grant that entitles motorists purchasing a qualifying ultra-low emission van to a grant of 20% to put towards the cost of the vehicle – up to £8,000.
The Plug-In Van Grant has been designed to help make the whole-life costs of a qualifying van more comparable with petrol or diesel equivalents.
More information about the scheme and eligible vehicles can be found on the OLEV website.
www.smmt.co.uk 45
environmental performance

ultra-low carbon innovation and the future of uK automotiveUK automotive is fast becoming a centre for low carbon vehicle research, development, design and manufacture and is well placed to lead the transition to a low carbon economy.
delivering a low carbon economy
Vehicle manufacturers are investing heavily in R&D to develop innovative technologies that improve fuel efficiency, lower emissions and reduce the overall environmental impact of their products.
Collaboratively, the UK industry has developed consensus technology roadmaps for cars (see across) and commercial and off-highway vehicles which provide a strategic outlook for the industry, recognising the long-term challenges associated with the transition to ultra-low carbon vehicles.
The Automotive Council has also set out strategic investment priorities for the move to lower carbon technologies, identifying five strategic technology groups where the UK has the potential for a significant return on investment. The five strategic technologies are: energy storage and management, electric motors and power electronics, internal combustion engines, lightweight vehicle and powertrain structures, and intelligent mobility.
Source: Automotive Council
www.smmt.co.uk 46
environmental performance

vehicle safety The number of people killed or injured on UK roads increased in 2011 by 3% – the first increase since 2003.
According to the Department for Transport (DfT), the total number of casualties, including slight injuries, serious injuries and fatalities, in road accidents in the UK continued to fall in 2011, by 2%, from 208,648 in 2010 to 203,950 in 2011.
vehicle security and road safety
vehicle theft 2003-2012
number of dangerous driving offences on uK roads reported road casualties 2007-2011
year theft of vehicles
% change on year before
theft from vehicles
% change on year before
2003/04 280,288 -8.7% 603,256 -9.1%
2004/05 231,323 -17.5% 500,360 -17.1%
2005/06 203,239 -12.1% 507,239 1.4%
2006/07 182,464 -10.2% 502,651 -0.9%
2007/08 159,704 -12.5% 432,412 -14.0%
2008/09 137,508 -13.9% 396,976 -8.2%
2009/10 109,684 -20.2% 339,170 -14.6%
2010/11 99,208 -9.6% 313,467 -7.6%
2011/12 85,802 -13.5% 300,378 -4.2%
year number of dangerous driving offences
% change on year before
2006/07 5,353 -9.6%
2007/08 4,725 -11.7%
2008/09 4,240 -10.3%
2009/10 3,941 -7.0%
2010/11 3,475 -11.8%
2011/12 3,238 -6.8%
year all killed all injured
2007 2,946 244,834
2008 2,538 228,367
2009 2,222 219,924
2010 1,850 206,798
2011 1,901 202,049
% Change 2001 - 2011 -44.9% - 34.8%
Source: DfT Reported Road Casualties in Great Britain 2011 (published June 2012)
Source: Crime in England and Wales 2011/12
Source: Crime in England and Wales 2011/12
Key issues
www.smmt.co.uk 47

fuel costs
Key issues
Source: The AA
average annual fuel prices over 10 years
average fuel cost (p) and tax as % of totalyear unleaded % tax diesel % tax
2003 76.0 75.6% 77.9 74.1%
2004 80.9 73.1% 82.5 72.0%
2005 87.2 68.9% 91.3 66.5%
2006 92.0 66.2% 65.7 64.2%
2007 95.0 66.3% 97.4 65.0%
2008 107.5 61.7% 118.1 57.5%
2009 99.9 67.5% 104.4 65.2%
2010 117.3 63.6% 119.8 62.7%
2011 133.9 56.8% 139.2 58.5%
2012 136.3 59.2% 142.5 57.4%
vehicle excise duty
band/g/km co2 emissions
standard rate (£)* first year rate (£)2013-2014 2013-2014
A (up to 100g/km) 0 0B (101-110g/km) 20 0C (111-120g/km) 30 0D (121-130g/km) 100 0E (131-140g/km) 120 120F (141-150g/km) 135 135G (151-165g/km) 170 170H(166-175g/km) 195 275I(176-185g/km) 215 325
J (186-200g/km) 250 460K** (201-225g/km) 270 600
L (226-255g/km) 460 815M (over 255g/km) 475 1,030
vehicle co2 emission bands
*Alternatively-fuelled cars get a £10 discount on all bands.**Cars over 225g/km registered between 01/03/01-23/03/06 in band K. Source: gov.uk
www.smmt.co.uk 48
Key issues

www.smmt.co.uk 49
glossary of terms market segmentation
smmt segmentationA miniegHyundaii10B supermini eg Ford FiestaC lower medium eg Volkswagen GolfD upper medium eg BMW 3 SeriesE executive eg Mercedes-Benz C-ClassF luxury saloon eg Jaguar XJG specialist sports eg Audi TTH dual purpose (4x4/SUV) eg Range Rover EvoqueI multi-purpose vehicle eg Vauxhall Zafira
SMMT segments typically conform to the parameters below:
segment a – mini• Lessthan1.0l• Bodystyle‘miniature’• Two-door• Lengthnotexceeding3,050mm
segment b – supermini• Between1.0–1.4l• BodystylebiggerthanMini• Lengthnotexceeding3,745mm• PerformancegreaterthanMini• Morevarietyoftrimsperrange
segment c – lower medium• Between1.3–2.0l• Lengthunder4,230mm(14ft)
segment d – upper medium• Between1.6–2.8l• Lengthunder4,470mm
segment e – executive•Between2.0-3.5l•Four-doorbodystyle,generallybigger
than upper medium•Lengthunder4,800mm•Moreluxuriouslyappointed
segment f – luxury saloon• Upwardfrom3.5l• Mostluxuriousavailable
segment g – specialist sports• Sportscoupé• Sportssaloons• Traditionalsports
segment h – dual purpose (4x4/suv)• 4x4offroad
segment i – multi-purpose vehicle (mpv)• 4x2or4x4estateswithaseatingcapacityofupto
eight people
smmt information

smmt publications and useful links smmt reports and publications13th Annual Sustainability Report www.smmt.co.uk/sustainability (The next edition of the Annual Sustainability Report will be launched in July 2013)
Dealer Energy Efficiency Guide www.smmt.co.uk/dealerenergyefficiencyInvest Now Report www.smmt.co.uk/invest-nowNew Car CO2 Report 2013 www.smmt.co.uk/co2report
more informationAA (Automobile Association) www.theaa.com
ACEA (Association des Constructeurs Européens d’Automobiles) www.acea.be Automotive Council www.automotivecouncil.co.uk BIS (Department for Business, Innovation and Skills) www.bis.gov.uk BVRLA (British Vehicle Rental and Leasing Association) www.bvrla.co.ukDfT (Department for Transport) www.dft.gov.uk DVLA (Driver and Vehicle Licensing Agency) www.dft.gov.uk/dvlaEEF – The Manufacturers’ Organisation www.eef.org.ukEuropean Commission www.ec.europa.eu/index_en.htmFTA (Freight Transport Association) www.fta.co.uk
www.smmt.co.uk 50
smmt information
THE SOCIETY OF MOTOR MANUFACTURERS AND TRADERS
2012 AUTOMOTIVE SUSTAINABILITY REPORT
13th Edition - 2011 Data
IMI (The Institute of the Motor Industry) www.motor.org.ukIndustry Forum www.industryforum.co.ukLowCVP www.lowcvp.org.uk Motor Codes www.motorcodes.co.uk OLEV (Office for Low Emissions Vehicles) www.dft.gov.uk/topics/sustainable/olevRHA(RoadHaulageAssociation) www.rha.uk.net RMI (Retail Motor Industry Federation) www.rmif.co.uk RoadSafe www.roadsafe.comSemta www.semta.org.uk

smmt information
This publication contains general information and, although SMMT endeavours to ensure that the content is accurate and up-to-date at the date of publication, no representation or warranty, express or implied, is made as to its accuracy or completeness and therefore the information in this publication should not be relied upon. Readers should always seek appropriate advice from a suitably qualified expert before taking, or refraining from taking, any action. The contents of this publication should not be construed as advice or guidance and SMMT disclaims liability for any loss, howsoever caused, arising directly or indirectly from reliance on the information in this publication.
www.smmt.co.uk Produced for SMMT by AdStorm Marketing & Advertising: www.adstorm.co.uk

tHE sociEty of motor manufacturErs and tradErs LimitEd71GreatPeterStreet,LondonSW1P2BN
Tel:+44(0)2072357000 Fax:+44(0)2072357112
E-mail: [email protected] Twitter: @SMMT
www.smmt.co.uk
SMMT, the ‘S’ symbol and the ‘Driving the motor industry’ brandline are trademarks of SMMT Ltd
Top Related