


Languages
Pages
Legal


The ‘Social’ Part of Social Desirability: How SocialNetworks Affect the Survey Response and BiasEstimates of Social Influence
Matthew T. Pietryka | [email protected] F. Langley | [email protected] State University | Department of Political Science
May 25, 2018
Survey researchers have dedicated increasing attention toward understanding how socialnetworks influence individual-level outcomes like attitudes, political participation, andother forms of collective action. This work implicitly assumes that errors in individuals’self-reported attitudes and behaviors are unrelated to the composition of their socialnetworks. We evaluate this assumption, developing a theory explaining how socialnetworks influence the survey response by shaping the social desirability of variousbehaviors and attitudes. We apply our theory to the study of political participation,examining evidence from three observational datasets and an experiment conducted on anational sample. We demonstrate that non-voting respondents’ tendency to falsely reporthaving voted is driven by political participation levels among their close friends andfamily. We show that this tendency can artificially inflate estimates of social influence.This study therefore suggests that survey researchers must account for social influenceon the survey response to avoid biasing their conclusions.
Word Count: 9,988

For decades, scholars commonly portrayed citizens as isolated individuals, downplaying
the potential for social influence arising from citizens’ vast networks of friends, coworkers,
and other acquaintances. Recently, scholars have documented the limitations of this atomistic
perspective, demonstrating the importance of social networks for understanding individuals’
political attitudes and behavior (Ahn, Huckfeldt and Ryan 2014; Larson and Lewis 2017;
Klar and Shmargad 2017; Pietryka and Debats 2017; Rolfe 2012; Ryan 2011; Siegel 2013;
Sinclair 2012). Much of this work examines the social determinants of self-reported attitudes
and behaviors collected through surveys (e.g., Eulau and Rothenberg 1986; Huckfeldt,
Johnson and Sprague 2004; Klofstad, Sokhey and McClurg 2013; McClurg 2006; Mutz 2002;
Olsen 1972). Unfortunately, surveys may present overlooked problems for studies of social
influence. As scholars are widely aware, survey reports are often biased by social desirability;
respondents falsely report holding attitudes and behaviors that others will view favorably
while obscuring their attitudes and actions that others might deem distasteful. Yet we know
of no research examining how individuals’ immediate social networks contribute to social
desirability bias in survey reports.
By overlooking the social network’s influence on social desirability bias, previous survey
research may have suggested incorrect conclusions about the magnitude of social influence.
When measures that predict biased reporting are used as explanatory variables in models
of self-reported attitudes and behaviors, the estimated relationship will often be biased
(Ansolabehere and Hersh 2012; Bernstein, Chadha and Montjoy 2001). If social pressure
encourages biased responses, correlations in behaviors between individuals and their net-
works may be a product of either social influence on behavior or social influence on the
survey response.1 Such a confound would present a serious problem because much of the
current literature on social influence in political behavior relies on self-reported outcomes.2
1Setting aside other confounds common to the study of social influence (for a discussion of these confounds,see Fowler et al. 2011).
2A skeptical reader may argue that the relationship between social networks and social desirability is tooobvious to merit attention. Yet the widespread publication of social influence studies relying on self-reported
1

We therefore explore the extent to which self reports may bias our understanding of
social influence in political behavior. We focus on electoral turnout as our outcome variable
because scholars, journalists, and the public at large widely recognize its essential role
in democratic governance. And unlike most survey measures, self-reported turnout can
be checked against government voter files, allowing us to examine individual variation in
misreporting. Using three observational datasets, we demonstrate that overreports—cases
where non-voters report having voted—are more common among respondents who have
disproportionately-participatory social networks. We then show that this pattern can lead
to biased estimates of social influence when the socially-desirable outcome variable is self-
reported. Finally, we present an experiment conducted with a large, nationally representative
sample, demonstrating a causal link between the salience of associates’ participation and
one’s own tendency to overreport. Our research thus provides substantive insight into
social influence in turnout and methodological insight into the mechanisms driving social
desirability bias.
Social desirability encourages biased survey responses
When people respond to surveys, they often attempt to present themselves in a manner they
feel would be most favorable to others, much as they do in everyday life. This impression
management strategy (Goffman 1959) encourages survey respondents to misreport their true
beliefs and actions that others might deem distasteful. Such dissembling is most common on
items measuring behaviors and beliefs that are widely practiced or commonly abhorred. For
instance, Ansolabehere and Hersh (2012) demonstrate that survey respondents misreport
most frequently on items like turnout and voter registration where a socially desirable option
is available. But respondents rarely misreport on items like racial identification, where
data suggests this relationship and its implications have not been obvious to leading social influence scholars,journal editors, and reviewers.
2

no unambiguous societal norm exists (Ansolabehere and Hersh 2012). Of course, tastes
vary; not everyone agrees on which practices are desirable and which should be avoided.
Individuals who fail to recognize or endorse a survey option’s social desirability should feel
little need to misreport.
Why do some people feel compelled to misreport socially-undesirable traits while others
lack this compulsion? Extant explanations focus on respondents’ personal attributes, demon-
strating that overreporting increases with respondents’ education, income, and political
interest (Ansolabehere and Hersh 2012; Silver, Anderson and Abramson 1986). These same
characteristics also predict actual participation, suggesting that people who participate most
frequently also feel the strongest pressure to overreport (Bernstein, Chadha and Montjoy
2001). Following this logic, the strong relationship between social networks and turnout
(e.g., Kenny 1992; Leighley 1990; Mcclurg 2003; Nickerson 2008; Rolfe 2012) implies an
analogous relationship between social networks and turnout misreports. Though work has
yet to examine this relationship directly, contextual analysis provides suggestive evidence.
People overreport voting more frequently in electoral contexts that tend to have greater
aggregate participation (Karp and Brockington 2005). This pattern suggests that the social
desirability of turnout may depend on societal norms. Unfortunately, no work on social
desirability bias examines the mechanisms by which individuals internalize these norms.
A rich history in social influence suggests that individuals look to their close friends and
family members to determine the normative appeal of actions and beliefs (Duncan, Haller
and Portes 1968; Erickson 1988; Festinger, Schachter and Back 1950; Homans 1961). Yet
this intimate social group, which scholars often label the core network, has received little
3

attention in theories or empirical analyses of survey misreports.3 This inattention posses a
problem because so much research on social influence relies on self reported data.
Previous studies of social influence may be biased
If the social network affects the survey response, we must reevaluate studies of social
influence that rely on self reports. As Bernstein, Chadha and Montjoy (2001, 22) explain,
“using reported votes in place of validated votes substantially distorts standard multivariate
explanations of voting, increasing the apparent importance of independent variables that
are related in the same direction to both overreporting and voting and sharply decreasing
the apparent importance of independent variables related in opposing directions to those
two variables.” If social pressure increases the social desirability of identifying in surveys
as a voter, previous studies of voting may have overstated the effect of individuals’ social
networks. And, indeed, most existing research has relied on self-reports. This work has
identified apparent social influence in turnout arising from political discussion networks
(Knoke 1990; Straits 1990; Mutz 2002; Huckfeldt, Mendez and Osborn 2004; Nir 2005; Jang
2009; Klofstad, Sokhey and McClurg 2013; Nir 2011), voluntary group associations (Sallach,
Babchuk and Booth 1972; Uhlaner 1989), local neighborhood contexts (Olsen 1972; Eulau
and Rothenberg 1986; Timpone 1998; Oliver 1996), and family structures (Glaser 1959;
Wolfinger and Wolfinger 2008). The apparent social influence in self-reported behavior also
extends to other forms of political participation (Alford and Scoble 1968; Huckfeldt 1979;
3At least two studies address this issue indirectly, though their substantive interests lie elsewhere. Fowler(2005, 287) suggests, but does not test, the possibility that social networks influence turnout overreports.And Bond et al. (2012) explore a related premise on p. 4 of their online supplementary information: whetherperceptions of network turnout encourage false reports of voting in social media. The analysis suggests only aweak effect. While this study may suggest the network plays only a marginal role in misreporting, we expecta stronger relationship for survey misreports. Brenner (2012) argues that turnout overreporting is driven byrespondents’ social identification as voters rather than nonvoters. In Fowler et al.’s study, Facebook userschose whether to provide a message to their friends stating that they voted; there was no option to advertisethat they did not vote. Thus Facebook users may have felt less pressure to dissemble because dismissing themessage without advertising their participation did not identify them as “nonvoters.”
4

Pollock 1982; Lake and Huckfeldt 1998; Tam Cho 1999; Kim, Wyatt and Katz 1999; McLeod,
Scheufele and Moy 1999; Scheufele 2000; Scheufele et al. 2004; Eveland and Hively 2009)
and persists across a variety of countries and contexts (Fitton 1973; Zipp and Smith 1979;
Harell 2009).
This problem may not only impact studies of social influence, but also behavior studies
that have ignored the social network entirely. By failing to control for the network, previous
work may have misestimated the impact of other voting predictors that are correlated with
social networks. The inattention to the social basis of social desirability will be inconse-
quential if wealth, education, and other individual attributes commonly used as controls
account fully for variation in the social pressure generated by network members. If rich,
educated people comprise the majority of individuals with participatory networks, then
previous studies of turnout overreports may have captured this potential influence by proxy.
And, by controlling for these characteristics, studies of social influence in turnout can purge
the bias created by self-reports. If the network continues to exert pressure to overreport
independent of these variables, however, the social influence estimates are likely to be biased.
To evaluate the extent of these problems, we need a theory that can explain how social
networks influence the survey response.
A social theory of the survey response
The social network can influence individual attitudes and beliefs through two mechanisms
(Deutsch and Gerard 1955). First, informational influence occurs when the network provides
new information that changes an individuals’ beliefs. Second, the network may change
an individual’s behavior by creating social pressure to conform, even in the absence of
informational influence (Carlson and Settle 2016). Social pressure arises from one’s desire
to win peers’ approval or avoid condemnation.
5
In the context of turnout misreports, the network may create informational influence by
changing people’s beliefs about broad, societal norms. For instance, someone might use an
availability heuristic (Tversky and Kahneman 1973), leading them to infer that more people
participate nationally if they are surrounded by people wearing “I voted” stickers than they
would if surrounded by people lacking these stickers. Or more localized informational effects
arise if they infer that many of their peers vote, regardless of the societal norm.
Alternatively, the network may influence turnout misreports through social pressure,
altering an individual’s perception of the social rewards of voting or the social sanctions
for abstaining. To influence survey reports, this pressure must operate even in anonymous
survey settings. Drawing from Goffman (1967), Scheff (1988) argues that social pressure
arises because people anticipate the pride or shame they would feel if their beliefs or actions
were made public. And thus they perpetually feel this social pressure—even in situations
where their peers are absent.4
Both mechanisms suggest a common expectation: people should be more likely to
overreport turnout when they are embedded in more participatory networks. If informational
influence drives this process, people with more participatory networks should infer a stronger
societal norm toward participation. If social pressure drives this process, people should
envision these social rewards or sanctions more intensely if they are embedded in more
participatory networks. In either case, the social desirability arises from people’s mental
reconstructions of their networks.
For these mechanisms to operate, people’s perceptions of their network need not be
accurate. Indeed, work on social influence in participation suggests that when perceptions of
network characteristics diverge from reality, their perceptions are often more consequential
than their networks’ actual characteristics (Huckfeldt 2007; Ryan 2011). Like many political
perceptions, people’s mental reconstructions of their networks should be governed by recent
4This perspective provides a plausible explanation for the persistence of turnout overreporting even in self-administered, online surveys (Ansolabehere and Hersh 2012).
6

interactions and cues in the immediate context (Zaller and Feldman 1992), which may lead
people to over- or under-estimate their associates’ participation. On one hand, political
discussion is typically initiated by the most politically engaged (Huckfeldt and Mendez 2008).
When this group is salient, people may overestimate the frequency of political participation
in their network, increasing the social desirability of reporting turnout. On the other hand,
a growing body of the public perceives politics as distasteful, and systematically conceal
their political involvement from their peers (Klar and Krupnikov 2016). When this group is
salient, people may underestimate the frequency of political participation in their network,
decreasing the social desirability of reporting turnout.
To summarize, our argument is that people rely on a mental reconstruction of their social
network to ascertain the social desirability of actions or beliefs. Just as people leaving their
house might bring along their phone, keys, purse, or wallet, they also bring a mental image
of their network. This mental image, we argue, governs the social desirability of particular
responses to survey questions. Our empirical analysis therefore begins with observational
analysis of three datasets, examining the relationship between the core network and turnout
misreports. Our theory suggests two mechanisms by which the network may influence
misreports. This mental image might create social desirability bias through informational
influence, altering individuals’ awareness of societal norms. Or it may create social desir-
ability bias through social pressure by altering people’s perceptions about the social rewards
of voting. After the observational analysis, we therefore present an experiment designed to
evaluate these mechanisms and the causal logic underpinning our theory.
Observational study
For empirical evidence, we first examine three surveys that provide measures of self-reported
and validated turnout along with network participation levels. We use these data to examine
two questions. First, do people with more participatory networks over-report voting at
7

greater rates? Second, do models relying on self-reported turnout suggest greater social
influence than would models relying on validated turnout? As we show below, the answer
to both questions is yes.
Observational data
To address these questions, we need data that provide measures of self-reported and validated
voting as well as participation within respondents’ immediate social networks. In survey
research, social networks are typically measured with a name generator battery (see e.g.,
Laumann 1973; Marsden 1987), which comprises a series of questions asking respondents
to identify the names or initials of their closest friends, family, or other associates. Despite
increasing scholarly attention to social networks, political surveys still rarely include name
generators and those that do typically offer only self-reported turnout measures. These
constraints leave us with only two preexisting datasets that satisfy our needs: The 1984
South Bend Study and the 2010 Williamsburg Study. To expand the temporal and geographic
scope of our study, and to examine our theory on a nationally-representative sample, we
fielded a new name generator battery on the 2016 Cooperative Congressional Election Study
(CCES).
The South Bend Study: Huckfeldt and Sprague (2006) combined a three-wave panel survey
with validated records of respondents’ participation in elections. These data have been used
in many prominent studies of social influence (e.g., Huckfeldt and Sprague 1995; Kenny
1992; Klofstad, McClurg and Rolfe 2009; Mutz and Mondak 1997).
The survey’s first wave contacted approximately 1,500 respondents within the South
Bend metropolitan area and the second and third waves of the study attempted to recontact
these individuals, supplementing panel attrition with new respondents. We restrict our
analysis to the 1,510 individuals who responded to the third wave, which included both
the name generator and turnout measure. Respondents were randomly selected within 16
8

South Bend neighborhoods. Thus, with over 90 respondents per neighborhood, the sample
is intended to be representative within neighborhoods, but not of South Bend as a whole.5
Huckfeldt and Sprague supplemented the survey data with data from the Indiana voter file,
providing a validated turnout measure.
The Williamsburg Study: This multiwave panel, collected by Miller et al. (2015), surveys
William & Mary students around the time of the May 2010 Williamsburg municipal elections.
The survey targeted all 5,726 students on the college master email list. We restrict our
analysis to the 1,735 students older than 18 years who responded to both the first and third
waves. The first wave, collected from late February to early March, included measures of
respondents’ social networks, demographics, and baseline political attitudes. The third wave,
collected immediately following the election, included the self-reported turnout measure.
Like the South Bend Study, we compare the self-reports to validated turnout from the
Williamsburg voter file.
CCES: Our new data come from a name generator battery included on two modules of the
2016 CCES pre-election wave. A post-election wave collected self-reported turnout, yielding
1,512 valid responses from across the US.6
Together, these three datasets offer useful variation in both measurement and context,
as summarized in Table 1. The South Bend Study included both the name generator and
turnout measure on the same post-election wave. The other two datasets collected the
name generator before the election and turnout after, establishing temporal precedence.
The South Bend Study and the CCES each rely on respondents’ perceptions of network
participation while the Williamsburg Study provides validated turnout for network members.
The South Bend Study relied on face-to-face interviews while the other two studies were self-
administered online. Since self-administered online studies may reduce social desirability
5In all South Bend analyses, we cluster the standard errors on neighborhoods to account for this samplingstrategy.
6We draw the turnout and control variables from the CCES common content data posted to https://doi.org/10.7910/DVN/GDF6Z0 on 2018-02-10.
9
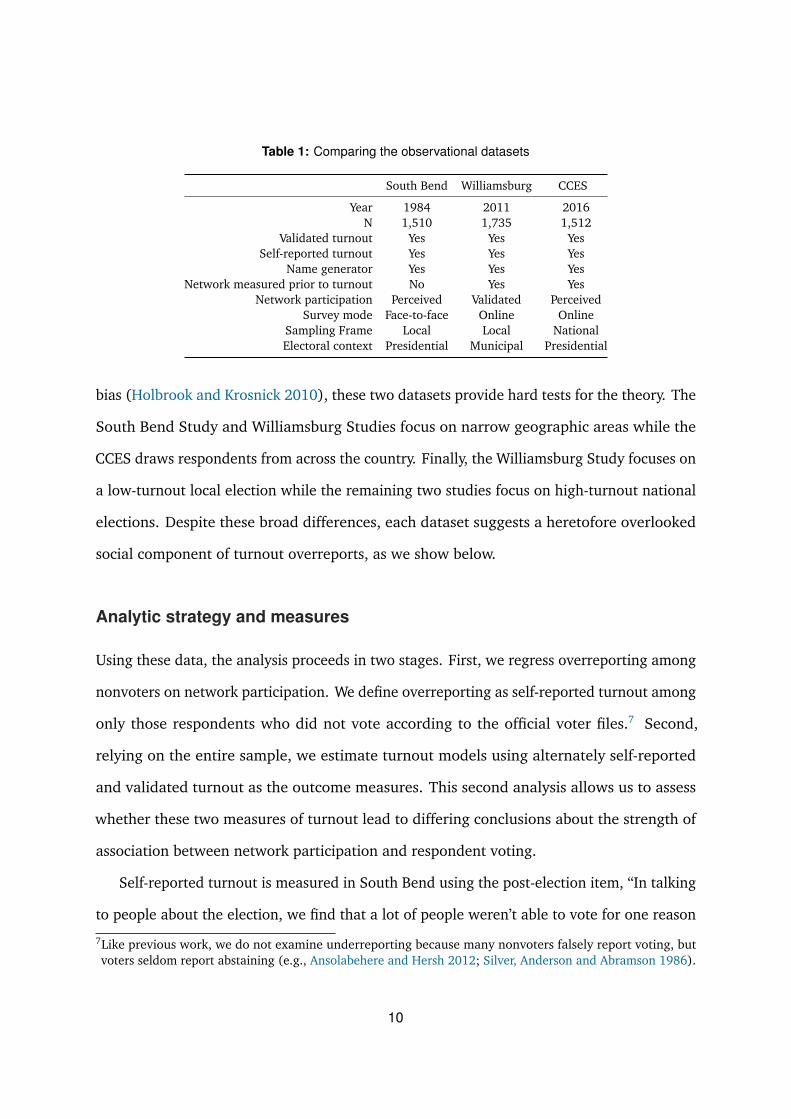
Table 1: Comparing the observational datasets
South Bend Williamsburg CCES
Year 1984 2011 2016N 1,510 1,735 1,512
Validated turnout Yes Yes YesSelf-reported turnout Yes Yes Yes
Name generator Yes Yes YesNetwork measured prior to turnout No Yes Yes
Network participation Perceived Validated PerceivedSurvey mode Face-to-face Online Online
Sampling Frame Local Local NationalElectoral context Presidential Municipal Presidential
bias (Holbrook and Krosnick 2010), these two datasets provide hard tests for the theory. The
South Bend Study and Williamsburg Studies focus on narrow geographic areas while the
CCES draws respondents from across the country. Finally, the Williamsburg Study focuses on
a low-turnout local election while the remaining two studies focus on high-turnout national
elections. Despite these broad differences, each dataset suggests a heretofore overlooked
social component of turnout overreports, as we show below.
Analytic strategy and measures
Using these data, the analysis proceeds in two stages. First, we regress overreporting among
nonvoters on network participation. We define overreporting as self-reported turnout among
only those respondents who did not vote according to the official voter files.7 Second,
relying on the entire sample, we estimate turnout models using alternately self-reported
and validated turnout as the outcome measures. This second analysis allows us to assess
whether these two measures of turnout lead to differing conclusions about the strength of
association between network participation and respondent voting.
Self-reported turnout is measured in South Bend using the post-election item, “In talking
to people about the election, we find that a lot of people weren’t able to vote for one reason
7Like previous work, we do not examine underreporting because many nonvoters falsely report voting, butvoters seldom report abstaining (e.g., Ansolabehere and Hersh 2012; Silver, Anderson and Abramson 1986).
10

or another. How about you? Did you vote this fall, or did something keep you from voting?”
[with response options: “Yes, voted”/ “No, did not vote”]; in the Williamsburg study using
the post-election item, “Did you vote in the May 4th city council election?” [“Yes”/“No”];8
and in the CCES using the post-election item, “Which of the following statements best
describes you?” [respondents are coded as voters if they chose, “I definitely voted in the
General Election on November 6.”].
In all three studies, respondents identified their social networks using the name generator
battery. The South Bend study (post-election) focused on up to three people with whom
the main respondent discussed politics: “Can you give me the FIRST names of the three
people you talked with most about the events of the past election year? These people might
be from your family, from work, from the neighborhood, from church, from some other
organization you belong to, or they might be from somewhere else.” The Williamsburg
Study (pre-election) focused on up to five friends among the students at William & Mary:
“One of the purposes of this survey is to examine the flow of political information on campus
between people who know each other. We are particularly interested in knowing whether
people who are friends have similar opinions and thoughts about politics. To help us answer
this question, we are asking you to give first and last names of up to five of your closest
friends who attend William and Mary.” The CCES collected three names using the following
prompt: “From time to time, people discuss government, elections, and politics with other
people. Who are the people with whom you discuss these matters? These people might or
might not be relatives. Can you think of anyone? Please enter their first name in the box
below.” The networks identified by each method differ slightly from one another. Both the
South Bend and CCES measures represent respondents’ political discussion networks while
the Williamsburg measures represent respondents’ friendship networks. These two network
8The Williamsburg Study only asks the turnout question to respondents who reported that they were registeredto vote in the City of Williamsburg. In the analyses we present below, respondents who reported that theywere not registered are treated as non-voters. Restricting the sample to registered voters yields analogousconclusions.
11

types are likely to overlap a great deal in the population. People tend to discuss politics
most frequently with those whom they discuss other important matters: their significant
others, close friends, and family (Huckfeldt, Johnson and Sprague 2004; Klofstad, McClurg
and Rolfe 2009).
Once the network members have been identified, we must measure participation among
these associates. The South Bend PIs did not validate the participation of discussants identi-
fied by the main respondents and the identities of these discussants have been anonymized,
preventing a new validation effort. As a result, we must rely on respondents’ perceptions of
participation among their discussants. These perceptions were measured following the name
generator in the post-election wave, asking “Who do you think [discussant’s name] voted
for, for President?”. We code discussants as voters if the main respondent chose options
“Reagan” or “Mondale”; nonvoters are discussants whose main respondent chose the response
option, “Didn’t vote”.9 The Williamsburg Study provides validated turnout measures for
both respondents and their friends. To avoid simultaneity bias, we use the friends’ validated
turnout in the 2009 VA gubernatorial election. The CCES name-generator battery collected
only first names, preventing a validation effort. We thus rely on respondents’ answers to the
question, “Do you think the person/people you named will vote for Clinton, Trump, some
other candidate, or will not vote?” The screen provided a grid with each discussant’s name
and allowed them to respond separately for each discussant.
In all models, we control for common predictors of overreporting and turnout. These
measures are drawn from Ansolabehere and Hersh (2012), a recent comprehensive study of
turnout (over)reporting on surveys.10 Details about item wording and variable values for
9The South Bend study PIs also attempted to interview some of the discussants identified by the mainrespondents. In principle, we could instead rely on discussants’ self-reported turnout. Unfortunately, this“snowball” sample was much smaller than the main respondent sample. Main respondent’s provided turnoutreports of 4,153 discussants while only 891 of these discussants provided self-reports. Given the similaritybetween main respondents’ perceptions of discussant characteristics and discussants’ own self-reportedcharacteristics (Huckfeldt 2001), we rely on the larger sample.
10For the Williamsburg analyses, we must deviate from the Ansolabehere and Hersh (2012) controls in severalways. Since student samples provide little variation in respondents’ age, education, income, or marital status,
12
these and other items can be found in section A of the online Supporting Information (SI);
summary statistics can be found in SI B. To avoid bias emerging from listwise deletion, we
use 50 imputations of the explanatory variables.11
Observational results
We begin the analysis with our observational results. We first examine the link between
social participation and overreport bias. After demonstrating this association, we explore
how this bias can confound estimates of social influence.
Network participation predicts overreporting
Table 2 presents regressions of self-reported turnout among validated nonvoters. The
first model in each dataset presents the bivariate relationship between overreporting and
Network Voting Proportion—the proportion of the main respondent’s discussants iden-
tified as voters. The second model introduces the controls.
In all three datasets, the first model suggests that nonvoters with more participatory
networks are more likely to report that they voted. In South Bend, nonvoters who believed
all of their discussants voted are almost 40 percentage points more likely to report turnout
than nonvoters who believed none of their discussants voted. In the CCES, this difference is
the survey omitted these items. It also omitted a measure of respondents’ church attendance. We proxy forage and education with indicators of respondents’ academic class standing. We proxy for income with anitem asking about respondents’ socioeconomic status.
11The practice of dropping all cases with even a single missing value, commonly referred to as listwise deletion,reduces the model’s degrees of freedom unnecessarily. Further, it biases the coefficient estimates anytimepeople with missing responses differ systematically from those with complete responses. Multiple imputationaddresses both problems, preserving all valid responses and reducing the bias arising from differencesbetween observed and missing cases (for details, see Rubin 2009). Though many imputation methods exist,we rely on conditional multiple imputation because it tends to perform better than alternative approacheson the categorical and ordinal variables commonly included in surveys (Kropko et al. 2014). We generatedthe imputations using the mice 2.30 package (Buuren and Groothuis-Oudshoorn 2011) in R 3.3.3 (RCore Team 2017). For details about the imputation process, see SI C.
13
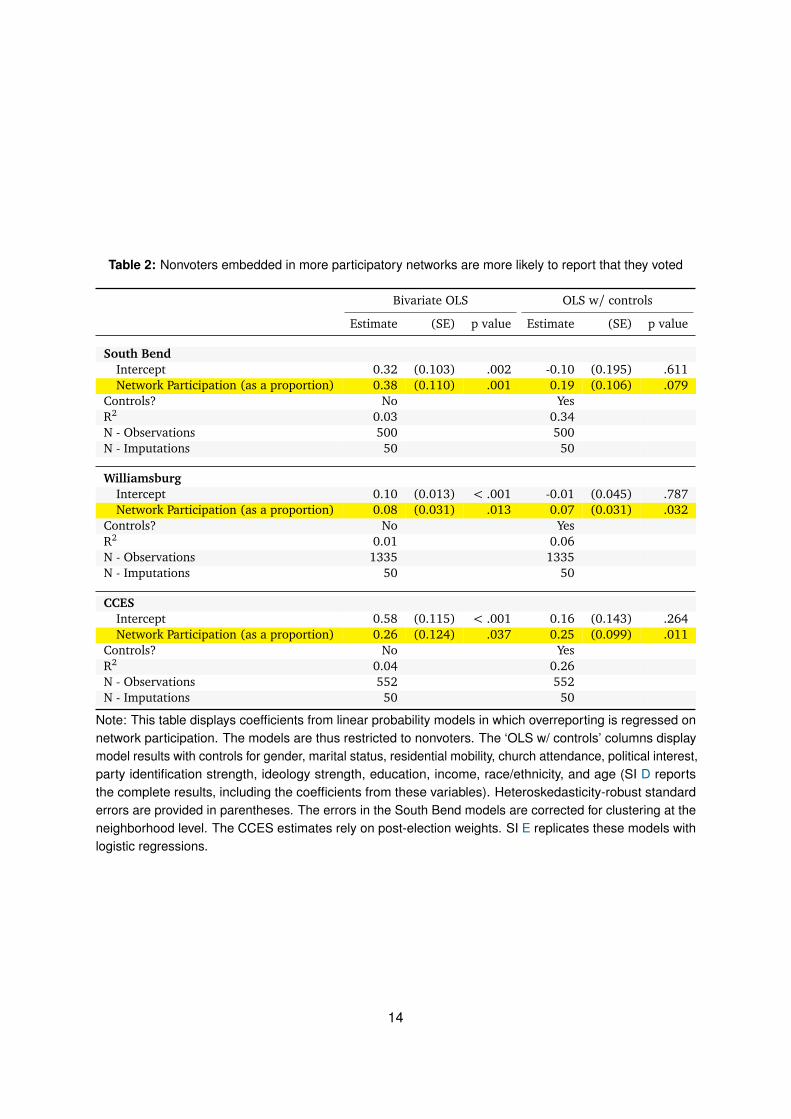
Table 2: Nonvoters embedded in more participatory networks are more likely to report that they voted
Bivariate OLS OLS w/ controls
Estimate (SE) p value Estimate (SE) p value
South BendIntercept 0.32 (0.103) .002 -0.10 (0.195) .611Network Participation (as a proportion) 0.38 (0.110) .001 0.19 (0.106) .079
Controls? No YesR2 0.03 0.34N - Observations 500 500N - Imputations 50 50
WilliamsburgIntercept 0.10 (0.013) < .001 -0.01 (0.045) .787Network Participation (as a proportion) 0.08 (0.031) .013 0.07 (0.031) .032
Controls? No YesR2 0.01 0.06N - Observations 1335 1335N - Imputations 50 50
CCESIntercept 0.58 (0.115) < .001 0.16 (0.143) .264Network Participation (as a proportion) 0.26 (0.124) .037 0.25 (0.099) .011
Controls? No YesR2 0.04 0.26N - Observations 552 552N - Imputations 50 50
Note: This table displays coefficients from linear probability models in which overreporting is regressed onnetwork participation. The models are thus restricted to nonvoters. The ‘OLS w/ controls’ columns displaymodel results with controls for gender, marital status, residential mobility, church attendance, political interest,party identification strength, ideology strength, education, income, race/ethnicity, and age (SI D reportsthe complete results, including the coefficients from these variables). Heteroskedasticity-robust standarderrors are provided in parentheses. The errors in the South Bend models are corrected for clustering at theneighborhood level. The CCES estimates rely on post-election weights. SI E replicates these models withlogistic regressions.
14

26 percentage points.12 In the low-turnout Williamsburg election, this difference is eight
percentage points.
The second model for each dataset introduces the controls. In South Bend, the difference
between nonvoters in participatory and non-participatory networks is weaker after condition-
ing on the other predictors. In the other two datasets, however, the conditional relationship
is similar in magnitude to the bivariate relationship reported in the first model. In all three
cases, a substantively important relationship remains after introducing the controls, suggest-
ing that the literature on overreporting has missed the social aspect of social desirability bias.
The controls in our models have been used in this literature to identify citizens who feel the
strongest social pressure to participate—and hence social pressure to report participating
even when they have not. Nonetheless, a strong relationship between overreporting and
network participation persists in the presence of these controls. By comparison, education
provides the most consistent predictor of overreporting in past work (Ansolabehere and
Hersh 2012, 441) and our results reaffirm that pattern (see SI D for our complete model
results). In our data, people in the top half of education tend to overreport at rates 10-20
percentage points greater than the least educated—differences that are similar in magnitude
to those associated with a minimal to maximal shift in network participation. Thus, prior
work has been ignoring substantial variation in individuals’ propensity to overreport turnout.
To account for this pattern, these analyses suggest common controls serve as insufficient
proxies for the network. Controlling for this bias will be easier if researchers explicitly
incorporate network participation into their models.
12The CCES provides two ways to measure validated turnout, which differ based on how respondents who arenot matched to a voter file are handled. Here, we follow convention by treating these unmatched respondentsas nonvoters. Berent, Krosnick and Lupia (2016) argue that this approach introduces too much error becauserespondents may go unmatched due to poor record keeping rather than abstention. To address this concern,an alternative approach is to exclude unmatched respondents from analysis, identifying respondents asnonvoters only if they were explicitly reported as such in the voter file. In SI D, we reestimate our modelswith this alternative specification, yielding almost identical results.
15

Self-Reported turnout can bias estimates of social influence
Since network participation predicts overreporting—even after controlling for commonly-
used explanatory variables—it has the potential to bias estimates of social influence. This
bias is evident in Table 3, which reports models regressing turnout on network participation.
The first model for each dataset relies on self-reported turnout as the outcome variable. The
second model uses validated turnout.
The table suggests that using these different measures of turnout can lead to distinct con-
clusions about the extent of social influence in voting. Across all three samples, respondents
with maximum participation in their networks report turnout at rates 12-13 percentage
points greater than those with minimal network participation. The corresponding differences
for validated turnout are 3-5 percentage points smaller. For instance, the CCES data suggest
a minimal to maximal shift in network participation corresponds with a 12-percentage-point
difference in self-reported turnout, but only an eight-percentage-point difference in validated
turnout.
These differences will be particularly consequential for researchers working within the
null hypothesis testing framework. In all three cases, the self-reported outcome would
allow researchers to reject the null at the conventional p < .05 level. Yet the validated
outcome would allow researchers to reject the null only in the Williamsburg data. Using the
South Bend and CCES data, researchers without access to validated turnout may conclude
that individuals’ turnout decisions depend on their networks; with validated turnout, they
would be unable to reject the null of no influence.13 These disparate results across the three
datasets suggests that researchers cannot predict ex ante the extent to which relying on
self-reported turnout will bias their conclusions.
13The inability to reject the null in the South Bend and CCES studies does not provide strong evidence foran absence of social influence (see Rainey 2014). Though the validated coefficients are smaller than theself-reported coefficients, they are not estimated with enough precision to rule out important substantiveeffects.
16

Table 3: Compared to validated turnout, self-reported turnout suggests greater social influence with lessuncertainty.
Self-Reported turnout Validated turnout
Estimate (SE) p value Estimate (SE) p value
South BendIntercept 0.24 (0.100) .015 0.23 (0.141) .110Network Participation (as a proportion) 0.13 (0.056) .021 0.10 (0.070) .171
Controls? Yes YesR2 0.16 0.15N - Observations 1510 1510N - Imputations 50 50
WilliamsburgIntercept 0.10 (0.072) .155 0.11 (0.069) .102Network Participation (as a proportion) 0.13 (0.037) .001 0.09 (0.031) .005
Controls? Yes YesR2 0.05 0.04N - Observations 1735 1735N - Imputations 50 50
CCESIntercept 0.55 (0.118) < .001 0.29 (0.158) .063Network Participation (as a proportion) 0.12 (0.055) .032 0.08 (0.095) .423
Controls? Yes YesR2 0.14 0.1N - Observations 1512 1512N - Imputations 50 50
Note: This table displays coefficients from linear probability models in which self-reported or validated turnoutis regressed on network participation. All models control for gender, marital status, residential mobility,church attendance, political interest, party identification strength, ideology strength, education, income,race/ethnicity, and age (SI D reports the complete results, including the coefficients from these variables).Heteroskedasticity-robust standard errors are provided in parentheses. The errors in the South Bend modelsare corrected for clustering at the neighborhood level. The CCES estimates rely on post-election weights.SI E replicates these models with logistic regressions.
17

Experimental study
The analyses above establish the relationship between networks and overreporting, but leave
several questions unanswered. First, do more participatory networks cause overreporting or
is the relationship spurious, caused perhaps by aspects of the broader context that encourage
people to overreport and encourage their networks to participate? For instance, groups of
friends may all be targeted by the same geographically-focused mobilization drive, increasing
their chances of voting and the pressure they feel to report voting on surveys. Second, if
networks cause overreporting, through what mechanisms do they operate? As we explain
above, social influence may arise from informational effects or social pressure. We therefore
designed an experiment that allows us to explore these questions.
Experimental design
An ideal experiment would compare overreporting among individuals who have been
randomly assigned to more or less participatory discussion networks. Random assignment
is infeasible here, however, since real-world discussion networks tend to include individuals’
closest friends and family (Huckfeldt, Mendez and Osborn 2004). Nonetheless, random
assignment provides a means to exogenously influence a central mechanism in our theory,
which posits that respondents carry with them a mental representation of their network
which conditions the social desirability of various responses. We can therefore examine this
mechanism by exogenously influencing their mental representation of the network, rather
than influencing the network itself.
Network participation prime
We embedded the experiment within a standard name-generator battery, which we included
on a post-election module of the 2016 CCES, yielding a national sample of 841 respondents.
We influence respondents’ perceptions of their networks by priming them to think of more
18

or less participatory associates. The network turnout prime thus asked respondents to think
of someone, “who you believe [voted / did not vote] in the General Election on November
8? What is that person’s first name?”. Our theory suggests respondents will overreport
at greater rates if they are primed to think of an associate who voted (we refer to these
respondents as the associate voted group, N = 439) rather than an associate who did
not vote (the associate abstained group, N = 402). Our key outcome is therefore the
respondent’s self-reported turnout, which we asked shortly after the name generator.14
If individuals in the associate voted group report higher levels of turnout, we can con-
clude that these individuals are overreporting at greater rates. This conclusion is warranted
because the experiment occurred after the election and therefore cannot have influenced
whether respondents actually voted. Moreover, by randomizing the treatment, we can be
confident that no differences exist between treatments in their baseline propensity to vote
or misreport voting.15 The observational analyses above assume that the validated measures
are free of error, an assumption that Berent, Krosnick and Lupia (2016) call into question.
Since a validation effort is not necessary for the experimental analysis, the design allows us
to test our theory without this restrictive assumption. To see whether any observed effects
depended on the type of relationship the name generator elicited, we asked respondents to
name either a close associate (“close friend or family member”), a less intimate associate
(“coworker or casual acquaintance”), or someone they identified with (“person like you”).
All three wordings yielded similar effects, as shown in SI G.
14Some people may have been unable to think of a voter or non-voter in their network. Others gave obviouslyfalse names like “Hillary Clinton.” Since we cannot be certain respondents imagined a real associate, ourresults represent intention-to-treat (ITT) effects, providing a more conservative test of our theory.
15We present balance statistics for pre-treatment demographic variables in SI section F. Only small differencesemerge between treatment groups. In SI F, we nonetheless replicate our analyses after controlling for thecovariates that show even moderate imbalance. These models suggest the same substantive conclusions asthose reported below.
19

National turnout cue
As we explain above, networks may influence misreports through information effects or
social pressure. Information plays a role if their network provides information about how
typical people behave, helping them make inferences about societal norms. If the network
influences overreporting through this mechanism, there must be a causal link between higher
perceptions of national turnout levels and greater overreporting. To provide causal leverage
on this relationship, we randomly embedded one of three cues about national participation
levels immediately prior to the name generator. One group received no cue (no cue group,
N = 293). The second group received a cue stating that, “Nationwide, approximately 37%
of eligible voters cast votes in the 2014 U.S. elections” (low national turnout group, N
= 268). The third group received a cue stating “Nationwide, approximately 59% of eligible
voters cast votes in the 2012 U.S. elections” (high national turnout group, N= 264).16
The national turnout cue was assigned independently from the name-generator text.
Thus, a subject in the associate voted and low national turnout groups received
the following prompt:
Lots of people vote in federal elections, but many others do not. Nationwide,
approximately 37% of eligible voters cast votes in the 2014 U.S. elections. Think
about a specific [close friend or family member / coworker or casual acquaintance
/ person like you] who you believe voted in the General Election on November
8? What is that person’s first name?
Dependent variables
This design allows us to compare the relative impact of interpersonal relationships and
societal norms on misreports by comparing the effect of the network turnout prime to the
effect of the national turnout cue.16These turnout estimates come from McDonald (2016).
20

Further, we included several questions to help us distinguish information effects from
social pressure. If social influence occurs through information, the network treatment
must change respondents’ perceptions about national turnout or turnout within their own
networks. We therefore examine whether the treatments changed these perceptions, asking
about turnout nationally (“Thinking about all eligible voters in the U.S., what percentage
of these people do you think voted in the General Election on November 8?”) and within
respondents’ own networks (“Thinking about all the people you talk with about matters that
are important to you, what percentage of these people do you think voted in the General
Election on November 8?”).17 Asking about perceptions of national turnout also serves
as a manipulation check for the national turnout cue. If social influence occurs through
social pressure, respondents should anticipate greater social sanctions if a peer were to
learn that they did not vote. We therefore asked, “Thinking about [FIRST NAME], how
disappointed would they be if they learned that you did not vote in the election this year?”.
If participation levels in one’s immediate social network increase social pressure, then
individuals in the associate voted group should anticipate greater disappointment than
those in the associate abstained group.
Experimental results
Figure 1 displays the results.18 In the figure and the text below, we report p-values from
difference in means tests, estimated via OLS with heteroskedasticity-robust standard er-
rors, but we find substantively identical results with randomization inference (see Keele,
McConnaughy and White 2012).
17We randomized the order of these two questions.18The survey allowed responses to skip questions and thus two people did not respond to the turnout report
and 10-16 others did not respond to the other dependent variables. SI H documents this non-response andprovides sensitivity analysis demonstrating that the conclusions below are robust to any possible assumptionsabout the true values of the missing variables.
21

Figure 1A shows the effect of the network participation prime on the proportion of
respondents who reported voting in the 2016 election.19 Both groups reported high levels
of turnout as is typical in surveys, but this tendency was particularly strong for respondents
primed to think about an associate who voted. Almost 90% of these associate voted re-
spondents reported turnout, compared to 82% of the associate abstained respondents,
who were primed to think of an associate who did not vote (p < .01). To put this effect in
perspective, this difference is almost as large as the twelve percentage point difference in
overreporting between weak partisans and pure independents shown in the CCES column
of the observational analysis (Table D1 in SI D). And it is roughly half as large as the twenty
percentage point difference between the most and least educated individuals.20
Figure 1B shows that the cue about national turnout levels had little effect on self-reported
turnout. If perceptions of societal norms cause overreporting, we would expect people
primed with the lower turnout estimate to be less likely to report voting. Instead, the low
national turnout group reported voting at a greater rate than the other groups, though
these differences are small in magnitude (plow national turnout = .23; phigh national turnout = .61).
Figure 1C plots the mechanisms through which the network participation prime may
effect reported turnout. The two leftmost panels examine information effects, plotting the
treatment effect on perceptions of national turnout (left panel) and turnout within their
own networks (middle panel). These panels suggest the network participation prime had
little effect on these perceptions. Therefore, in this experiment the network’s effect on
overreporting does not appear to arise by changing respondents’ perceptions of participation
either nationally or within their own networks. Rather, the apparent mechanism appears to
19Applying survey weights can bias estimates of treatment effects and we therefore present unweighted results,as recommended by Franco et al. (2017).
20To verify that these results arise from overreporting, rather than actual differences in turnout, we havereplicated this analysis after excluding validated voters from the sample. Within this subset (N = 367),subjects primed to think of a voter were ten percentage points more likely to report turnout than thoseprimed to think of a non-voter (p = 0.051). Given the concerns over the accuracy of government records(Berent, Krosnick and Lupia 2016), our primary analysis focuses on the full sample. Reassuringly, there isonly a one percentage point treatment effect for the validated voters in the sample (p = 0.34), suggestingthe effect is not driven by the voters in the sample.
22

be social pressure, as shown in the far right panel, which plots how disappointed the associate
would be to learn that the respondent did not vote. The plot shows that individuals expect
non-voting associates to feel little disappointment, averaging only 0.6 on the three-point
scale which ranged from 0= “Not at all disappointed” to 3= “Very disappointed.” In contrast,
respondents whose associate voted reported an average of 1.2—just over the midpoint on
the scale and double that of respondents whose associate did not vote (p < .001).
Figure 1D provides analogous plots for the national turnout cue. Though the national
turnout cue had no effect on overreporting, it succeeded in altering respondents’ perceptions
of national participation levels, as shown in the left panel. Respondents who received no cue
believed 60% of eligible voters turned out in 2016, on average, compared to 55% among
the low national turnout group (p < .001). Thus, priming the low turnout in the
2014 midterm elections reduced respondents’ estimates of aggregate participation in the
2016 presidential election. Those in the high national turnout group estimated a 58%
national turnout rate, which was similar to those receiving no cue (p = .21) and greater than
the low national turnout group (p = .01). As the last two panels show, this treatment
had no apparent effects on respondents’ perceptions of turnout within their own networks
nor perceived social pressure.
In summary, the experiment suggests that respondents’ immediate social networks
influence overreports. In contrast, perceptions of societal norms about participation do not.
In this case, the network tends to operate through social pressure rather than information.
The network treatment had no systematic effect on perceptions of turnout either nationally
or within respondents’ own networks. Instead, its primary effect was on expected levels of
disappointment.
Our results suggest that the apparent effect of societal norms on overreporting (Karp and
Brockington 2005) may instead reflect an aggregation of more localized social influence.
This conclusion aligns with recent evidence suggesting that people feel pressure to conform
23
to the behavior of their ingroup peers, but not outgroup members (Suhay 2015). And
perhaps as a result, the social rewards of voting depend heavily on the local context (Anoll
2018). Our conclusion requires further research, however, because the high turnout rate in
the sample may imply a ceiling effect, suppressing the effect of the national turnout cue.
Nonetheless, turnout reports in the experiment are consistent with typical survey estimates
in U.S. presidential elections. Thus, this study examines effects using variation that reflects
common real-world conditions. Still, we hope future work explores whether perceptions of
national turnout matter more in low-turnout elections.
24

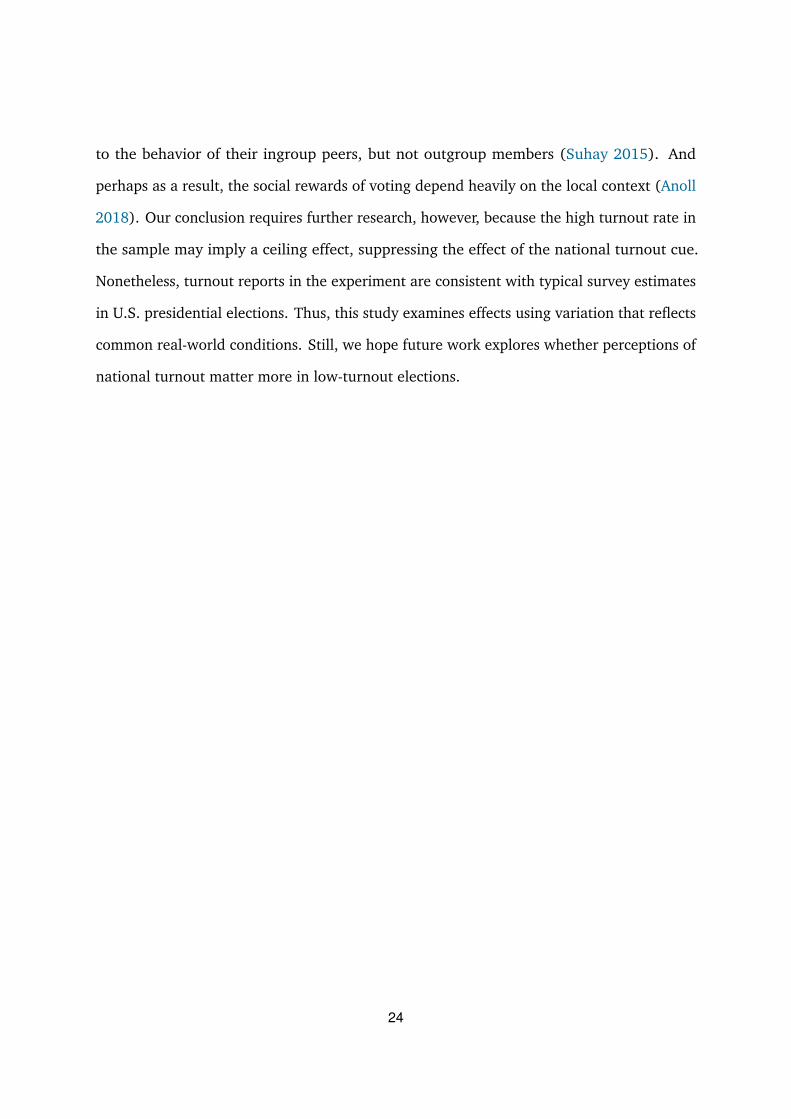
Figure 1: Experimental treatment effects on self-reported turnout (Panels A & B), and perceptions of nationalturnout, network turnout, and social pressure to vote (Panels C & D).
(A) The effect of the network participationprime on self-reported turnout. People aremore likely to report having voted if they are re-minded of an associate who voted, rather thanone who abstained.
(B) The effect of the national turnout cue onself-reported turnout. Knowledge about na-tional turnout rates has little effect on the like-lihood that people report having voted.
(C) The effect of the network participation prime on perceptions of national turnout, network turnout,and social pressure to vote. The network treatment increases a respondent’s perceived social pressure.
(D) The effect of the national turnout cue on perceptions of national turnout, network turnout, andsocial pressure to vote. The national treatment affects a respondent’s expectation about national turnout.
Note: The plots show means and 95% confidence intervals for each experimental group. The outcomein panels A and B is self-reported turnout. The outcomes in panels C and D reflect a respondent’s beliefabout the percentage of eligible voters who cast votes, the percentage of their discussion network who castvotes, and the level of disappointment their associate would feel if they learned that the respondent didnot vote. To the right of each estimate, differences-in-means p-values compare the focal estimate to thereference category, which is the associate abstained group for the network turnout prime and the nocue group for the national turnout prime.
25

Conclusion
The results provide evidence demonstrating how the social network can magnify or reduce
the social desirability bias of turnout self reports. The experiment suggests that individuals
feel greater social pressure to vote and, subsequently, overreport turnout at a greater rate
when they are asked to think about acquaintances who themselves voted (Figure 1A). These
results suggest that individuals with more participatory networks should be more prone
toward misreporting because they will tend to perceive greater social pressure (Figure 1B).
Using observational data from three different elections, we find support for that expectation.
Individuals with more participatory networks are more likely to falsely report voting (Ta-
ble 2). This relationship creates the potential to bias estimates of social influence in voting.
Researchers using self-reported turnout and the common p < .05 threshold would conclude
the relationship is significant in all three data sets. Those using validated turnout would
reach that conclusion only in the Williamsburg data (Table 3).
The social desirability of turnout arising in participatory networks presents a great
confound for studies of social influence relying on self reports. In many cases, validated
measures remain unavailable and thus the bias of the estimates cannot be checked. If analyses
using self-reported measures always overestimated the magnitude of social influence relative
to analyses using estimates from validated measures, researchers could correct for this bias
by adjusting the self-report estimates toward zero. Unfortunately the evidence presented
above suggests that such a procedure may instead lead to underestimates of social influence in
some cases. This correction would be warranted in the South Bend and CCES studies, but in
Williamsburg, it would underestimate the apparent social influence observed in the validated
voting model. When validation is infeasible, we therefore recommend that scholars subject
their estimates to sensitivity analysis to help readers understand the range of estimates they
would recover after correcting for plausible levels of bias (see e.g., VanderWeele 2011).
26

While the analyses reported above focus on turnout, our results suggest that similar
problems will arise when researchers study other outcomes that may be biased by social
desirability. For instance, many scholars are interested in understanding how individuals’
social networks influence their partisan identification and candidate preferences. But for
each of these outcomes, social desirability has powerful effects on reported values (Klar and
Krupnikov 2016). Even studies that are not interested in social influence must address this
problem. Since these outcomes can rarely be validated, the challenge for scholars will be to
remove the bias generated by social desirability. As Table 2 suggests, individual covariates
serve as insufficient proxies for the social network. Therefore, removing the bias associated
with social desirability will be easier if researchers can directly measure and control for the
network.
This paper adds to the growing literature exploring the confounds to causal inference that
emerge in observational analyses of social influence. Such analyses often cannot distinguish
cases of social influence from cases where social interaction arises because of shared interests.
Nor can they disentangle social influence from the various contextual pressures that may
produce similar attitudes or behaviors within the network, such as mobilization drives or
media coverage. In light of these many challenges, can observational data provide any insight
into social influence? We believe they can, particularly as a compliment to experimental
designs, which overcome these confounds, but often lack external validity. To eliminate
threats to internal validity, many experimental studies of social influence occur in artificial
laboratory settings (Ahn, Huckfeldt and Ryan 2014; Carlson and Settle 2016; Pietryka
2016; Ryan 2011) or focus on online interaction with newly generated social ties (Klar and
Shmargad 2017; Carlson 2018). Abstract experimental environments provide well-identified
causal estimates, but these precise treatment effects often lack a specific real-world analogue.
In light of these many challenges to both internal and external validity, some scholars may
be tempted to abandon the study of social influence altogether. Rather than run from
27

these challenges, we believe scholars should explore their theories with multiple methods,
leveraging the advantages of each. At the same time, reviewers must recognize that no
single dataset, regression, or experimental design can address all of these challenges at once.
Evaluating theories of social influence requires both experimental work demonstrating a
clear causal mechanism and observational work demonstrating a substantively significant
real-world relationship.
28

References
Ahn, T. K., Robert Huckfeldt and John Barry Ryan. 2014. Experts, Activists, and Interdependent
Citizens: Are Electorates Self-Educating? New York, NY: Cambridge University Press.
Alford, Robert R. and Harry M. Scoble. 1968. “Sources of Local Political Involvement.”
American Political Science Review 62(04):1192–1206.
Anoll, Allison P. 2018. “What Makes a Good Neighbor? Race, Place, and Norms of Political
Participation.” American Political Science Review 112(3).
Ansolabehere, Stephen and Eitan Hersh. 2012. “Validation: What Big Data Reveal About
Survey Misreporting and the Real Electorate.” Political Analysis 20(4):437–459.
Berent, Matthew K., Jon A. Krosnick and Arthur Lupia. 2016. “Measuring Voter Registration
and Turnout in Surveys Do Official Government Records Yield More Accurate Assessments?”
Public Opinion Quarterly 80(3):597–621.
Bernstein, Robert, Anita Chadha and Robert Montjoy. 2001. “Overreporting Voting: Why It
Happens and Why It Matters.” Public Opinion Quarterly 65(1):22–44.
Bond, Robert M., Christopher J. Fariss, Jason J. Jones, Adam D. I. Kramer, Cameron Marlow,
Jaime E. Settle and James H. Fowler. 2012. “A 61-million-person experiment in social
influence and political mobilization.” Nature 489(7415):295–298.
Brenner, Philip S. 2012. “Overreporting of voting participation as a function of identity.” The
Social Science Journal 49(4):421–429.
Buuren, Stef van and Karin Groothuis-Oudshoorn. 2011. “mice: Multivariate Imputation by
Chained Equations in R.” Journal of Statistical Software 45(3):1–67.
29

Carlson, Taylor N. 2018. “Modeling Political Information Transmission as a Game of Tele-
phone.” The Journal of Politics 80(1):348–352.
Carlson, Taylor N. and Jaime E. Settle. 2016. “Political Chameleons: An Exploration of
Conformity in Political Discussions.” Political Behavior pp. 1–43.
Deutsch, Morton and Harold B. Gerard. 1955. “A study of normative and informational social
influences upon individual judgment.” The Journal of Abnormal and Social Psychology
51(3):629–636.
Duncan, Otis Dudley, Archibald O. Haller and Alejandro Portes. 1968. “Peer Influences on
Aspirations: A Reinterpretation.” American Journal of Sociology 74(2):119–137.
Erickson, Bonnie H. 1988. The Relational Basis of Attitudes. In Social Structures: A Network
Approach, ed. Barry Wellman and S. D. Berkowitz. New York, NY: Cambridge University
Press pp. 99–121.
Eulau, Heinz and Lawrence Rothenberg. 1986. “Life space and social networks as political
contexts.” Political Behavior 8(2):130–157.
Eveland, William P and Myiah Hutchens Hively. 2009. “Political Discussion Frequency,
Network Size, and “Heterogeneity” of Discussion as Predictors of Political Knowledge and
Participation.” Journal of Communication 59(2):205–224.
Festinger, Leon, Stanley Schachter and Kurt W. Back. 1950. Social Pressures in Informal
Groups: A Study of Human Factors in Housing. Stanford University Press.
Fitton, Martin. 1973. “Neighbourhood and Voting: a Sociometric Examination.” British
Journal of Political Science 3(04):445–472.
30

Fowler, James H. 2005. Turnout in a Small World. In The Social Logic of Politics: Personal
Networks as Contexts for Political Behavior, ed. Alan S. Zuckerman. Philadelphia: Temple
University Press pp. 269–287.
Fowler, James H., Michael T. Heaney, David W. Nickerson, John F. Padgett and Betsy Sinclair.
2011. “Causality in Political Networks.” American Politics Research 39(2):437–480.
Franco, Annie, Neil Malhotra, Gabor Simonovits and L. J. Zigerell. 2017. “Developing
Standards for Post-Hoc Weighting in Population-Based Survey Experiments.” Journal of
Experimental Political Science 4(2):161–172.
Glaser, William A. 1959. “The Family and Voting Turnout.” Public Opinion Quarterly
23(4):563–570.
Goffman, Erving. 1959. The Presentation of Self in Everyday Life. United States: Anchor
Books.
Goffman, Erving. 1967. Interaction Ritual: Essays on Face-to-Face Behavior. Garden City,
N.Y.: Doubleday. OCLC: 550570.
Harell, Allison. 2009. “Equal Participation but Separate Paths?: Women’s Social Capital and
Turnout.” Journal of Women, Politics & Policy 30(1):1–22.
Holbrook, Allyson L. and Jon A. Krosnick. 2010. “Social desirability bias in voter turnout
reports Tests using the item count technique.” Public Opinion Quarterly 74(1):37–67.
Homans, George Caspar. 1961. Social behavior: its elementary forms. New York, NY: Harcourt,
Brace, and Wrold, Inc.
Huckfeldt, R. Robert. 1979. “Political Participation and the Neighborhood Social Context.”
American Journal of Political Science 23(3):579.
31

Huckfeldt, R. Robert, Paul E. Johnson and John D. Sprague. 2004. Political disagreement:
the survival of diverse opinions within communication networks. New York, NY: Cambridge
University Press.
Huckfeldt, Robert. 2001. “The Social Communication of Political Expertise.” American
Journal of Political Science 45(2):425–438.
Huckfeldt, Robert. 2007. “Unanimity, Discord, and the Communication of Public Opinion.”
American Journal of Political Science 51(4):978–995.
Huckfeldt, Robert and Jeanette Morehouse Mendez. 2008. “Moths, Flames, and Political
Engagement: Managing Disagreement Within Communication Networks.” The Journal of
Politics 70(01):83–96.
Huckfeldt, Robert, Jeanette Morehouse Mendez and Tracy Osborn. 2004. “Disagreement,
Ambivalence, and Engagement: The Political Consequences of Heterogeneous Networks.”
Political Psychology 25(1):65–95.
Huckfeldt, Robert and John Sprague. 1995. Citizens, Politics, and Social Communication:
Information and Influence in an Election Campaign. New York: Cambridge University Press.
Huckfeldt, Robert and John Sprague. 2006. Presidential Election Campaign Study, 1984:
South Bend, Indiana. Technical report Inter-university Consortium for Political and Social
Research [distributor] Ann Arbor, MI: . https://doi.org/10.3886/ICPSR06522.v1.
Jang, Seung-Jin. 2009. “Are Diverse Political Networks Always Bad for Participatory Democ-
racy? Indifference, Alienation, and Political Disagreements.” American Politics Research
37(5):879–898.
Karp, Jeffrey A. and David Brockington. 2005. “Social Desirability and Response Validity:
A Comparative Analysis of Overreporting Voter Turnout in Five Countries.” Journal of
Politics 67(3):825–840.
32

Keele, Luke, Corrine McConnaughy and Ismail White. 2012. “Strengthening the Experi-
menter’s Toolbox: Statistical Estimation of Internal Validity.” American Journal of Political
Science 56(2):484–499.
Kenny, Christopher B. 1992. “Political Participation and Effects from the Social Environment.”
American Journal of Political Science 36(1):259.
Kim, Joohan, Robert O. Wyatt and Elihu Katz. 1999. “News, Talk, Opinion, Participation:
The Part Played by Conversation in Deliberative Democracy.” Political Communication
16(4):361–385.
Klar, Samara and Yanna Krupnikov. 2016. Independent Politics: How American Disdain for
Parties Leads to Political Inaction. New York, NY: Cambridge University Press.
Klar, Samara and Yotam Shmargad. 2017. “The Effect of Network Structure on Preference
Formation.” The Journal of Politics 79(2):717–721.
Klofstad, Casey A., Anand Edward Sokhey and Scott D. McClurg. 2013. “Disagreeing about
Disagreement: How Conflict in Social Networks Affects Political Behavior.” American
Journal of Political Science 57(1):120–134.
Klofstad, Casey A, Scott D McClurg and Meredith Rolfe. 2009. “Measurement of Political
Discussion Networks A Comparison of Two “Name Generator” Procedures.” Public Opinion
Quarterly 73(3):462–483.
Knoke, David. 1990. “Networks of Political Action: Toward Theory Construction.” Social
Forces 68(4):1041–1063.
Kropko, Jonathan, Ben Goodrich, Andrew Gelman and Jennifer Hill. 2014. “Multiple
Imputation for Continuous and Categorical Data: Comparing Joint Multivariate Normal
and Conditional Approaches.” Political Analysis 22(4):497–519.
33

Lake, Ronald La Due and Robert Huckfeldt. 1998. “Social Capital, Social Networks, and
Political Participation.” Political Psychology 19(3):567–584.
Larson, Jennifer M. and Janet I. Lewis. 2017. “Ethnic Networks.” American Journal of Political
Science 61(2):350–364.
Laumann, Edward O. 1973. Bonds of pluralism: The form and substance of urban social
networks. Wiley-Interscience.
Leighley, Jan E. 1990. “Social Interaction and Contextual Influences On Political Participa-
tion.” American Politics Quarterly 18(4):459–475.
Marsden, P. V. 1987. “Core discussion networks of Americans.” American Sociological Review
52(1):122–131.
Mcclurg, Scott D. 2003. “Social Networks and Political Participation: The Role of Social
Interaction in Explaining Political Participation.” Political Research Quarterly 56(4):449
–464.
McClurg, Scott D. 2006. “The Electoral Relevance of Political Talk: Examining Disagreement
and Expertise Effects in Social Networks on Political Participation.” American Journal of
Political Science 50(3):737–754.
McDonald, Michael P. 2016. “Voter Turnout.”. http://www.electproject.org/home/voter-
turnout/voter-turnout-data. Date accessed: 2016-06-15.
McLeod, Jack M., Dietram A. Scheufele and Patricia Moy. 1999. “Community, Communication,
and Participation: The Role of Mass Media and Interpersonal Discussion in Local Political
Participation.” Political Communication 16(3):315–336.
34

Miller, Patrick R., Piotr S. Bobkowski, Daniel Maliniak and Ronald B. Rapoport. 2015.
“Talking Politics on Facebook Network Centrality and Political Discussion Practices in
Social Media.” Political Research Quarterly 68(2):377–391.
Mutz, Diana C. 2002. “The Consequences of Cross-Cutting Networks for Political Participa-
tion.” American Journal of Political Science 46(4):838–855.
Mutz, Diana C. and Jeffery J. Mondak. 1997. “Dimensions of Sociotropic Behavior: Group-
Based Judgements of Fairness and Well-Being.” American Journal of Political Science
41:284–308.
Nickerson, David W. 2008. “Is Voting Contagious? Evidence from Two Field Experiments.”
American Political Science Review 102(01):49–57.
Nir, Lilach. 2005. “Ambivalent Social Networks and Their Consequences for Participation.”
International Journal of Public Opinion Research 17(4):422–442.
Nir, Lilach. 2011. “Disagreement and Opposition in Social Networks: Does Disagreement
Discourage Turnout?” Political Studies 59(3):674–692.
Oliver, J. Eric. 1996. “The Effects of Eligibility Restrictions and Party Activity on Absentee
Voting and Overall Turnout.” 40:498–513.
Olsen, Marvin E. 1972. “Social Participation and Voting Turnout: A Multivariate Analysis.”
American Sociological Review 37(3):317–333.
Pietryka, Matthew T. 2016. “Accuracy Motivations, Predispositions, and Social Information
in Political Discussion Networks.” Political Psychology 37(3):367–386.
Pietryka, Matthew T. and Donald A. Debats. 2017. “It’s Not Just What You Have, but Who
You Know: Networks, Social Proximity to Elites, and Voting in State and Local Elections.”
American Political Science Review 111(2):360–378.
35

Pollock, Philip H. 1982. “Organizations as Agents of Mobilization: How Does Group Activity
Affect Political Participation?” American Journal of Political Science 26(3):485–503.
R Core Team. 2017. “R: A Language and Environment for Statistical Computing.”.
https://www.R-project.org/.
Rainey, Carlisle. 2014. “Arguing for a Negligible Effect.” American Journal of Political Science
58(4):1083–1091.
Rolfe, Meredith. 2012. Voter Turnout: A Social Theory of Political Participation. New York,
NY: Cambridge University Press.
Rubin, Donald B. 2009. Multiple Imputation for Nonresponse in Surveys. John Wiley & Sons.
Ryan, John Barry. 2011. “Social Networks as a Shortcut to Correct Voting.” American Journal
of Political Science 55(4):753–766.
Sallach, David. L, Nicholas Babchuk and Alan Booth. 1972. “Social Involvement and Political
Activity: Another View.” Social Science Quarterly 52(4):879–892.
Scheff, Thomas J. 1988. “Shame and conformity: The deference-emotion system.” American
Sociological Review 53(3):395–406.
Scheufele, Dietram A. 2000. “Talk or conversation? Dimensions of interpersonal discussion
and their implications for participatory democracy.” Journalism and Mass Communication
Quarterly 77(4):727–743.
Scheufele, Dietram A., Matthew C. Nisbet, Dominique Brossard and Erik C. Nisbet. 2004.
“Social Structure and Citizenship: Examining the Impacts of Social Setting, Network Het-
erogeneity, and Informational Variables on Political Participation.” Political Communication
21(3):315–338.
36

Siegel, David A. 2013. “Social Networks and the Mass Media.” American Political Science
Review 107(04):786–805.
Silver, Brian D., Barbara A. Anderson and Paul R. Abramson. 1986. “Who Overreports
Voting?” American Political Science Review 80:613–624.
Sinclair, Betsy. 2012. The Social Citizen: Peer Networks and Political Behavior. Chicago, IL:
University of Chicago Press.
Straits, Bruce C. 1990. “The Social Context of Voter Turnout.” Public Opinion Quarterly
54(1):64–73.
Suhay, Elizabeth. 2015. “Explaining group influence: The role of identity and emotion in
political conformity and polarization.” Political Behavior 37(1):221–251.
Tam Cho, Wendy K. 1999. “Naturalization, Socialization, Participation: Immigrants and
(Non-) Voting.” The Journal of Politics 61(04):1140–1155.
Timpone, Richard J. 1998. “Ties That Bind: Measurement, Demographics, and Social
Connectedness.” Political Behavior 20(1):53–77.
Tversky, Amos and Daniel Kahneman. 1973. “Availability: A heuristic for judging frequency
and probability.” Cognitive Psychology 5(2):207–232.
Uhlaner, Carole J. 1989. “Rational Turnout - the Neglected Role of Groups.” American Journal
of Political Science 33:390–422.
VanderWeele, Tyler J. 2011. “Sensitivity Analysis for Contagion Effects in Social Networks.”
Sociological Methods & Research 40(2):240–255.
Wolfinger, Nicholas H. and Raymond E. Wolfinger. 2008. “Family Structure and Voter
Turnout.” Social Forces 86(4):1513–1528.
37

Zaller, John and Stanley Feldman. 1992. “A Simple Theory of the Survey Response: Answering
Questions and Revealing Preferences.” American Journal of Political Science 36:579–616.
Zipp, John F. and Joel Smith. 1979. “The Structure of Electoral Political Participation.”
American Journal of Sociology 85(1):167–177.
38
Top Related