


Languages
Pages
Legal


www.elsevier.com/locate/hal
Harmful Algae 6 (2007) 547–566
The response of zooplankton and phytoplankton from the
North American Great Lakes to filtration
Allegra A. Cangelosi a,*, Nicole L. Mays a, Mary D. Balcer b, Euan D. Reavie c,Donald M. Reid d, Rochelle Sturtevant a,1, Xueqing Gao e,2
a Northeast-Midwest Institute, 50 F St., N.W., Suite 950, Washington, DC 20001, USAb University of Wisconsin-Superior, P.O. Box 2000, Superior, WI 54880, USA
c Natural Resources Research Institute, University of Minnesota Duluth, 1900 East Camp St., Ely, MN 55731, USAd 200 Grandview Rd. Nepean, Ontario, Canada K2H 8B1
e Kent State University, Kent, OH 44242, USA
Received 27 September 2006; received in revised form 30 October 2006; accepted 21 November 2006
Abstract
Filtration of ballast water was investigated as a means of minimizing the introduction of nonindigenous zooplankton and
phytoplankton by ships visiting the North American Great Lakes-St. Lawrence Seaway system (GLSLSS). An automatic backwash
screen filtration (ABSF) system with nominal filtration options of 25, 50 or 100 mm was mounted on the deck of an operating
Seaway-sized dry bulk carrier, the MV Algonorth. Water was pumped through the ABSF with a deck mounted pump at 341 m3 hr�1
during routine ship operations in the GLSLSS, and effectiveness of the various screen pore sizes at removing taxonomic categories
of zooplankton and phytoplankton was measured using matched treatment and control ballast tanks. The smallest pore sizes (25 and
50 mm) performed better than the 100 mm pore size at removing biological material. There was no difference in the filtration
efficiency of the 25 and 50 mm screens relative to macro- or microzooplankton in these tests, but this result was probably due to low
densities of macrozooplankton, and soft-bodied (aloricate) characteristics of the microzooplankton present. The 25 and 50 mm pore
sizes were subjected to more controlled tests on board a stationary barge platform equipped with triplicate 700 L catchment bins
moored in Duluth Harbor of Lake Superior. In these tests, filter pore size, organism size and rigidity influenced zooplankton removal
efficiency by the ABSF. The 25 mm screen reduced both macrozooplankton and microzooplankton significantly more than the
50 mm screen. Zooplankton width was more determinative of filtration performance than length, and both filters removed loricate
species of rotifers significantly more efficiently than aloricate species of the same length and width size classes. The 25 and 50 mm
ABSF also significantly reduced algal densities, with the exception of colonial and filamentous green algae (50 mm only). Filter
efficiency relative to algal particles was influenced by filter pore size, organism morphology and structure, and intake density, while
algal particle size was not determinative. This research provides compelling evidence that 25 or 50 mm filtration is a potentially
powerful means of reducing densities of organisms discharged by ships operating in the Great Lakes but an additional treatment step
would be necessary to effectively minimize risk and meet the International Maritime Organization’s discharge standards associated
with organisms of all sizes in the water column.
# 2007 Elsevier B.V. All rights reserved.
Keywords: Ballast water; Filtration; Great Lakes; Phytoplankton; Treatment; Zooplankton
* Corresponding author. Tel.: +1 202 544 5200; fax: +1 202 544 0043.
E-mail address: [email protected] (A.A. Cangelosi).1 Present address: Great Lakes Environmental Research Lab, 2205 Commonwealth Blvd, Ann Arbor, MI 48105, USA.2 Present address: Florida Department of Environmental Protection, 2600 Blair Stone Rd., Mail Station 3565, Tallahassee, FL 32399, USA.
1568-9883/$ – see front matter # 2007 Elsevier B.V. All rights reserved.
doi:10.1016/j.hal.2006.11.005
A.A. Cangelosi et al. / Harmful Algae 6 (2007) 547–566548
1. Introduction
Over 160 nonindigenous aquatic species have
become established in the North American Great Lakes
due to a variety of transport vectors (Ricciardi, 2001;
Colautti et al., 2003). Since the opening of the St.
Lawrence Seaway waterborne transportation system in
1959 linking this mammoth fresh water system to the
Atlantic Ocean for shipping, commercial vessels have
become the primary vector of transport of these
organisms (e.g., Mills et al., 1993; Ricciardi and
MacIsaac, 2000). Ballast water is likely responsible for
a majority (70%) of these established species, and for a
full 40% of the total of introduced aquatic organisms
(Grigorovich et al., 2003). Negative ecological effects
of aquatic invaders in the lakes range from the highly
visible, such as habitat destruction, to the insidious,
such as the degradation of nutritional value of forage
base for fish.
Impacts of nonindigenous species, almost always
regional in scope initially, can also rapidly expand to
become national or continental problems. The poster
child of ballast-mediated invasions in the Great Lakes,
the Zebra mussel (Dreissena polymorpha), is now
established in all five Great Lakes, many inland lakes of
the Great Lakes region, and most of the large navigable
rivers in the eastern United States and Canada. The
species is associated with a wide range of changes to
inland lake and river ecosystems, specifically impacting
native populations of mussels and zooplankton.
Research has also shown that lakes colonized by zebra
mussels can have, on average, three times higher levels
of the cyanobacterium, Microcystis (Sarnelle et al.,
2005). Those same lakes may also have approximately
two times greater levels of microcystins, toxins
produced by the cyanobacteria that that can poison
aquatic organisms as well as wildlife, domestic animals,
and humans (Vanderploeg et al., 2001). Economically,
the biofouling capabilities of zebra mussels have also
caused widespread impact to hydroelectric and nuclear
power plants, public water supply plants, and industrial
facilities. Park and Hushak (1999) report that the
species cost Great Lakes raw water users alone over $20
million dollars per year in added maintenance during
the 1990s.
Despite the ecological and economic impact of past
introductions like the zebra mussel, nonindigenous
species continue to be introduced to the Great Lakes.
Because the Great Lakes supply drinking water to more
than 25 million North Americans, of grave concern are
transfers of organisms which present public health
threats, such as red tide and pathogens. Johengen et al.
(2005) recently identified microbial pathogens, including
Vibrio cholerae, Cryptosporidium parvum, Giardia
lamblia, Encephalitozoon intestinalis, and Pfiesteria
piscicida, among others, in ballast residuals of overseas
vessels that entered the Great Lakes. The same authors
also identified the brown-tide organism, Aureococcus
anophagefferens, in two vessels entering the Great Lakes
that had exchanged their ballast in the open ocean.
Requirements for vessels entering the Great Lakes
from outside the 200-mile exclusive economic zone to
manage their ballast water were first established by
Congress in the National Aquatic Nuisance Prevention
and Control Act of 1990 (P.L. 101–646). In 1996, through
the National Invasive Species Act (P.L. 104–332),
Congress expanded the scope of this prevention program
to a national level. Other nations with ballast manage-
ment requirements include Australia, Brazil, Chile,
Israel, Canada, and New Zealand. The International
Maritime Organization (IMO) has called for ballast
management through voluntary action since 1997.
In the United States, both the Great Lakes and the
national programs require ships to either conduct a
purge of ballast water tanks in the open ocean (ballast
water exchange) or to treat ballast water prior to
discharging in a United States port. Ballast water
exchange has proved to be a helpful but limited
prevention method which both industry representatives
and environmental activists consider an interim stopgap
measure. Problems associated with ballast water
exchange include: vessels in the unballasted condition
cannot conduct complete exchange of their ballast water
and thereby purge residuals due to load limits; not all
ships are structurally designed to safely carry out the
process in the open-ocean, even when empty of cargo;
the process may not be possible in rough weather; some
coastal organisms can survive in ocean water; ballast
water exchange does little or nothing to attenuate risk of
transfers by ships plying exclusively near coastal areas;
and finally, ballast water exchange effectiveness trials
have produced mixed and inconsistent results, and
implementation is difficult to monitor for enforcement
purposes with any precision (Cangelosi and Mays,
2006). Most important to residents of the North
American Great Lakes system, treatment of ballast
water could resolve the problems associated with
resuspension and subsequent discharge of unexchanged
ballast residuals by ships. Approximately 90% of ship
visits to the system each year are by ships in the
unballasted condition which carry unexchanged ballast
residuals (Holeck et al., 2004).
The inadequacy of ballast water exchange as a long
term prevention practice led Congress to establish a

A.A. Cangelosi et al. / Harmful Algae 6 (2007) 547–566 549
federal program to hasten development of effective
ballast treatment alternatives. Moreover, the IMO
recently negotiated a detailed and quantitative discharge
standard and a set of deadlines for the treatment of
ballast water as part of an international convention
(IMO, 2004). Pending United States legislation, the
National Aquatic Invasive Species Act of 2005 (S. 770)
and the Ballast Water Management Act of 2005 (S.
363), would establish a national standard for ballast
water discharged in United States waters.
Ballast water treatment options currently under
consideration include filtration, cyclonic separation,
heat, biocidal chemicals, ultraviolet irradiation, acous-
tics, ozonation, nitrogenation, cavitation, and deox-
ygenation. Though some large-scale evaluations have
been undertaken (e.g., Kuzirian et al., 2001; Sutherland
et al., 2001; Tamburri et al., 2002; Waite et al., 2003),
many options remain largely theoretical or tested only
in laboratory-based facilities primarily because large-
scale demonstrations of treatment systems are both
expensive and difficult to undertake successfully, and no
official guidelines are available to steer efforts. But
without large-scale analysis of prospective treatments,
little can be learned of their ultimate utility or
effectiveness on board a ship. Some treatments have
been well-tested for other applications, and simply
require vetting for the shipboard ballast treatment
context.
The National Research Council of the National
Academies of Sciences reviewed the potential of a
variety of treatment processes to reduce ballast-
mediated introductions of aquatic invasive species.
The report identified filtration as one of the most
promising processes (NRC, 1996). Filtration of ballast
water is a straightforward means of reducing transfers
of aquatic organisms by ships that would physically
separate organisms from ballast uptake for discharge to
the source harbor prior to the ship’s departure. In this
way, filtration could prevent altogether the movement of
many near coastal organisms across the open ocean—
formerly a natural barrier to transoceanic dispersal—as
well as the unwanted accumulation of sediments in
ballast systems. Filtration also offers the advantage of
producing no residuals such as waste heat or chemical
by-products, and is an established water treatment
technology which is currently available at the capacities
required for shipboard use.
At a given flow rate the filter’s footprint increases as
mesh size decreases. Accordingly, the lower bound filter
mesh size suitable to a shipboard application is
governed by available space and ballast throughput
requirements of the carrier. It is likely that at a minimum
current filter designs can accommodate the range of
flow requirements of many classes of ships of concern in
global movements of organisms—including container
ships, small tankers, cruise ships and St. Lawrence
Seaway-sized bulk cargo carriers—at a pore size small
enough to exclude a large proportion of organisms
within taxa of known concern, including fish, benthic
and epibenthic organisms, and many forms of plankton
(Cangelosi, 2002). Moreover, filtration has the potential
to enhance effectiveness or complement many second-
ary treatment options, such as ultraviolet irradiation and
environmentally-sound chemicals, by removing parti-
culate matter that may consume or interfere with these
treatments as well as most zooplankton and phyto-
plankton taxa from the intake stream. The technology
also could afford financial benefits to the carrier by
reducing problems associated with sedimentation in
ballast tanks. Finally, filtration is versatile—equally
effective for ships in the ballasted and unballasted
condition, in salt and freshwater conditions, and along
trade routes that are coastwise as well as transoceanic.
Filtration comprises several distinct technologies,
which vary fundamentally in their approach to
removing particles and self cleaning. These differences
in turn imply a variety of incumbent impacts in the
shipboard context, including footprint size, pressure
drop, and the number of moving parts and types of
structural materials subject to maintenance. This study
focused on the biological effectiveness of perhaps the
simplest filtration technology, automatic backwash
screen filtration (ABSF), which involves passing raw
water through a planar mesh screen. The system
evaluated was a self-cleaning system already in use in
shore-based facilities for removing zebra mussel
veligers from power plant intake flows. Pore sizes
tested, 25, 50 and 100 mm, represent a range of
operational challenge and biological effectiveness. The
biological evaluations reported here were conducted in
tandem with operational research on the same filtration
technology, which has been reported elsewhere (Par-
sons and Harkins, 1999). In combination the two types
of research provide a vital fact base for regulators and
ship owners to estimate the potential utility of ABSF as
an approach to shipboard ballast filtration. However,
this research is also informative on the prospective
effectiveness of filtration, generally, against a range of
taxonomic categories often encountered in harbors of
ballast uptake at a variety of pore sizes in high flow
situations.
The present study of ABSF effectiveness was
conducted using two distinct experimental platforms:
the commercial bulk cargo vessel, the MV Algonorth,

A.A. Cangelosi et al. / Harmful Algae 6 (2007) 547–566550
Fig. 1. (a) The MV Algonorth, a Seaway-sized dry bulk carrier used to evaluate the biological effectiveness of a deck-mounted ABSF ballast water
treatment system with nominal filtration options of 25, 50 and 100 mm. (b) Overview of the deck-mounted ABSF ballast water treatment system used
evaluated onboard the MV Algonorth, a Seaway-sized dry bulk carrier.
and the stationary barge moored in Duluth-Superior
Harbor of Lake Superior (Figs. 1a,b-2). The MV
Algonorth offered advantages in that its voyage pattern
between the Gulf of St. Lawrence and the western-most
Great Lakes ports provided real shipboard conditions in
both fresh and salt-water environments. In contrast, the
Fig. 2. The barge platform, moored in the Duluth-Superior Harbor of Lake Su
water treatment system with nominal filtration options of 25 or 50 mm.
barge offered a more controlled testing environment,
and exposed the filtration system to heavier loads of
sediment and algae typical of many shallow-water
harbors. The shipboard analysis was conducted first.
Based on the preliminary information on the operational
feasibility and biological effectiveness of ABSF at a
perior, used to evaluate the biological effectiveness of an ABSF ballast

A.A. Cangelosi et al. / Harmful Algae 6 (2007) 547–566 551
variety of pore sizes in the shipboard context,
investigators refined the treatment system configuration
and pore size range to optimize the system from an
engineering and biological standpoint. This optimized
configuration was subjected to more controlled study in
the barge-based context. Together the two testing
venues provided a rich opportunity for exploring
potential effectiveness of ABSF as a component of a
ballast treatment system.
2. Methods
2.1. Treatment system
The automatic backwash screen filter (ABSF) tested
was an Ever-Clear Filter designed by Ontario Hydro
Technologies, Inc. to remove zebra mussel veligers from
high flow intake streams for power production facilities.
The prototype ABSF unit consisted of a cylindrical filter
element 76 cm in diameter contained within a 1.48 m
long by 0.94 m diameter cylindrical steel canister. The
filter element was removable facilitating the installation
of various mesh screen sizes. The unit was designed for a
flow rate of 341 m3 hr�1 to provide flow conditions in the
range of those encountered in ballast systems of some
Seaway-sized ships. AGodwin 20 cm � 15 cm HL6 Dri-
Prime pump driven by a John Deere 6081T diesel engine
powered flow conditions of 341 m3 hr�1 at 483 kPa;
shut-off head 827 kPa. Water entered and exited via
20 cm inlet and outlet connections. Periodically, the build
up of filtered material on the inside of the filter element
would cause a pressure drop, activating a backwash
process involving the rotation of suction heads within the
filter element to suction-off the filtered material and
discharge it into the source water system.
2.2. Shipboard tests
2.2.1. MV Algonorth experimental platform
The ship platform for the experiment was the MV
Algonorth, a Seaway-sized bulk carrier managed by
Algoma Central Marine (now Seaway Marine Trans-
port) of St. Catharines, Ontario. Flagged in Canada and
built in 1971, the vessel is 222 m long by 23 m wide. It
has a depth of 13 m, a gross registered tonnage of
18,496 MT, a total cargo capacity of 26,000 MT, and a
dedicated ballast tank capacity of 10,600 MT. The
vessel ballast system comprises five pairs of port and
starboard wing tanks, with upper and lower structural
components, one fore peak, and one aft peak tank. Two
pumps deliver a combined ballast pumping capacity of
1998 m3 hr�1.
At the time of the testing, the vessel was employed in
the Great Lakes/Gulf of St. Lawrence bulk trade. A
typical voyage pattern involved the movement of iron
ore from ports in the Gulf of St. Lawrence to ports in the
Great Lakes via the St. Lawrence Seaway, and the return
movement of grain from upper Great Lakes ports to the
Gulf of St. Lawrence.
Matching No. 3 upper wing ballast tanks of 220 m3
capacity each were used as the dedicated treatment
(port) and control (starboard) tanks. Temporary steel
extensions and covers were fitted to the upper end of the
lower portions of the ballast tanks so that the sections
could function independently, essentially turning the
upper portions of the wing tanks into separate topside
tanks. Raised manhole hatches were retrofitted to
facilitate frequent access to the tanks from the deck for
biological sampling. Steel platforms were installed
below the access hatches to support the operator while
collecting biological samples. Plankton net trolleys
were installed within the tanks to facilitate replicate and
spatially comprehensive biological sampling. Trolley
cables ran along identical 10 m transects in the
treatment and control tanks from the lower aft to the
upper forward corners of each tank.
Two ABSF filter units—a 250 mm prefilter and either
a 25, 50, or 100 mm screen polishing filter—were
installed in series and contained within a 6 � 2 � 1.5 m
container module located on the MV Algonorth’s deck,
near amidships on the port side. The diesel pump was
located directly across the deck from the container
module. The filter backwash discharge lines exited the
container low on the outboard side and were directed
overboard. Dedicated 20 cm steel intake pipes were
installed to allow withdrawal of water for experimental
purposes from the No. 4 starboard ballast tank (1999 m3
capacity) using a 20 � 30 cm reducer bell mouth
located near the bottom of the tank, or directly from
a dedicated sea suction. Intake flow could be directed—
through the filter units (in series) or bypassing them—
into the matched ballast tanks. Alternatively, flow could
be sent directly overboard via 15 cm diameter discharge
piping. The diesel pump was also used to empty the
tanks. The engineering details of the shipboard test
platform design are described by the designers in
Parsons et al. (1997).
2.2.2. Experimental design
The matched treatment and control tanks were filled
during vessel transits specifically for experimental
purposes using the deck mounted pump. Table 1 details
the location within the Great Lakes-Saint Lawrence
Seaway System of each trial. Control water bypassed the

A.A. Cangelosi et al. / Harmful Algae 6 (2007) 547–566552
Table 1
Location of shipboard treatment trials conducted on board the MV
Algonorth using ABSF at various pore sizes (25, 50, and 100 mm)
Location Date Trial# Filter screen
size (mm)
Lake Huron 3-Oct 1 25
Lake Michigan 4-Oct 2 25
Gulf of St. Lawrence 20-Oct 3 25
Lake St. Clair 27-Aug 1 50
Lake Huron 28-Aug 2 50
Lake Ontario 23-Oct 3 50
Gulf of St. Lawrence 27-Sep 1 100
Gulf of St. Lawrence 28-Sep 2 100
Lake Ontario 1-Oct 3 100
treatment system, while test water was routed through the
treatment equipment into the test tank. Treatment and
control tanks were filled to one-third capacity in sequence
and then topped up to two-thirds capacity (approx.
200 m3) allowing room in the upper portion of the tank
for the sampling operator. This filling scenario was
especially important to help assure homogeneity between
the test and control source water when the ship was in
transit during ballasting. In some cases, the No. 4
starboard tank was used as a common source reservoir for
the treatment and control tanks. In these instances, the
flow was diverted over the side of the vessel for at least
5 min prior to filling the test and control tanks to
eliminate settled materials which could be picked up by
the initial flow. The time required to fill the two
experimental tanks was approximately 1.5 h, i.e., 45 min
per tank.
Each of the three polishing filter screen mesh sizes—
25, 50, or 100 mm—was tested at least three times for its
effectiveness at reducing plankton abundance in ballast
water compared to non-treated ballast water. In order to
avoid distortions resulting from test tank contamination
by residual water from previous tests, screen mesh sizes
were tested in cycles from smallest to largest, and the
tanks were cleaned with high pressure water before the
ascending order of tests was repeated.
2.2.3. Biological sampling
Three replicate samples were collected from each
tank first with an 80 mm mesh standard 0.5 m diameter
and 1.5 m long plankton net, and then with a 20 mm
mesh net of the same dimensions. Both types of net
were towed along the 10 m diagonal transect trolley
cable at a consistent velocity of approximately
0.5 m s�1 filtering approximately 0.64 m3 of water into
a 1 L sample collected in a terminal cod end. Each
plankton net tow lasted about 5 min from start to finish
(including rinsing and replacing the net for the next tow)
and was conducted at least 5 min after the prior tow to
allow the water column to return to relative equilibrium.
All samples were immediately immobilized with 1 mL
Lugol’s solution, and preserved in 10% Lugol’s solution
following collection of all samples (within one hour).
2.2.4. Zooplankton analysis
The zooplankton samples were counted, sorted into
taxonomic categories and measured at a shore-side
laboratory. Prior to analysis, samples were decanted
through a 20 mm lab filter, rinsed into a beaker and
diluted with tap water to obtain between 200 and 500
organisms per 1 mL subsample. The diluted sample was
stirred in a figure eight motion with a Henson-Stempel
pipette prior to removing three 1 mL subsamples and
placing them in Sedgewick-Rafter counting chambers.
One subsample was taken from near the top of the well
mixed sample, one from the middle, and the third from
near the bottom. Using a stereomicroscope, subsamples
from the 20 mm net sample were analyzed for micro-
zooplankton and subsamples from the 80 mm net samples
were analyzed for macrozooplankton. Microzooplankton
consisted entirely of rotifers which were identified to
genus. Macrozooplankton species were sorted by major
taxonomic/morphological category: bivalve larvae,
copepod nauplii, immature copepodites, adult copepods,
and cladocerans. Following analysis, concentrations in
the subsamples were averaged and converted to number
per liter of original water sample. A subset of organisms
from each sample (approx. 100 individuals) was also
measured for length at this time using a calibrated
eyepiece micrometer at 100� magnification.
2.2.5. Phytoplankton analysis
Following zooplankton analysis, portions of the
20 mm net samples were transferred to a second shore-
side laboratory for phytoplankton analysis. Phytoplank-
ton were sorted into six taxonomic/morphological
categories and counted. The categories were: diatoms
<50 mm, centric diatoms (including the genus Cyclo-
tella), pennate diatoms (including the genera Synedra,
Asterionella, Navicula, Cymbella, Gyrosigma, Gom-
phonema, Epithemia, Nitzschia, Cymatopleura, and
Surirella), ‘‘spiny’’ dinoflagellates, ‘‘round’’ dinofla-
gellates, and the colonial green alga Pediastrum. Algal
particles were identified and enumerated using a
Sedgewick rafter counting chamber (total volume
1 mL) and a Zeiss Axioskop 20 (Carl Zeiss, West
Germany) microscope using brightfield and differential
interference contrast optics at 200� magnification.
Samples of water treated by the 25 mm mesh ABSF
were not diluted due to the low abundance of particles.

A.A. Cangelosi et al. / Harmful Algae 6 (2007) 547–566 553
Samples of water treated by larger ABSF mesh sizes (50
and 100 mm mesh) were diluted 5–10 times to facilitate
counting. Cell counts were performed by counting a
portion of the Sedgewick rafter to ensure that more than
100 cells were counted for each group when possible.
Rare genera or groups were counted by examining the
entire rafter. The total cell counts were then converted to
cells per liter.
2.2.6. Data analysis
In light of the variation in ambient assemblage and
density across trials, treatment performance was
evaluated and cross compared for the most part in
terms of mean removal efficiencies, i.e. % reductions.
Absolute densities were also determined across treat-
ments and controls, and maximum densities in treated
discharge were reported for purposes of comparison
with proposed or existing treatment performance
standards. Treatment effects on the zooplankton
taxonomic categories, and phytoplankton taxonomic
categories were analyzed separately.
Within each trial, zooplankton and phytoplankton
counts for each taxonomic category within the three
plankton net samples of treated water and three plankton
net samples of control water were averaged separately.
For a given filter pore size, mean percent reductions were
calculated across replicate trials for each taxonomic
category with adequate densities for statistical analysis.
For a given trial, only those taxonomic categories whose
mean densities were equal to or greater than 5% of the
mean densities of total zooplankton or phytoplankton
present were included in statistical analysis. Differences
in mean removal efficiencies across screen pore sizes
were detected using t tests with p � 0.05 as the criterion
for a statistical significance. All density results were
reported as the mean value of the triplicate samples
within a trial �1 standard error.
Size data relative to specific taxonomic categories
were similarly averaged across trials for a given screen
size. Filtration efficiencies were compared within size
classes across control and filter-treated samples for
statistical significance. Only size classes of a taxonomic
category comprising organism densities of at least 5%
of the mean densities of the organisms of that taxonomic
category in the control samples were subjected to
statistical analysis.
2.2.7. Quality assurance/quality control
Testing was conducted consistent with the U.S.
Environmental Protection Agency’s quality assurance
program protocols, including standard biological and
operational protocols and procedures relative to
experimental design and replication, sample collection,
field data completedness, sample handling and chain of
custody requirements, data analysis, and instrument and
equipment calibration, inspection and maintenance, etc.
2.3. Stationary barge experimental platform
2.3.1. Experimental infrastructure
Following completion of the shipboard trials, the
supply pump module and filter container module were
transferred to a 20 � 8 m stationary barge platform
moored at the Port Authority of Duluth in Duluth-
Superior Harbor of Lake Superior. Based on operational
results of the shipboard trials, the 250 mm prefilter unit
was considered unnecessary to improve operational
performance, and not included in the barge-based
filtration system (Parsons and Harkins, 1999). Instead,
the pump suction (used for both treatment and control
water intake) was fitted with a 0.05 m perforated screen
intake to strain out larger particles that could damage the
filters. The rest of the instrumentation and flow
conditions were configured as on board the MV
Algonorth. Water depth was 6–7 m, and the suction pipe
depth was adjusted to maintain a level of 1–2 m from the
harbor bottom. The flow of water from the intake line
could be directed through or by-pass the filter. Flow
downstream of the filter/bypass was subdivided by piping
and valves into three outlet streams of equivalent volume
and flow rate. Three 700 L cylindrical cone-bottom
catchment tubs each with a 10.2 cm diameter drain pipe
at the bottom were installed downstream of the
subdivision. The subdivided discharge streams were
directed into the three catchment tubs for near
simultaneous filling. Preliminary tests revealed equiva-
lent particle distribution among the three catchment tubs
upon filling. Parsons and Harkins (1999) detail the design
and engineering of the barge test platform.
2.3.2. Experimental design
Prior to each trial, the system was flushed for 15 min.
Flow was then directed through the ABSF and discharged
into the three catchment tubs, filling them simultaneously
to an overflow condition within 5 min. Flow was stopped
and the tubs were immediately drained completely from
the bottom through 20 mm mesh plankton nets fitted with
1 L cod ends. The samples were immobilized immedi-
ately with 1 mL Lugol’s solution, and preserved within
one hour using 10% Lugol’s solution for later analysis of
zooplankton and phytoplankton. The mechanical system
was then adjusted to by-pass the filter, the untreated water
directed into the catchment tubs, and after overflow,
drained and sampled through the 20 mm mesh nets.

A.A. Cangelosi et al. / Harmful Algae 6 (2007) 547–566554
Following each test, the filter screen was removed for
cleaning and replaced with a clean filter screen for the
next day’s testing. Catchment tubs and plankton nets
were rinsed with city water filtered to 1 mm between
control and test runs. Four trials were conducted using the
25 mm ABSF, and three trials using the 50 mm ABSF.
2.3.3. Zooplankton analysis
At a shoreside facility, the 700 L catchment tub
samples, concentrated into a 1 L cod end on the barge,
were further concentrated through a 20 mm lab filter and
processed for sorting, counting and sizing as described
above for the MV Algonorth zooplankton samples. As
before, rotifers were identified to genus, cladocerans to
family or genus, and copepods to suborder and
developmental stage (nauplius, immature, adult).
Abundance data was converted to number per liter of
original water sample.
After identification and enumeration, up to 50 intact
specimens of each taxonomic category were measured
for detailed size analysis from each treatment on each
sampling date for length and width using a calibrated
eyepiece micrometer at 100�magnification. The spines
of the rotifers Keratella and Kellicottia were included in
the measurements since these spines were rigid and
generally intact, thus increasing the effective size of the
organism. The flexible ‘‘paddles’’ of Polyarthra were
found in various positions and were not included in
determining body size. Synchaeta and Conochilus,
being soft-bodied, were often found in a contracted
form. Tail spines of cladocerans were not included in
the length measurements because they were usually
broken. Lengths of copepods did not include the
terminal setae on the caudal rami.
2.3.4. Phytoplankton analysis
Phytoplankton analysis (counting, sorting and siz-
ing) for the barge-based tests was also similar to the
methods used for the MV Algonorth trials. In the case of
the barge tests, based on the range of organisms present
and abundant, algal particles were sorted into twelve
taxonomic/morphological categories. The categories
were: unicellular pennate diatoms (including the genera
Navicula, Cymbella, Gyrosigma, Gomphonema,
Epithemia, Nitzschia, Cymatopleura, and Surirella),
unicellular centric diatoms (including the genus
Cyclotella), filamentous centric diatoms (including
the genus Aulacoseira), Fragilaria-like colonial dia-
toms (including the genera Fragilaria, Meridion,
Diatoma and Tabellaria), colonial green algae (includ-
ing the genera Eudorina, Pleodorina, Micractinium and
Coelastrum), filamentous green algae (including the
genus Spirogyra), Pediastrum (all species), colonial
cyanobacteria (including the genera Anacystis and
Gomphosphaeria), filamentous cyanobacteria (includ-
ing the genus Anabaena), chrysophytes (including the
genus Dinobryon), dinoflagellates (including the genera
Ceratium and Peridinium), and protozoa (including the
genera Codonella, Tintinnidium and Tintinnopsis).
Cell measurement was performed on a Zeiss
Axioskop 20 microscope (Carl Zeiss, West Germany)
using a 10 X objective with an eyepiece micrometer at a
total magnification of 200 X. Unicellular pennate
diatoms, colonial cyanobacteria, colonial green algae,
filamentous diatoms, dinoflagellates, and protozoa were
all measured by length (longest axis) and width (longest
axis perpendicular to the length). Unicellular centric
diatoms and Pediastrum were measured by diameter.
Fragilaria-like diatoms were measured by the width
(i.e. cell length) and the length of the colony.
Filamentous cyanobacteria were measured by filament
length only, the width of the filament cells being very
small and uniform (�5 mm). Chrysophytes were
measured by the number of loricae in the colony.
2.3.5. Data analysis and quality assurance
All data analysis and quality assurance measures for
the barge-based tests were consistent with those used
for the MV Algonorth tests, described above.
3. Results
3.1. MV Algonorth tests
3.1.1. Zooplankton
Three trials at each of the three filter pore sizes
provided sufficient data for determining estimates of
filter efficiency at removing macrozooplankton and
total zooplankton. Microzooplankton were present in
adequate densities for separate analysis in all three
50 mm filter trials, but in only two out of three trials of
the 25 mm filter, and one out of three in the 100 mm
trials. Table 2 summarizes mean densities of organisms
in control samples for each taxonomic group subject to
analysis.
Both the 25 and 50 mm filters significantly reduced
macrozooplankton and total zooplankton densities
compared to non-treated (control) densities with the
25 mm ABSF delivering 94 and 91% reductions
compared to controls, respectively; and the 50 mm
ABSF delivering 94 and 89% reductions, respectively.
The 100 mm caused an 83 and 79% reduction in
macrozooplankton and total zooplankton abundance,
respectively, but did not significantly reduce either

A.A. Cangelosi et al. / Harmful Algae 6 (2007) 547–566 555
Table 2
Average densities of zooplankton (mean � S.E.) in control samples and % reduction by treatment relative to control densities (mean � S.E.) for each
taxonomic group subject to analysis in trials conducted on board the MV Algonorth and the barge platform using ABSF at various pore sizes (25, 50,
and 100 mm)
Platform Filter screen
size (mm)
Taxonomic group Average number of
organisms per L � S.E.
N Mean% reduction by ABSF
relative to control densities � S.E.
MV Algonorth 25 Microzooplankton 4 � 1 2 85
25 Macrozooplankton 4 � 3 3 94 � 3
25 Total zooplankton 7 � 2 3 91 � 5
50 Microzooplankton 6 � 3 3 81 � 0
50 Macrozooplankton 9 � 2 3 94 � 4
50 Total zooplankton 15 � 4 3 89 � 3
100 Microzooplankton 17 � 0 1 68
100 Macrozooplankton 9 � 8 3 83 � 9
100 Total zooplankton 15 � 13 3 79 � 4
Barge platform 25 Microzooplankton 314 � 58 4 81 � 1
25 Macrozooplankton 81 � 100 4 100 � 0
25 Total zooplankton 395 � 64 4 85 � 1
50 Microzooplankton 272 � 60 3 71 � 3
50 Macrozooplankton 82 � 26 3 97 � 1
50 Total zooplankton 353 � 36 3 78 � 1
density relative to controls, largely due to the wide
variation in performance by this filter screen size across
trials compared to controls.
All three filters appeared to remove macrozooplank-
ton more efficiently than microzooplankton (Fig. 3),
and the 25 and 50 mm filters appeared more efficient
than the 100 mm filter at removing microzooplankton.
However, these differences were not statistically
significant because microzooplankton were present in
Fig. 3. Relative efficiency of 25, 50, and 100 mm ABSF at reducing densities
to controls in trials conducted on board the MV Algonorth (mean � S.E.
significantly ( p < 0.05) different ABSF performance. Asterisks indicate sign
(data were insufficient).
inadequate densities for statistical analysis in trials
testing the 25 and 100 mm filters. Trials for which there
were adequate densities of microzooplankton showed a
mean reduction of 85% due to 25 mm filtration (N = 2),
81% due to 50 mm filtration (N = 3, Table 2), and 68%
due to 100 um filtration (n = 1).
The average absolute concentrations of zooplankton
in water treated with 25 and 50 mm ABSF were 1 � 0
and 2 � 1 organisms per liter, respectively. Maximum
of microzooplankton, macrozooplankton and total zooplankton relative
). Within zooplankton categories, different letters (a, b, c) indicate
ificant reductions ( p < 0.05) relative to controls. NC = not calculated

A.A. Cangelosi et al. / Harmful Algae 6 (2007) 547–566556
Fig. 4. Relative efficiency of 25, 50, and 100 mm ABSF at reducing zooplankton densities by length size class in trials conducted on board the MV
Algonorth (mean � S.E.). Within length size classes, different letters (a, b, c) indicate significantly ( p < 0.05) different ABSF performance.
Asterisks indicate significant reductions ( p < 0.05) relative to controls.
zooplankton densities in treatment samples were to 1
and 3 organisms per liter, respectively.
In terms of zooplankton size, the effectiveness of all
three filter pore sizes tended to increase as length size
class increased (Fig. 4), but the differences were not
statistically significant. The 25 mm filter removed more
than 84% of organisms with lengths between 50 and
200 mm, and more than 95% of organisms with lengths
greater than 200 mm. The 50 mm filter removed more
than 87% of organisms with lengths between 50 and
200 mm, and more than 91% of organisms with lengths
greater than 200 mm. The 100 mm filter removed more
than 68% of organisms with lengths between 50 and
200 mm, and more than 80% of organisms with lengths
greater than 200 mm. There also was no significant
difference between the performances of the 25 and
50 mm screens at removing zooplankton in any of the
length size classes. However, the 50 mm filter removed
zooplankton with lengths between 51 and 200 mm
significantly better than the 100 mm filter, and both the
25 and 50 mm filters removed zooplankton with lengths
201–350 mm better than the 100 mm filter.
3.2. Phytoplankton
Filter effectiveness relative to total phytoplankton and
particular phytoplankton categories at each of the three
filter pore sizes was difficult to assess due to large
variations in control densities between trials. For
example, densities of phytoplankton in ballast water
not subject to treatment in MV Algonorth trials ranged
from 71 to 4602 cells per liter for the 25 mm ABSF trials,
7–31 cells per liter for the 50 mm ABSF trials, and 31–
590 cells per liter for the 100 mm ABSF trials. There also
were insufficient numbers of individuals within trials to
determine if any of the screen sizes reduced phyto-
plankton cell concentrations significantly differently
than the other sizes, with the exception of diatoms
<50 mm and total density counts (all taxonomic
categories combined) where there were no significant
differences in performance among screen sizes (Fig. 5).
Mean removal efficiencies for total phytoplankton by the
25 and 50 mm filter screens were 37.5%, and 8.3%
respectively. Maximum phytoplankton densities in
ballast water discharge treated by 25, 50, and 100 mm
ABSF were 1382, 21, and 168 cells per liter, respectively.
3.3. Stationary barge platform
3.3.1. Zooplankton
In the barge-based tests, four trials of the 25 mm
ABSF and three trials of the 50 mm ABSF provided
adequate data for determining relative filter efficiency at
removing total zooplankton, and macro- and micro-
zooplankton specifically. Table 2 summarizes densities
of organisms in control samples for each taxonomic
group subject to analysis.
Both the 25 and 50 mm ABSF significantly reduced
macrozooplankton, microzooplankton and total zoo-
plankton densities relative to control densities, and the

A.A. Cangelosi et al. / Harmful Algae 6 (2007) 547–566 557
Fig. 5. Relative efficiency of 25, 50, and 100 mm ABSF at reducing densities of diatoms <50 mm, centric diatoms, pennate diatoms, ‘‘spiny’’
dinoflagellates, ‘‘round’’ dinoflagellates, Pediastrum, and total phytoplankton relative to controls in trials conducted on board the MV Algonorth
(mean � S.E.). Within phytoplankton categories, different letters (a, b, c) indicate significantly ( p < 0.05) different ABSF performance. NC = not
calculated (data were insufficient).
25 mm ABSF was significantly more effective than the
50 mm ABSF (Fig. 6). Macrozooplankton densities
were reduced by over 99% of the control density with
the 25 mm filter and by 97% with the 50 mm filter. The
25 mm filter reduced microzooplankton densities by
81% compared to a 71% reduction with the 50 mm filter.
Overall, the 25 mm filter resulted in an 85% removal of
zooplankton while the 50 mm filter achieved an average
reduction of 78%.
Maximum residual concentrations of macrozoo-
plankton in water treated with 25 and 50 mm ABSF
were to 1 and 6 organisms per liter, respectively.
Fig. 6. Relative efficiency of 25 and 50 mm ABSF at reducing densities of m
controls in trials conducted on board the barge-based platform (mean � S
significantly ( p < 0.05) different ABSF performance. Asterisks indicate si
Maximum residual concentrations of microzooplankton
in water treated by 25 and 50 mm ABSF were to 86 and
90 organisms per liter, respectively. Mean absolute
concentrations of zooplankton (macro- and microzoo-
plankton) with widths>50 mm in discharge from the 25
and 50 mm filters were 21 and 55 per liter, respectively.
The analysis of filter efficiency relative to organism
length and width revealed organism width to be more
determinative than length. Filtration using this ABSF
system caused a greater than 90% reduction in
zooplankton densities compared to control densities
only in length size classes more than four times the
icrozooplankton, macrozooplankton and total zooplankton relative to
.E.). Within zooplankton categories, different letters (a, b) indicate
gnificant reductions ( p < 0.05) relative to controls.

A.A. Cangelosi et al. / Harmful Algae 6 (2007) 547–566558
Fig. 7. Relative efficiency of 25 and 50 mm ABSF at reducing zooplankton densities by length (top) and width (bottom) size class in trials conducted
on board the barge-based platform (mean � S.E.). Within size classes, different letters (a, b) indicate significantly ( p < 0.05) different ABSF
performance. Asterisks indicate significant reductions ( p < 0.05) relative to controls. NC = not calculated (data were insufficient).
nominal filter pore size (i.e., 151 mm length size class
and greater for the 25 mm ABSF, and 201 mm length
size class and greater for the 50 mm ABSF, respectively;
Fig. 7). In contrast, both filter sizes (25 and 50 mm)
reduced concentrations of organisms by greater than
90% in width size classes equal to twice the nominal
filter pore size (i.e., 50 mm width size class and greater
for the 25 mm ABSF, and 101 mm width size class and
greater for the 50 mm ABSF, respectively; Fig. 7). The
25 mm filter was significantly better than the 50 mm
filter at reducing zooplankton with widths in the 50–
100 mm size range and the 101–150 mm size range.
Above these width classes, the two filter sizes did not
perform statistically differently.
Microzooplankton data within the two smallest
width size classes were further analyzed for 25 and
50 mm filtration efficiency relative to hard-bodied
(loricate) versus soft-bodied (aloricate) rotifer genera.
There was no difference in control densities of either
morphological category across the width size classes
analyzed. Both the 25 and 50 mm ABSF screens
reduced loricate rotifers significantly more than
aloricate rotifers with widths <50 mm and between
51 and 100 mm (Fig. 8).
3.3.2. Phytoplankton
The stationary barge platform afforded greater
consistency in intake densities across taxonomic
categories of phytoplankton than the shipboard plat-
form. As a result, each of the three trials at each filter
pore size (25 and 50 mm) provided sufficient data for
determining algal removal efficiency. In these tests, 25
and 50 mm ABSF significantly reduced algal densities
relative to controls across all taxonomic groups with the

A.A. Cangelosi et al. / Harmful Algae 6 (2007) 547–566 559
Fig. 8. Relative efficiency of 25 and 50 mm ABSF at reducing hard-bodied (loricate) and soft-bodied (aloricate) rotifer densities relative to controls
by width size class in trials conducted on board the barge-based platform (mean � S.E.). Within size classes, different letters (a, b) indicate
significantly ( p < 0.05) different ABSF performance. Asterisks indicate significant reductions ( p < 0.05) relative to controls.
Fig. 9. Relative efficiency of 25 and 50 mm ABSF at reducing phytoplankton densities (top) and eliminating particular particle sizes (bottom) across
taxonomic categories relative to controls in trials conducted on board the barge-based platform (mean � S.E.). Lowercase letters denote similar (a/a)
or significantly different (a/b) results between 25 and 50 mm treatments for each phytoplankton group, and asterisks indicate significant differences
from controls (t-test, p < 0.05). NC = not calculated (data were insufficient or incompatible measurement regimes were used).
A.A. Cangelosi et al. / Harmful Algae 6 (2007) 547–566560
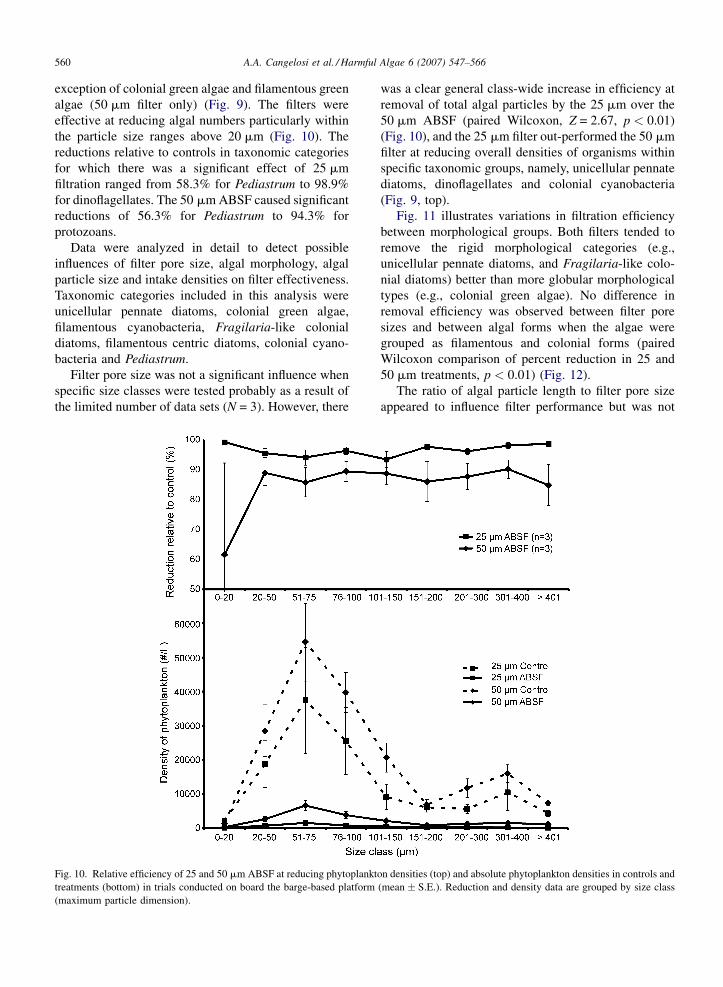
exception of colonial green algae and filamentous green
algae (50 mm filter only) (Fig. 9). The filters were
effective at reducing algal numbers particularly within
the particle size ranges above 20 mm (Fig. 10). The
reductions relative to controls in taxonomic categories
for which there was a significant effect of 25 mm
filtration ranged from 58.3% for Pediastrum to 98.9%
for dinoflagellates. The 50 mm ABSF caused significant
reductions of 56.3% for Pediastrum to 94.3% for
protozoans.
Data were analyzed in detail to detect possible
influences of filter pore size, algal morphology, algal
particle size and intake densities on filter effectiveness.
Taxonomic categories included in this analysis were
unicellular pennate diatoms, colonial green algae,
filamentous cyanobacteria, Fragilaria-like colonial
diatoms, filamentous centric diatoms, colonial cyano-
bacteria and Pediastrum.
Filter pore size was not a significant influence when
specific size classes were tested probably as a result of
the limited number of data sets (N = 3). However, there
Fig. 10. Relative efficiency of 25 and 50 mm ABSF at reducing phytoplankt
treatments (bottom) in trials conducted on board the barge-based platform
(maximum particle dimension).
was a clear general class-wide increase in efficiency at
removal of total algal particles by the 25 mm over the
50 mm ABSF (paired Wilcoxon, Z = 2.67, p < 0.01)
(Fig. 10), and the 25 mm filter out-performed the 50 mm
filter at reducing overall densities of organisms within
specific taxonomic groups, namely, unicellular pennate
diatoms, dinoflagellates and colonial cyanobacteria
(Fig. 9, top).
Fig. 11 illustrates variations in filtration efficiency
between morphological groups. Both filters tended to
remove the rigid morphological categories (e.g.,
unicellular pennate diatoms, and Fragilaria-like colo-
nial diatoms) better than more globular morphological
types (e.g., colonial green algae). No difference in
removal efficiency was observed between filter pore
sizes and between algal forms when the algae were
grouped as filamentous and colonial forms (paired
Wilcoxon comparison of percent reduction in 25 and
50 mm treatments, p < 0.01) (Fig. 12).
The ratio of algal particle length to filter pore size
appeared to influence filter performance but was not
on densities (top) and absolute phytoplankton densities in controls and
(mean � S.E.). Reduction and density data are grouped by size class

A.A. Cangelosi et al. / Harmful Algae 6 (2007) 547–566 561
Fig. 11. Comparison of average algal particle size in treated water (top) and average change in particle size following filtration (bottom) along the
gradient of filter performance in trials conducted on board the barge-based platform (mean � S.E.). Algal groups shown are unicellular pennate
diatoms (UPD), colonial green algae (CGA), filamentous cyanobacteria (FC), Fragilaria-like colonial diatoms (Frag), filamentous centric diatoms
(FCD), colonial cyanobacteria (CC) and Pediastrum (Ped).

A.A. Cangelosi et al. / Harmful Algae 6 (2007) 547–566562
Fig. 12. Densities of colonial and filamentous phytoplankton particles in controls and water treated using 25 mm (top) and 50 mm (bottom) ABSF in
trials conducted on board the barge-based platform (mean � S.E.). Particles were grouped by size class to evaluate variations related to the maximum
dimension of particles.
always determinative. The 25 mm screen was more
likely than the 50 mm screen to remove large unicellular
pennate diatoms (e.g. greater than 100 mm). Average
particle size in discharge from 50 mm treatment was
greater than 200 mm, while average particle size in
discharge from the 25 mm filter was less than 100 mm.
However, both screens performed similarly well relative
to filamentous centric diatoms greater than 100 mm; and
average particle size in discharge from both filters was
greater than 200 mm.
The influences of particle morphology on algal
particle removal did not appear independent of each
other. Rigid particles of 101–150 mm were more
efficiently removed by the 25 mm screen than the
50 mm screen (Fig. 11). Meanwhile longer filaments
well above the filter pore size were removed equally
well by both filters.
Finally, these tests showed no notable increases in
numbers of smaller algal particles in treated versus
control water. The only apparent exception was the
25 mm screen, which had a slightly higher number of
colonial forms in the filtered water, relative to the
control. Certain algal forms, i.e., unicellular pennate
diatoms (25 mm treatment) and colonial cyanobacteria
(50 mm treatment), had smaller particles in filtered
water when compared to controls. However, other forms
showed little change in the average particle size
following filtration.
4. Discussion
This research explored the potential of shipboard
filtration as a means of reducing ballast-mediated
introductions of aquatic invasive species into the Great
Lakes by commercial ships. Specifically, the study
evaluated the effect of treatment by three pore sizes of
automatic backwash screen filtration on the densities of
major taxonomic groupings of ambient plankton in the
shipboard context throughout the North American Great
Lakes system and through more controlled experiments

A.A. Cangelosi et al. / Harmful Algae 6 (2007) 547–566 563
on a stationary barge-based platform moored in Lake
Superior.
Testing the same filter system and pore sizes on the
two different experimental platforms proved useful in
evaluating the relationship between screen filtration
pore size and effectiveness against a variety of
taxonomic categories of plankton. The shipboard
analysis yielded preliminary findings to assess the
workable range of effective filtration pore sizes under
more ‘‘real world’’ conditions. The more detailed
barge-based findings provided insight into the possible
relationship of organism size, morphology, and intake
densities to the effectiveness of screen filtration. In
combination, this information serves as a basis for
cautious speculation relative to prospective effective-
ness of screen filters at removing ambient organisms in
the Great Lakes, and beyond. Coupled with operational
evaluations of the same filter systems reported by
Parsons and Harkins (1999), this investigation also
suggests the level of filtration which could optimize
operational and biological performance, and the
relationship between that nexus and what might be
needed to meet current and pending ballast water
treatment discharge standards.
The biological findings show that screen filtration at
25 and 50 mm had clear strengths as a potential ballast
treatment. First, it can deliver significant reductions in
plankton densities. Indeed, the reductions in macro-
zooplankton caused by ABSF in the barge-based tests
were striking—greater than 99% for the 25 mm screen,
and 97% for the 50 mm screen. The two filter pore sizes
were capable of removing 99% and 91% of dino-
flagellates, respectively, relative to controls. Moreover,
filtration outcomes were quite consistent across trials.
Despite the small difference in pore size between the
two filters tested and the limited number of trials for
each experiment (N = 3), the barge-based tests showed
the 25 mm screen afforded significant advantages over
the 50 mm screen, especially with respect to removal of
microzooplankton (81 relative to 71%) and several
categories of phytoplankton (unicellular pennate dia-
toms, dinoflagellates and colonial cyanobacteria).
However, this biological study also showed that
treatment with ABSF would have to be enhanced with
additional treatment to adequately minimize discharges
of entrained organisms to meet prevailing international
standards and to remove all risk. Specifically, these tests
indicate that ABSF alone, even at 25 mm, would be
unlikely to deliver ballast discharge that complies with
recent International Maritime Organization standards.
The IMO Convention on Ballast Water calls for ballast
discharge containing no more than 10 viable organisms
per m3 of 50 mm or greater minimum dimension, a size
descriptive of many zooplankton. It also limits
discharge of smaller organisms (10–50 mm in minimum
dimension) to no more than 10 organisms per mL, and
sets specific discharge limits for selected bacteria.
ABSF is limited in part because many of the organisms
in the latter two regulatory categories (e.g. picoeukar-
yotes) are smaller than even the minimum available
pore sizes for high-flow screen filtration (25 mm).
However, even if requirements on organisms larger than
50 mm in minimum dimension are considered alone, the
ABSF evaluated in this study would not meet the IMO
standard. In barge tests, reductions relative to zoo-
plankton width, while significant for all size bins greater
than the nominal filter size, reached 90% only for
organisms with widths of twice the nominal filter size
and above. The 25 mm ABSF, for example, removed
less than 80% of the zooplankton with widths of 50–
100 mm. In terms of absolute concentrations of
organisms, discharge of MV Algonorth ballast water
treated with 25 and 50 mm ABSF averaged 90 � 20
macrozooplankton per m3, and 640 � 470 macrozoo-
plankton per m3, respectively. Only the lowest discharge
densities for macrozooplankton in the MV Algonorth
tests approached the IMO standard (60 organisms per
m3 after treatment with the 25 mm screen, and 140
organisms per m3 after treatment with the 50 mm
screen); the maximum residual concentrations of
macrozooplankton in water treated with 25 and
50 mm ABSF were 120 and 1590 per m3, respectively.
In barge-based tests, the lowest discharge densities
observed were 200 macrozooplankton per m3 after
treatment with the 25 mm screen, and 870 per m3 after
treatment with the 50 mm screen; maximum discharges
ranged to 580 macrozooplankton per m3 after treatment
with the 25 mm screen, and 6,110 per m3 after treatment
with the 50 mm screen. It is possible that some of these
macrozooplankton ranged below the 50 mm in mini-
mum dimension, but it is more likely that many
microzooplankton in a ship’s discharge will range
greater than 50 mm in minimum dimension. In the barge
tests, where microzooplankton were abundant, mean
absolute densities of zooplankton generally with widths
>50 mm in water treated with the 25 and 50 mm filters
were 21,090 and 54,500 per m3, respectively.
It should be noted that the specific filter system tested
was a prototype unit, and while no correctable
equipment flaws were evident during the biological
tests, it is conceivable that improvements in the
construction or design of ABSF system could reduce
the number of larger organisms detected in treated
discharge. However, even optimally designed screen

A.A. Cangelosi et al. / Harmful Algae 6 (2007) 547–566564
filters are expected to remove less than 100% of the
particles larger than the filters’ nominal rating in real
world high flow applications. Indeed, Parsons and
Harkins (1999) observed based on their operational
evaluations relative to general particle removal that the
filter units tested performed well from an engineering
standpoint across platforms at a mean efficiency above
the nominal pore size of 88 and 90%, respectively.
Failure to meet IMO criteria as a stand alone system
in no way diminishes the potential utility of filtration as
a component of an effective treatment system. If filters
should be employed in this way, this research provided
useful information about pore size, and organism
morphology, structure, density and size as influences on
filtration efficiency. In particular, our observations
about the effect of specific features of organism
morphology on ABSF performance could help in
anticipating the potential ABSF contribution to treat-
ment effectiveness of a compound treatment system
against a variety of organisms.
For example, in this study, the same filter screen
removed hard-bodied (loricate) species of rotifers more
efficiently than soft-bodied (aloricate) species of rotifers
within the same length and width size classes. The lower
rate of removal of microzooplankton within the MV
Algonorth tests relative to the barge based tests could be
explained in part by the dominance of Polyarthra, a soft-
bodied rotifer, in the natural assemblage associated with
the shipboard tests. Accordingly, at a given filter pore
size and within a given set of common algal size classes,
rigid algal particles appeared more readily removed than
globular forms. For example, the colonial green alga
Pediastrum was more poorly removed than rigid
filamentous phytoplankton perhaps because their softer
cell walls allow colonies to distort and so pass through
pores smaller than their diameter. This effect was not
simply an artifact of algal particle shape as colonial
forms and filamentous forms were equivalently removed
by the filters. These results suggest that a secondary
treatment system used to complement filtration would
need to have particular effectiveness on soft-bodied
plankton.
Meanwhile, organism density and particle size above
the filters’ nominal pore size were surprisingly weak
influences on filter performance. It could be postulated
that filter efficiency would improve in higher density
conditions due to crowding at the filter. However, these
tests suggest that filtration during algal bloom condi-
tions will result in commensurately higher numbers of
algae in filtered water with filtration efficiency
relatively unchanged. It also may have been expected
that larger algal particles would be necessarily more
effectively captured than smaller particles by a given
filter screen. Our findings show that there was no overall
increase in performance efficiency across phytoplank-
ton size classes above the nominal filter pore size. Part
of the problem here may have been the expression of
size for algal particles, or the fact that their morphology
is not streamlined. We found that among rigid-bodied
rotifers, size did influence filter effectiveness and width
was far more predictive of filtration efficiency than
length.
Complicating prediction of filtration efficiency on any
of the above potential influences is the likelihood of their
interaction with each other. For example, morphology,
pore size and particle size appeared to interact to
influence filter efficiency. Specifically, the ratio of algal
particle length to pore size appeared to predispose certain
rigid algae to selective capture by or penetration of filters,
suggesting that they may be able to tip into and spear
through the 50 mm pores more readily than the 25 mm
pores. Meanwhile longer filaments well above the filter
pore size were removed equally well by both filters. More
testing regarding this issue would be necessary to
generate more conclusive results.
An important consideration relative to filtration of
algal particles is whether filaments and other colonies
might be broken up by the filters into more abundant
propagule units. These tests suggest that the filters do
not have this undesirable effect. The slightly higher
number of colonial forms in the 25 mm filtered water
combined with the apparent poor percent reduction of
algae in the smallest size class may be because the
numbers counted in this size class were relatively low.
We attribute the decline in the average size of
unicellular pennate diatoms in treated discharge relative
to controls to smaller cells passing through the filter, and
not fragmentation. It is important to note that if colonies
had been broken up into units well below 20 mm in size,
they could have passed undetected through the 20 mm
control and treatment sampling nets.
When considered in combination with operational
findings of Parsons and Harkins (1999), these biological
findings offer insight into ways to optimize biological
performance in light of operational limitations. In
operational tests conducted by Parsons and Harkins
(1999) net lost flow due to backwash for the 50 mm filter
screen was between 6.8 and 13.5%. In contrast, net lost
flow due to backwash for the 25 mm screen was between
10.6 and 21.2%, approximately 60% more than the
50 mm screen. Use of the 25 mm filter screen also
introduced a greater system pressure drop, further
reducing the net flow rate or requiring a higher pump
capacity to maintain the design ballast flow rate. This

A.A. Cangelosi et al. / Harmful Algae 6 (2007) 547–566 565
lost flow rate has significant implications for ballast
pump sizing to ensure that the ballast time is not
lengthened. The authors therefore did not recommend
use of the 25 mm screen on board a commercial vessel
without significant backwash improvements. These
operational findings raise the issue of how important
from a biological standpoint the smaller pore size may
be. Our study indicates that the 25 mm screen could well
afford significant advantages, especially where smaller
rigid or hard-bodied organisms are prevalent. However,
the findings also show that some form of lethal
secondary treatment will be necessary to enhance
filtration effectiveness irrespective of filter size to
achieve discharge at current and pending regulatory
standards. Moreover, this lethal treatment would require
effectiveness relative to the full spectrum of organisms
in the water column (i.e., across all size categories).
These considerations combined with the operational
findings suggest that enhanced biological efficiency
afforded by 25 mm using the equipment tested may not
justify the operational difficulty involved at this time.
However, should filtration technology improve to allow
a 25 mm screen to perform equally well as the 50 mm
screen tested, the smaller screen size should be used.
In conclusion, the biological findings regarding filter
effectiveness relative to freshwater zooplankton and
phytoplankton from the North American Great Lakes,
demonstrate a strong potential value of filtration as a
primary treatment method due to large and consistent
removal efficiencies of taxonomic categories of known
concern from ballast water. At the same time, they
confirm the need for filtration to be coupled with an
additional treatment step to assure inactivation of
residual organism concentrations across the entire
organism size spectrum.
Acknowledgments
We wish to thank the principal investigators of the
operational research, Richard Harkins and Michael
Parsons, who generated the designs for the test
platforms, and who lent invaluable advice, assistance
and companionship throughout the biological testing.
We thank Algoma Central Marine (now Seaway Marine
Transport) and the officers and crew of the MV
Algonorth, as well as the Port of Duluth/Superior for
providing the venues for our research. We are indebted
to the Great Lakes Protection Fund for its generous
funding in support of the effort. As ever, we greatly
appreciate the insight and good will of Jim Carlton, who
inspired, cheered and helped interpret our work. Finally,
we are indebted to Gustaaf Hallegraeff for inviting our
paper for inclusion in this special issue of Harmful
Algae.[SS]
References
Cangelosi, A., 2002. Filtration as a ballast water treatment measure.
In: Leppakoski, E., Gollasch, S., Olenin, S. (Eds.), Invasive
aquatic species of Europe. Distribution, impacts and management.
Kluwer Academic Publishers, Dordrecht, pp. 511–519.
Cangelosi, A., Mays, N., 2006. Great Ships for the Great Lakes?
Commercial Vessels Free of Invasive Species in the Great Lakes–
St. Lawrence Seaway System. A scoping report for the Great Ships
Initiative. Northeast-Midwest Institute, Washington D.C.
Colautti, R.I., Niimi, A.J., van Overdijk, C.D.A., Mills, E.L., Holeck,
K., MacIsaac, H.J., 2003. Spatial and temporal analysis of trans-
oceanic shipping vectors to the Great Lakes. In: Ruiz, G.M.,
Carlton, J.T. (Eds.), Invasive Species: Vectors and Management
Strategies. Island Press, Washington D.C., pp. 227–246.
Grigorovich, I.A., Colautti, R.I., Mills, E.L., Holeck, K., Ballert, A.G.,
MacIsaac, H.J., 2003. Ballast-mediated animal introductions in
the Laurentian Great Lakes: retrospective and prospective ana-
lyses. Can. J. Fish. Aquat. Sci. 60, 740–756.
Holeck, K.T., Mills, E.L., MacIsaac, H.J., Dochoda, M.R., Colautti,
R.I., Ricciardi, A., 2004. Bridging troubled waters: biological
invasions, transoceanic shipping, and the Laurentian Great Lakes.
BioScience 54 (10), 919–929.
International Maritime Organization, 2004. International Convention
for the Control and Management of Ship’s Ballast Water and
Sediments. International Maritime Organization, London.
Johengen, T., Reid, D., Fahnenstiel, G., MacIsaac, H., Doblin, M.,
Jenkins, P., 2005. Assessment of Transoceanic NOBOB Vessels
and Low-Salinity Ballast Water as Vectors for Non-Indigenous
Species Introductions to the Great Lakes. National Oceanic and
Atmospheric Administration, Great Lakes Environmental
Research Laboratory, Ann Arbor.
Kuzirian, A.M., Terry, E.C.S., Bechtel, D.L., 2001. Hydrogen per-
oxide: An effective treatment for ballast water. Biol. Bull. 201,
297–299.
Mills, E.L., Leach, J.H., Carlton, J.T., Secor, C.L., 1993. Exotic
species in the Great Lakes: a history of biotic crises and anthro-
pogenic introductions. J. Great Lakes Res. 19 (1), 1–54.
National Research Council, 1996. Stemming the tide: Controlling
introductions of nonindigenous species by ships’ ballast water.
National Academy Press, Washington, D.C..
Park, J., Hushak, L.J., 1999. Zebra Mussel Control Costs in Surface
Water Using Facilities. Technical Summary TS-028, Ohio Sea
Grant, Columbus.
Parsons, M.G., Cangelosi, A., Harkins, R.W., Mackey, T.P., Munro,
D.J., 1997. Design of the Great Lakes Ballast Technology Demon-
stration Project. Transactions SNAME 105, 323–348.
Parsons, M.G., Harkins, R.W., 1999. The Great Lakes Ballast Tech-
nology Demonstration Project filtration mechanical test program.
Mar. Technol. 37 (3), 129–140.
Ricciardi, A., 2001. Facilitative interactions among aquatic invaders:
is an ‘‘invasional meltdown’’ occurring in the Great Lakes? Can J.
Fish. Aquat. Sci. 58, 2513–2525.
Ricciardi, A., MacIsaac, H.J., 2000. Recent mass invasion of the North
American Great Lakes by Ponto-Caspian species. TREE. 15 (2),
62–65.
Sarnelle, O., Wilson, A.E., Hamilton, S.K., Knoll, L.B., Raikow, D.E.,
2005. Complex interactions between exotic zebra mussels and the

A.A. Cangelosi et al. / Harmful Algae 6 (2007) 547–566566
noxious phytoplankter. Microcystis aeruginosa. Limnol. Ocea-
nogr. 50, 896–904.
Sutherland, T.F., Levings, C.D., Elliot, C.C., Hesse, W.W., 2001.
Effect of a ballast water treatment system on survivorship of
natural populations of marine plankton. Mar. Ecol. Prog. Ser.
210, 139–148.
Tamburri, M.N., Wasson, K., Matsuda, M., 2002. Ballast water
deoxygenation can prevent aquatic introductions while reducing
ship corrosion. Biol. Conserv. 103, 331–341.
Vanderploeg, H.A., Liebig, J.R., Carmichael, W.W., Agy, M.A.,
Johengen, T.H., Fahnenstiel, G.L., Nalepa, T.F., 2001. Zebra
mussel (Driessena polymorpha) selective filtration promoted toxic
Microcystis blooms in Saginaw Bay (Lake Huron) and Lake Erie.
Can. J. Fish. Aquat. Sci. 58, 1208–1221.
Waite, T.D., Kazumi, J., Lane, P.V.Z., Farmer, L.L., Smith, S.G.,
Smith, S.L., Hitchcock, G., Capo, T.R., 2003. Removal of natural
populations of marine plankton by a large-scale ballast water
treatment system. Mar. Ecol. Prog. Ser. 258, 51–63.
Top Related