


Languages
Pages
Legal

THE PV GAME – ENEL ROUND TABLE March 23 – 2015 VILLA LAZZARONI - ROME
Lourens Vermaak
Sales Manager – Southern Africa
Jinko Solar PTY LTD
South Africa

Jinko Solar’s production Facility – Case Study on logistics
Source: DoE presentation: Round 4 preferred bidders
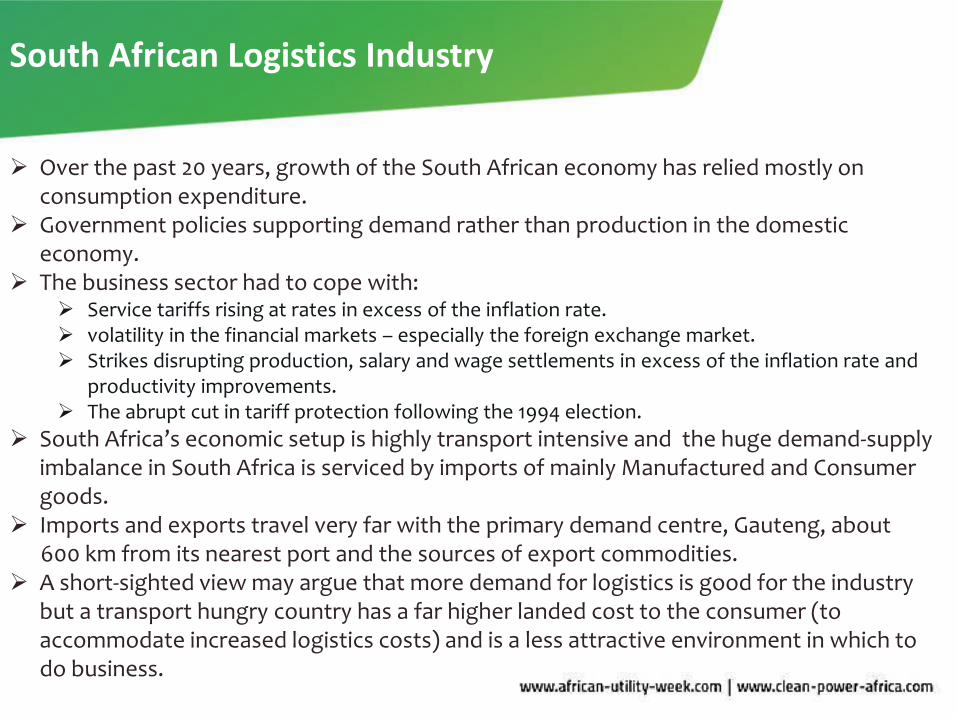
South African Logistics Industry
Over the past 20 years, growth of the South African economy has relied mostly on consumption expenditure.
Government policies supporting demand rather than production in the domestic economy.
The business sector had to cope with: Service tariffs rising at rates in excess of the inflation rate. volatility in the financial markets – especially the foreign exchange market. Strikes disrupting production, salary and wage settlements in excess of the inflation rate and
productivity improvements. The abrupt cut in tariff protection following the 1994 election.
South Africa’s economic setup is highly transport intensive and the huge demand-supply imbalance in South Africa is serviced by imports of mainly Manufactured and Consumer goods.
Imports and exports travel very far with the primary demand centre, Gauteng, about 600 km from its nearest port and the sources of export commodities. A short-sighted view may argue that more demand for logistics is good for the industry
but a transport hungry country has a far higher landed cost to the consumer (to accommodate increased logistics costs) and is a less attractive environment in which to do business.

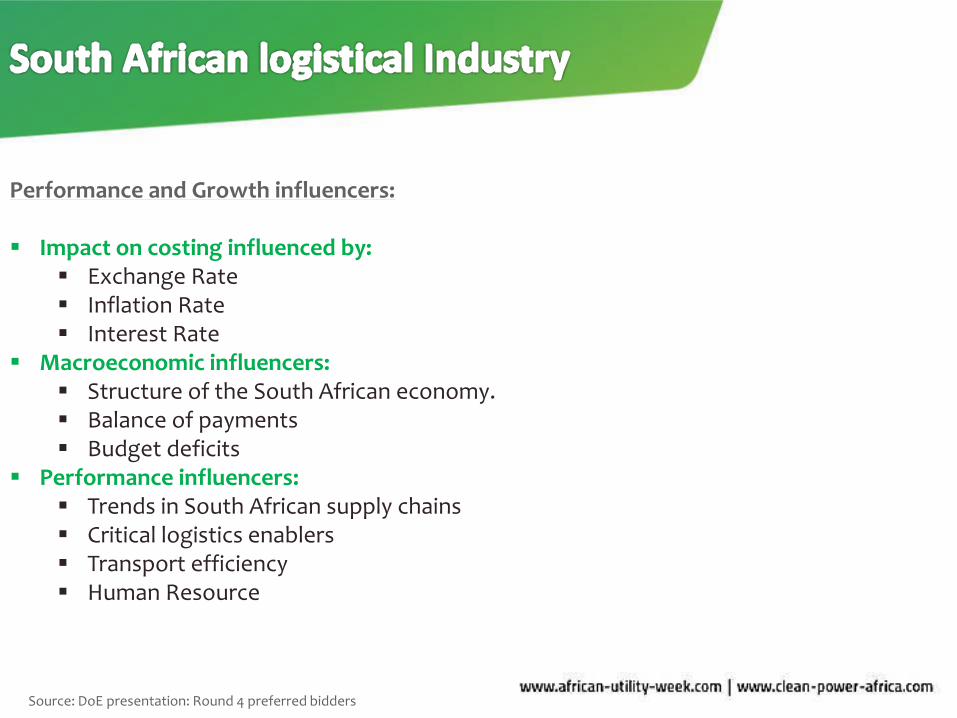
South African Logistics Industry
Infrastructure: 470Billion Rand Industry that has:
Total Railway network: 30 422 track km 20 101 route km
Core Railway network: 12 801 km Proclaimed roads of approximately 535 000 km
366 872 km non-urban roads. +/-300 000 km gravel roads.
South Africa has eight commercial ports Durban/CPT/PE – Main Ports Airports Durban/CPT/Johannesburg
Industry that has moved beyond survival mode to optimised mode where costs, inventories and lead times have been minimised.
Source: DoE presentation: Round 4 preferred bidders
Performance and Growth influencers: Impact on costing influenced by:
Exchange Rate Inflation Rate Interest Rate
Macroeconomic influencers: Structure of the South African economy. Balance of payments Budget deficits
Performance influencers: Trends in South African supply chains Critical logistics enablers Transport efficiency Human Resource
Jinko Solar production Facility

Source: DoE presentation: Round 4 preferred bidders
Study Index:
Trends in South African supply chains Critical logistics enablers Transport efficiency Human Resource
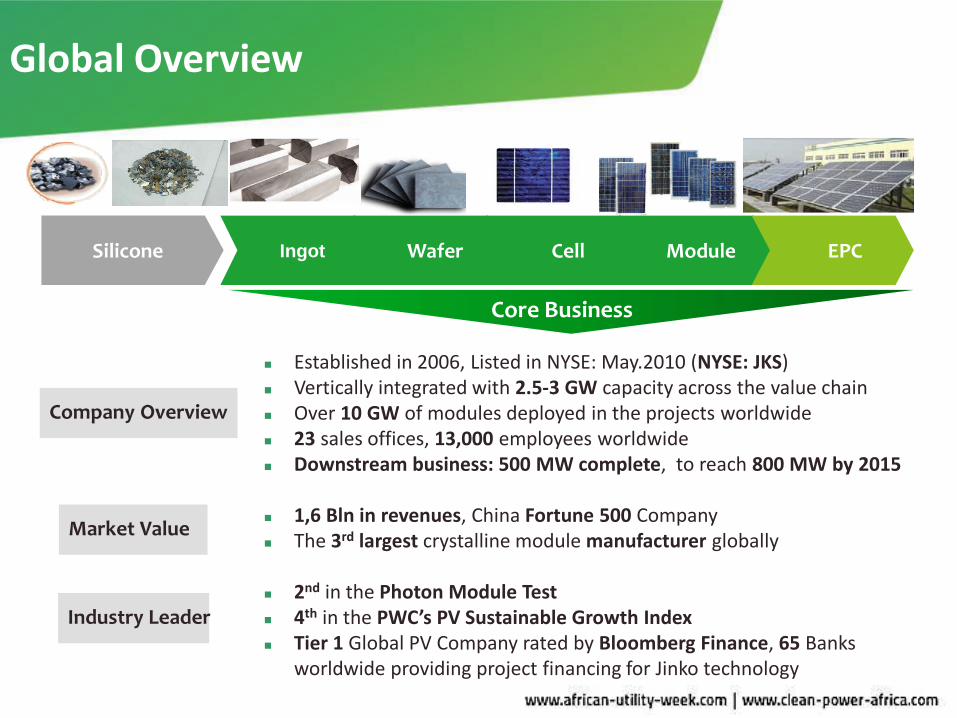
Global Overview
Established in 2006, Listed in NYSE: May.2010 (NYSE: JKS) Vertically integrated with 2.5-3 GW capacity across the value chain Over 10 GW of modules deployed in the projects worldwide 23 sales offices, 13,000 employees worldwide Downstream business: 500 MW complete, to reach 800 MW by 2015 1,6 Bln in revenues, China Fortune 500 Company The 3rd largest crystalline module manufacturer globally
2nd in the Photon Module Test 4th in the PWC’s PV Sustainable Growth Index Tier 1 Global PV Company rated by Bloomberg Finance, 65 Banks
worldwide providing project financing for Jinko technology
Market Value
Silicone Module Cell Wafer Ingot EPC
Core Business
Company Overview
Industry Leader

Bid Window 1 – Kathu Northern Cape
81MW PV Modules Module Type JKM-250P-60 324000 modules 12960 Pallets 589 Containers Inbound. Delivery window – February 2013 – October 2013 = 9months 66 Containers a month. From port to Site = 1078 km’s Total Km’s travelled = 1 270 000Km

Bid Window 1 – Linde, South Africa
40MW PV Modules Module Type JKM-290P-72 137950 modules 5518 Pallets 251 Containers Inbound. Delivery window – February 2013 – October 2013 = 9months 27 Containers a month. From port to Site = 780 km’s Total Km’s travelled = 391 560 Km
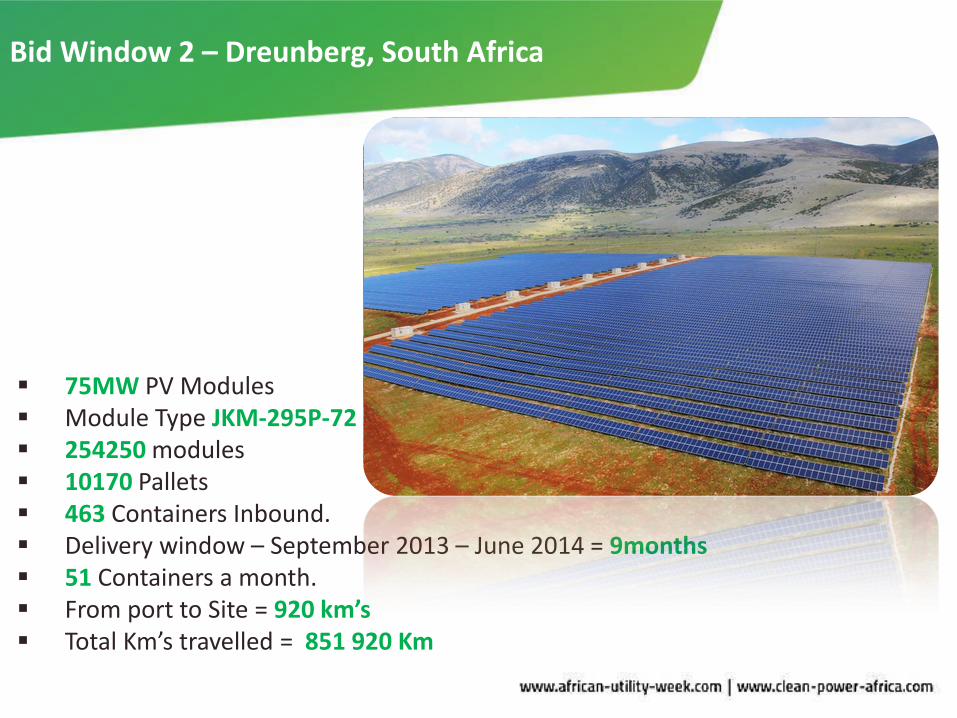
Bid Window 2 – Dreunberg, South Africa
75MW PV Modules Module Type JKM-295P-72 254250 modules 10170 Pallets 463 Containers Inbound. Delivery window – September 2013 – June 2014 = 9months 51 Containers a month. From port to Site = 920 km’s Total Km’s travelled = 851 920 Km
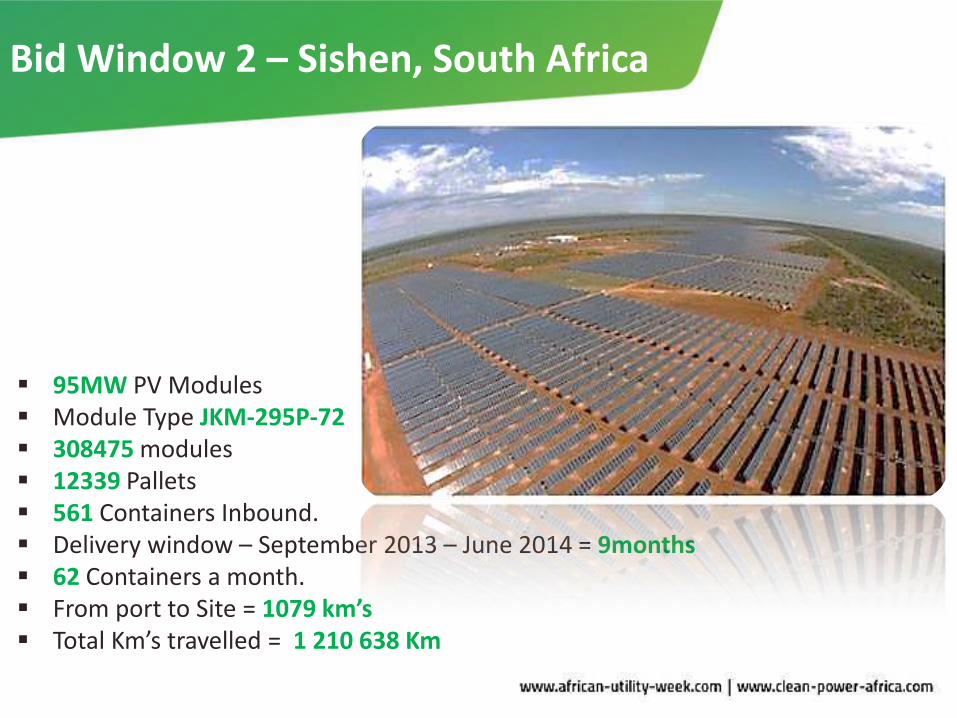
Bid Window 2 – Sishen, South Africa
95MW PV Modules Module Type JKM-295P-72 308475 modules 12339 Pallets 561 Containers Inbound. Delivery window – September 2013 – June 2014 = 9months 62 Containers a month. From port to Site = 1079 km’s Total Km’s travelled = 1 210 638 Km
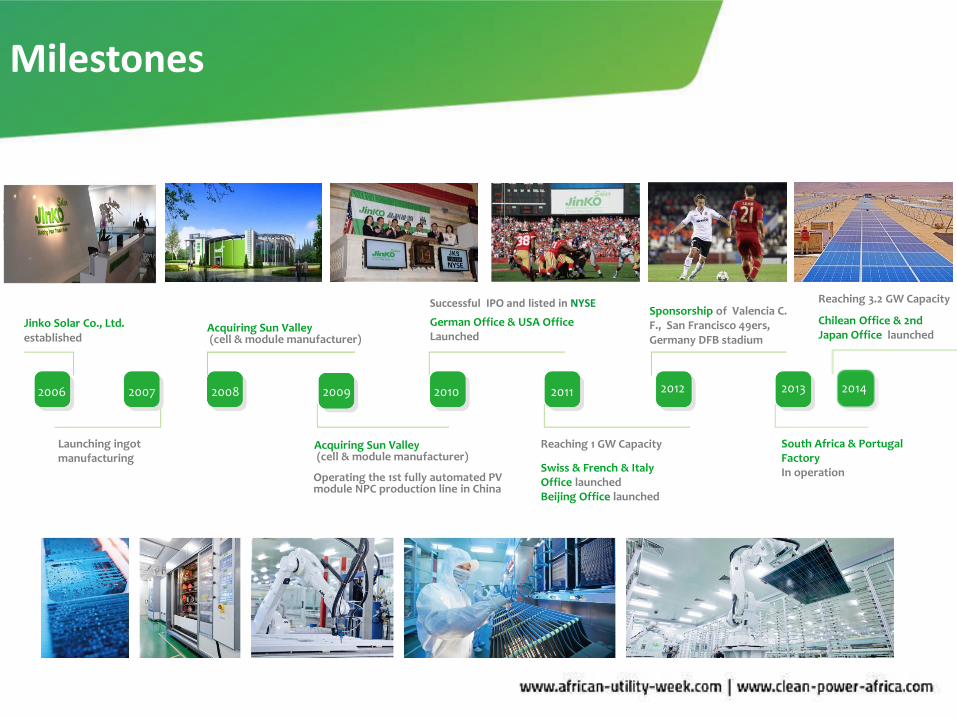
Milestones
2013 2013
Jinko Solar Co., Ltd. established
Acquiring Sun Valley (cell & module manufacturer)
Operating the 1st fully automated PV module NPC production line in China
Successful IPO and listed in NYSE
German Office & USA Office Launched
Reaching 1 GW Capacity
Swiss & French & Italy Office launched Beijing Office launched
Sponsorship of Valencia C. F., San Francisco 49ers, Germany DFB stadium
2006 2007 2008 2009 2010 2011 2012
Reaching 3.2 GW Capacity
Chilean Office & 2nd Japan Office launched
Launching ingot manufacturing
Acquiring Sun Valley (cell & module manufacturer)
South Africa & Portugal Factory In operation
2014 2013
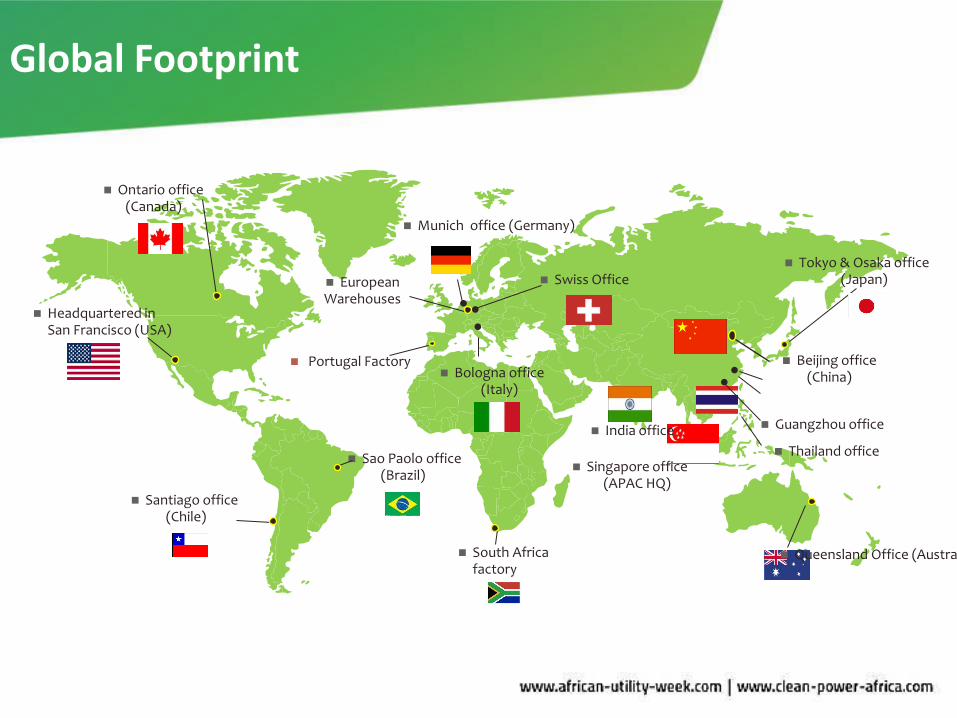
Global Footprint
Headquartered in San Francisco (USA)
Ontario office (Canada)
Munich office (Germany)
Swiss Office European Warehouses
Bologna office (Italy)
Queensland Office (Australia)
Singapore office (APAC HQ)
India office
Thailand office
Tokyo & Osaka office (Japan)
Santiago office (Chile)
Sao Paolo office (Brazil)
South Africa factory
Portugal Factory
Beijing office (China)
Guangzhou office

Jinko Solar PTY LTD – South Africa
South Africa factory

Milestones
2013 2013 2012 2013 2014
• Jinko Solar PTY LTD Registered.
• First Production Equipment arrived Q4 2012
Final Production equipment arrived Q4 2013
Factory setup started Jan 2014 First Module produced April 2014
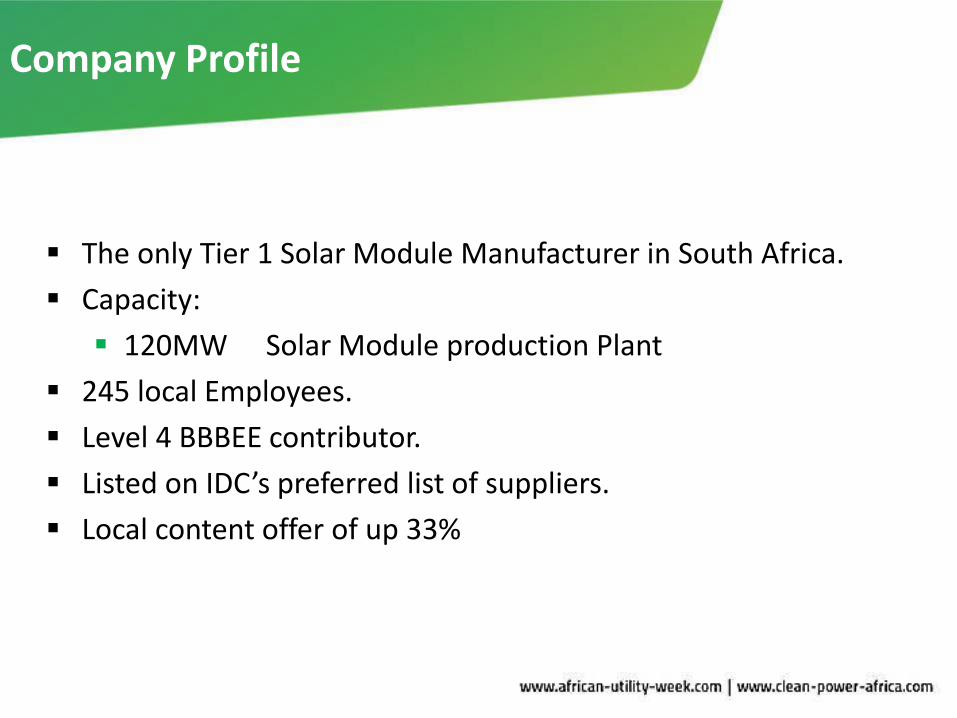
Company Profile
The only Tier 1 Solar Module Manufacturer in South Africa.
Capacity:
120MW Solar Module production Plant
245 local Employees.
Level 4 BBBEE contributor.
Listed on IDC’s preferred list of suppliers.
Local content offer of up 33%
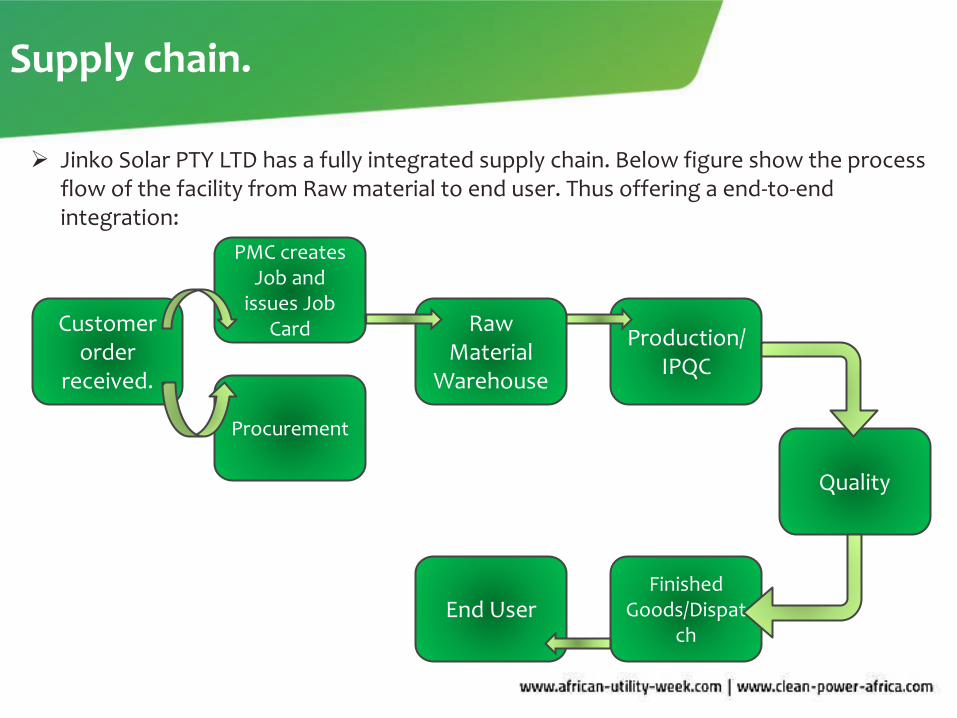
Supply chain.
Jinko Solar PTY LTD has a fully integrated supply chain. Below figure show the process flow of the facility from Raw material to end user. Thus offering a end-to-end integration:
PMC creates Job and
issues Job Card Customer
order received.
Procurement
Raw Material
Warehouse
Production/IPQC
Quality
Finished Goods/Dispat
ch End User
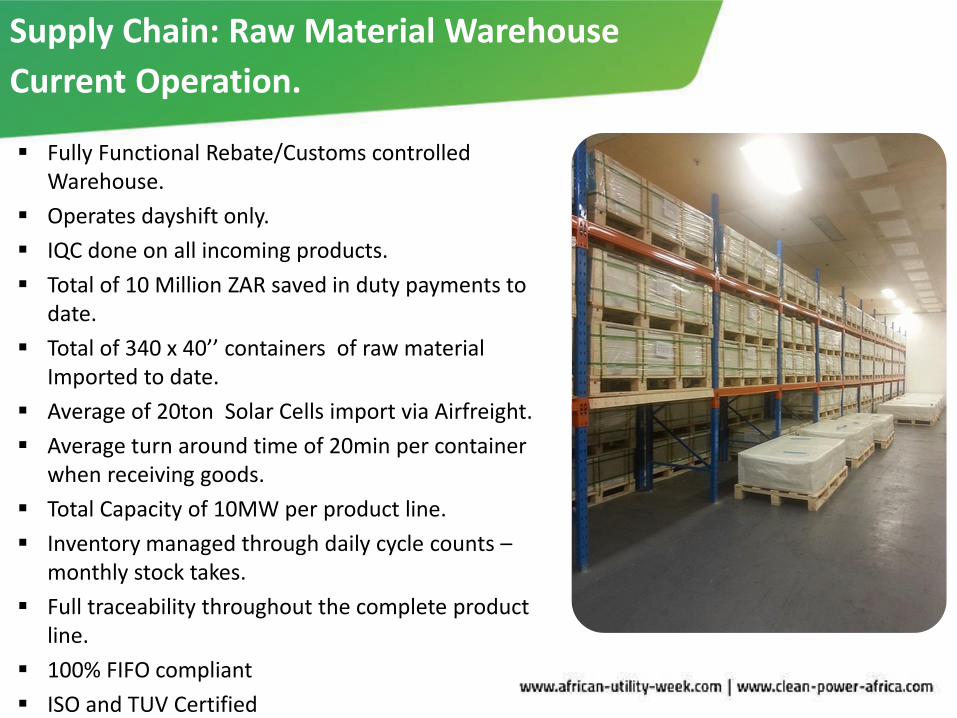
Supply Chain: Raw Material Warehouse
Current Operation.
Fully Functional Rebate/Customs controlled Warehouse.
Operates dayshift only.
IQC done on all incoming products.
Total of 10 Million ZAR saved in duty payments to date.
Total of 340 x 40’’ containers of raw material Imported to date.
Average of 20ton Solar Cells import via Airfreight.
Average turn around time of 20min per container when receiving goods.
Total Capacity of 10MW per product line.
Inventory managed through daily cycle counts – monthly stock takes.
Full traceability throughout the complete product line.
100% FIFO compliant
ISO and TUV Certified
Supply Chain: Factors to consider :
Rebate Application: Challenge:
Dealing with government departments can be challenging and could cause delays due to internal processes.
Possible issues: Inbound stock stored at bonded Facility.
Solution: Allow enough time to for approval and certification. Approximately 120days is
suitable
Staff skills: Challenge:
Customs controlled warehouse is very complex due to customs rules and regulations. Higher level of skills are required
Possible Issue: Loss of stock could lead to big financial losses in the form of penalties and possible revoke of licence.
Solution:
Training available through external parties. Inhouse-training program.

Supply Chain: Production Facility
Current Operation
Three shift system, operating 24hours a day, seven days a week.
4 x stringers with a total of 8 line output.
Line output of 600 cells per hour.
EL testing done at pre and post lamination at a 180 modules per hour.
Total of six Laminators laminating on average 83 modules per hour.
Fully automated framing table ensuring an output of a 100 modules per hour.
IV Flash done in a Sun Simulator at:
1000W/m²
25 degree Celsius
AM=1.5
Daily production of +/- 0.325MW per 24hour day.

Supply Chain: Quality Control
EMS- Electronic Management System
16 in-line quality control points in module workshop {IQC/IPQC(Pre/post Lam)/FQC/OQC/OBI}.
Precise data-recording & supervision for all the manufacturing QC points
Product Traceability Control Tracking card with unique barcodes tracing from module back to ingot Long term data accessibility
Employ Electroluminescence Test (EL) to inspect for potentially defective cells
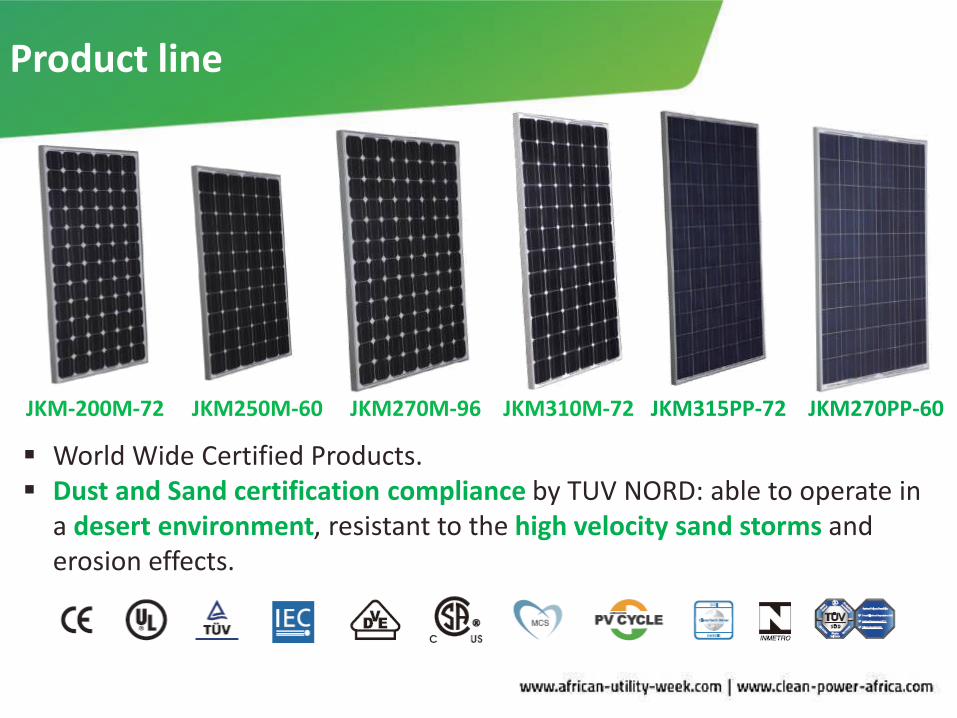
Product line
World Wide Certified Products. Dust and Sand certification compliance by TUV NORD: able to operate in
a desert environment, resistant to the high velocity sand storms and erosion effects.
JKM-200M-72 JKM250M-60 JKM270M-96 JKM310M-72 JKM315PP-72 JKM270PP-60
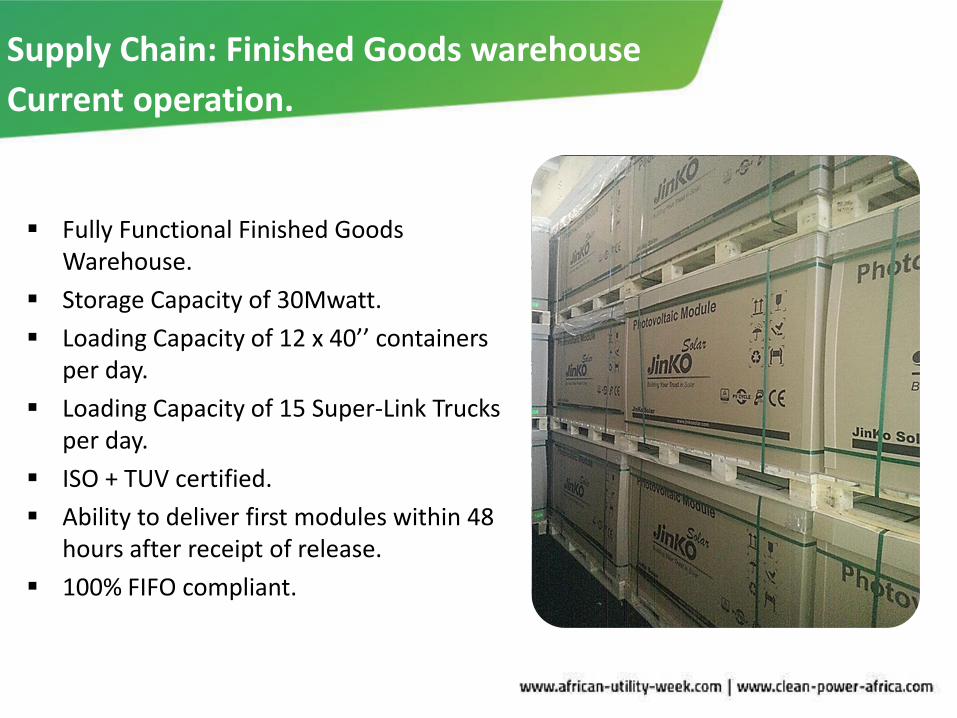
Supply Chain: Finished Goods warehouse
Current operation.
Fully Functional Finished Goods Warehouse.
Storage Capacity of 30Mwatt.
Loading Capacity of 12 x 40’’ containers per day.
Loading Capacity of 15 Super-Link Trucks per day.
ISO + TUV certified.
Ability to deliver first modules within 48 hours after receipt of release.
100% FIFO compliant.
Local Content combined with a competitive pricing.
Conclusion
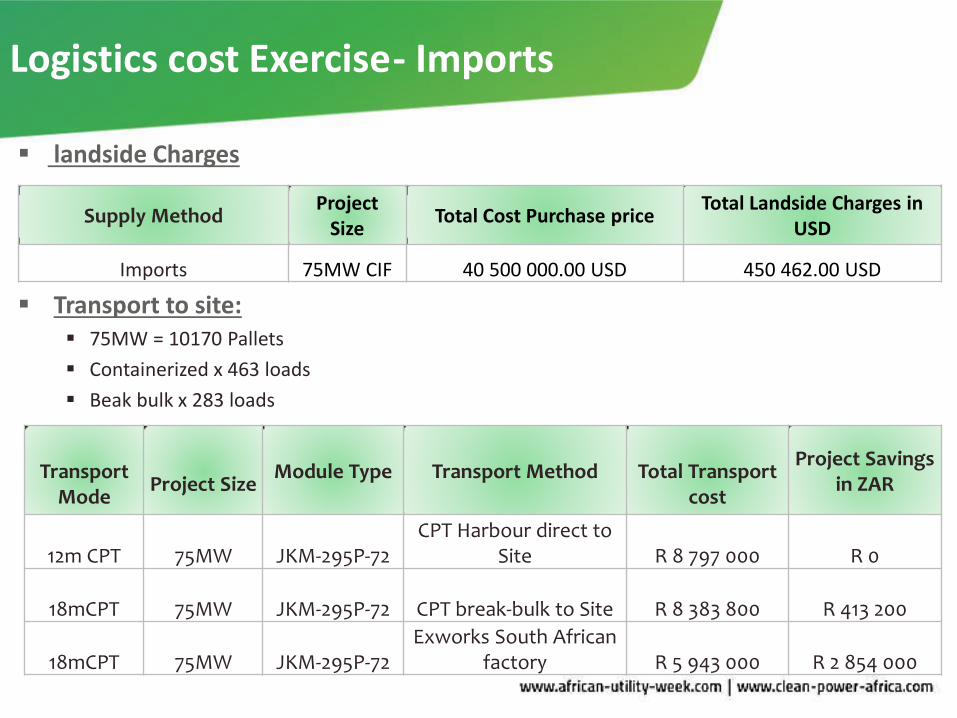
Logistics cost Exercise - Imports
Transport
Mode
Project Size
Module Type Transport Method
Total Transport cost
Project Savings in ZAR
12m CPT 75MW JKM-295P-72 CPT Harbour direct to
Site R 8 797 000 R 0
18mCPT 75MW JKM-295P-72 CPT break-bulk to Site R 8 383 800 R 413 200
18mCPT 75MW JKM-295P-72 Exworks South African
factory R 5 943 000 R 2 854 000
Transport to site: 75MW = 10170 Pallets
Containerized x 463 loads
Beak bulk x 283 loads
Supply Method Project
Size Total Cost Purchase price
Total Landside Charges in USD
Imports 75MW CIF 40 500 000.00 USD 450 462.00 USD
landside Charges
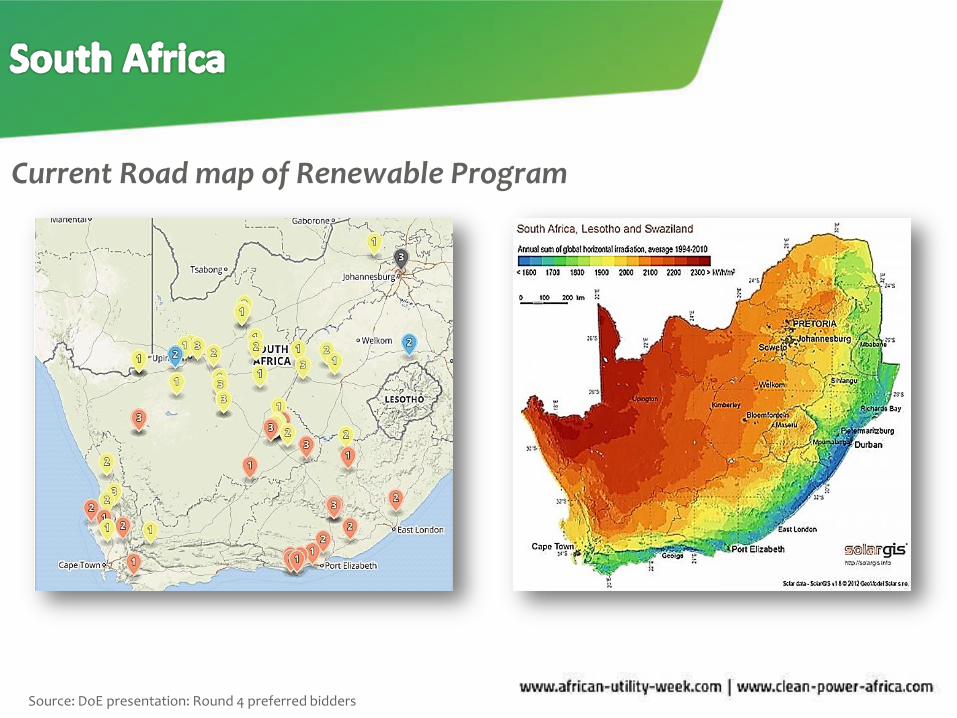
Current Road map of Renewable Program
Source: DoE presentation: Round 4 preferred bidders
Top Related