


Languages
Pages
Legal


The Power of Metrics Using Meaningful Measures to Ensure Project Success
Lydia Baude – Project Manager Systems & Procedures, Mayo Clinic David Mapes – Health Systems Analyst Systems & Procedures, Mayo Clinic PMI – Project Management Institute La Crosse Chapter February 27, 2013

Disclosures We have no relationships to disclose

Objectives Understand the case for meaningful
metrics and why it is important to project managers
Understand the challenges projects face when using poor metrics
Understand how to obtain meaningful metrics for your project and how/when to apply them
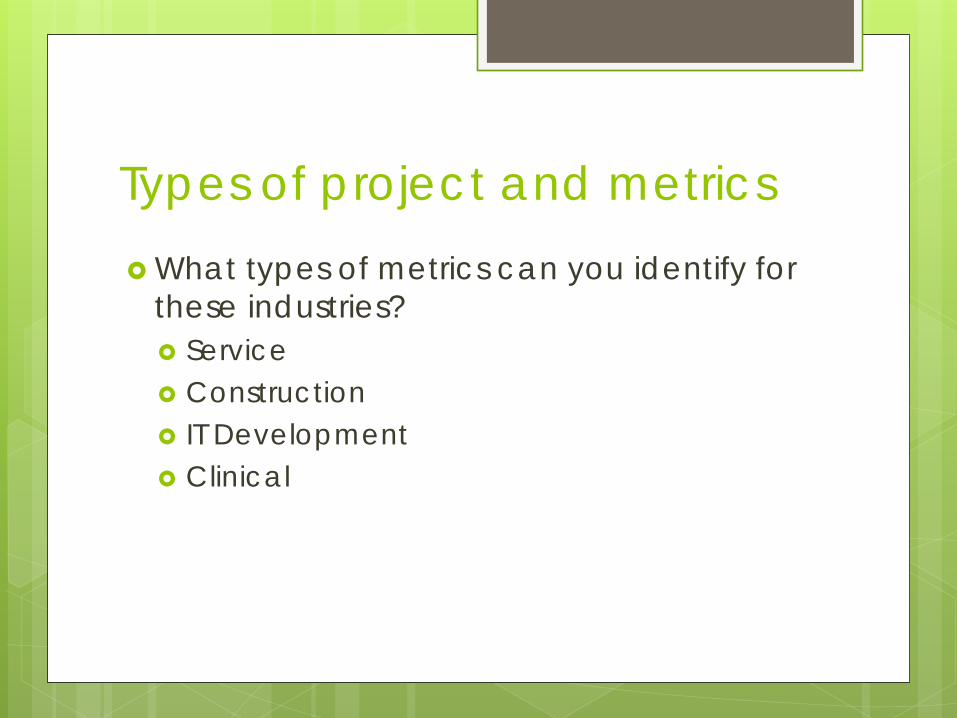
Types of project and metrics What types of metrics can you identify for
these industries? Service Construction IT Development Clinical

Challenges projects face with poor metrics Communication (How are we doing?) Prioritization (How do I know that I’m
working on what’s most important right now?)
Progress (How do I know who needs help?)
Change management (How do I know who is performing well so that I can recognize and reward them?)
What others can you think of?

Case Study – What would you do? David Mapes

Measure what matters most

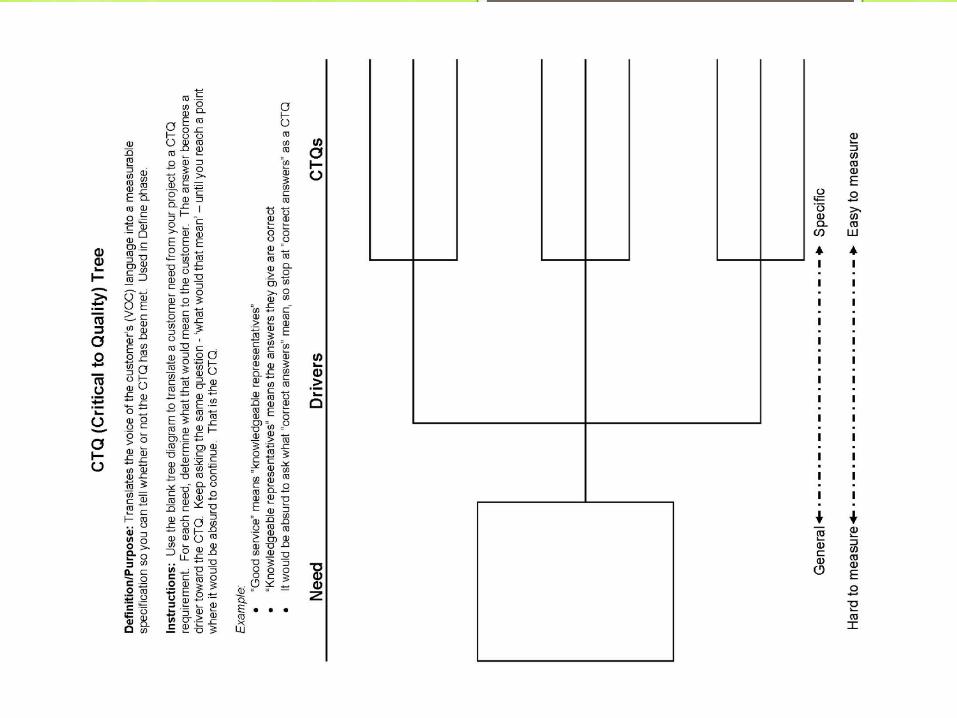
Critical to Quality (CTQ) PURPOSE Translates broad, unspecified customer/ client
requirements (VOC) into measurable specifications of what is critical-to-quality and/or project success
Defines features or outputs of process or project that customer/client deems critical to satisfaction
When customer/client wants or needs are too vague to be acted on
Helps team move from high-level to detail specifications Ensures that all aspects of the need are identified
The answer to the question “what would that mean” becomes a driver for the Critical to Quality characteristics

Critical To Quality (CTQ) Tree
Need Drivers/Phase CTQs
Implement project tracking database
Effective
User friendly
Minimal cost and time to implement
Time from report request to receipt
# of reporting requests fulfilled
Time for user to generate reports Time needed by user to enter project data into database
Cost of software (develop vs. purchase) Time from project start to full user rollout
General Specific Hard to measure Easy to measure
User feedback survey results
Client survey results

Process
• Meeting site identified (sq.ft, equipment, $) • Speakers identified (#, $) • Advertising (types, #, $) • Registration (time, #) • Food (types, $, #) • Evaluation (time, type, #)
CP1000000-10
Types of Measures
(X) (X) (Y) Xs – Predictor Ys – Result
Input
• Budget • Date/Time • Duration • Objectives • Attendees
Counter-balance
Unanticipated consequences of the outcome •# Reschedules; # Participant Cancellations
within one week; Attendance vs last year; cost/participant
Output/Outcome
• Complete • On time • On budget • Profit • Participant
satisfaction • Client
satisfaction

CP1000000-11
Measure Selection Matrix
Fast
Tastes good
Hot
Correct ingredients
Repeatable
Time from order to
receipt < 2 minutes
% of orders
that are served
and match original order
# of customer
complaints about
consistency
% of orders
that are served at
110 degrees
# of customer
complaints about taste
Customer Requirements
Outcome Measures
Strong Moderate Weak

Planning for effective measurement Prioritize & monitor project critical metrics (not all
project measures will be CTQ) Identify the appropriate metrics that need to be
reported at each level of the project (Client / Sponsor, Administration, Operations, Front Line, etc.)
Clearly define what is being measured, when and how often it will be measured , and who will be responsible for measuring and reporting. (use a measurement plan)
Some measurements may need to stay in place after the project closes. Identify this need early in your project and define a plan to deliver these measures (use a control plan)
A lesson about measuring project performance and change management

Perspectives from a Project Manager Lydia Baude

Thank you!

Measurement Plan
Indicator
Indicator Type
(input, process,
outcome, structure,
perception)
Operational Definition
Data Source
Person responsible
for collecting the data
When and where to
collect the data (incl. frequency)
Sampling info
(sample size, conf
level, allowable
error, sampling method)
Data entry plan
Data analysis
plan
Communication/ Dissemination Plan
# of report requests Process
For project tracking
database, the # of unique
report requests
submitted through the user portal
Project dB John Smith
Automated. Report available
every Monday at
1AM.
100% (sampling not used)
n/a - automated
report
Each Monday,
John Smith will enter the # of weekly report
requests into the run
chart
John Smith will distribute the run chart
to leadership for review at the weekly
project review meeting

Control Plan Critical
measure description
Process step
Output of this
process step
Who owns
this step activity?
What is the specification/goal for this measure?
How will the
measure be
controlled?
How will this be
measured
Who measures
this ?
What is the reaction
plan?
Who is responsible
for implementing the reaction
plan?
Location of related
documentation about this measure
Incoming error rate (missing or
incomplete info on report
requests)
Report request
Report request
submitted with all
necessary info
included
Project analyst
The goal is zero, but the process will still function as long as there are no more
than 2% of incoming requests with an
error. Callback to requestor by project
analyst
Database has hard-
stop if information is missing. Incorrect
information needs call
back to requestor.
Weekly run chart of all incoming
report requests with
errors
Project analyst
History tells us that new clients will
have a learning
curve using the new
database. If more than 2%
of requests contain
errors, the project
analyst will being a root
cause analyst and report
results to PM leadership.
Project analyst
Project Mgmt Dept
dashboard
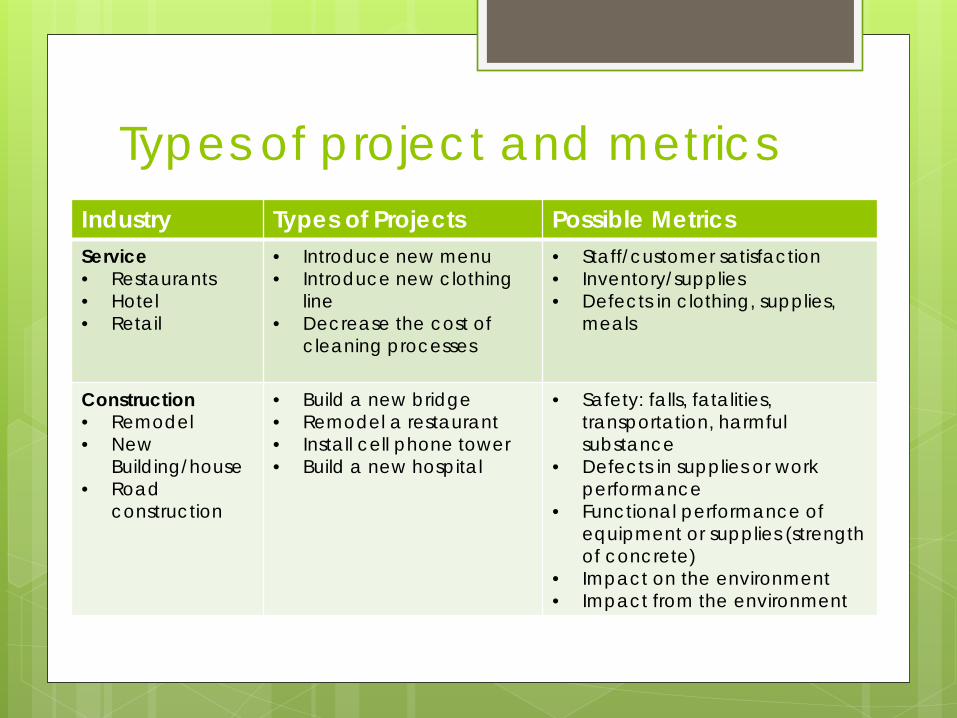
Types of project and metrics Industry Types of Projects Possible Metrics Service • Restaurants • Hotel • Retail
• Introduce new menu • Introduce new clothing
line • Decrease the cost of
cleaning processes
• Staff/customer satisfaction • Inventory/supplies • Defects in clothing, supplies,
meals
Construction • Remodel • New
Building/house • Road
construction
• Build a new bridge • Remodel a restaurant • Install cell phone tower • Build a new hospital
• Safety: falls, fatalities, transportation, harmful substance
• Defects in supplies or work performance
• Functional performance of equipment or supplies (strength of concrete)
• Impact on the environment • Impact from the environment
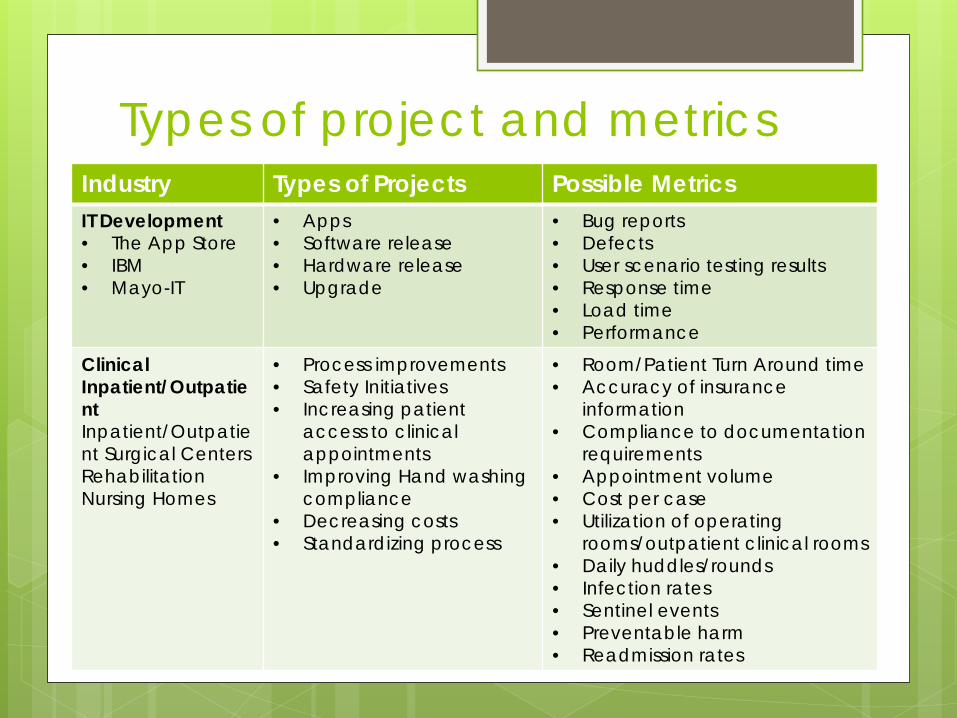
Types of project and metrics Industry Types of Projects Possible Metrics IT Development • The App Store • IBM • Mayo-IT
• Apps • Software release • Hardware release • Upgrade
• Bug reports • Defects • User scenario testing results • Response time • Load time • Performance
Clinical Inpatient/Outpatient Inpatient/Outpatient Surgical Centers Rehabilitation Nursing Homes
• Process improvements • Safety Initiatives • Increasing patient
access to clinical appointments
• Improving Hand washing compliance
• Decreasing costs • Standardizing process
• Room/Patient Turn Around time • Accuracy of insurance
information • Compliance to documentation
requirements • Appointment volume • Cost per case • Utilization of operating
rooms/outpatient clinical rooms • Daily huddles/rounds • Infection rates • Sentinel events • Preventable harm • Readmission rates

CP1000000-21
Measure Selection Matrix
Customer Requirements
Outcome Measures
Strong Moderate Weak
Top Related