


Languages
Pages
Legal

The North American Market for Chihuahua Onions, Jalapeños and Beef Cattle
Jesús Alejandro Varela Díaz Flynn J. Adcock
C. Parr Rosson III
CNAS Report 2008-02
April 2008

ii
iii
Table of Contents
List of Tables iv
List of Figures v
Introduction 1
The Demographics and Economics of North America 1
Demographics by Country 2
Population 2
Income 3
Age Structure 3
Gender 4
Demographics by Metropolitan Areas 5
Population 5
Gender 8
Age Structure 9
Expenditures 11
A Closer Look to the U.S. Market… The Ethnic Market 16
Hispanic Market 17
Onions Market Windows 18
Pepper Market Windows 21
Competitors and Opportunities for Mexican Peppers Producers in the U.S. Market 23
Livestock Dynamics and Challenges to Chihuahua’s Producers 26
Summary 30
References 33
Appendix A. U.S. Produce Brokers 35
Appendix B. Market Information for Leading U.S. and Canadian Metropolitan Areas 45
Appendix C. Chain Store Purchasing Contacts in Major Metropolitan Areas of the Southwestern
United States 52

iv
List of tables
Table 1. Population by Country (thousand persons) 2
Table 2. Population Growth Rates by Country 2
Table 3. Gross Domestic Product per Capita, Current prices (U.S. dollars) 3
Table 4. Age Structure by Country (2006) 3
Table 5. Median Age by Country (2006) 4
Table 6. Population by Gender (thousand persons) 4
Table 7. Population by Gender (percentages) 4
Table 8. 2000 Population of Top Seven Mexican Metropolitan Areas 6
Table 9. Population of Zona Metropolitana, thousand persons (D.F., Edo. de Mex.) 6
Table 10. Population of Top Ten U.S. Metropolitan Areas, thousand persons (2006 estimates) 7
Table 11. Population of Top Ten Canadian Metropolitan Areas, thousand persons (2006 estimates) 7
Table 12. Proportion of Males and Females in Mexico, Year 2000 (metropolitan areas) 8
Table 13. Proportion of Males and Females in Canada, Year 2001 (metropolitan areas) 8
Table 14. Proportion of Males and Females in the United States,
Year 2000 (metropolitan areas) 9
Table 15. Average Canadian Household Expenditures by Metropolitan Area,
2005 (U.S. dollars) 12
Table 16. U.S. Average Annual Expenditures of All Consumer Units by Metropolitan
Area, 2003-2004 (U.S. dollars) 13
Table 17. Average Food Annual Expenditures of All Consumer Units by Metropolitan
Area: 2003-2004 14
Table 18. U.S. chile pepper import value, 2003-05 1/ 26
Table 19. Per Capita Beef Consumption in North America (kilograms per person per year) 30
v
List of figures
Figure 1. Age Structure of Mexican Metropolitan Areas, Census 2000 9
Figure 2. Age Structure of Canadian Metropolitan areas, Census 2001 10
Figure 3. Age Structure of U.S. Metropolitan Areas, Census 2000 11
Figure 4. Minimum Wage Levels in Top Mexican Metropolitan Areas (2000) 15
Figure 5. Mexican Onion Production 19
Figure 6. 2005 Monthly Mexican Production of Onions 20
Figure 7. 2005 Monthly Chihuahua Production and U.S. Price of Onions 20
Figure 8. 2005 Monthly U.S. Shipments of Domestic and Imported Dry Onions and
Chihuahua Production 21
Figure 9. Mexican Jalapeno Production 22
Figure 10. 2005 Monthly Mexican Production of Jalapeños 22
Figure 11. 2005 Monthly Chihuahua Production of Jalapeños and U.S. Import Unit Value
of Peppers 23
Figure 12. U.S. Chili pepper production 25
Figure 13. Average cattle stock by country, 1990-2007 27
Figure 14. U.S. Imports of Live Cattle from Canada and Mexico, 1990 - June 2007 29

vi
The North American Market for Chihuahua Onions, Jalapeños and Livestock Introduction Producers in Chihuahua, Mexico grow a varied array of agricultural products that have been greatly impacted by increased trade stimulated by the North American Free Trade Agreement (NAFTA). The products, including fruits and vegetables, meat and livestock, grains, and cotton, have seen increased competition as well as new market opportunities. The purpose of this research effort is to enable agricultural producers in Chihuahua to better take advantage of North American marketing opportunities which have arisen as a result of NAFTA. In January 2006, a preliminary report highlighting the North American market for eight perishable and five non-perishable products was presented to Fundacion Produce. The approach for the perishable products was based on market window analysis and the approach for the non-perishable products was supply and demand balance. As a result of that report, a decision was made to conduct further research which would assist Fundacion Produce in marketing Chihuahuan grown onions, jalapeños and beef cattle throughout North America. This report is divided into three parts. First, a demographic and economic overview of the United States, Canada, and Mexico, including focus on important metropolitan areas, will be discussed. Second, further analysis of the North American market for onions, jalapeños and livestock will be presented. Finally, implications and opportunities for Chihuahua products will be discussed. In addition, an appendix containing important contact and market information will be included.
The Demographics and Economics of North America In order to better take advantage of the opportunities brought about by NAFTA, it is necessary to determine the differences between the countries involved. Population and population growth rate, income, age structure, and gender are of special interest to understand the composition of the different markets and to design marketing strategies that will help the Chihuahua producers to commercialize its products. Using the most recent demographic information available, including U.S. Census Bureau (Census) data, International Monetary Fund (IMF), projections from the Food and Agricultural Organization (FAO) of the United Nations, and the Central Intelligence Agency (CIA), a characterization of the United States, Canadian and Mexican markets was developed. A presentation of the most important demographic facts is shown for each country and a comparison between countries is presented. Since important differences between metropolitan areas, market target of the present study, and the country as a whole exist, a detailed presentation of such variables is presented for the metropolitan areas as well.
2
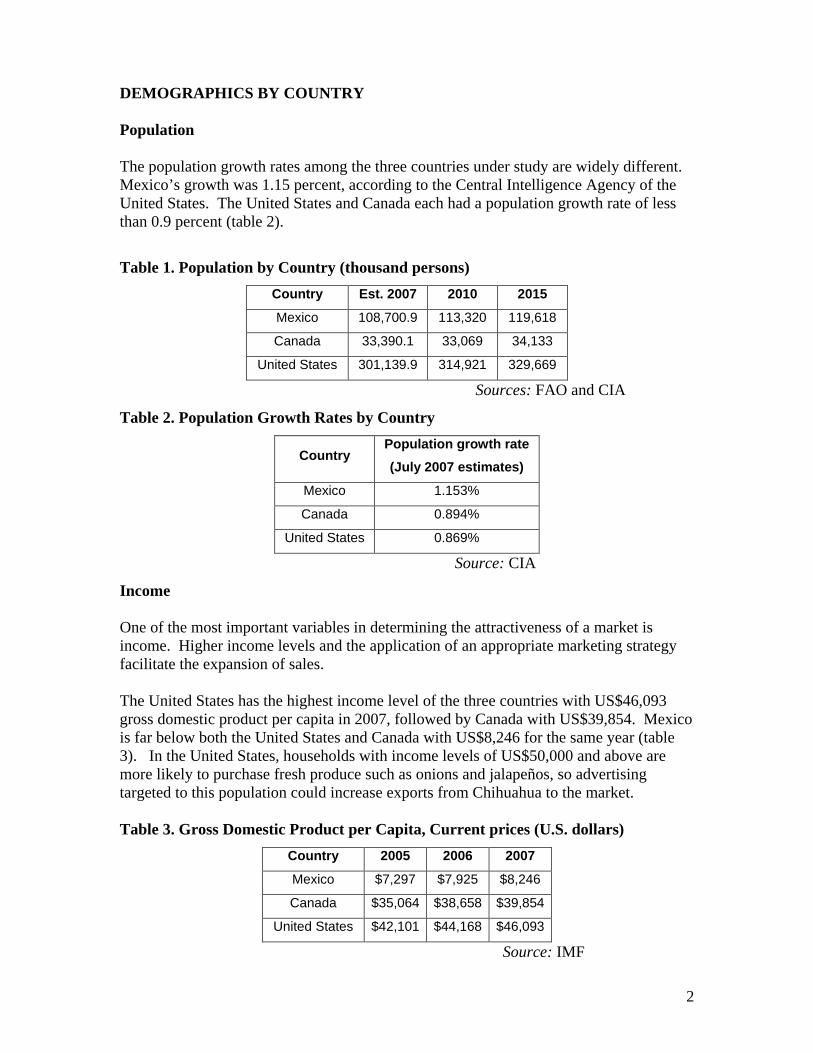
DEMOGRAPHICS BY COUNTRY Population The population growth rates among the three countries under study are widely different. Mexico’s growth was 1.15 percent, according to the Central Intelligence Agency of the United States. The United States and Canada each had a population growth rate of less than 0.9 percent (table 2).
Table 1. Population by Country (thousand persons)
Country Est. 2007 2010 2015
Mexico 108,700.9 113,320 119,618
Canada 33,390.1 33,069 34,133
United States 301,139.9 314,921 329,669
Sources: FAO and CIA
Table 2. Population Growth Rates by Country
Country Population growth rate
(July 2007 estimates)
Mexico 1.153%
Canada 0.894%
United States 0.869%
Source: CIA
Income One of the most important variables in determining the attractiveness of a market is income. Higher income levels and the application of an appropriate marketing strategy facilitate the expansion of sales. The United States has the highest income level of the three countries with US$46,093 gross domestic product per capita in 2007, followed by Canada with US$39,854. Mexico is far below both the United States and Canada with US$8,246 for the same year (table 3). In the United States, households with income levels of US$50,000 and above are more likely to purchase fresh produce such as onions and jalapeños, so advertising targeted to this population could increase exports from Chihuahua to the market. Table 3. Gross Domestic Product per Capita, Current prices (U.S. dollars)
Country 2005 2006 2007
Mexico $7,297 $7,925 $8,246
Canada $35,064 $38,658 $39,854
United States $42,101 $44,168 $46,093
Source: IMF

3
Age structure Important differences in age between countries under study were found. Although most of the population was found in the range of 15-64 years for all three countries (table 4), the median age for Mexico was 25.3 years for 2006, well below the median ages in Canada (38.9), and the United States (36.5) (table 5). The age differences call for different marketing strategies as needs and wants tend to change drastically as people age. For instance, results shown in The Packer 2008 Annual Consumer Survey indicate that U.S. consumers ages 40 to 49 are most likely to purchase onions and specialty peppers such as jalapeños. Therefore, targeting these consumers with advertising materials could help increase sales of Chihuahuan onions and jalapeños to the United States.
Table 4. Age Structure by Country (2006)
0-14 years 30%
15-64 years 64% Mexico
65 and over 6%
0-14 years 18%
15-64 years 69% Canada
65 and over 13%
0-14 years 20%
15-64 years 67% United States
65 and over 13%
Sources: FAO and CIA
Table 5. Median Age by Country (2006)
Total 25.3
Male 24.3 Mexico
Female 26.2
Total 38.9
Male 37.8 Canada
Female 39.9
Total 36.5
Male 35.1 United States
Female 37.8
Sources: FAO and CIA
4
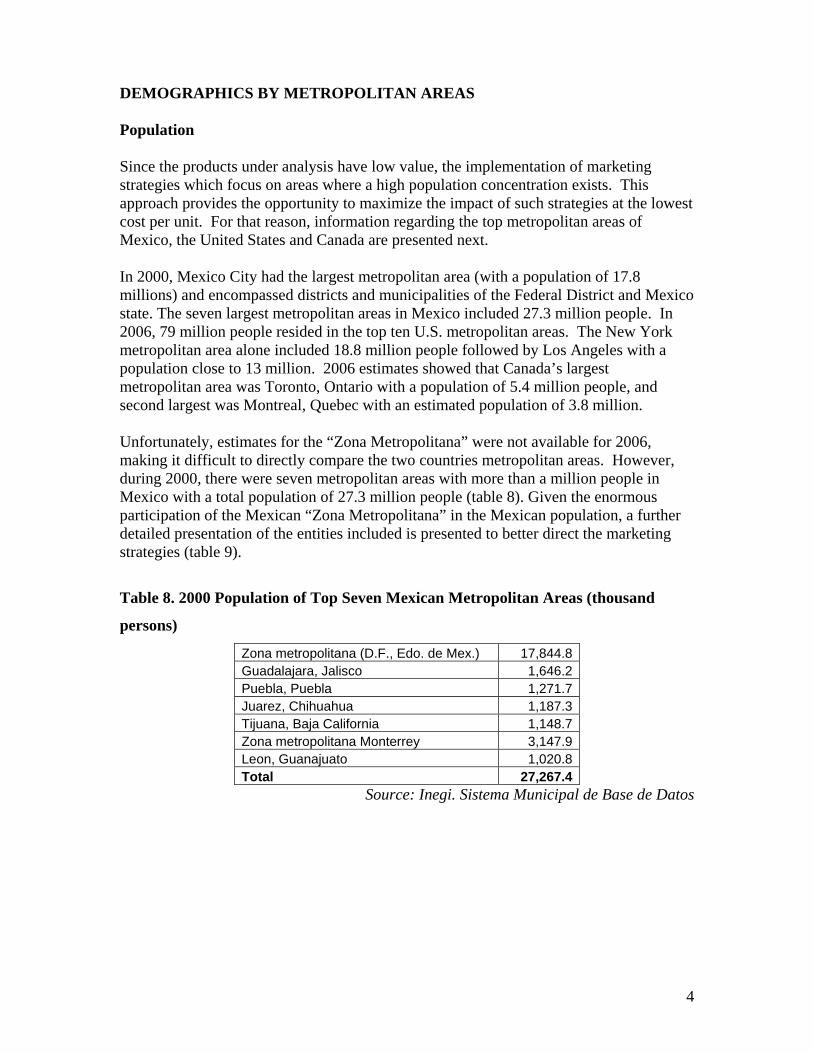
DEMOGRAPHICS BY METROPOLITAN AREAS Population Since the products under analysis have low value, the implementation of marketing strategies which focus on areas where a high population concentration exists. This approach provides the opportunity to maximize the impact of such strategies at the lowest cost per unit. For that reason, information regarding the top metropolitan areas of Mexico, the United States and Canada are presented next. In 2000, Mexico City had the largest metropolitan area (with a population of 17.8 millions) and encompassed districts and municipalities of the Federal District and Mexico state. The seven largest metropolitan areas in Mexico included 27.3 million people. In 2006, 79 million people resided in the top ten U.S. metropolitan areas. The New York metropolitan area alone included 18.8 million people followed by Los Angeles with a population close to 13 million. 2006 estimates showed that Canada’s largest metropolitan area was Toronto, Ontario with a population of 5.4 million people, and second largest was Montreal, Quebec with an estimated population of 3.8 million. Unfortunately, estimates for the “Zona Metropolitana” were not available for 2006, making it difficult to directly compare the two countries metropolitan areas. However, during 2000, there were seven metropolitan areas with more than a million people in Mexico with a total population of 27.3 million people (table 8). Given the enormous participation of the Mexican “Zona Metropolitana” in the Mexican population, a further detailed presentation of the entities included is presented to better direct the marketing strategies (table 9).
Table 8. 2000 Population of Top Seven Mexican Metropolitan Areas (thousand
persons)
Zona metropolitana (D.F., Edo. de Mex.) 17,844.8 Guadalajara, Jalisco 1,646.2 Puebla, Puebla 1,271.7 Juarez, Chihuahua 1,187.3 Tijuana, Baja California 1,148.7 Zona metropolitana Monterrey 3,147.9 Leon, Guanajuato 1,020.8 Total 27,267.4
Source: Inegi. Sistema Municipal de Base de Datos
5
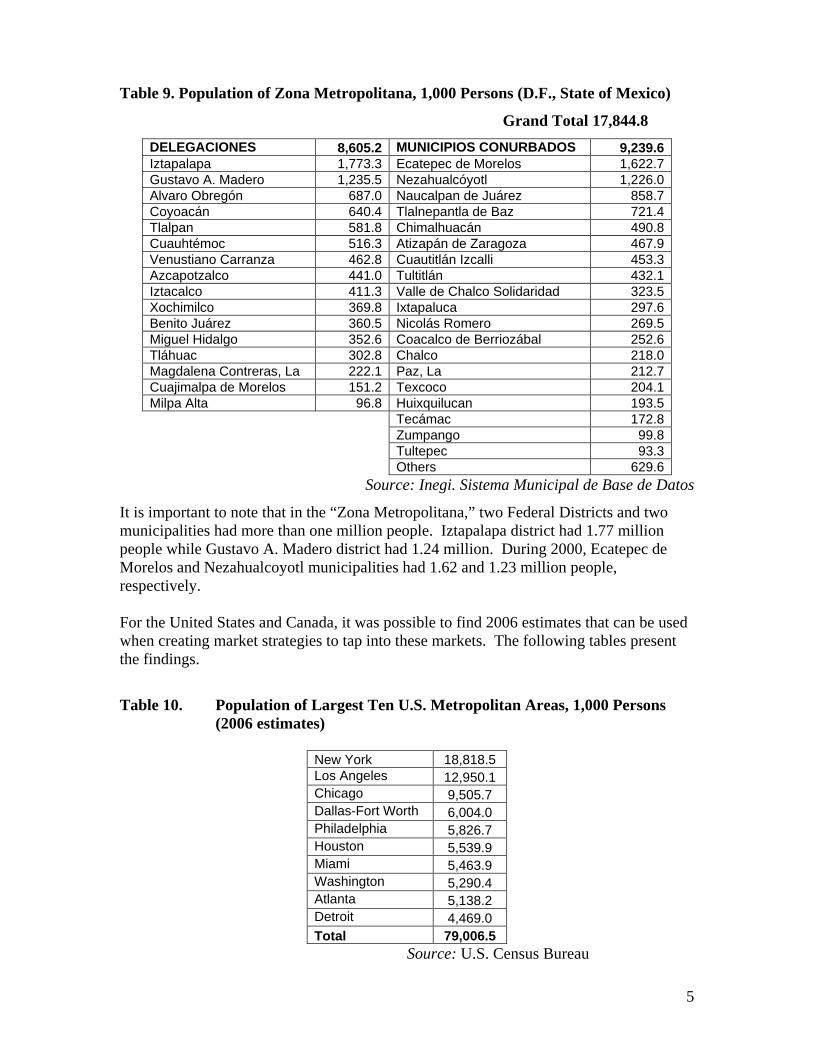
Table 9. Population of Zona Metropolitana, 1,000 Persons (D.F., State of Mexico)
Grand Total 17,844.8
DELEGACIONES 8,605.2 MUNICIPIOS CONURBADOS 9,239.6 Iztapalapa 1,773.3 Ecatepec de Morelos 1,622.7 Gustavo A. Madero 1,235.5 Nezahualcóyotl 1,226.0 Alvaro Obregón 687.0 Naucalpan de Juárez 858.7 Coyoacán 640.4 Tlalnepantla de Baz 721.4 Tlalpan 581.8 Chimalhuacán 490.8 Cuauhtémoc 516.3 Atizapán de Zaragoza 467.9 Venustiano Carranza 462.8 Cuautitlán Izcalli 453.3 Azcapotzalco 441.0 Tultitlán 432.1 Iztacalco 411.3 Valle de Chalco Solidaridad 323.5 Xochimilco 369.8 Ixtapaluca 297.6 Benito Juárez 360.5 Nicolás Romero 269.5 Miguel Hidalgo 352.6 Coacalco de Berriozábal 252.6 Tláhuac 302.8 Chalco 218.0 Magdalena Contreras, La 222.1 Paz, La 212.7 Cuajimalpa de Morelos 151.2 Texcoco 204.1 Milpa Alta 96.8 Huixquilucan 193.5 Tecámac 172.8 Zumpango 99.8 Tultepec 93.3 Others 629.6
Source: Inegi. Sistema Municipal de Base de Datos
It is important to note that in the “Zona Metropolitana,” two Federal Districts and two municipalities had more than one million people. Iztapalapa district had 1.77 million people while Gustavo A. Madero district had 1.24 million. During 2000, Ecatepec de Morelos and Nezahualcoyotl municipalities had 1.62 and 1.23 million people, respectively. For the United States and Canada, it was possible to find 2006 estimates that can be used when creating market strategies to tap into these markets. The following tables present the findings.
Table 10. Population of Largest Ten U.S. Metropolitan Areas, 1,000 Persons (2006 estimates)
New York 18,818.5 Los Angeles 12,950.1 Chicago 9,505.7 Dallas-Fort Worth 6,004.0 Philadelphia 5,826.7 Houston 5,539.9 Miami 5,463.9 Washington 5,290.4 Atlanta 5,138.2 Detroit 4,469.0 Total 79,006.5
Source: U.S. Census Bureau
6
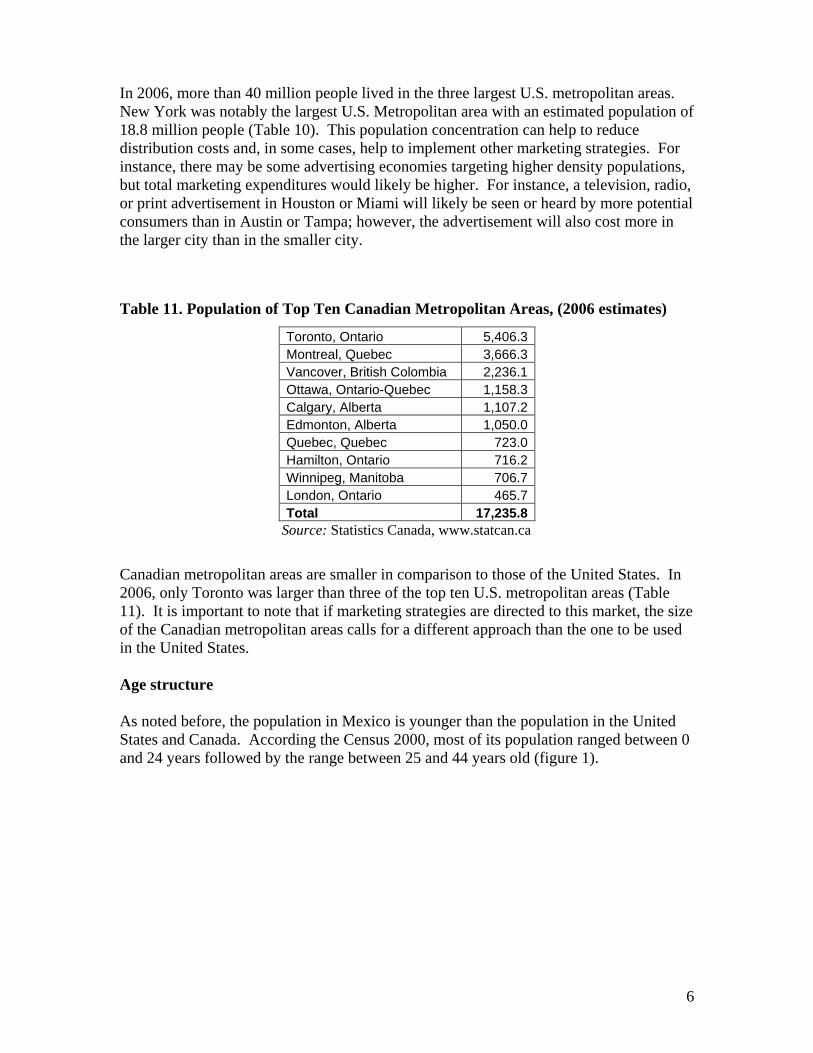
In 2006, more than 40 million people lived in the three largest U.S. metropolitan areas. New York was notably the largest U.S. Metropolitan area with an estimated population of 18.8 million people (Table 10). This population concentration can help to reduce distribution costs and, in some cases, help to implement other marketing strategies. For instance, there may be some advertising economies targeting higher density populations, but total marketing expenditures would likely be higher. For instance, a television, radio, or print advertisement in Houston or Miami will likely be seen or heard by more potential consumers than in Austin or Tampa; however, the advertisement will also cost more in the larger city than in the smaller city.
Table 11. Population of Top Ten Canadian Metropolitan Areas, (2006 estimates)
Toronto, Ontario 5,406.3 Montreal, Quebec 3,666.3 Vancover, British Colombia 2,236.1 Ottawa, Ontario-Quebec 1,158.3 Calgary, Alberta 1,107.2 Edmonton, Alberta 1,050.0 Quebec, Quebec 723.0 Hamilton, Ontario 716.2 Winnipeg, Manitoba 706.7 London, Ontario 465.7 Total 17,235.8
Source: Statistics Canada, www.statcan.ca
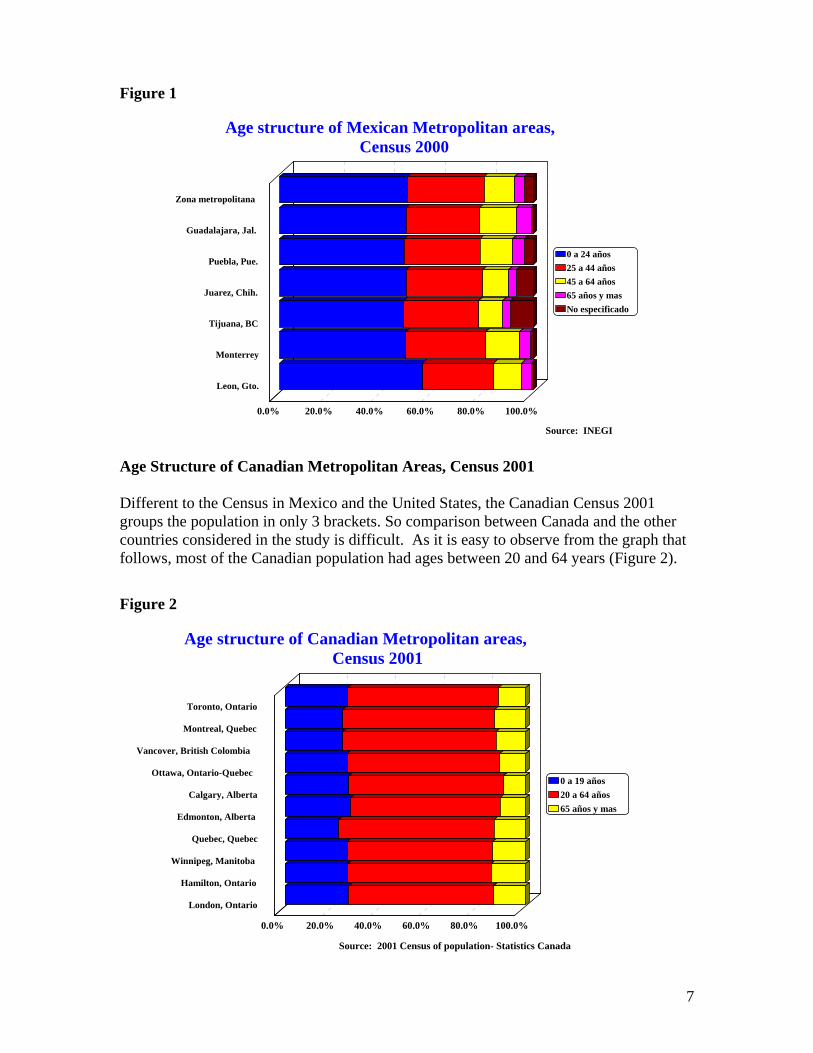
Canadian metropolitan areas are smaller in comparison to those of the United States. In 2006, only Toronto was larger than three of the top ten U.S. metropolitan areas (Table 11). It is important to note that if marketing strategies are directed to this market, the size of the Canadian metropolitan areas calls for a different approach than the one to be used in the United States. Age structure As noted before, the population in Mexico is younger than the population in the United States and Canada. According the Census 2000, most of its population ranged between 0 and 24 years followed by the range between 25 and 44 years old (figure 1).
7
Figure 1
Age structure of Mexican Metropolitan areas, Census 2000
Source: INEGI
Zona metropolitana
Guadalajara, Jal.
Puebla, Pue.
Juarez, Chih.
Tijuana, BC
Monterrey
Leon, Gto.
0.0% 20.0% 40.0% 60.0% 80.0% 100.0%
0 a 24 años
25 a 44 años
45 a 64 años
65 años y mas
No especificado
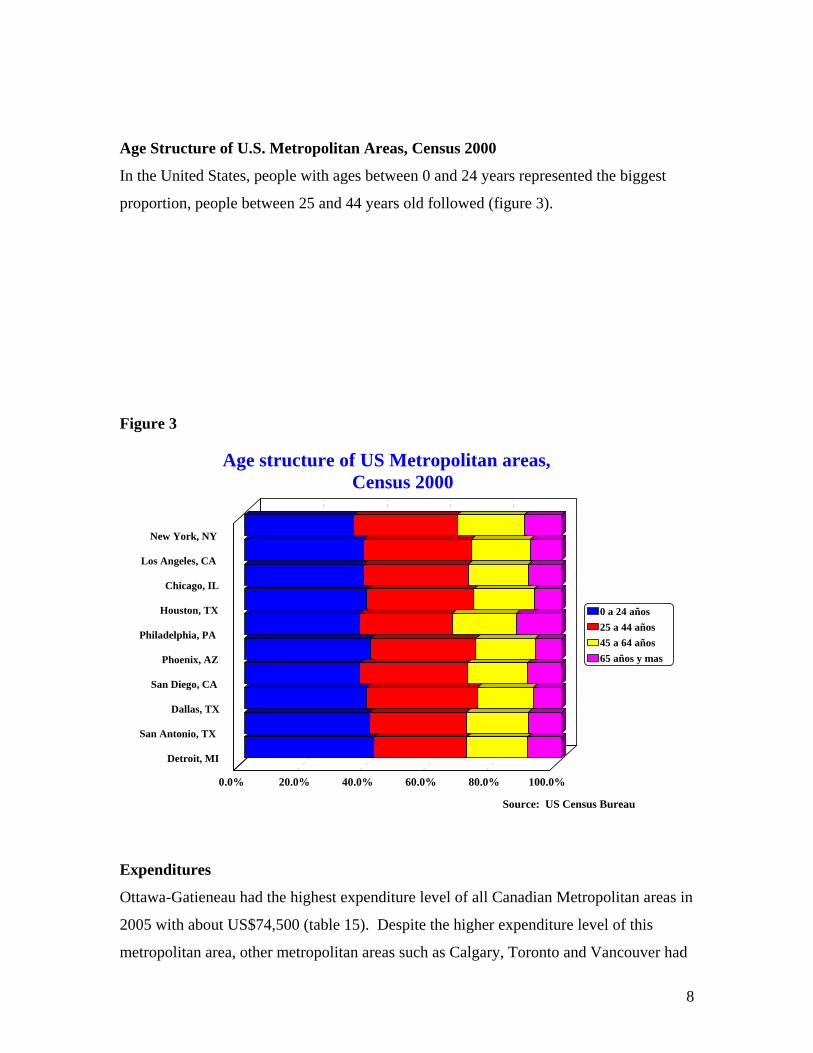
Age Structure of Canadian Metropolitan Areas, Census 2001 Different to the Census in Mexico and the United States, the Canadian Census 2001 groups the population in only 3 brackets. So comparison between Canada and the other countries considered in the study is difficult. As it is easy to observe from the graph that follows, most of the Canadian population had ages between 20 and 64 years (Figure 2).
Figure 2
Age structure of Canadian Metropolitan areas, Census 2001
Source: 2001 Census of population- Statistics Canada
Toronto, Ontario
Montreal, Quebec
Vancover, British Colombia
Ottawa, Ontario-Quebec
Calgary, Alberta
Edmonton, Alberta
Quebec, Quebec
Winnipeg, Manitoba
Hamilton, Ontario
London, Ontario
0.0% 20.0% 40.0% 60.0% 80.0% 100.0%
0 a 19 años
20 a 64 años
65 años y mas
8
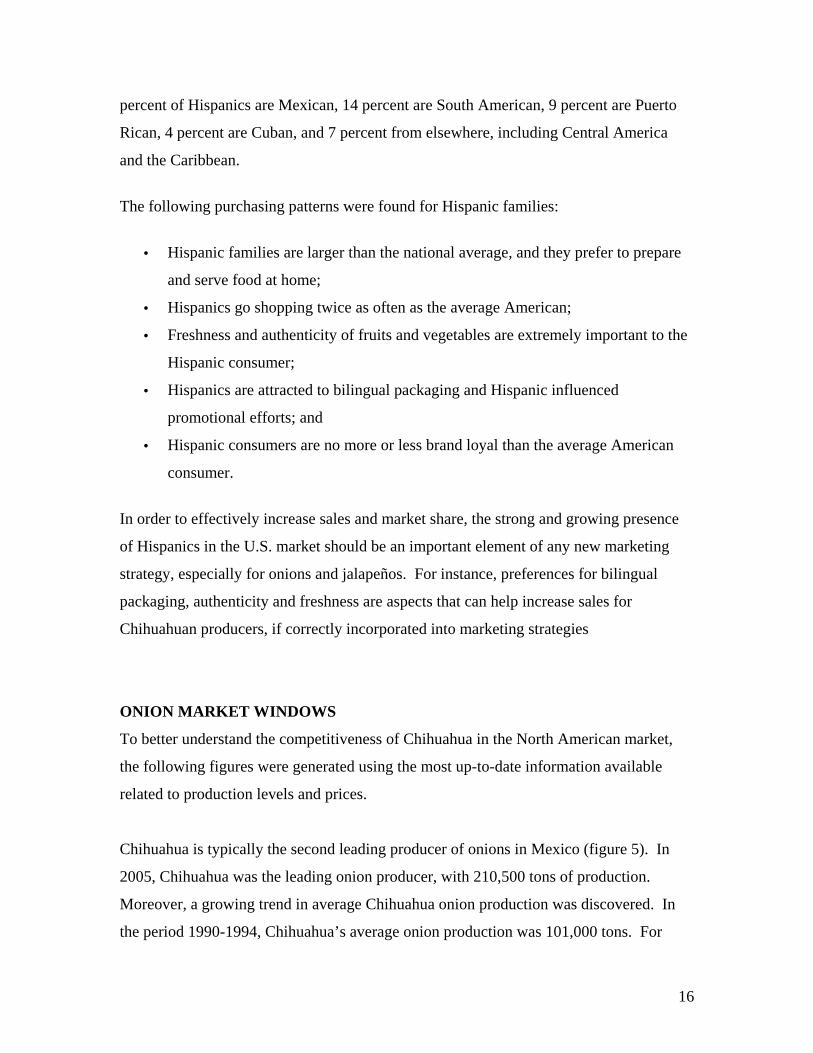
Age Structure of U.S. Metropolitan Areas, Census 2000
In the United States, people with ages between 0 and 24 years represented the biggest
proportion, people between 25 and 44 years old followed (figure 3).
Figure 3
Age structure of US Metropolitan areas, Census 2000
Source: US Census Bureau
New York, NY
Los Angeles, CA
Chicago, IL
Houston, TX
Philadelphia, PA
Phoenix, AZ
San Diego, CA
Dallas, TX
San Antonio, TX
Detroit, MI
0.0% 20.0% 40.0% 60.0% 80.0% 100.0%
0 a 24 años
25 a 44 años
45 a 64 años
65 años y mas
Expenditures
Ottawa-Gatieneau had the highest expenditure level of all Canadian Metropolitan areas in
2005 with about US$74,500 (table 15). Despite the higher expenditure level of this
metropolitan area, other metropolitan areas such as Calgary, Toronto and Vancouver had

9
higher expenditure levels in regard to food. Although expenditures among the different
metropolitan areas ranged widely, between US$74,500 and US$48,700, food
expenditures showed a smaller variation ranging between US$5,700 and US$6,900. Of
the top ten Canadian metropolitan areas in 2005, Calgary spent the most on food while
Winnipeg spent the least.

10
Table 15. Average Canadian Household Expenditures by Metropolitan Area, 2005
(U.S. dollars)
Metropolitan area Total expenditure Food Percentage Ottawa-Gatineau (Ontario Part) $74,458 $6,633 9% Calgary $73,398 $6,947 9% Toronto $73,029 $6,893 9% Vancouver $62,442 $6,867 11% Edmonton $61,955 $6,499 10% Winnipeg $55,122 $5,669 10% Montreal $49,467 $5,995 12% Quebec City $48,721 $6,020 12%
Although it is hard to compare the average household expenditures of Canada with those
of United States as information for the same year was not available, it is clear that
proportion of food expenditure to total expenditures is consistently slightly higher in the
United States relative to Canada.
In 2004, food expenditures in the United States ranged between US$5,600 and US$7,200
while total expenditures vary between US$44,500 and US$54,000 (table 16). The
variation in food expenditures in Canada is slightly higher that the variation in the United
States. Besides, the total expenditure range in the United States was narrower than the
total expenses variation in Canada.
Los Angeles spent the most of the top ten U.S. metropolitan areas in food with US$7,200
during 2003-2004. New York City followed closely with an average food expenditure of
US$7,000. Phoenix, Detroit and Houston were the three U.S. metropolitan areas with the
lowest level of expenditures in food with only about US$5,700 (table 16).

11
Table 16. U.S. Average Annual Expenditures of All Consumer Units by
Metropolitan Area, 2003-2004 (U.S. dollars)
Metropolitan area Total expenditure Food Percentage San Diego $53,949 $6,545 12% Los Angeles $52,652 $7,194 14% New York $51,979 $7,054 14% Chicago $50,627 $6,023 12% Dallas-Fort Worth $50,304 $6,111 12% Houston $48,063 $5,737 12% Detroit $46,731 $5,726 12% Phoenix $46,628 $5,698 12% Philadelphia $44,484 $5,622 13%
In the case of the United States, additional information about how Americans spent their
money during 2003-2004 was available.
Since our interest is in finding ways to improve the commercialization of onions and
jalapeño pepper, special attention should be put on the column “fruits and vegetables” as
it reveals the expenses dedicated to the category were both are included (table 17). Once
again, the Los Angeles metropolitan area is important, not only because it is the
metropolitan area with the highest level of expenditure on food, but also has the highest
fruit and vegetables expenditures, with about $800 dollars per person. New York and
San Diego followed with fruit and vegetable expenditures of $735 and $709, respectively.

12
Table 17. U.S. Average Annual Household Food Expenditures on Food and Beverages by Metropolitan Area, 2003-2004
Food at home
Metropolitan area Total food expenditures Food at
home, total
Cereal & bakery
products
Meats, poultry,
fish, eggs
Dairy Fruits, vegetables
Other food
at home
Food away from home
Alcoholic beverages
Chicago $6,545 $3,427 $472 $855 $366 $606 $1,128 $2,597 $493
Dallas-Fort Worth $7,194 $3,554 $470 $897 $378 $582 $1,227 $2,557 $507
Detroit $7,054 $3,287 $470 $863 $339 $542 $1,073 $2,439 $380
Houston $6,023 $3,107 $429 $813 $343 $535 $987 $2,630 $297
Los Angeles $6,111 $4,064 $536 $1,076 $426 $799 $1,227 $3,131 $563
New York $5,737 $3,879 $573 $1,102 $433 $735 $1,036 $3,174 $563
Philadelphia $5,726 $3,051 $451 $875 $327 $511 $887 $2,572 $608
Phoenix $5,698 $3,296 $450 $823 $366 $575 $1,081 $2,403 $469
San Diego $5,622 $3,472 $463 $818 $357 $709 $1,126 $3,073 $445 Source: Bureau of Labor Statistics, www.bls.gov

13
Since published expenditure patterns do not currently exist for Mexico, one way to
approach the issue is to review information related to income ranges. Some of the
metropolitan areas are highly industrialized and companies in the area hire unskilled
workers who earn relatively low salaries. With 266,500 employees, Iztapalapa had the
highest number of employees earning only one or two times the minimum wage in 2000,
Ecatepec the Morelos followed very closely with 241,500 employees. Guadalajara
accounted for the highest number of employees earning salaries varying from two to
three times the minimum wage (figure 4).
On the other hand, Monterrey was the leading metropolitan area employing people
earning more than ten times the minimum wage, while Guadalajara, with approximately
76,000 employees, had the largest number of employees earning between 5 and 10 times
the minimum wage.
Figure 4
Number of Employees in Mexican Metropolitan Areas by Multiple of Minimum Wage, 2000
Source: Secretaria de Trabajo y Prevision Social. Comision Nacional de Salarios Minimos
& &
& &
&& &
&& &
%
%%
%
% %% %
%
%$
$
$
$
$
$
$
$
$
$
' '''
' ' ' ''
'&
&
& & & & & & & &
!!
! !
! !!
! !!
Monterrey, N.L.
Tiju ana, B.C.
Guadalajara, Jal.
Puebla, Pue.
Juarez, Chih.
Leon, Gto.
G. A. Madero, D.F.
Iztapalapa, D.F.
Nezahualcoyotl, Mex.
Ecatepec, Mex.
0
50
100
150
200
250
300
Thousands Employees
Five to Ten Ten or More Non-specified
Two or Less Two to Three Three to Five
! & '
$ % &

14
A Closer Look at the U.S. Market… The Ethnic Market
An important ethnic food market has developed in the United States, influencing
consumer purchasing patterns. In July 2005, over 30 percent of the people residing in the
United States were considered ethnic. The largest group was Hispanics, followed by
African Americans and Asian Americans.
Such a strong ethnic presence has resulted in a market for ethnic food products of about
US$75 billion per year in the United States, accounting for one out of every seven dollars
spent on groceries. The ethnic food market is growing not only because of new
immigrants, but also because many Americans prefer ethnic foods at least some of the
time. In fact, 75 percent of ethnic food consumption comes from non-ethnic customers.
The growth of the ethnic market is strong as it is expected to increase by 50 percent over
the next decade. Currently, 37 percent of all supermarket sales are composed of ethnic
shoppers. However, this percentage is expected to increase as more retailers allocate
additional shelf space for ethnic oriented products.
Food services are a major driver of the ethnic food market, representing 65 percent of the
market. Furthermore, food services are also responsible for the introduction of new
products and creation of trends. While U.S. supermarkets currently account for just 35%
of the ethnic food sales, they are expanding participation in this market.
Although the newer ethnic products are not as mainstream as pizza or tacos, there is a
strong growing demand by restaurants. Since potential profits are new entrants, more
than 2,000 new ethnic products have been introduced since 2003.
As the popularity of ethnic foods increases and more people adopt the different foods of
the world, the mainstream status is changing. Aside from Mexican and Italian foods, the
most popular ethnic foods are Chinese, Japanese and Thai. Recent trends have also
shown that Caribbean, African and Mediterranean foods as well as halal and kosher
markets have an increasing consumer base.

15
It is important to note that ethnic foods have a wider consumer base in more affluent
areas and television food shows, the internet, and new restaurant chains are key
contributors to the ethnic influence on consumers. Moreover, this market is evolving.
Future trends point to Australian, Brazilian, and Malaysian foods becoming increasingly
popular with non-ethnic consumers.
Hispanic Market
Among all the ethnic groups in the United States, Hispanics are of special importance. In
fact, Hispanics are the largest ethnic minority group in the United States, representing
14.7 percent of the U.S. population in 2006. Thus, Hispanics are the largest potential
ethnic food market. Not only are Hispanics the largest group, but they also are also the
fastest growing ethnic group and the majority of these are Mexican. It is estimated that
by 2012, one out of every five Americans will be Hispanic.
The economic power of Hispanic families is growing in the United States as well.
Consumer expenditures by Hispanics increased from US$504 billion in 2000 to over
US$750 billion in 2005. By 2008, it is expected that Hispanic Americans will have a
purchasing power of US$1.0 trillion. It is also estimated that Hispanics spend
approximately US$55 billion on food annually. Further, studies have found that Hispanic
families spend approximately 7 percent more than the average American family on food
and apparel.
The Hispanic consumer segment can be divided into many categories. One classification,
however, is of special interest as it reflects important changes in consumption patterns.
Native born Hispanics who have exclusively lived in the United States and immigrant
Hispanics are the components of this classification.
Native born Hispanics usually speak fluent English and their consumer patterns are
closely related to those of other Americans. Immigrant Hispanics are attracted to Spanish
language media and consumption patterns reflect their heritage. These groups can be
further broken down by country of origin. This is recommended since some differences
between countries can help to build a better marketing campaign. It is estimated that 67
16
percent of Hispanics are Mexican, 14 percent are South American, 9 percent are Puerto
Rican, 4 percent are Cuban, and 7 percent from elsewhere, including Central America
and the Caribbean.
The following purchasing patterns were found for Hispanic families:
• Hispanic families are larger than the national average, and they prefer to prepare
and serve food at home;
• Hispanics go shopping twice as often as the average American;
• Freshness and authenticity of fruits and vegetables are extremely important to the
Hispanic consumer;
• Hispanics are attracted to bilingual packaging and Hispanic influenced
promotional efforts; and
• Hispanic consumers are no more or less brand loyal than the average American
consumer.
In order to effectively increase sales and market share, the strong and growing presence
of Hispanics in the U.S. market should be an important element of any new marketing
strategy, especially for onions and jalapeños. For instance, preferences for bilingual
packaging, authenticity and freshness are aspects that can help increase sales for
Chihuahuan producers, if correctly incorporated into marketing strategies
ONION MARKET WINDOWS
To better understand the competitiveness of Chihuahua in the North American market,
the following figures were generated using the most up-to-date information available
related to production levels and prices.
Chihuahua is typically the second leading producer of onions in Mexico (figure 5). In
2005, Chihuahua was the leading onion producer, with 210,500 tons of production.
Moreover, a growing trend in average Chihuahua onion production was discovered. In
the period 1990-1994, Chihuahua’s average onion production was 101,000 tons. For

17
2004-2005, average onion production in Chihuahua was 199,000 tons. Chihuahua
production represents about 17 percent of total annual Mexican onion production.
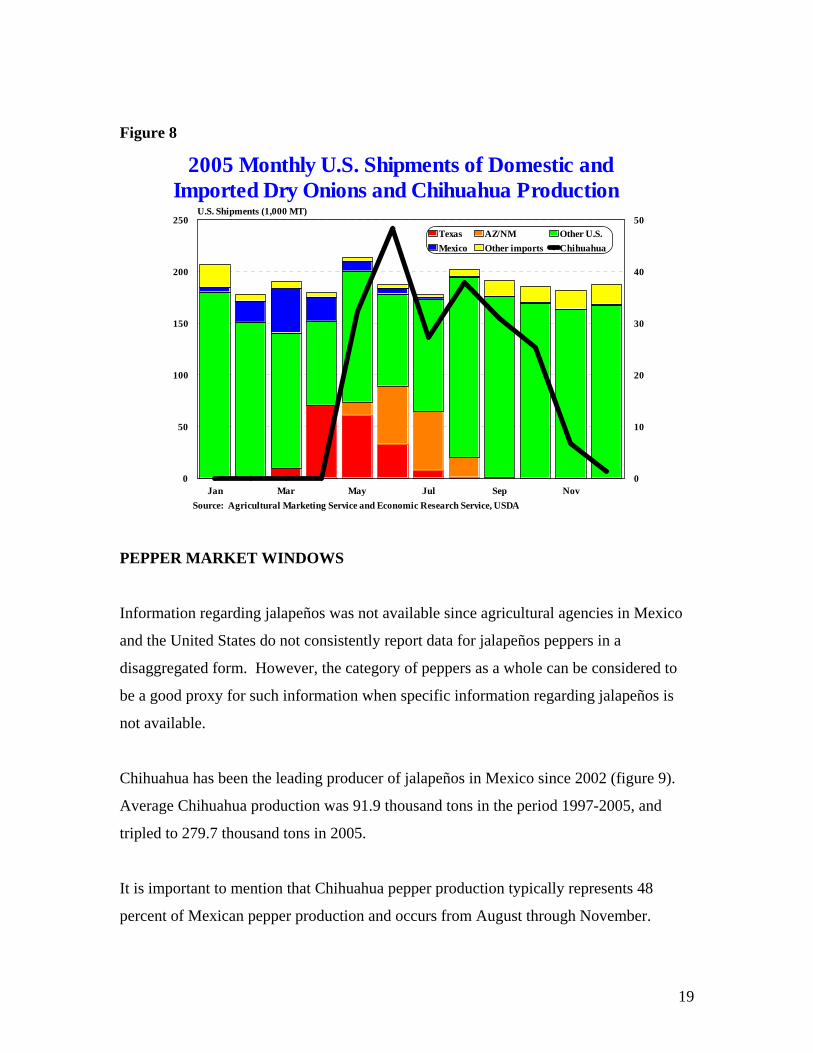
Chihuahua’s production occurs mostly from June to October, and represents 27 percent
of Mexican production during that time (figure 6). Unfortunately, most Chihuahua
production occurs when U.S. prices are declining and U.S. shipments are level (figure 7).
Among main U.S. shippers during June-October are Texas, New Mexico, Georgia and
Central California early in the period; and California, Washington, Oregon and Idaho,
later in the period. Figure 8 shows how harvests seasons overlap between these states.
Chihuahua onions produced earlier in the year would typically face much less
competitive pressure, and therefore higher prices than the current market window.
Exploration of earlier maturing varieties might be one option to consider in order
improve market conditions and would result in a more orderly market situation.
In Appendix A, there is a list of various fruit and vegetable dealers and brokers, who can
be contacted to improve the sales of onions by Chihuahua’s producers.
Figure 5
Mexican Onion Production
Source: SIACON Database, SAGARPA
8 33.
0
896.
5
745.
2
739.
7
749.
6
734.
1
786.
2 917.
6
1000
.3
1342
.2
1002
.5 1157
.0
1199
.0
1256
.5
1341
.7
1230
.9
1990 1994 1998 2002 20050.0
200.0
400.0
600.0
800.0
1000.0
1200.0
1400.0
1600.0
1,000 MT
Chihuahua Baja California
Tamaulipas Guanajuato
Morelos Others

18
Figure 6
2005 Monthly Mexican Production of Onions
Source: SIACON Database, SAGARPA
87.8
109.
5
116.
1
148.
0
130.
1
1 11.
8
56.4
1 01.
3
108.
4
8 7.5 97
.2
7 5.8
Jan Mar May Jul Sep Nov0.0
20.0
40.0
60.0
80.0
100.0
120.0
140.0
160.0
180.0
1,000 MT
Baja California Guanajuato Tamaulipas
Morelos Chihuahua Otros
Figure 7
2005 Monthly Chihuahua Production and U.S. Price of Onions
Source: FAS and NASS, USDA
Jan Mar May Jul Sep Nov0
10
20
30
40
50
1,000 MT
$0.00
$0.10
$0.20
$0.30
$0.40
$0.50US$/KG
Chihuahua Production
U.S. F.O.B. Price 2005
19
Figure 8
2005 Monthly U.S. Shipments of Domestic and Imported Dry Onions and Chihuahua Production
Source: Agricultural Marketing Service and Economic Research Service, USDA
&&
& & &
&
&
&
&
&
&
&
Jan Mar May Jul Sep Nov0
50
100
150
200
250U.S. Shipments (1,000 MT)
0
10
20
30
40
50Texas AZ/NM Other U.S.
Mexico Other imports Chihuahua&
PEPPER MARKET WINDOWS
Information regarding jalapeños was not available since agricultural agencies in Mexico
and the United States do not consistently report data for jalapeños peppers in a
disaggregated form. However, the category of peppers as a whole can be considered to
be a good proxy for such information when specific information regarding jalapeños is
not available.
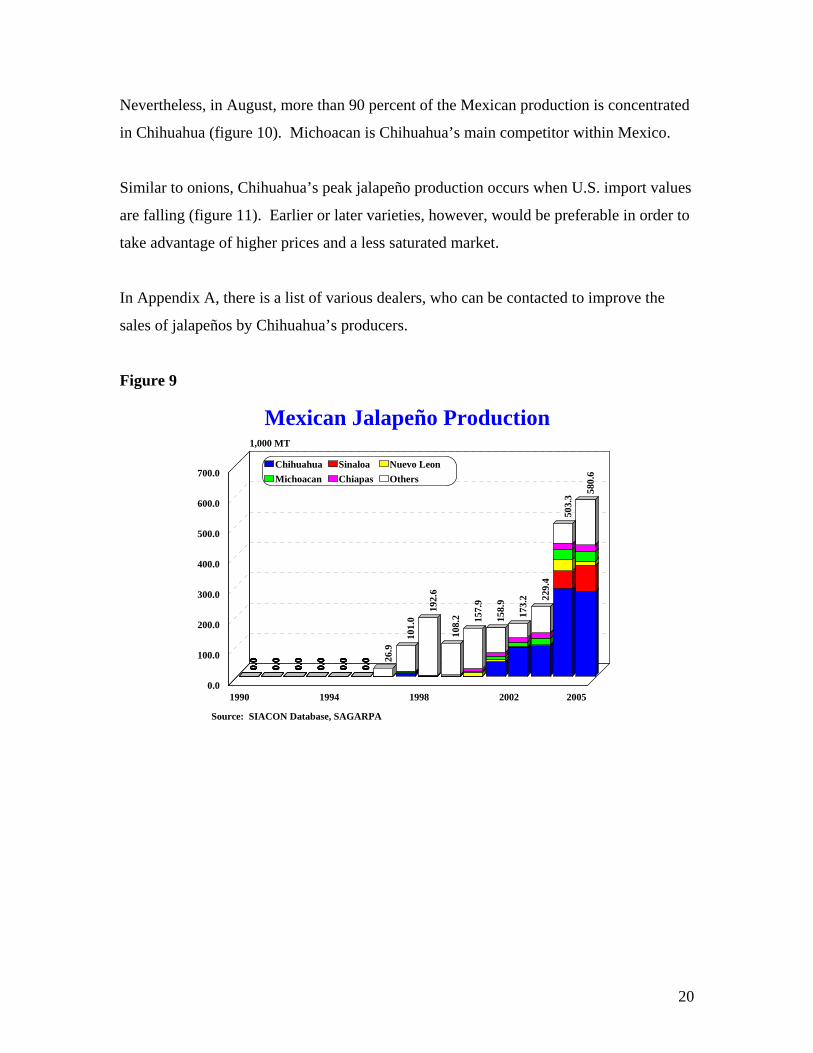
Chihuahua has been the leading producer of jalapeños in Mexico since 2002 (figure 9).
Average Chihuahua production was 91.9 thousand tons in the period 1997-2005, and
tripled to 279.7 thousand tons in 2005.
It is important to mention that Chihuahua pepper production typically represents 48
percent of Mexican pepper production and occurs from August through November.
20
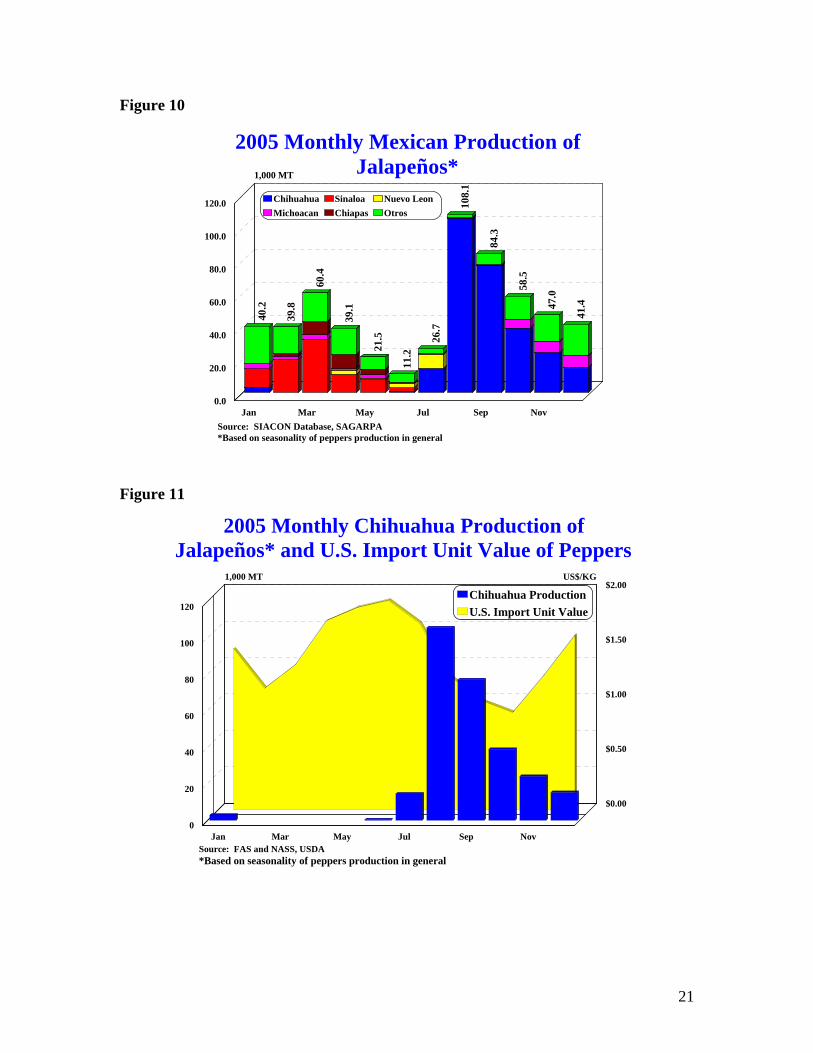
Nevertheless, in August, more than 90 percent of the Mexican production is concentrated
in Chihuahua (figure 10). Michoacan is Chihuahua’s main competitor within Mexico.
Similar to onions, Chihuahua’s peak jalapeño production occurs when U.S. import values
are falling (figure 11). Earlier or later varieties, however, would be preferable in order to
take advantage of higher prices and a less saturated market.
In Appendix A, there is a list of various dealers, who can be contacted to improve the
sales of jalapeños by Chihuahua’s producers.
Figure 9
Mexican Jalapeño Production
Source: SIACON Database, SAGARPA
0.0
0 .0
0.0
0.0
0.0
0.0
0.0
0 .0
0.0
0.0
0.0
0.0
0.0
0 .0
0.0
0.0
0.0
0.0
0.0
0 .0
0.0
0.0
0.0
0.0
0.0
0 .0
0.0
0.0
0.0
0.0
0.0
0 .0
0.0
0.0
0.0
0.0 2 6
.9
101.
0
192.
6
108.
2 157.
9
158.
9
173.
2 2 29.
4
503 .
3
580.
6
1990 1994 1998 2002 20050.0
100.0
200.0
300.0
400.0
500.0
600.0
700.0
1,000 MT
Chihuahua Sinaloa Nuevo Leon
Michoacan Chiapas Others
21
Figure 10
2005 Monthly Mexican Production of Jalapeños*
Source: SIACON Database, SAGARPA *Based on seasonality of peppers production in general
40.2
39.8
6 0.4
39.1
21.5
11.2
26.7
108.
1
84. 3
58.5
47.0
41.4
Jan Mar May Jul Sep Nov0.0
20.0
40.0
60.0
80.0
100.0
120.0
1,000 MT
Chihuahua Sinaloa Nuevo Leon
Michoacan Chiapas Otros
Figure 11
2005 Monthly Chihuahua Production of Jalapeños* and U.S. Import Unit Value of Peppers
Source: FAS and NASS, USDA*Based on seasonality of peppers production in general
Jan Mar May Jul Sep Nov0
20
40
60
80
100
120
1,000 MT
$0.00
$0.50
$1.00
$1.50
$2.00US$/KG
Chihuahua ProductionU.S. Import Unit Value

22
Competitors and Opportunities for Mexican Peppers Producers in the U.S. Market1
In 2006, the United States ranked as the sixth largest chili pepper producer in the world
behind China, Mexico, Turkey, Indonesia, and Spain. One of the likely large competitors
for Mexico and other pepper producers in the future is China. Output of all peppers in
China has been rising steadily over the last decade. In fact, during 1993-95, China
produced one-third of the world pepper output and by 2003-05, this country accounted
for one-half of the world’s production. In the future, China will have the capacity to
increase its exports to the U.S. market. Nevertheless, thanks to the NAFTA and
subsequent duty-free export opportunities, Mexico has been able to more than double the
output of sweet and pungent peppers in the same period by expanding its market in
Canada and the United States. It is also unclear whether Chinese peppers are equivalent
substitutes for Mexican fresh peppers and how readily Chinese peppers will be accepted
by U.S. consumers. Phytosanitary issues and compliance with U.S. regulations also
could limit Chinese sales initially.
The use of chili peppers in the United States has increased 38 percent, moving from an
annual average fresh-weight equivalent of 1.95 kilograms per person during 1993-95 to
2.68 kilograms during 2003-05. During the late 1980s and early 1990s, chili peppers
were one of the fastest growing specialty produce items. Such growth resulted in a 25
percent increase in consumption during the 1990s compared to the 1980s. This positive
trend continued until 2006, with consumption growth just below that of the 1990s.
According to the U.S. Census of Agriculture, 4,748 farms harvested chili peppers from
42,666 acres in 2002. This was up from 2,087 farms and 27,990 acres in 1987. Although
49 U.S. states produced chili peppers, the production was highly concentrated in just a
few. The largest concentration of chili pepper acreage in the United States occurred in
southern New Mexico, accounting for 39 percent of all chili pepper acreage in the United
States. Most of the production in New Mexico was located in the Hatch valley and in the
outskirts of the city of Las Cruces. The counties of Luna, Doña Ana, and Hidalgo
1 In this section, the Chili peppers category is discussed. While this category includes jalapeños, it also includes other varieties of peppers.
23
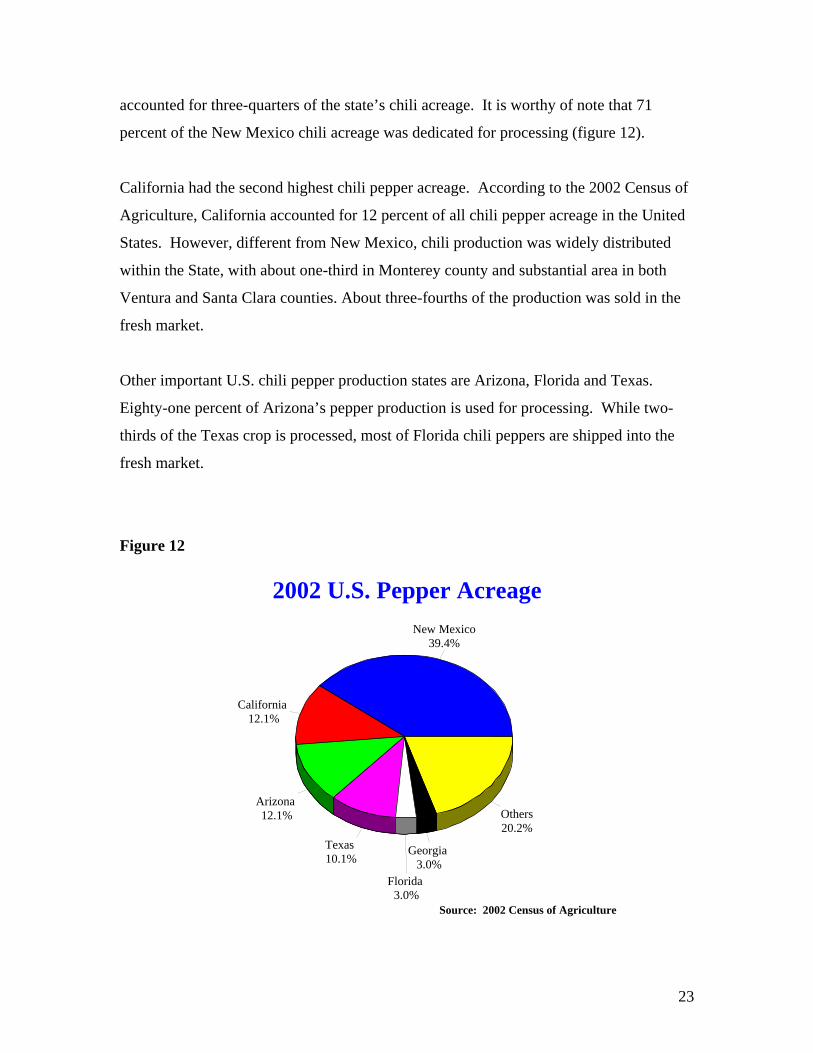
accounted for three-quarters of the state’s chili acreage. It is worthy of note that 71
percent of the New Mexico chili acreage was dedicated for processing (figure 12).
California had the second highest chili pepper acreage. According to the 2002 Census of
Agriculture, California accounted for 12 percent of all chili pepper acreage in the United
States. However, different from New Mexico, chili production was widely distributed
within the State, with about one-third in Monterey county and substantial area in both
Ventura and Santa Clara counties. About three-fourths of the production was sold in the
fresh market.
Other important U.S. chili pepper production states are Arizona, Florida and Texas.
Eighty-one percent of Arizona’s pepper production is used for processing. While two-
thirds of the Texas crop is processed, most of Florida chili peppers are shipped into the
fresh market.
Figure 12
2002 U.S. Pepper Acreage
Source: 2002 Census of Agriculture
New Mexico39.4%
California 12.1%
Arizona 12.1%
Texas 10.1%
Florida 3.0%
Georgia 3.0%
Others20.2%
24
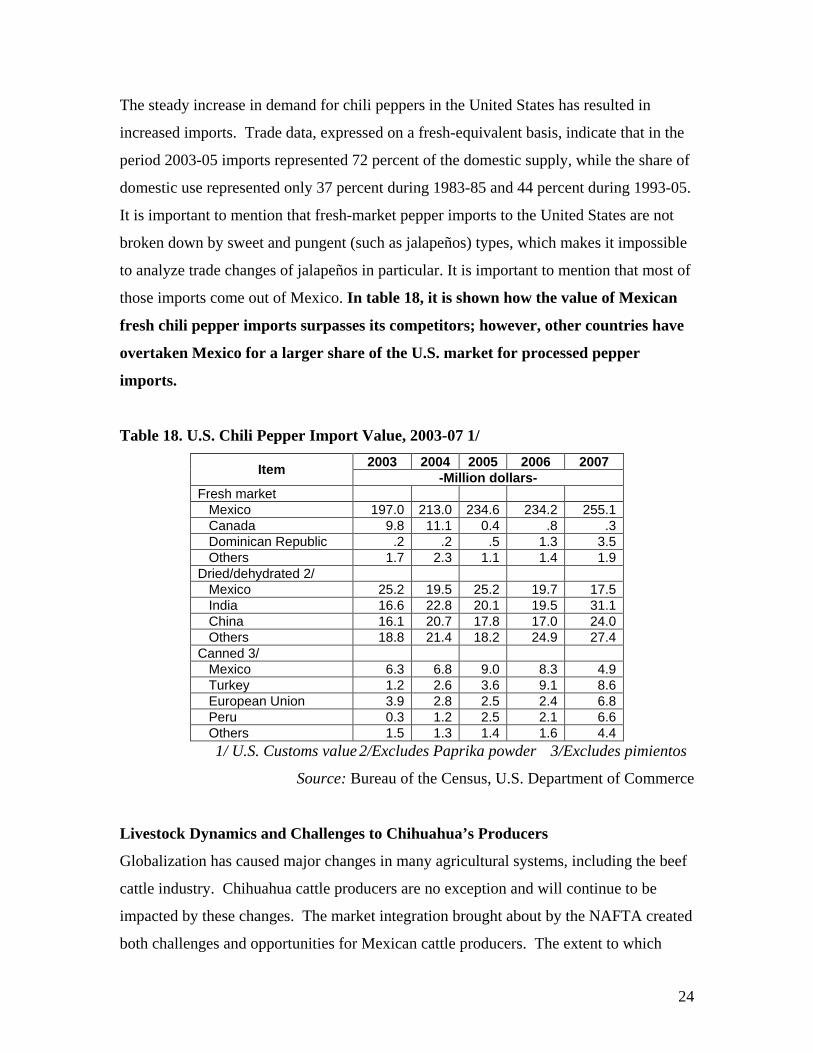
The steady increase in demand for chili peppers in the United States has resulted in
increased imports. Trade data, expressed on a fresh-equivalent basis, indicate that in the
period 2003-05 imports represented 72 percent of the domestic supply, while the share of
domestic use represented only 37 percent during 1983-85 and 44 percent during 1993-05.
It is important to mention that fresh-market pepper imports to the United States are not
broken down by sweet and pungent (such as jalapeños) types, which makes it impossible
to analyze trade changes of jalapeños in particular. It is important to mention that most of
those imports come out of Mexico. In table 18, it is shown how the value of Mexican
fresh chili pepper imports surpasses its competitors; however, other countries have
overtaken Mexico for a larger share of the U.S. market for processed pepper
imports.
Table 18. U.S. Chili Pepper Import Value, 2003-07 1/
2003 2004 2005 2006 2007 Item -Million dollars-
Fresh market Mexico 197.0 213.0 234.6 234.2 255.1 Canada 9.8 11.1 0.4 .8 .3 Dominican Republic .2 .2 .5 1.3 3.5 Others 1.7 2.3 1.1 1.4 1.9 Dried/dehydrated 2/ Mexico 25.2 19.5 25.2 19.7 17.5 India 16.6 22.8 20.1 19.5 31.1 China 16.1 20.7 17.8 17.0 24.0 Others 18.8 21.4 18.2 24.9 27.4 Canned 3/ Mexico 6.3 6.8 9.0 8.3 4.9 Turkey 1.2 2.6 3.6 9.1 8.6 European Union 3.9 2.8 2.5 2.4 6.8 Peru 0.3 1.2 2.5 2.1 6.6 Others 1.5 1.3 1.4 1.6 4.4
1/ U.S. Customs value 2/Excludes Paprika powder 3/Excludes pimientos
Source: Bureau of the Census, U.S. Department of Commerce
Livestock Dynamics and Challenges to Chihuahua’s Producers
Globalization has caused major changes in many agricultural systems, including the beef
cattle industry. Chihuahua cattle producers are no exception and will continue to be
impacted by these changes. The market integration brought about by the NAFTA created
both challenges and opportunities for Mexican cattle producers. The extent to which

25
Chihuahua cattle producers adapt to these new conditions and learn how to take
advantage of the new opportunities will ultimately determine their success or failure.
The most important issues surrounding the future of the North America cattle industry are
discussed in a recent report issued by the Farm Foundation, The Future of Animal
Agriculture in North America. Since Chihuahua producers are directly affected by the
opportunities and challenges created as a consequence of market integration, a summary
of the report findings follow.
It is important to mention the magnitude of the industry. In 2007, it was estimated that
the United States, Mexico and Canada had an average combined cattle herd of 138
million head. The United States accounted for 71 percent of the total herd in North
America, while Mexico accounted for 19 percent and Canada 10 percent (figure 13).
Figure 13
Average Cattle Stock by Country, 1990-2007
Source: Production, Supply, and Demand Data, USDA, www.fas.usda.gov/psdonline
1990 1995 2000 2005 20070
20
40
60
80
100
120
140
160
Thousand head
United States Mexico Canada
26
One of the most important trends in the North American cattle sector is the transition
from a higher number of operations with smaller herds to a smaller number of operations
with larger herds. The optimal size of cattle operations is expected to be increasingly
driven by the extent to which economies of scale in production and marketing can be
achieved. Effective supply chain management that improves cost efficiency and control,
food safety and quality, and the ability to respond to consumer demands is part of this
new trend. The role of technology as a means to increase efficiencies and provide
information is also important to better manage the system.
Failure to implement changes in the Chihuahua cattle industry to adapt to these trends,
making integration into the evolving supply-chain structures difficult, could put
Chihuahua producers at a competitive disadvantage. One of the few options for small
producers not integrated into the larger, cost efficient supply-chain structures is creating
value-added niche markets. In these markets, consumers pay high enough premiums for
differentiated products to offset the increased cost of production, grading, sorting, and
distribution.
Another strategy could be for small and mid-size producers to form alliances or networks,
letting them to act together as large producers in order to more effectively market feeder
cattle. In both cases, a high level of cooperation and interdependence among producers
would be necessary. Therefore, whichever path Chihuahua producers decide to take,
being aware of new opportunities and challenges is a good starting point, and changes
will be required.
It is expected that interdependence between producers and processing plants will result in
the development of production-processing centers and supporting infrastructure as the
optimal strategy for growth and expansion in the industry. This integration is not only
expected to bring economies of scale, but it can also be used to increase food safety,
improve marketing of live cattle and meats, and may also create the perception that
Chihuahua products represent a naturally produced, safe and a reliable source.

27
Food safety is thought to continue to be a paramount consumer expectation. Food safety
failures will be increasingly less tolerated by consumers, and new regulations and product
processing and packaging will continue to evolve to provide a better food safety. For
some consumers, the ability to trace products and process attributes will be seen as a key
element in their purchasing decisions. Then, it is likely that animal identification and
traceability systems will have a key role in the future of the animal agriculture industry.
An example of the strong economic effects of food safety in North America occurred in
2003. The discovery of bovine spongiform encephalopathy (BSE) in Canada caused the
United States to close its border to the imports of live cattle coming from that Canada,
negatively affecting Canadian producers. The problem for Canada represented an
opportunity to Mexico, which increased exports to the United States to substitute for the
Canadian supply of live cattle and satisfy the demand in the U.S. market (figure 14).
Figure 14
U.S. Imports of Live Cattle fromCanada and Mexico, 1991 - 2007
Source: U.S. Trade Intenet System, www.fas.usda.gov/ustrade
1991 1995 1999 2003 20070
500
1,000
1,500
2,000
2,500
3,000
Thousand Head
Cattle Mexico
NAFTA has helped the integration of animal agriculture among trade partners. However,
the countries involved are not isolated from the rest or the world, leaving the door open to

28
more challenges. Two factors are primarily identified as the shaping forces in the North
American exports of animal products: income of developing countries and trade
agreements. Even though consumer income growth in the United States and Canada has
slowed, consumer expenditures on beef have been relatively stable in recent years. These
factors can change the per capita beef consumption patterns in the three countries. As of
2007, United States was the leading beef consumer in the North American market with an
estimated 41.9 kilograms per person, with Canada and Mexico consuming 32.6 and 23.5
kilograms per person, respectively (table 18).
Table 19. Per Capita Beef Consumption in North America (kilograms per person
per year)
Year Country 2000 2004 2005 2006 2007
Canada 31.9 32.0 33.4 33.3 32.6 Mexico 23.3 23.0 23.3 23.9 23.5 United States 43.9 42.7 42.2 42.4 41.9
Carcass Weight Equivalent; Sources: FAOSTAT, Foreign Agricultural Service, and CIA World Fact Book
Summary and Options to Consider
Chihuahua producers have been strongly impacted by trade resulting from the North
American Free Trade Agreement (NAFTA). In addition, changes in the demographics
have also raised additional challenges. For these reasons, it is important for Chihuahua
producers to understand the demographics and its evolution for the three countries. In
this regard, it was found that the people in Mexico tend to be younger than the people in
the United States and Canada. Also, population growth rates were higher in Mexico
compared to the United States and Canada. On the other hand, important differences in
the income and concentration in metropolitan areas of the population in the United States
and Canada can be useful to plan and implement marketing strategies that could help
increase sales for Chihuahua producers.
29
Significant patterns in the trade of onions and jalapeños between Mexico and the United
States were found. In both cases, the production of these crops in Chihuahua peaked
when the import price started declining in the United States. This problem for Chihuahua
producers calls for better ways to sell their products in the American market. For this
reason, an attempt was made to identify and categorize some of the most important
options to assist Chihuahua producers.
When considering options, Chihuahua onion, jalapeño and cattle producers should
consider forming strategic alliances with other producers, feedlots, and brokers. For
instance, as the number Chihuahua onion producers that participate in a marketing
alliance increases, the ability of the group to assure buyers of consistent volumes grows.
Further, buyers will have fewer sellers to negotiate with and play against each other. As
a result, the prices received by the growers may increase. The same thought pattern
applies to jalapeño and cattle producers.
Producers may also consider forming strategic alliances with brokers, food service
suppliers, wholesalers, retail grocery chains, or even restaurants. By forming this type of
alliance, relationships can be built over longer periods of time. Over the longer term, this
can result in greater profits. To assist in this, Appendix A contains a list of vegetable
brokers, including contact information and product coverage. It is not recommended to
use a “shotgun approach” when contacting the brokers on the list, but rather focus on
several firms with a more targeted approach.
Appendix B has information regarding major metropolitan areas in the United States and
Canada. Included in this list are market shares of grocery retailers. A targeted approach
to using this list would be effective, and geography should also be considered. The best
approach may be to consider concentrating on Los Angeles, Houston, San Antonio, and
Dallas-Fort Worth due to their proximity to Chihuahua. This would lead to lower
transportation costs and less time in transit. Further, if only a few retail chains were
targeted, such as HEB for San Antonio and Houston, Walmart for Dallas-Fort Worth, San

30
Antonio, and Houston, or Albertsons for Los Angeles and Dallas-Fort Worth, marketing
efforts could be greatly multiplied.
Do not overlook the potential benefits of establishing relationships with smaller chains,
such as Fiesta Mart in Houston and Minyard’s in Dallas-Fort Worth. Each of these
chains has about a ten percent market share of there areas, and may be a better fit for an
alliance of Chihuahua onion and jalapeño producers than some of the larger stores
The integration of the North American market has caused important changes and will
continue to shape agriculture in the three countries. The extent to which Chihuahua
producers change and adapt to these changes will determine their success or failure in the
future.

31
References
Agriculture and Agri-Food Canada. US Ethnic Food Market. http://www.ats.agr.gc.ca/. Canada's National Statistical Agency. http://www40.statcan.ca/l01/cst01/famil10c.htm. Central Intelligence Agency. CIA World Factbook. https://www.cia.gov. Economic Research Service, USDA. Vegetables and Melons Outlook. Livestock, Dairy, and Poultry Outlook. www.ers.usda.gov. Economic Research Service, USDA. Livestock, Dairy, and Poultry Outlook. www.ers.usda.gov Farm Foundation. The Future of Animal Agriculture in North America. http://www.farmfoundation.org. Food and Agriculture Organization of the United Nations. FAOSTAT. http://faostat.fao.org. Foreign Agricultural Services, USDA. U.S. Trade Internet System. www.fas.usda.gov/ustrade. Foreign Agricultural Service, USDA. Production, Supply, and Demand Data. www.fas.usda.gov/psdonline. Instituto Nacional de Estadística Geografía e Informática. Sistema Municipal de Datos. XII Censo General de Población y Vivienda 2000. Cuaderno estadístico de la Zona Metropolitana de la Ciudad de México, 2005. http://sc.inegi.gob.mx/simbad. International Monetary Fund. http://www.imf.org. National Agricultural Statistical Service, USDA. 2002 U.S. Census of Agriculture. Statistics Canada. 2001 Census of Canada. http://www12.statcan.ca/english/census01/home/index.cfm. Secretaria de Trabajo y Previsión Social. Comisión Nacional de los Salarios Mínimos. Servicio de Información y Estadística Agroalimentaria y Pesquera of Secretaria de Agricultura, Ganadería, Desarrollo Rural, Pesca y Alimentación (SIAP/SAGARPA), the Statistics Division of the Mexican Ministry of Agriculture. The Packer. 2008 Fresh Trends Annual Consumer Survey. Vance Publishing, Lenexa, KS, 2008. U.S. Census Bureau. County and City Data Book: 2000 http://www.census.gov.

32
Appendix A
U.S. Produce Brokers

33
34
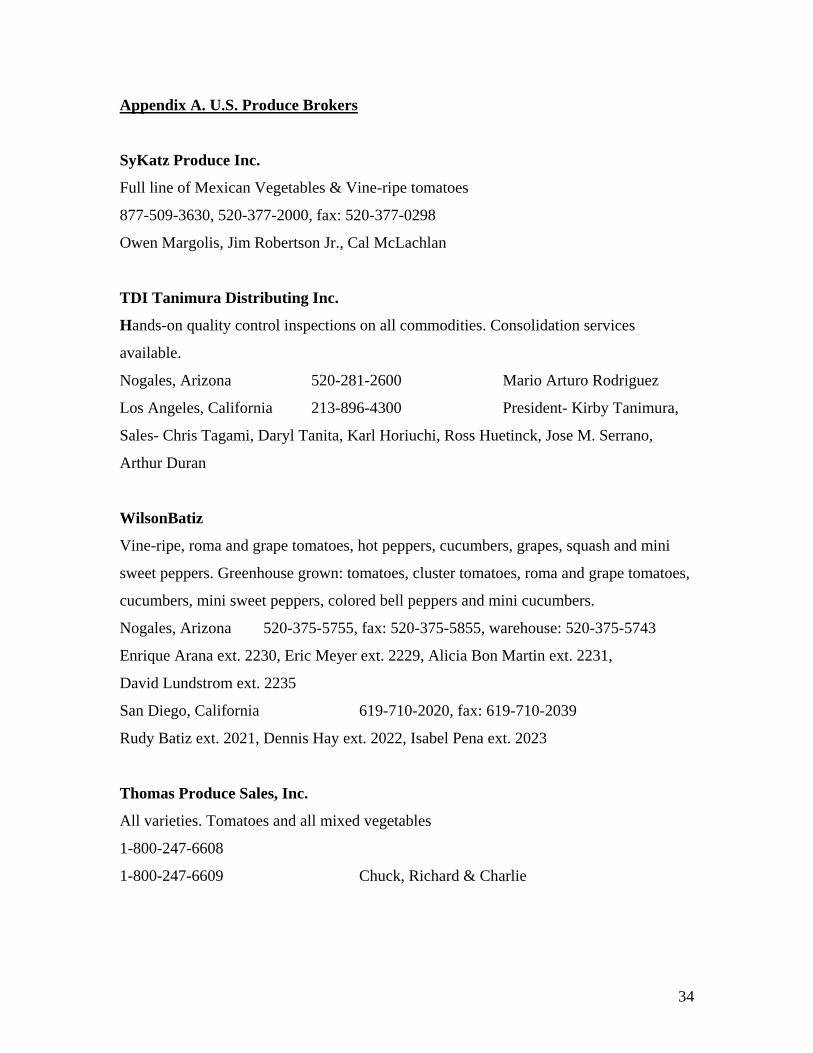
Appendix A. U.S. Produce Brokers
SyKatz Produce Inc.
Full line of Mexican Vegetables & Vine-ripe tomatoes
877-509-3630, 520-377-2000, fax: 520-377-0298
Owen Margolis, Jim Robertson Jr., Cal McLachlan
TDI Tanimura Distributing Inc.
Hands-on quality control inspections on all commodities. Consolidation services
available.
Nogales, Arizona 520-281-2600 Mario Arturo Rodriguez
Los Angeles, California 213-896-4300 President- Kirby Tanimura,
Sales- Chris Tagami, Daryl Tanita, Karl Horiuchi, Ross Huetinck, Jose M. Serrano,
Arthur Duran
WilsonBatiz
Vine-ripe, roma and grape tomatoes, hot peppers, cucumbers, grapes, squash and mini
sweet peppers. Greenhouse grown: tomatoes, cluster tomatoes, roma and grape tomatoes,
cucumbers, mini sweet peppers, colored bell peppers and mini cucumbers.
Nogales, Arizona 520-375-5755, fax: 520-375-5855, warehouse: 520-375-5743
Enrique Arana ext. 2230, Eric Meyer ext. 2229, Alicia Bon Martin ext. 2231,
David Lundstrom ext. 2235
San Diego, California 619-710-2020, fax: 619-710-2039
Rudy Batiz ext. 2021, Dennis Hay ext. 2022, Isabel Pena ext. 2023
Thomas Produce Sales, Inc.
All varieties. Tomatoes and all mixed vegetables
1-800-247-6608
1-800-247-6609 Chuck, Richard & Charlie
35
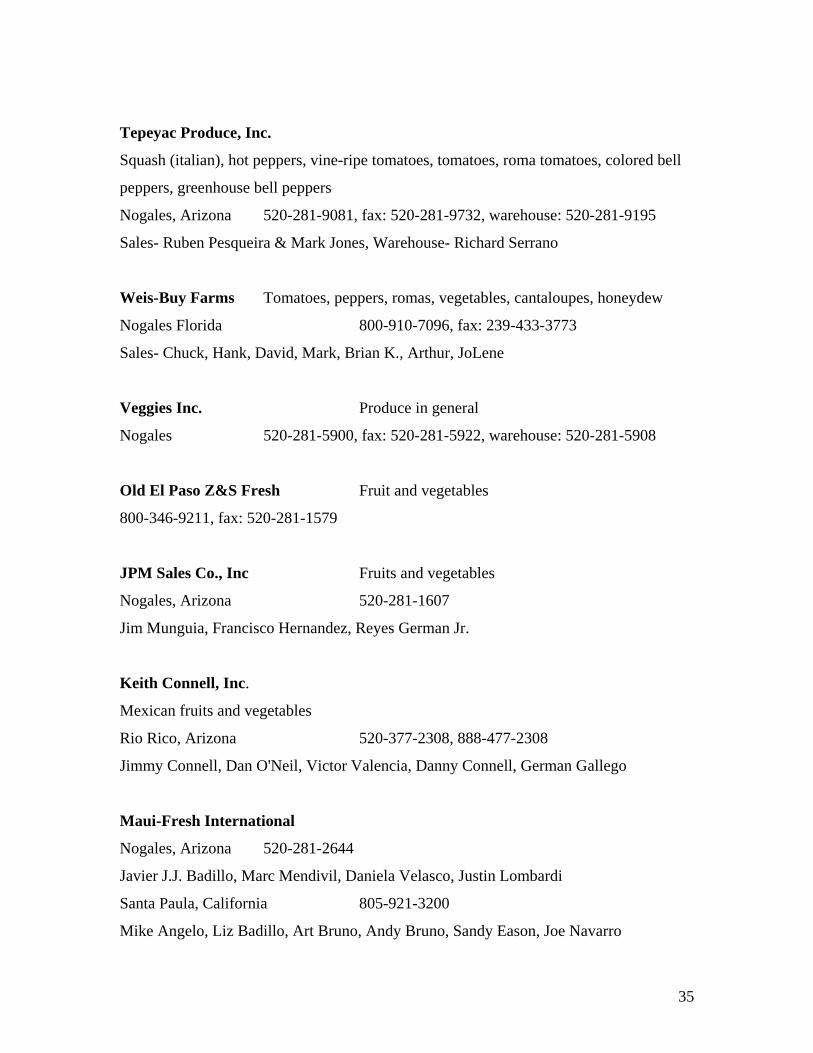
Tepeyac Produce, Inc.
Squash (italian), hot peppers, vine-ripe tomatoes, tomatoes, roma tomatoes, colored bell
peppers, greenhouse bell peppers
Nogales, Arizona 520-281-9081, fax: 520-281-9732, warehouse: 520-281-9195
Sales- Ruben Pesqueira & Mark Jones, Warehouse- Richard Serrano
Weis-Buy Farms Tomatoes, peppers, romas, vegetables, cantaloupes, honeydew
Nogales Florida 800-910-7096, fax: 239-433-3773
Sales- Chuck, Hank, David, Mark, Brian K., Arthur, JoLene
Veggies Inc. Produce in general
Nogales 520-281-5900, fax: 520-281-5922, warehouse: 520-281-5908
Old El Paso Z&S Fresh Fruit and vegetables
800-346-9211, fax: 520-281-1579
JPM Sales Co., Inc Fruits and vegetables
Nogales, Arizona 520-281-1607
Jim Munguia, Francisco Hernandez, Reyes German Jr.
Keith Connell, Inc.
Mexican fruits and vegetables
Rio Rico, Arizona 520-377-2308, 888-477-2308
Jimmy Connell, Dan O'Neil, Victor Valencia, Danny Connell, German Gallego
Maui-Fresh International
Nogales, Arizona 520-281-2644
Javier J.J. Badillo, Marc Mendivil, Daniela Velasco, Justin Lombardi
Santa Paula, California 805-921-3200
Mike Angelo, Liz Badillo, Art Bruno, Andy Bruno, Sandy Eason, Joe Navarro
36
Malena Produce, Inc. Various commodities
Nogales, Arizona 520-281-1533, fax: 520-281-2156
Danny, Saul, Gonzalo
Meyer Tomatoes: mature green, vine-ripe, roma, cherry, greenhouse
beefsteak tomatoes. Vegetables: Green bell peppers, greenhouse colored bells.
520-264-1111, 520-375-6524, 520-264-0011
John McDaniel, Raquel Mendivil, Steve Harsh
L&M Companies, Inc. Fruits and vegetables
Nogales, Arizona 520-281-0114
Prime Sales, Inc. Fruits and vegetables
Rio Rico, Arizona 520-281-1298, fax: 520-281-1055
Alonzo, Arnie, Ted, Neo
Prime Time Red yellow and green peppers
Nogales, Arizona 760-399-4166, fax: 760-399-4281
Performance Produce
Nogales, Arizona 520-281-0700, fax: 520-281-0600
Alberto Puchi, Rudy Leal, Danny Puchi, Jerry Tabarez
P.D.G. Produce Inc. Cucumbers, bell peppers, squash, tomatoes, cherry
tomatoes, peas, watermelons, cantaloupes, eggplant & honeydews
Nogales, Arizona 520-281-2607, fax: 520-281-4306, warehouse: 520-281-1009
Paul Guy, Max Allen, Enrique Heredia, Javier Esquivias
37
Omega Produce Co, Inc. Cucumbers, grapes, green bells, italian squash,
jalapenos, kabocha, red bells, romas, tomatoes, watermelons, yellow S/N, eggplant,
tomatillo, yellow bells, honeydews, perisan pickles
Nogales, Arizona 520-281-0410, warehouse: 520-281-1258
Nick Gotsis, Toru Fujiwara, Paul Bachelier, George Gotsis
Rene Produce Eggplant, cucumbers, tomatoes, roma tomatoes, bell
peppers, zuchini, green house bell peppers, green house tomatoes, european cucumbers,
slicer cucumbers & cluster tomatoes
Nogales, Arizona 520-281-9206, warehouse: 520-281-0806
Jorge Quintero, Jaime Hernandez, Paula Condes
Sigma Sales Distributing a full line of fruits and vegetables
Rio Rico, Arizona 520-281-1900, fax: 520-281-4468
Mike Smith, Sean Barton, Steven V. Schmitz, Lou Morello and Patsy Norzagaray
Nova Produce Field-grown tomatoes and mixed vegetables
Florida, Nogales, California 800-476-1141, 888-281-8988
Gary Budd, Victor Dimes, Lorie Lubyk, John Luciano, Alonzo Moya, Holly Primmer,
Jim Sparks
Sucasa Produce Cucumbers, eggplant, italian squash, yellow squash,
bell peppers, roma tomatoes, chilis, tomatoes, watermelon, beans, pickles
Old Tucson Rd. 520-281-1409, fax: 520-281-9467
Rob Soto, Chris King, Billy Donnelly
Seacoast Distributing, Inc. Full line of fruits & vegetables
Dana Point, California 949-496-3302, fax: 949-496-9514
Vic Rodriguez, Vince Towles, Joe La Mesa, Brent Batali, Marianne Hamburger-Ridsdale
38
Sunny Valley Organics Greenhouse tomatoes, two-layer tomatoes, roma
tomatoes, grape tomatoes, eggplant, greenhouse bell pepper, green beans, cucumbers,
zucchini, mini sweet peppers
520-281-2213, fax: 520-281-1399 Sunny, Miguel or Eduardo
Appalachian Produce Co., Inc.
Rio Rico, Arizona 520-281-1561, fax:520-281-4349
Bobby Hanan, Jim Huber, Linda Hanan
Big Chuy Distributors & Sons, Inc. Seeded & Seedless watermelon, winter
squash, mini watermelons, cucumbers and mixed vegetables
Nogales, Arizona 520-281-4909, fax: 520-281-4835
Jesus Lopez Jr., Mike Gerardo & Alex Lopez
Bay Area Produce Inc. Full line of fresh fruits & vegetables
San Jose California 408-395-1111
Leo Goscila, Hank Imwalle, Ken Sato, Bob Loyst, Jack Holliday, Mike D'Antonio,
Debbie Noyes, Steve Morris
Nogales, Arizona 520-761-1240
Rosie Favela Cornelius, Jerry Meek, Ruben Zuniga, Luis Gonzalez, Pat Leal
Grass Valley, California 530-271-7017 Larry Giacalone
Rancho Santa Fe, California 858-759-3489 Dan Kerrigan
San Clemente, California 949-498-5942 Dave Westendorf
Visalia, California 559-739-8747 Tony Taviano
Ciruli Bros Amex Distributing Co., Inc. Full line of Mexican fruits and vegetables
Nogales, Arizona Donna, Texas 520-281-9696, fax: 520-281-1473
Chuck Jr., Chris, Bert, Brian, Bernie, Ana, Susan, Steve, Maria, Hector

39
Crown Jewels Bell peppers, cucumbers, squash, eggplant, romas,
grape tomatoes, chilis, watermelon, honeydew & grapes
Nogales, Arizona 520-281-2325, fax: 520-281-2347
Butch, Luis & Tobbie
Fresno, California 559-438-2335, fax: 559-438-2341
Rob, Steve P., Randy, George, Russ, Steve H. & Atomic
Del Campo Vine-ripe, roma and grape tomatoes, red bell
peppers, eggplant, avocados, hydroponic beefsteak & cluster tomatoes, red, yellow &
orage bell peppers, european cucumbers.
Rio Rico, Arizona 520-281-4733, shipping: 520-281-4722
Jim Cathey, Hector Sanchez, Patricia Lopez, Tony Grieb, Martin Ley, Jose Flores,
Guillermo Brown
The Giumarra Companies Shipping watermelons, vegetables & tomatoes
Rio Rico, Arizona 520-281-1981, fax: 520-761-3889
John Corsaro, Nick Rendon, Ricardo Sanchez, Cesar Pacheco, Alan Durazo, Job
Villanueva
Arkansas Tomato Shippers Tomatoes, cucumbers, bell peppers, squash, beans,
mixed melons, hot peppers
Nogales, Arizona 888-706-2400
Bernardi & Associates, Inc. Tomatoes, mixed vegetables and melons
Nogales, Arizona 520-281-4011, fax: 520-281-2090
Al Bernardi, Joe Bernardi, Manny Gerardo, Joseph de la Ossa, Alex Leon, Lenny
Bracamonte, John Willis
San Diego, California 858-279-5075, fax: 858-279-5097
Turlock, California 209-669-3445, fax: 209-669-3746
Fort Myers, Florida 239-334-8230, fax: 239-334-6756
40
Damon Tomatoes, romas, cherries, cucumbers, squash,
eggplant, peppers, beans, oranges, chili peppers, cantaloupes, honeydews, watermelon
Los Angeles, California 520-761-3055, 520-281-1682, 213-694-2810
Michael Damon, Chris Damon, Ken Damon, Marcell Parra, Scott Melvin, Robert
Quihuis, Gustavo Andrade, Marco Serrano
Fresh Direct, Inc. Vine-ripe tomatoes & mixed vegetables
Nogales, Arizona 520-287-0754, fax: 520-287-0780
Jorge Ruiz, Jason Martin, Freddy Pacheco, Tony Morales & Jorge Saavedra
Grower's Pride, L.L.C. Third-party food safety certified facility with
customers tailored repack programs available. On-ground inspection, consolidation &
in/out service available
Rio Rico, Arizona 520-377-2740, fax: 520-377-2745
J. Harry Ram, Jaime Contreras
JMB Distributing, Inc. Specialize in top-quality green beans
Rio Rico, Arizona 520-281-9322, fax: 520-281-9352, warehouse: 520-980-5169
Calixtro Distributing, Inc. All melons, tomatoes and mix vegetables
Rio Rico, Arizona 520-281-3432, fax: 520-281-3438
Joe Calixtro, Richard Calixtro, Charlie Calixtro, Frank Calixtro, Bob Calixtro, Fernando
Huerta, Rene Rodriguez, Mickey Bachelier.
Covilli Brand Organics, Inc. Organic mixed vegetables and melons
Calexico, California 760-768-5440, fax: 760-768-5441 Alex Madrigal
Nogales, Arizona 520-377-2202, fax: 520-377-2984
Foodsource Bell peppers, tomatoes, cucumbers, squash, chilies
Nogales, Arizona 866-880-1952 Rod Sbragia

41
J. Michael & Co. Full line of fruits & vegetables from Mexico
760-634-6420, fax: 760-634-6424 Waynee Nakaji & Ed Espinoza
J.O.P. Distributing, Inc. All fruits and vegetables
Rio Rico, Arizona 520-281-9091, fax: 520-281-9194 Joe O. Puchi Jr.

42
Appendix B
Market Information for Leading U.S. and Canadian Metropolitan Areas

43

44
Appendix B. Market Information for Leading U.S. and Canadian Metropolitan Areas (Source: The Packer Newspaper)
City Date Highlights
New York
02/28/2005
1.8 million people live in the metropolitan area, which includes parts of New York, New Yersey and
Pennsylvania in 2000, according to the U.S. Census Bureau.
New York city has five boroughs with 18,000 restaurants, according to www.iloveny.com
2000 population for the metro area, 5.2 million
Market share City Store’s name
2002 2003
Wal-Mart 13.5% 19.9%
Tom Thumb 18.5% 17.7%
Albertsons 19.1% 16.9%
Kroger 14.9% 12.8%
Minyard 10.7% 9.9%
Brookshire 4.4% 4.1%
Dallas
Otro 9.0% 18.0%
Dallas-Fort
Worth
02/07/2005
Source: Shelby Report of the Southwest
2000 population for the metro area, 4.7 million
Market share City Store’s name
2002 2003
Kroger 29.4% 26.2%
Wal-Mart 10.0% 18.5%
Randall’s 14.5% 14.3%
HEB 14.1% 13.1%
Fiesta Mart 10.4% 8.9%
Lewis Food Town 2.5% 2.4%
Houston
Otro 19.0% 16.6%
Houston
02/07/2005
Source: Shelby Report of the Southwest

45
City Date Highlights
2000 population for the metro area, 1.7 million
Market share City Store’s name
2002 2003
HEB 72.4% 67.1%
Wal-Mart 9.2% 19.3%
Military 5.8% 3.9%
Bear County Mkts 4.1% 3.1%
Kmart, Target 2.0% 2.3%
Foodarama 1.5% 1.2%
San Antonio
Otro 5.1% 3.1%
San Antonio
02/07/2005
Source: Shelby Report of the Southwest
The market totals $11.6 billion.
The retail grocery market is divided as follows:
Store’s name 2004 market share 2004 # of stores Jun-Ago 06 Market
share
Ralphs 21.80% 150 20.40%
Vons 16.60% 111 15.59%
Albertsons 12.90% 87 11.76%
Food 4 Less 7.10% 8.00%
Smart & Final 4.40% 4.11%
Stater Bros. 3.60% 4.05%
Otro 33.80% 36.13%
Los Angeles
08/09/2004
Source: March 2004 Shelby Report
Toronto
03/07/2005
• Toronto is Canada’s largest retail market, representing $33 billion or 14% of total Canadian retail
sales.
• Toronto’s population is 2.5 million, making it Canada’s largest city.
• One quarter of Canada’s population lives within a 100-mile radius of Toronto.
• More than 100 languages and dialects are spoken in Toronto, and 43% of the population reported
themselves as a visible minority.
46
City Date Highlights
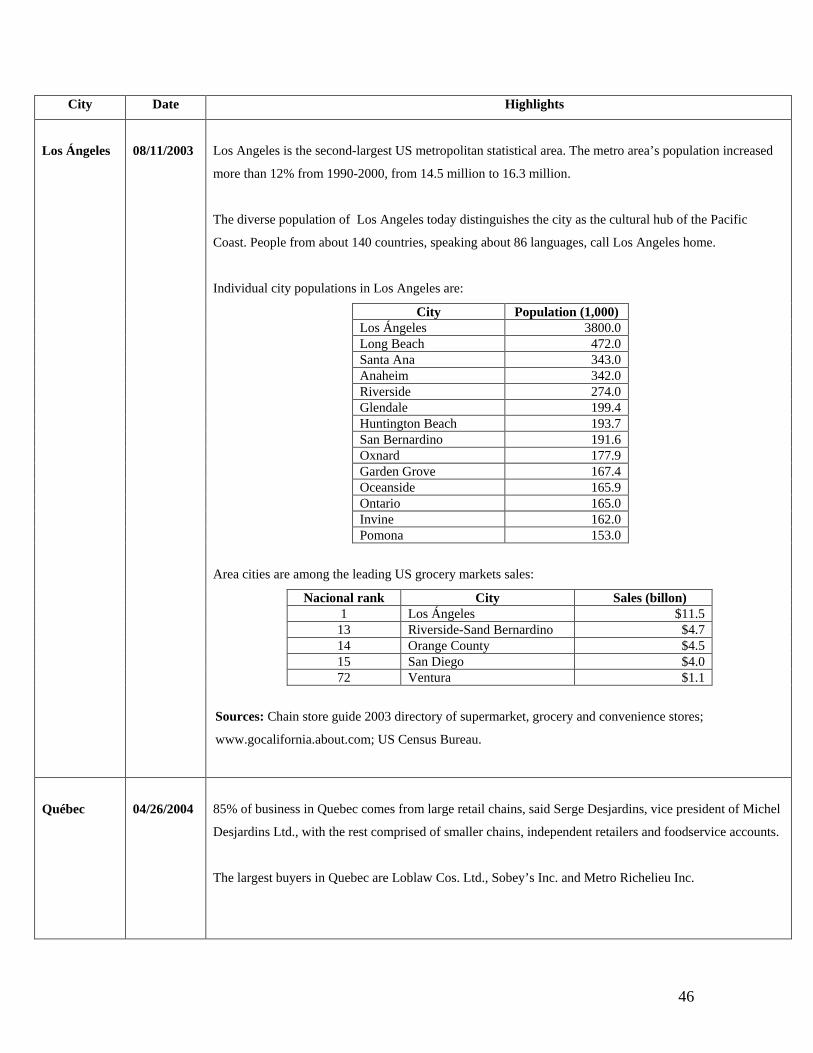
Los Angeles is the second-largest US metropolitan statistical area. The metro area’s population increased
more than 12% from 1990-2000, from 14.5 million to 16.3 million.
The diverse population of Los Angeles today distinguishes the city as the cultural hub of the Pacific
Coast. People from about 140 countries, speaking about 86 languages, call Los Angeles home.
Individual city populations in Los Angeles are:
City Population (1,000) Los Ángeles 3800.0 Long Beach 472.0 Santa Ana 343.0 Anaheim 342.0 Riverside 274.0 Glendale 199.4 Huntington Beach 193.7 San Bernardino 191.6 Oxnard 177.9 Garden Grove 167.4 Oceanside 165.9 Ontario 165.0 Invine 162.0
Pomona 153.0
Area cities are among the leading US grocery markets sales:
Nacional rank City Sales (billon) 1 Los Ángeles $11.5 13 Riverside-Sand Bernardino $4.7 14 Orange County $4.5 15 San Diego $4.0
72 Ventura $1.1
Los Ángeles
08/11/2003
Sources: Chain store guide 2003 directory of supermarket, grocery and convenience stores;
www.gocalifornia.about.com; US Census Bureau.
Québec
04/26/2004
85% of business in Quebec comes from large retail chains, said Serge Desjardins, vice president of Michel
Desjardins Ltd., with the rest comprised of smaller chains, independent retailers and foodservice accounts.
The largest buyers in Quebec are Loblaw Cos. Ltd., Sobey’s Inc. and Metro Richelieu Inc.
47
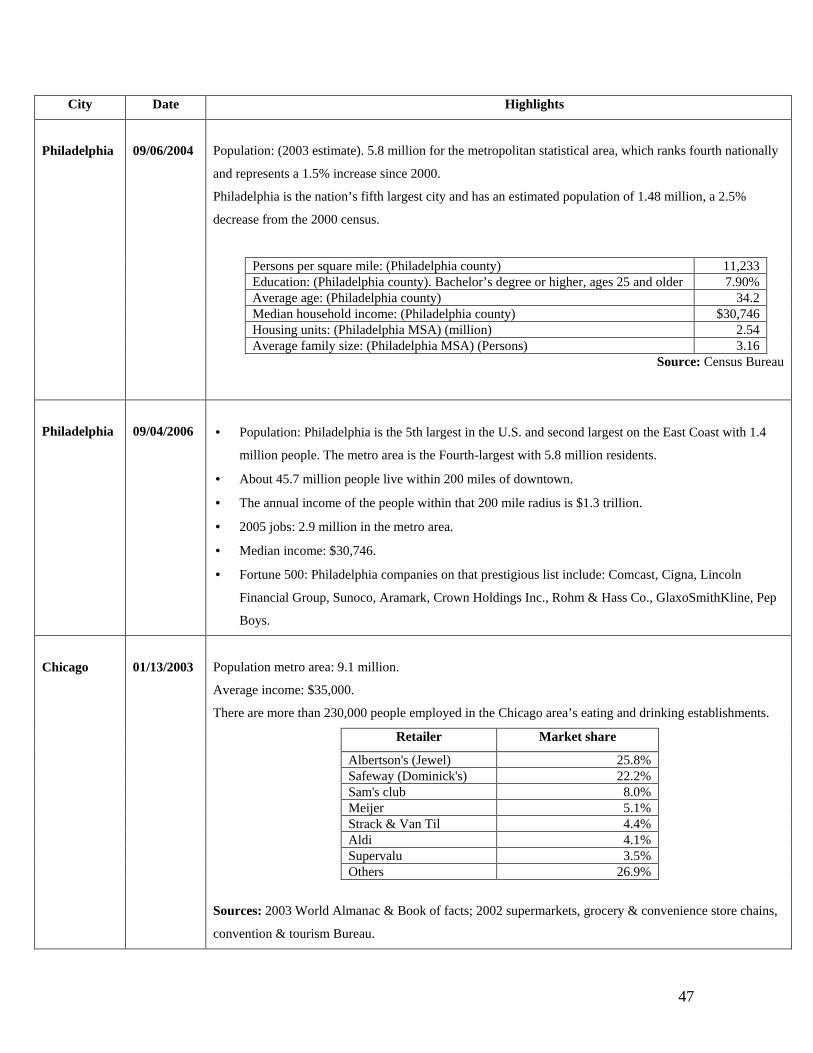
City Date Highlights
Population: (2003 estimate). 5.8 million for the metropolitan statistical area, which ranks fourth nationally
and represents a 1.5% increase since 2000.
Philadelphia is the nation’s fifth largest city and has an estimated population of 1.48 million, a 2.5%
decrease from the 2000 census.
Persons per square mile: (Philadelphia county) 11,233 Education: (Philadelphia county). Bachelor’s degree or higher, ages 25 and older 7.90% Average age: (Philadelphia county) 34.2 Median household income: (Philadelphia county) $30,746 Housing units: (Philadelphia MSA) (million) 2.54
Average family size: (Philadelphia MSA) (Persons) 3.16
Philadelphia
09/06/2004
Source: Census Bureau
Philadelphia
09/04/2006
• Population: Philadelphia is the 5th largest in the U.S. and second largest on the East Coast with 1.4
million people. The metro area is the Fourth-largest with 5.8 million residents.
• About 45.7 million people live within 200 miles of downtown.
• The annual income of the people within that 200 mile radius is $1.3 trillion.
• 2005 jobs: 2.9 million in the metro area.
• Median income: $30,746.
• Fortune 500: Philadelphia companies on that prestigious list include: Comcast, Cigna, Lincoln
Financial Group, Sunoco, Aramark, Crown Holdings Inc., Rohm & Hass Co., GlaxoSmithKline, Pep
Boys.
Population metro area: 9.1 million.
Average income: $35,000.
There are more than 230,000 people employed in the Chicago area’s eating and drinking establishments.
Retailer Market share
Albertson's (Jewel) 25.8% Safeway (Dominick's) 22.2% Sam's club 8.0% Meijer 5.1% Strack & Van Til 4.4% Aldi 4.1% Supervalu 3.5%
Others 26.9%
Chicago
01/13/2003
Sources: 2003 World Almanac & Book of facts; 2002 supermarkets, grocery & convenience store chains,
convention & tourism Bureau.

48
City Date Highlights
Population 1.8 million in the city; 3.4 million in the metropolitan area.
Households Two thirds of the city’s households live in rented homes, and the
rest own their homes.
There are mostly one-family households with a few multifamily
households, although there is a large nonfamily household
population as well.
Household income The average is $44,593 for the metropolitan area; $40,848 for the
city proper. The average single income is $20,000-$24,000
Immigrant population About 586,000 in the metropolitan area; 462,000 in the city
proper.
Labor force It includes 63% of those 15 and older in the metro area and about
60% in the city proper.
Age groups Largest age group is 25-44 followed by 45-64.
Montreal
07/01/2002
Source: www2.wille.montreal.qc.ca

49
Appendix C
Chain Store Purchasing Contacts in
Major Metropolitan Areas of the
Southwestern United States

50

51
Appendix C. Chain Store Purchasing Contacts in Major Metropolitan Areas of the
Southwestern United States
Arizona Bashas' Inc. Units: 155 22402 S Basha Rd, Chandler, AZ 85248 PO Box 488, Chandler, AZ 85244-0488 Tel #: 480 895-9350 Fax #: 480 895-5394 http://www.bashas.com Louie Macias - Specialist Floral, Produce; Clay Volz - Assistant Buyer Produce Safeway - Phoenix Division Units: 115 2750 S Priest St, Tempe, AZ 85282 Tel #: 480 894-4100 Fax #: 480 929-8006 Richard Miller - Director Dairy, Frozen Food, Grocery Albertsons Distribution Center Units: 91 400 S 99th Ave Ste 100, Tolleson, AZ 85353 Tel #: 602 382-5400 Fax #: 602 382-5430 Brian O'Connor - Manager Purchasing, Produce Fry's Food & Drug Stores of Arizona, Inc. Units: 115 500 S 99th Avem Tolleson, AZ 85353 PO Box 1043, Tolleson, AZ 85353-1043 Tel #: 623 936-2100 Fax #: 623 907-7165 http://www.frysfood.com Bill Wall - Director Floral, Produce California - Los Angeles Area Northgate Market, Inc. Units: 22 522 E Vermont Ave, Anaheim, CA 92805 Tel #: 714 778-3784 Fax #: 714 778-3295 http://www.northgatemarkets.com Lupillo Ramirez - Manager Ethnic Marketing; General Buyer

52
Vons Units: 307 618 Michillinda Ave, Arcadia, CA 91007 PO Box 513338, Los Angeles, CA 90051-1338 Tel #: 626 821-7000 Fax #: 626 821-7257 Rick Cruz - Buyer Produce Tawa Supermarkets, Inc. Units: 27 6281 Regio Ave, Buena Park, CA 90620 Tel #: 714 521-8899 Fax #: 714 670-7799 Chen Lee - VP Produce Smart & Final, Inc. Units: 252 600 Citadel Dr, City of Commerce, CA 90040 PO Box 512337, Los Angeles, CA 90051-0337 Tel #: 323 869-7500 Fax #: 323 869-7858 http://www.smartandfinal.com Kent Kuwata - Category Manager Produce Stater Bros. Holdings Units: 162 21700 Barton Rd, Colton, CA 92324 PO Box 150, Colton, CA 92324-0150 Tel #: 909 783-5000 Fax #: 909 783-9120 http://www.staterbros.com Roger Schroeder - VP Produce Division Ralphs Grocery Company Units: 425 1100 W Artesia Blvd, Compton, CA 90220 PO Box 54143, Los Angeles, CA 90054-0143 Tel #: 310 884-9000 Fax #: 310 884-2525 http://www.ralphs.com Dave Ackerman - VP Floral, Produce Albertsons - Southern California Division Units: 293 1421 Manhattan Ave, Fullerton, CA 92831 Tel #: 714 300-6000 Fax #: 714 300-6936 Steve Lawler - Director Produce
53
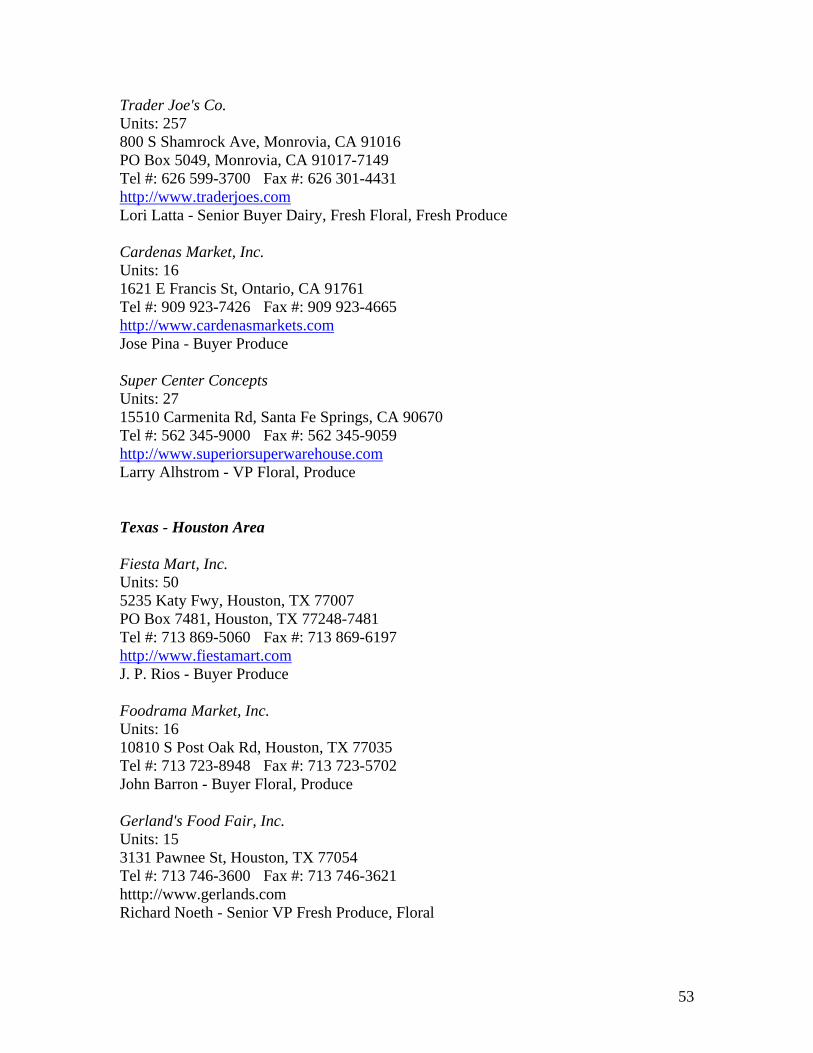
Trader Joe's Co. Units: 257 800 S Shamrock Ave, Monrovia, CA 91016 PO Box 5049, Monrovia, CA 91017-7149 Tel #: 626 599-3700 Fax #: 626 301-4431 http://www.traderjoes.com Lori Latta - Senior Buyer Dairy, Fresh Floral, Fresh Produce Cardenas Market, Inc. Units: 16 1621 E Francis St, Ontario, CA 91761 Tel #: 909 923-7426 Fax #: 909 923-4665 http://www.cardenasmarkets.com Jose Pina - Buyer Produce Super Center Concepts Units: 27 15510 Carmenita Rd, Santa Fe Springs, CA 90670 Tel #: 562 345-9000 Fax #: 562 345-9059 http://www.superiorsuperwarehouse.com Larry Alhstrom - VP Floral, Produce Texas - Houston Area Fiesta Mart, Inc. Units: 50 5235 Katy Fwy, Houston, TX 77007 PO Box 7481, Houston, TX 77248-7481 Tel #: 713 869-5060 Fax #: 713 869-6197 http://www.fiestamart.com J. P. Rios - Buyer Produce Foodrama Market, Inc. Units: 16 10810 S Post Oak Rd, Houston, TX 77035 Tel #: 713 723-8948 Fax #: 713 723-5702 John Barron - Buyer Floral, Produce Gerland's Food Fair, Inc. Units: 15 3131 Pawnee St, Houston, TX 77054 Tel #: 713 746-3600 Fax #: 713 746-3621 htttp://www.gerlands.com Richard Noeth - Senior VP Fresh Produce, Floral

54
Kroger - Southwest Marketing Area Units: 212 19245 David Memorial Dr, Conroe, TX 77385 Tel #: 713 507-4800 Fax #: 713 422-8027 Mike Krell - Merchandise Manager Floral, Produce La Michoacana Units: 75 888 W Sam Houston Pkwy S Ste 1 Suite 150, Houston, TX 77042 Tel #: 713 668-3869 Fax #: 713 668-3869 http://www.lamichoacanameatmarket.com Alvira Ortega - Treasurer; General Buyer Lewis Food Town, Inc. Units: 25 3316 S Shaver St, South Houston, TX 77587 PO Box 4410, Pasadena, TX 77502-0410 Tel #: 713 910-6767 Fax #: 713 910-7221 Jim Ward - VP Operation; Director Purchasing Randall's/ Tom Thumb Units: 116 3663 Briarpark Dr, Houston, TX 77042 PO Box 4506, Houston, TX 77210-4506 Tel #: 713 268-3500 Fax #: 713 268-3489 http://www.randalls.com http://www.tomthumb.com Gary Owen - Manager Operations, Grocery Sellers Bros., Inc. Units: 19 4580 S Wayside Dr, Houston, TX 77087 Tel #: 713 640-1611 Fax #: 713 640-1254 John L. Sellers - Buyer Produce Texas - Dallas/ Fort Worth Area Albertsons Distribution Center Units: 153 7550 Oak Grove Rd, Fort Worth, TX 76140 Tel #: 817 568-3700 Fax #: 817 568-3890 John Gilmore - Manager Purchasing, Produce
55
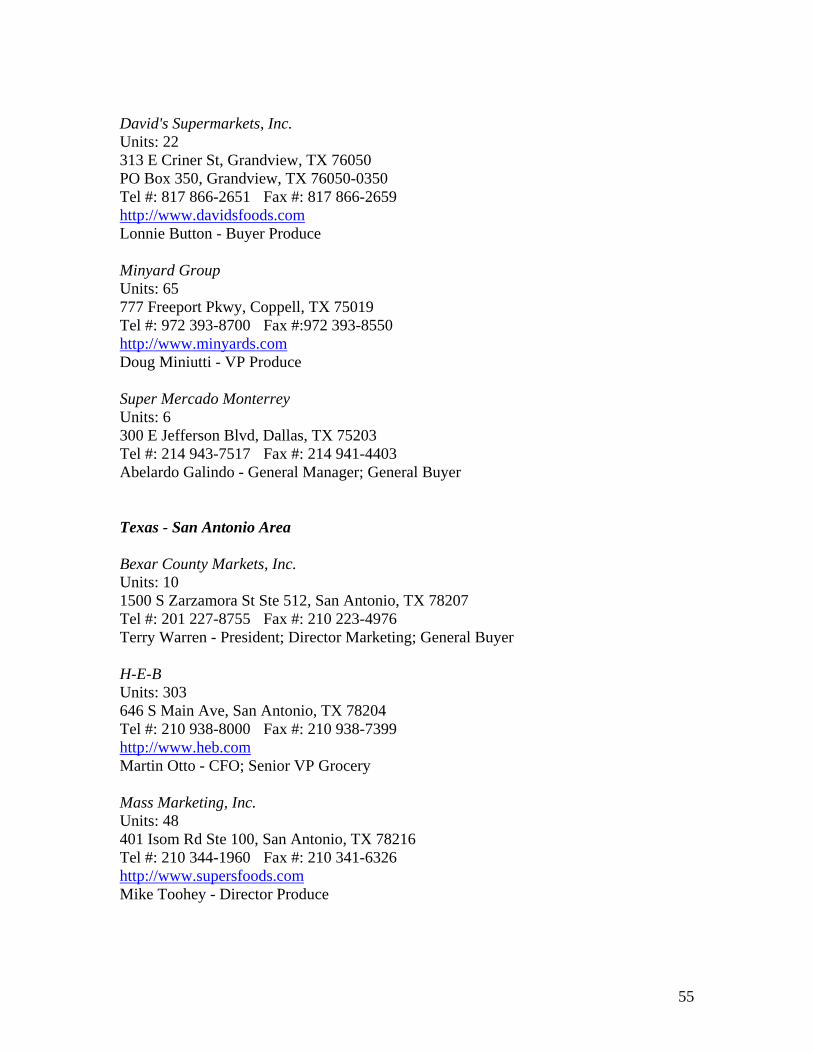
David's Supermarkets, Inc. Units: 22 313 E Criner St, Grandview, TX 76050 PO Box 350, Grandview, TX 76050-0350 Tel #: 817 866-2651 Fax #: 817 866-2659 http://www.davidsfoods.com Lonnie Button - Buyer Produce Minyard Group Units: 65 777 Freeport Pkwy, Coppell, TX 75019 Tel #: 972 393-8700 Fax #:972 393-8550 http://www.minyards.com Doug Miniutti - VP Produce Super Mercado Monterrey Units: 6 300 E Jefferson Blvd, Dallas, TX 75203 Tel #: 214 943-7517 Fax #: 214 941-4403 Abelardo Galindo - General Manager; General Buyer Texas - San Antonio Area Bexar County Markets, Inc. Units: 10 1500 S Zarzamora St Ste 512, San Antonio, TX 78207 Tel #: 201 227-8755 Fax #: 210 223-4976 Terry Warren - President; Director Marketing; General Buyer H-E-B Units: 303 646 S Main Ave, San Antonio, TX 78204 Tel #: 210 938-8000 Fax #: 210 938-7399 http://www.heb.com Martin Otto - CFO; Senior VP Grocery Mass Marketing, Inc. Units: 48 401 Isom Rd Ste 100, San Antonio, TX 78216 Tel #: 210 344-1960 Fax #: 210 341-6326 http://www.supersfoods.com Mike Toohey - Director Produce
56
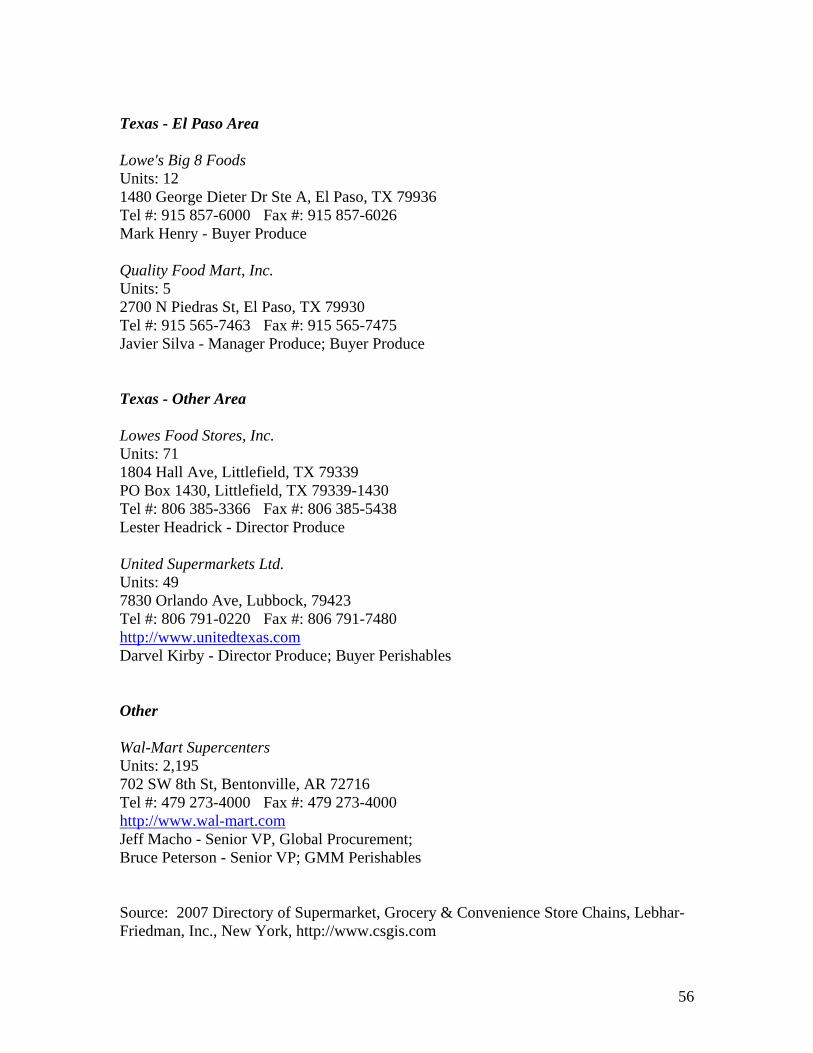
Texas - El Paso Area Lowe's Big 8 Foods Units: 12 1480 George Dieter Dr Ste A, El Paso, TX 79936 Tel #: 915 857-6000 Fax #: 915 857-6026 Mark Henry - Buyer Produce Quality Food Mart, Inc. Units: 5 2700 N Piedras St, El Paso, TX 79930 Tel #: 915 565-7463 Fax #: 915 565-7475 Javier Silva - Manager Produce; Buyer Produce Texas - Other Area Lowes Food Stores, Inc. Units: 71 1804 Hall Ave, Littlefield, TX 79339 PO Box 1430, Littlefield, TX 79339-1430 Tel #: 806 385-3366 Fax #: 806 385-5438 Lester Headrick - Director Produce United Supermarkets Ltd. Units: 49 7830 Orlando Ave, Lubbock, 79423 Tel #: 806 791-0220 Fax #: 806 791-7480 http://www.unitedtexas.com Darvel Kirby - Director Produce; Buyer Perishables Other Wal-Mart Supercenters Units: 2,195 702 SW 8th St, Bentonville, AR 72716 Tel #: 479 273-4000 Fax #: 479 273-4000 http://www.wal-mart.com Jeff Macho - Senior VP, Global Procurement; Bruce Peterson - Senior VP; GMM Perishables Source: 2007 Directory of Supermarket, Grocery & Convenience Store Chains, Lebhar-Friedman, Inc., New York, http://www.csgis.com
Top Related