


Languages
Pages
Legal


The Most Profitable Oil Company in the World

Or is it????
Who is ExxonMobil?
• World’s largest publicly traded petroleum and natural gas company
• Industry leader in almost all aspects of energy and petrochemical business
• Involved in exploration, production, and transportation of its products:– Crude Oil– Natural Gas– Petroleum
• Operate on six continents under the brand names Exxon, Esso and Mobil

What does ExxonMobil do?
• Upstream– Exploration and Production
• Holdings in 36 countries
• Downstream – Manufacturing, transportation and distribution
• 38 refineries in 21 countries• In 2007, refinery throughput averaged 5.6 million
barrels per day, and petroleum product sales were 7.1 million barrels per day

What does ExxonMobil do?
• Chemical– Petrochemicals
• More than 90 % of chemical capacity is employed in businesses where we ExxonMobil ranks first or second in worldwide market position.
• Technology– Innovation
• $3.5 billion spent over last 5 years on research• Focus on maximizing performance in remote
areas/difficult operating environments
Current Factors affecting the ExxonMobil and the Oil Industry
• Volatility
• Market uncertainty
• Rising costs
• Skill shortages
Current Factors affecting ExxonMobil and the Oil Industry:
• Volatility
• Market uncertainty
• Rising costs
• Skill shortages

Current Factors affecting ExxonMobil and the Oil Industry:
• Biofuels
• Energy allocation
• Environmental issues
• Global Energy Demand
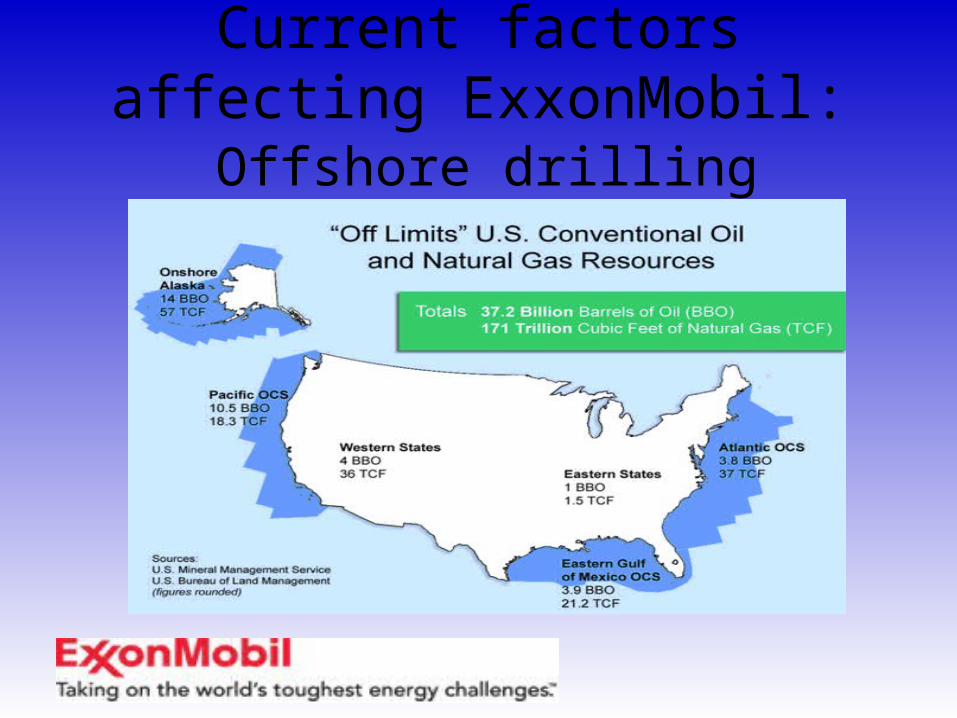
Current factors affecting ExxonMobil:
Offshore drilling
Current factors affecting ExxonMobil:
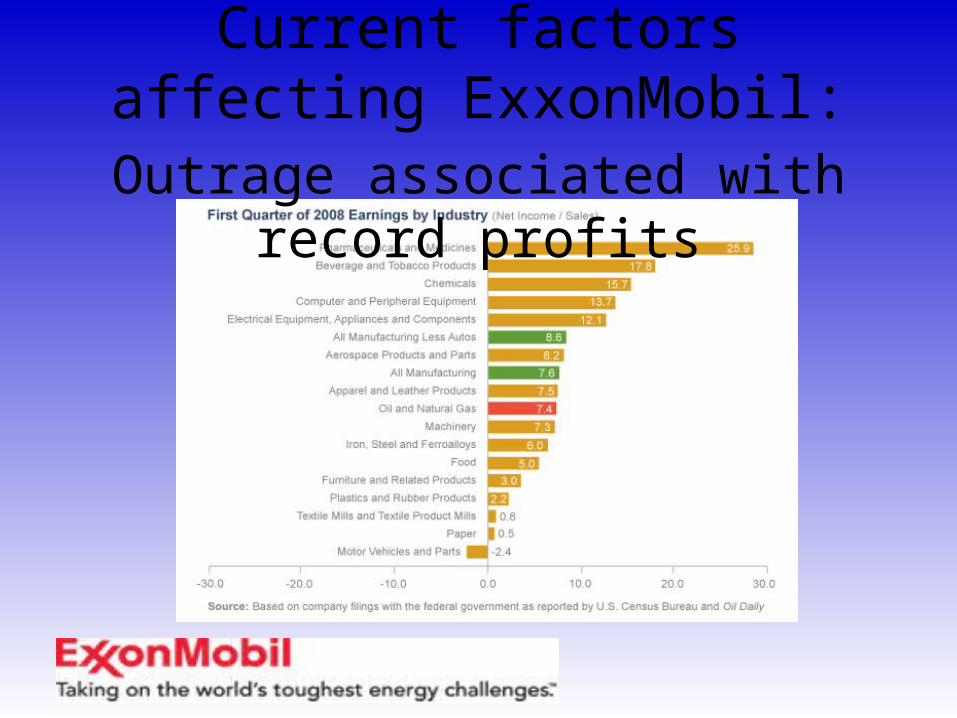
Outrage associated with record profits

Current factors affecting ExxonMobil:
Windfall Profit Tax
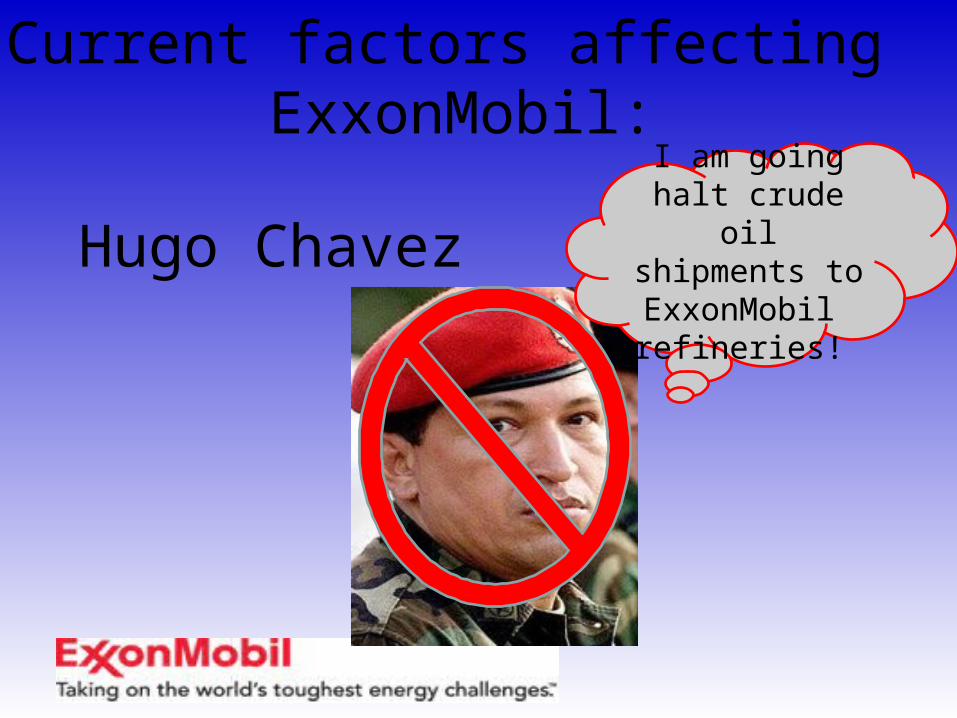
Hugo ChavezI am going halt
crude oil shipments to ExxonMobil refineries!
Current factors affecting ExxonMobil:

Exxon Valdez Case
Current factors affecting ExxonMobil:


2007 Financial Performance
• Sales: $390.3 billion– 94.28% increase from 2002
• Gross Margin: 42.8% (Industry: 46.2%)
– 55.5% in 2002
• Operating Margin: 17.42% (Industry: 5.1%)
– 8.71% in 2002
• Net Profit: $40.6 billion– 254% increase since 2002

FYE 2007 Financial Ratios
• Dividend Yield: 1.60%– Industry Avg. of 1.60%
• Price / Earnings: 12.73– Industry Avg. of 13.5
• ROE: 33.35%– Industry Avg. of 28.7%
• Beta*: .95

Net Profit
*From the 2007 ExxonMobil Annual Report
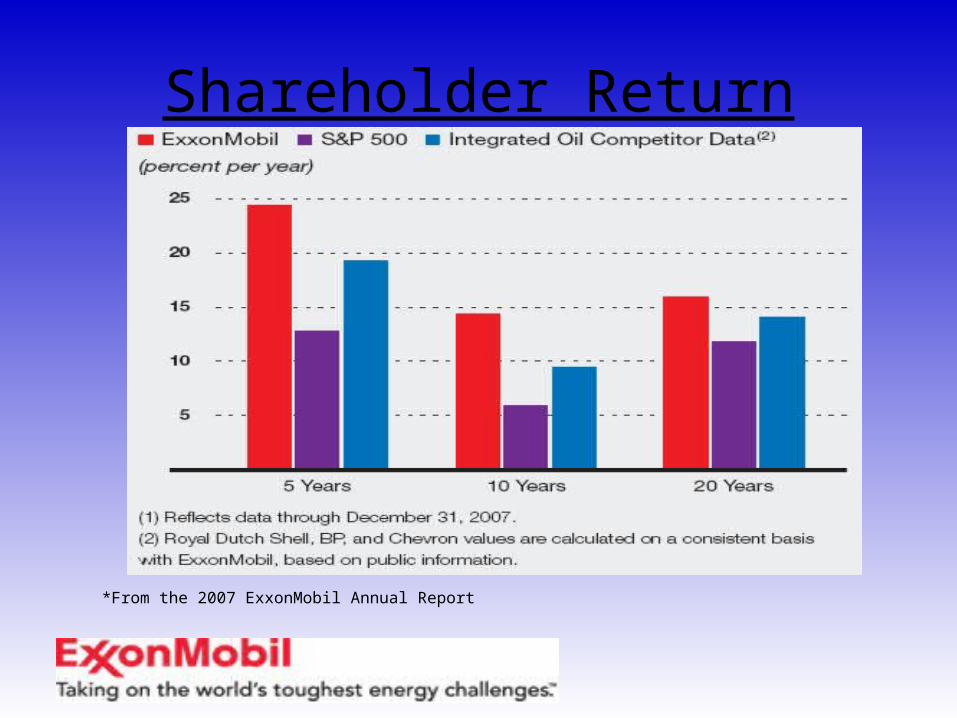
Shareholder Return
*From the 2007 ExxonMobil Annual Report
Future Financial Health
• Analysts expect the company to grow at a steady rate of 11% over the next five years– Hoovers, Goldman-Sachs, Merrill Lynch
• The earnings are expected to grow at 8%
• This will put the earnings per share over $9 a share in 2010
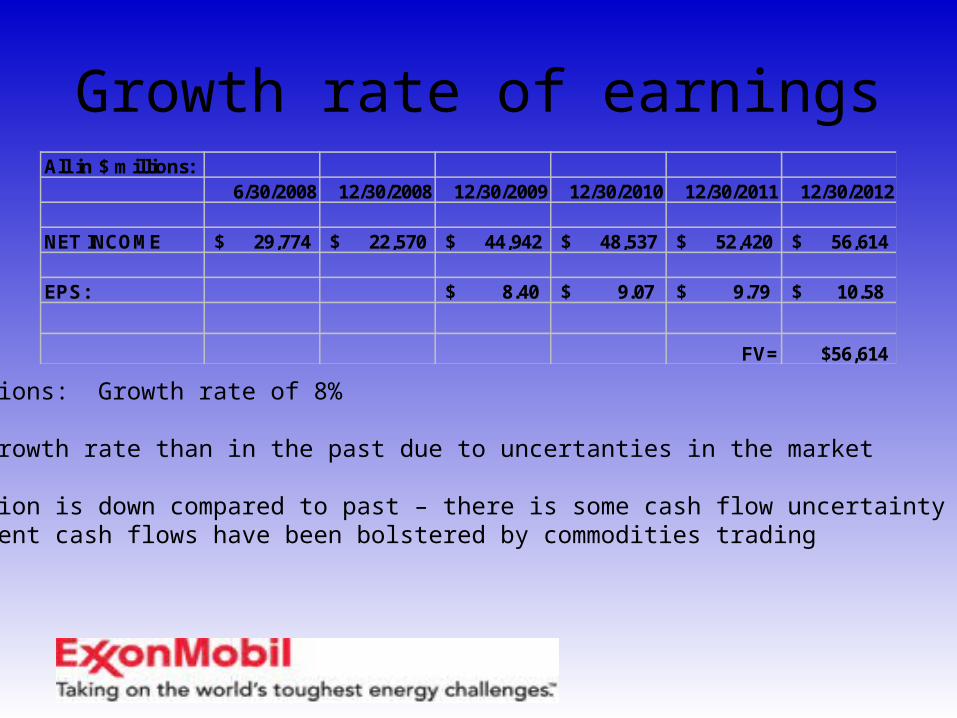
Growth rate of earningsAll in $ millions:
6/30/2008 12/30/2008 12/30/2009 12/30/2010 12/30/2011 12/30/2012
NET INCOME $ 29,774 $ 22,570 $ 44,942 48,537$ 52,420$ 56,614$
EPS: $ 8.40 $ 9.07 $ 9.79 $ 10.58
FV= $56,614
Assumptions: Growth rate of 8%
Lower growth rate than in the past due to uncertanties in the market
Production is down compared to past – there is some cash flow uncertainty since recent cash flows have been bolstered by commodities trading

Analysis
• This is a respectable growth
• However, not the immense growth that the company has recently had
• Future forces such as shareholder’s concern with the environment, political turmoil, and oil commodity pricing will effect Exxon
• This combined with forecast of the company will support investing at ‘weight’

Forecast
• Relaxed prices
• Decreased Domestic Demand (20%)
• Increased Global Demand (80%)
• Energy Information Association
Washington
• Windfall Profit Tax-Highly Unlikely
• Conservative vs. Liberal
• Off shore Drilling?
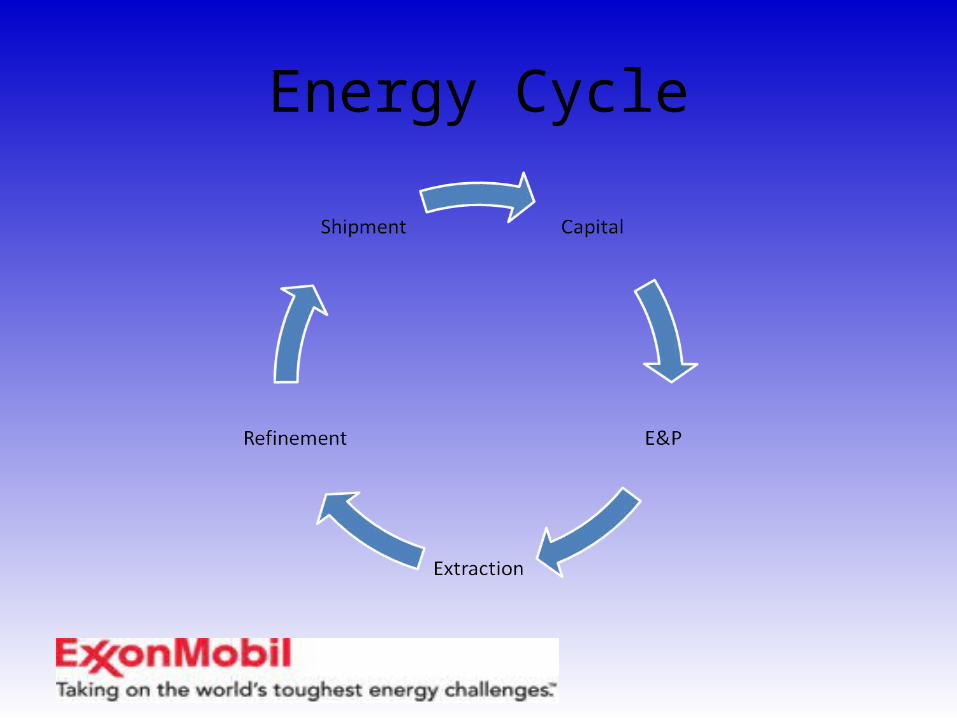
Energy Cycle
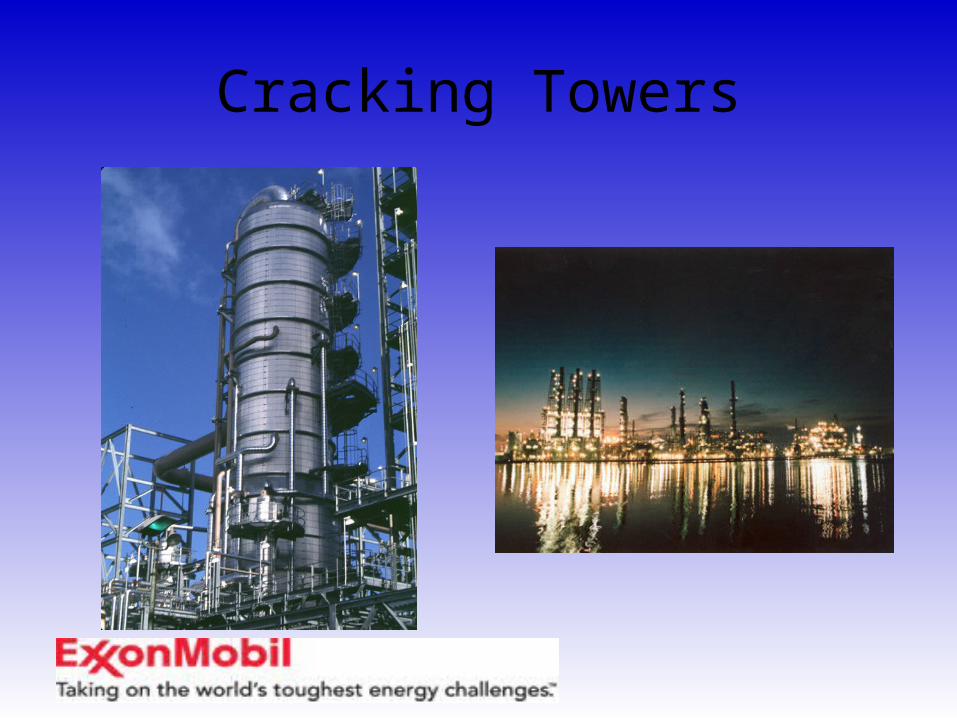
Cracking Towers

Hold At Weight
• Buy Vanguard VDE
• Production Life Cycle
• Cracking Spread
• Market Weighted
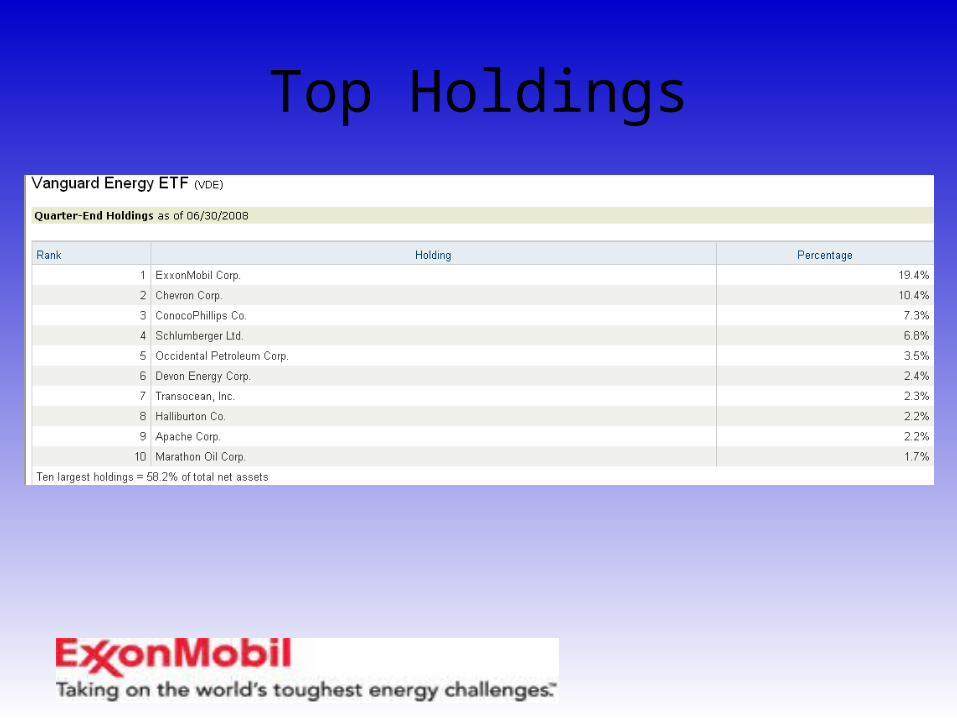
Top Holdings
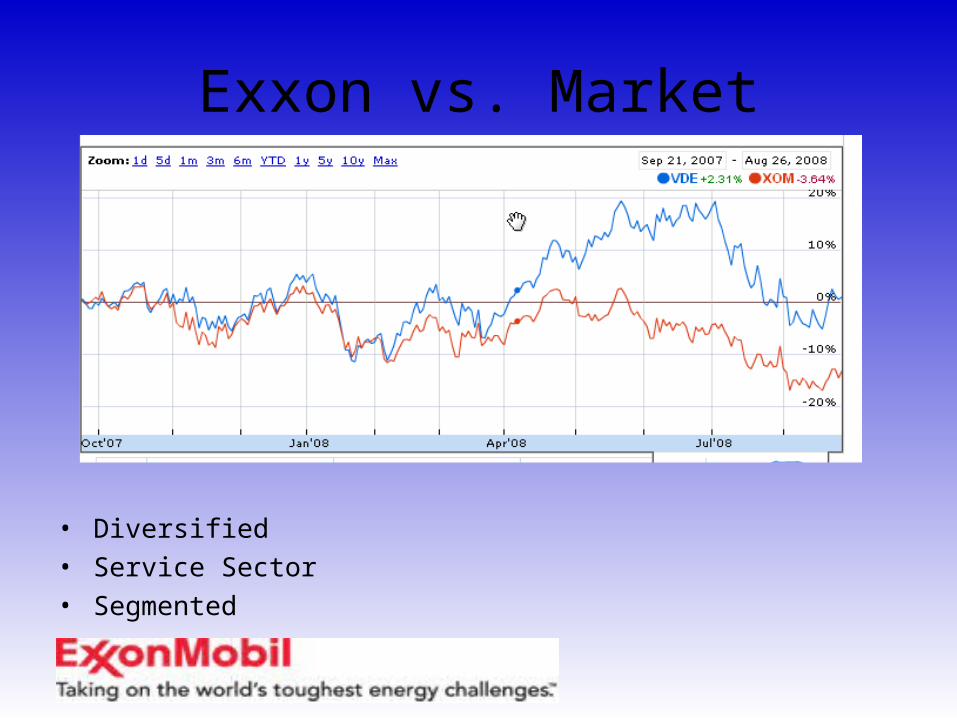
Exxon vs. Market
• Diversified• Service Sector• Segmented


Stock Re-Purchase
• Stakeholder Theory
• Board of Directors
• Myopic Management?
• Best Option?
• EPS Management
Top Related