


Languages
Pages
Legal


The Mechanical Behaviour of High-Performance Concrete
with Superabsorbent Polymers (SAP)
by
Babatunde James Olawuyi
Dissertation presented for the degree of
Doctor of Philosophy in Engineering
at Stellenbosch University
Promoter: Prof. William Peter Boshoff
Faculty of Engineering
March 2016

ii
Declaration
By submitting this dissertation electronically, I declare that the entirety of the work contained therein
is my own, original work, that I am the sole author thereof (save to the extent explicitly otherwise
stated), that reproduction and publication thereof by Stellenbosch University will not infringe any
third party rights and that I have not previously in its entirety or in part submitted it for obtaining any
qualification.
November, 2015
Copyright © 2016 Stellenbosch University
All rights reserved
Stellenbosch University https://scholar.sun.ac.za

iii
Abstract
High performance concrete (HPC) is known to be of low water-binder ratio (W/B) and exhibits high
strength, durability and elastic modulus amongst many other properties. HPC is susceptible to
autogenous-shrinkage-caused-cracking under restraints while previous research efforts directed at
mitigating autogenous-shrinkage in HPC by the introduction of IC agents have reported
superabsorbent polymers (SAP) to be the most promising. This study seeks to fill the existing gap on
proper understanding of the effect of SAP addition on the mechanical behaviour of HPC.
The work studied the mechanical properties of HPC containing SAP as internal curing agent (IC-
agent) using two grain sizes of SAP (˂ 300 µm and ˂ 600 µm) at varied SAP contents (0%; 0.2%;
0.3%; and 0.4% bwob) in four reference HPC mixtures (M1F, M1S, M2 and M3) after 7, 28, 56 and 90
days of curing in water. SAP absorption in cement pore solution (CPS) was determined using the tea-
bag test and the 25 g/g absorption in CPS obtained after 10 minutes of immersion was used for
provision of additional water in the HPC mixtures. Experimental works were carried to study the
impact of SAP addition on the rheology of the HPCs, as well as identify and establish the effect of
varying sizes and volume of SAP on rate of cement hydration and strength development. The work
involved quantifying and modelling the mechanical behaviour (strength in compression, tension,
elastic and fracture properties) of the low W/B (0.2 – 0.3) HPC (C55/67 – C100/115) with SAP.
Microstructure and molecular interaction of the internal constituent of the HPC were also investigated
using the X-ray computed tomography (CT) scanning and scanning electron microscopy (SEM).
The study observed a slight decrease in the compressive strength of HPC as SAP content increases but
there is no such effect on the elastic and fracture properties of the concrete. The 25 g/g SAP
absorption result of the teabag test over-estimates the actual amount of water used up by SAP in the
internal curing of HPC. The 3D void analysis of the HPC via CT scanning revealed that SAP created
voids in the HPC is only about half (i.e.12.5 g/g) of the teabag test result of 25 g/g and affirms that the
required additional water for SAP’s effective internal curing of the low W/B HPC is 12.5 g/g. The
Stellenbosch University https://scholar.sun.ac.za

iv
study concludes that the optimum additional water for SAP addition in the low W/B HPCs at no
negative effect on mechanical properties is 12.5 g/g.
Stellenbosch University https://scholar.sun.ac.za
v
Opsomming
Hoë verrigting beton (HVB) is bekend as ‘n beton met ‘n lae water/binder (w/b) verhouding en
vertoon ‘n hoë sterkte, duursaamheid en elastiteitsmodulus. HVB is egter geneig om krake te vorm
weens outogene krimp wanneer dit verhinder word om te krimp. Vorige werk het gewys dat die
gebruik van superabsorberende polimere (SAP) hierdie outogene krimp kan verminder as dit gebruik
word as ‘n interne kuur metode. Hierdie studie poog om die gebreke in die navorsing van HVB met
SAP te vul, naamlik die verstaan van die meganiese eienskappe van hierdie materiaal.
Hierdie werk het die meganiese eienskappe van HVB met SAP van twee groottes (< 300 μm en < 600
μm) ondersoek teen verskillende inhoude (0%; 0.2%, 0.3%, 0.4% bgvb) met drie verskillende meng
klasse (M1F, M1S, M2, M3) na 7, 28, 56 en 90 dae van kuur in water. Eksperimentele werk was
uitgevoer om die impak van SAP byvoeging op die reologie van die HVB, die effek van verskillende
groottes SAP, die volume van SAP op die hidrasie tempo en sterkte ontwikkeling te ondersoek. Die
werk het behels die kwantifisering en die modellering van die meganiese gedrag (sterkte in druk, trek
en die elastiese en fraktuur eienskappe) van lae W/B HVB (0.2 tot 0.3) (C55/67 tot C90/C105) wat
SAP bevat. Die mikrostruktuur en molekulêre interaksie van die interne bestanddele was ook
ondersoek met twee nie-destruktiewe toetsmetodes naamlik CT skandering en elektronmikroskopie.
Die studie wys ‘n minimale verlaging van die druksterkte van HVB indien die SAP inhoud
verhoog word, maar geen effek was opgemerk op die elastiese en fraktuur eienskappe van die beton
nie. Die 25 g/g SAP absorpsie kapasiteit bepaal deur die sogenaamde teesakkie-toets oorskat die
eintlike hoeveelheid water opgeneem deur SAP in HVB. Die 3D leemte bepaling d.m.v. die CT
skandering het getoon dat die leemtes veroorsaak deur die SAP is nader aan die helfte as verwag,
naamlik 12.5 g/g. Dit bevestig die addisionele water wat benodig word vir interne kuur met SAP is
eerder 12.5 g/g. Indien meer as 12.5 g/g water addisioneel bygevoeg word sal dit ‘n verlaging van die
druksterkte veroorsaak. Die optimale addisionele water byvoeging vir interne kuur doeleindes vir
HVB met SAP is dus 12.5 g/g.
Stellenbosch University https://scholar.sun.ac.za

vi
Acknowledgements
I acknowledge with profound gratitude my supervisor, Prof. W.P. Boshoff, for his guidance, and
immense contributions throughout the course of this study. Accepting me as research student was a
good gesture on itself, not to talk of working with a student that has no financial support for the
programme. I am indeed very grateful to you. I appreciate the Head of Department, Prof. G.P.A.G
Van Zijl, for his time spent in reading through and contributions made on my initial proposal towards
presentation for Senate’s approval when my Supervisor was un-avoidably on leave due to ill-health.
His concern and timely words of encouragement are indeed immeasurable.
I say thank you to the Management of the Department of Civil Engineering, Stellenbosch University
and the industry partners, the Pretoria Portland cement Company (PPC) for the Departmental Bursary
offered me for the 2014 and 2015 Sessions of the programme and the materials (CEM I 52.5 N and
Corex slag) provided for the laboratory work. Also of note is the supply of the superplasticiser
(Premia 310) by Chryso, silica fume (SF) by SiliconSmelters of the FerroAltantica group and fly ash
(FA) from AshResources.
I appreciate the support and assistance of the staff of the laboratory and workshop of the Civil
Engineering Department, University of Stellenbosch offered during the design and fabrication of the
Wedge Splitting test setup and the entire laboratory work. My special thanks also go to the following
people: Mr. Guillaume Jeanson (Construction Product Manager) SNF Floerger - ZAC de Milieux,
42163 ANDREZIEUX Cedex – FRANCE; Davy Penhard, FEI Visualisation Science Group; Dr.
Anton du Plessis and Stephan le Roux, CT Scanning Unit; Mrs. Madelaine Frazenburg and Dr.
Angelique Laurie, Electron Beam Unit; both of Central Analytical Facilities (CAF); and Mrs. Hanlie
Botha of Process Engineering Department, Stellenbosch University, South Africa for the assistance
received in materials procurement, use of facilities, softwares and time input in the analysis.
I am grateful to my employer, Department of Building, Federal University of Technology, Minna,
Nigeria, for releasing me on study fellowship in pursuit of a PhD degree at Stellenbosch University,
Stellenbosch University https://scholar.sun.ac.za

vii
South Africa. I also say thank you to TETFUND, Nigeria for the financial support received for my
Benchwork.
I seize this opportunity to acknowledge the grace of God upon the following people of God around me
here in Cape Town and Stellenbosch environment: Pastor Obiajulu Onyia and his Wife, Pastor Prince
Mathebula and his Wife, Pastor Shedrack Shu, Pastor Oyeleke Oyebamiji and everyone in the
Ministerial Team of the Winners Chapel International, Cape Town. Thank you all for giving me an
opportunity to serve the Lord in your midst. Worthy mentioning here is the family of Dr. Dominic
Bass, for making their car available for my use in meeting up with the demands of my Academic work
and God’s assignment. This investment will surely speak in your life and that of your children. I say
thank you to Pastor, Dr. Funlola Olojede for her prayers, support and privileged opportunity to learn
and minister in Bible Study with my special Brethren at Stellenbosch assembly (Desire of Nations) of
The Redeemed Christian Church of God. God bless you all.
To my first Family in Stellenbosch, Br. Femi Olaoye, Chidi Ofoegbu, my friend and brother, John
Babafemi Adewumi (Dcn., Bldr., Dr.), I say thanks you. God will strengthen the bound of love within
us. Special love and appreciation goes to my spiritual children in Cape Town (Samuel Asante,
Michell, Bukky, Vimbai, Debby, Success and Nonkululeko); Br. Smith, Emmanuel, Godspower, Sis.
Favour, Reezy and the Youth of Winners Chapel International, Cape Town; Br. Richards Kamutando,
Papa Vukile and the entire congregation of Winners Chapel International, Khayelitsha. It has been a
privilege and great opportunity to see you receive God’s word through me and work with it in Faith.
Your followership in Kingdom service is really amazing. The grace of God will be multiplied upon
you all.
I am grateful to all my Parents, Parents-in-law and siblings (maternal and in-love) for their love,
prayers and support. I say thank you to all my friends, colleagues, loved ones and all who contributed
in one way or the other who might not have been mentioned.
Finally, I am eternally grateful to God for my Wife, Stella Funmilayo and three children, Gladness,
Joyful and Glory for their love, good health, grace, sacrifices and fore-bearing during my over three
Stellenbosch University https://scholar.sun.ac.za

viii
years of stay in Stellenbosch. You were all strong, supportive and always gave me reasons to go all
the way. Dear, I am proud of you and will always love you. God bless and keep you all for me.
Stellenbosch University https://scholar.sun.ac.za

ix
Dedication
This dissertation is dedicated to the Almighty God and Father of our Lord Jesus Christ for grace,
inspiration and enablement enjoyed in the course of this study and my stay in South Africa. To him
alone is the glory forever (Amen).
Stellenbosch University https://scholar.sun.ac.za

x
Table of Contents
Declaration ........................................................................................................................................... ii
Abstract ................................................................................................................................................ iii
Opsomming ........................................................................................................................................... v
Acknowledgements ............................................................................................................................. vi
Dedication.............................................................................................................................................. ix
Table of Contents ................................................................................................................................... x
List of Figures ..................................................................................................................................... xvi
List of Tables ....................................................................................................................................... xxi
List of Symbols .................................................................................................................................. xxiv
List of Abbreviations ......................................................................................................................... xxvi
1 Introduction ..................................................................................................................................... 1
1.1 Statement of Research Problem .............................................................................................. 3
1.2 Aim and Objectives of the Study ............................................................................................ 5
1.3 Research Proposition .............................................................................................................. 6
1.4 Significance of Study .............................................................................................................. 6
Outline of the Dissertation .................................................................................................................. 7
2 HPC with SAP: Properties and Mechanical Behaviour ................................................................. 9
2.1 Concrete .................................................................................................................................. 9
2.2 High Performance Concrete .................................................................................................. 10
2.2.1 Application of HPC ....................................................................................................... 11
Stellenbosch University https://scholar.sun.ac.za

xi
2.2.2 Characteristics of HPC .................................................................................................. 14
2.2.3 Classes of HPC ............................................................................................................. 15
2.2.4 Materials for HPC ......................................................................................................... 16
2.3 Mix Design for HPC ............................................................................................................. 18
2.4 Superabsorbent Polymers ...................................................................................................... 23
2.4.1 Water Absorption and Desorption of SAP .................................................................... 24
2.4.2 Absorption in pore solution ........................................................................................... 25
2.4.3 Desorption in pore solution ........................................................................................... 29
2.5 Superabsorbent Polymer in Concrete .................................................................................... 31
2.5.1 Previous Studies on Superabsorbent Polymer in Concrete ........................................... 32
2.5.2 Effect of SAP on Workability of Concrete and Mortar ................................................ 32
2.5.3 Binder Hardening and Microstructure Development .................................................... 35
2.5.4 Effect of SAP on Concrete Shrinkage ........................................................................... 38
2.5.5 Effect of SAP on Mechanical Properties of Concrete ................................................... 46
2.6 Mechanical Behaviour of HPC ............................................................................................. 53
2.7 Existing Models on Mechanical Properties of HPC ............................................................. 55
2.7.1 Powers’ Model .............................................................................................................. 55
2.7.2 Bolomey’s Model .......................................................................................................... 59
2.7.3 Constitutive Relations of Mechanical Properties of Concrete ...................................... 61
2.8 The modified Wedge Splitting Test Setup for Fracture Energy ........................................... 66
2.9 Summary ............................................................................................................................... 67
3 Materials and Experimental Procedures........................................................................................ 69
Stellenbosch University https://scholar.sun.ac.za
xii
3.1 Materials ............................................................................................................................... 69
3.1.1 Superabsorbent Polymers .............................................................................................. 69
3.1.2 Binders .......................................................................................................................... 70
3.1.3 Aggregate ...................................................................................................................... 70
3.1.4 Water ............................................................................................................................. 71
3.1.5 Admixtures .................................................................................................................... 71
3.1.6 HPC Mixtures ............................................................................................................... 71
3.2 Experimental Procedures ...................................................................................................... 72
3.2.1 Preliminary Tests .......................................................................................................... 72
3.2.2 Concrete Production ...................................................................................................... 75
3.2.3 Early-age strength properties of HPC ........................................................................... 76
3.2.4 Mechanical Properties Tests ......................................................................................... 79
3.2.5 Non-destructive tests on HPC mixtures ........................................................................ 83
3.3 Characterisation of Constituent Materials ............................................................................. 87
3.3.1 Results ........................................................................................................................... 88
3.3.2 Inferences ...................................................................................................................... 94
3.4 Summary ............................................................................................................................... 95
4 Fresh and Early - Age Strength Properties of HPC with SAP ..................................................... 96
4.1 SAP Absorption and pH-value of CPS ................................................................................. 96
4.1.1 Results ........................................................................................................................... 96
4.1.2 Inferences ...................................................................................................................... 98
4.2 Fresh Properties of HPC Mixtures ........................................................................................ 98
Stellenbosch University https://scholar.sun.ac.za

xiii
4.2.1 Results of Tests on Fresh Properties ............................................................................. 99
4.2.2 Inferences .................................................................................................................... 101
4.3 Setting Times and Early-Age Strength Development ......................................................... 101
4.3.1 Results ......................................................................................................................... 102
4.3.2 Inferences .................................................................................................................... 111
4.4 Microstructure and Chemical Composition ........................................................................ 113
4.4.1 SEM images of the binders and SAP particles ............................................................ 113
4.4.2 Chemical composition of constituent materials and HPC mortar ............................... 120
4.5 Discussion ........................................................................................................................... 121
5 Mechanical Properties of HPC with SAP ................................................................................... 126
5.1 Compressive Strength of HPC with SAP ............................................................................ 126
5.1.1 Results ......................................................................................................................... 126
5.1.2 Discussion ................................................................................................................... 130
5.1.3 Curve – Fitting and Modelling .................................................................................... 137
5.2 Elastic Modulus .................................................................................................................. 141
5.2.1 Results ......................................................................................................................... 141
5.2.2 Discussion ................................................................................................................... 144
5.3 Splitting Tensile Strength and Fracture Energy .................................................................. 148
5.3.1 Results ......................................................................................................................... 148
5.3.2 Discussion ................................................................................................................... 152
5.4 Summary ............................................................................................................................. 158
6 Non Destructive Tests on HPC with SAP ................................................................................... 159
Stellenbosch University https://scholar.sun.ac.za
xiv
6.1 X-ray CT Scanning ............................................................................................................. 159
6.1.1 Influence of SAP Contents on Air Void Distribution ................................................. 165
6.1.2 Influence of W/B, Binder Type and Curing on Air Void Distribution ....................... 171
6.1.3 Inferences .................................................................................................................... 174
6.2 Scanning Electron Microscopy of HPC .............................................................................. 175
6.2.1 Micro-morphology and crystaline structure ................................................................ 175
6.2.2 Quantitative Analysis of HPCs and cement pastes ..................................................... 177
6.2.3 Cement Hydration Products ........................................................................................ 182
6.2.4 Inferences .................................................................................................................... 187
7 Conclusion and Recommendations ............................................................................................. 189
7.1 Fresh and Early–Age Strength Properties ........................................................................... 189
7.2 Mechanical Properties of HPC with SAP ........................................................................... 190
7.3 Non Destructive Tests on HPC with SAP ........................................................................... 190
7.4 Recommendation ................................................................................................................ 191
8 References ................................................................................................................................... 192
Appendix A: Attachments to Chapter Four ........................................................................................ 209
Table A1: for Specimen Designation of HPC Mixtures ................................................................. 209
Table A2: SAP Absorption ............................................................................................................. 210
Table A3: Setting Times and Strength Developments of HPC Mixtures ....................................... 210
Appendix B: Attachments to Chapter 5 .............................................................................................. 211
B1 Duncan Multiple Range Test Results for Early Age Properties ................................................ 211
B2 Influence of SAP addition Compressive Strength of HPCs ...................................................... 212
Stellenbosch University https://scholar.sun.ac.za

xv
B3 Duncan Multiple Range Test Results for E-modulus of HPC ................................................... 216
B4 Duncan Multiple range Test for Fracture Energy...................................................................... 217
Appendix C: SEM image analysis of HPCs ........................................................................................ 218
C1 Summary of SEM Quantitative Analysis for M2 – HPC Series ................................................ 218
Stellenbosch University https://scholar.sun.ac.za

xvi
List of Figures
Figure 2-1: Mix Design Process for HPC (Aītcin, 1998) ..................................................................... 22
Figure 2-2: SAP polymer network based on polyacrylic acid (courtesy of BASF) cited in RILEM
STAR TC 225 (Mechtcherine & Reinhardt, 2012) ............................................................................... 24
Figure 2-3: Schematic representation of water migration in cement-based systems, after Mönnig
(2009). ................................................................................................................................................... 25
Figure 2-4 : Compressive strength, 𝑓𝑐 of 50 mm cement-paste cubes as a function of relative
strength (𝑤𝑛𝑤 ), Low-alkali cement (Persson, 1996) ........................................................................... 57
Figure 2-5: Compressive strength vs. gel-space ratio for cement-sand mortars ................................... 58
Figure 2-6: Principle of wedge splitting test: (a) specimen on two linear supports, (b) LVDT on both
sides of the specimen, (c) steel holding devices with roller bearings, (d) transvers with wedges ........ 67
Figure 2-7: Modified wedge splitting test setup according to RILEM: AAC 13.1. (a) One single line
support at the end of the theoretical crack path. (b) Two line supports under the mass concentration
points under each half specimen ........................................................................................................... 67
Figure 3-1: ACV mould used as mortar and pestle for milling hardened HPC mortars ....................... 78
Figure 3-2: Compressive strength test setup ......................................................................................... 80
Figure 3-3: E-modulus test setup for HPC with SAP ........................................................................... 81
Figure 3-4: Test setup for wedge splitting test – (a) shows the plastic clip (LVDT holder) glued to
concrete specimen; (b) the groove (30mm x 20mm) and notch (20 mm deep); (c) the complete wedge
splitting setup and (d) the crack propagation on the cube specimen. .................................................... 82
Figure 3-5: 100 µm scan of HPC cylinder - (a) 3D visualisation and (b) thresholding applied to 2D
image ..................................................................................................................................................... 84
Stellenbosch University https://scholar.sun.ac.za
xvii
Figure 3-6: 3D Image of separated dry SAP particles with colour indicating sizes classification (a) and
(b) Centrally cropped CT image of dry SAP particles obtained from 3D VGI file .............................. 85
Figure 3-7: Plot of sieve analysis of available and blended fine aggregates......................................... 88
Figure 3-8: Particle size distribution of binders .................................................................................... 91
Figure 3-9: Particle of SAP obtained from X-ray CT Scanning ........................................................... 92
Figure 3-10: Snapshot of filtered central portion of VGI file of dry SAP particles (blue) under analysis
.............................................................................................................................................................. 93
Figure 4-1: Setting times (initial and final) plot of M2-HPC mixture ................................................. 102
Figure 4-2: Initial and Final setting times for M2-HPC mixtures made from binary cements ............ 103
Figure 4-3: Initial and Final setting times of M1S - HPC mixtures made from ternary cements ......... 104
Figure 4-4: Initial and Final setting times of HPC mixtures with SAP1............................................. 104
Figure 4-5: Degree of hydration of M2-HPC (binary cements) with SAP .......................................... 106
Figure 4-6: Degree of hydration of M1S-HPC (ternary cements) with SAP........................................ 106
Figure 4-7: Early-age strength development of control HPC mixes ................................................... 108
Figure 4-8: SP1 influence on early-age strength development of M2- HPC ........................................ 109
Figure 4-9: SP1 influence on early-age strength of M3-HPC .............................................................. 109
Figure 4-10: SP1 influence on early-age strength of M1F-HPC ........................................................... 110
Figure 4-11: SP1 influence on early-age strength of M1S-HPC ........................................................... 110
Figure 4-12: SP2 influence on early-age strength of M1S – HPC......................................................... 111
Figure 4-13: SEM image of microstructure of CEM I 52.5 N (a) 50 X and (b) 500 X magnifications
............................................................................................................................................................ 114
Figure 4-14: SEM image of microstructure of SF (a) 50 X and (b) 500 X magnifications ................ 115
Figure 4-15: SEM image of microstructure of CS (a) 50 X and (b) 500 X magnifications ................ 116
Stellenbosch University https://scholar.sun.ac.za

xviii
Figure 4-16: SEM image of FA (a) 50 X and (b) 500 X magnifications ............................................ 117
Figure 4-17: SEM image SAP particles (a) SP1 and (b) SP2 ............................................................... 118
Figure 4-18: Typical spectra image of SEM/WDS analysis of Binders (CEM I 52.5 N52.5 N) ........ 119
Figure 4-19: Fourier Infra-Red (FRIR) spectroscopy spectra of the binders (CEM I 52.5, SF, FA and
CS) ...................................................................................................................................................... 120
Figure 4-20: Early-age compressive strength of all HPC mixtures .................................................... 121
Figure 5-1: Compressive Strength of M2 - HPC (a) with SP1 and (b) with SP2 .................................. 128
Figure 5-2: Compressive Strength of M3 - HPC (a) with SP1 and (b) with SP2 .................................. 128
Figure 5-3: Compressive Strength of M1F – HPC (a) with SP1 and (b) with SP2 ................................ 129
Figure 5-4: Compressive Strength of M1S – HPC (a) with SP1 and (b) with SP2 ................................ 129
Figure 5-5: Influence of SAP contents on the density of HPC ........................................................... 130
Figure 5-6: Compressive strength of HPC versus binder type as influenced by curing age ............... 134
Figure 5-7: Compressive strength versus binder type as influenced by W/B ..................................... 134
Figure 5-8: Mean compressive strength of HPC against SAP contents .............................................. 135
Figure 5-9: Compressive strength of reference mixtures - HPCs on log time scale ........................... 136
Figure 5-10: Compressive strength of HPC – mortars cubes corrected for both air and SP2 voids .... 138
Figure 5-11: Compressive strength of HPC mortar cubes corrected for both air and SP1 voids ........ 139
Figure 5-12: Compressive strength against the gel / space ratio for HPC mortar cubes ..................... 140
Figure 5-13: E-modulus of binary cements HPC against curing age; (a) M2SP1 - HPC; (b) M2SP2 -
HPC; (c) M3SP1 - HPC and (d) M3SP2 - HPC. .................................................................................... 143
Figure 5-14: E-modulus of binary cements HPC against curing age; (a) M1FSP1-HPC; (b) M1FSP2-
HPC; (c) M1SSP1-HPC and (d) M1SSP2-HPC ...................................................................................... 143
Figure 5-15: Mean E-modulus of HPCs against curing age ............................................................... 144
Stellenbosch University https://scholar.sun.ac.za
xix
Figure 5-16: Mean E-modulus of HPCs (a) against SAP contents (b) against SAP type ................... 146
Figure 5-17: Mean E-modulus of HPCs (a) against binder type (b) against W/B .............................. 146
Figure 5-18: Typical plot of data extracted from Wedge Splitting Test for Wf and Gf Calculation ... 148
Figure 5-19: Fracture Energy (GF) of M1F – HPC ............................................................................... 151
Figure 5-20: Fracture Energy (GF) of M1S – HPC ............................................................................... 151
Figure 5-21: Fracture Energy (GF) of M2 – HPC ................................................................................ 151
Figure 5-22: Fracture Energy (GF) of M3 – HPC ................................................................................ 152
Figure 5-23: Mean Splitting Force (Fsp) against SAP content ............................................................ 154
Figure 5-24: Splitting Force (Fsp) vs. W/B as influenced by SAP type .............................................. 154
Figure 5-25: Fracture Energy vs. SAP contents as influenced by binder type .................................... 156
Figure 5-26: Compressive Strength vs. Fracture Energy as influenced by SAP contents .................. 157
Figure 5-27: Compressive Strength vs. Fracture Energy as influenced by W/B ................................ 157
Figure 6-1: Centrally cropped - 25 mm x 25 mm (air-threshold) HPC with air voids in blue colour 160
Figure 6-2: Histogram Plot of Air Void Distribution of (25 x 25 x 50 mm3) M1F – HPC Samples .... 161
Figure 6-3: Histogram Plot of Air Void Distribution of (25 x 25 x 50 mm3) M1S – HPC Samples .... 162
Figure 6-4: Histogram Plot of Air Void Distribution of (25 x 25 x 50 mm3) M2 – HPC Samples ..... 163
Figure 6-5: Histogram Plot of Air Void Distribution of (25 x 25 x 50 mm3) M3 – HPC Samples ..... 164
Figure 6-6: SAP void% against SAP content% (a) Sp1; (b) Sp2 ......................................................... 168
Figure 6-7: Cumulative SAP voids range vs curing age for M1F – HPC (a) SP1; (b) SP2 ................... 169
Figure 6-8: Cumulative SAP voids range vs curing age for M1S – HPC (a) SP1; (b) SP2 ................... 169
Figure 6-9: Cumulative SAP voids range vs curing age for M2 – HPC (a) SP1; (b) SP2 .................... 169
Figure 6-10: Cumulative SAP voids range vs curing age for M3 – HPC (a) SP1; (b) SP2 .................. 169
Stellenbosch University https://scholar.sun.ac.za

xx
Figure 6-11: Cumulative SAP voids range vs curing age for triplicate M2 – HPCs (a) Sp1; (b) Sp2 .. 171
Figure 6-12: Cumulative SAP voids range vs curing age (triplicates specimen) for (a) M3 (b) M1F .. 173
Figure 6-13: General morphology and crystalline structure of the HPCs (M1F as a sample).............. 176
Figure 6-14: Spectrum of Quantitative Analysis for Coarse Aggregates in M1F – HPC..................... 178
Figure 6-15: Typical SEM image of HPC paste portion (M2 as sample) ............................................ 180
Figure 6-16: Atomic ratio plot (Si/Ca vs Al/Ca) for M2 - HPC .......................................................... 184
Figure 6-17: Atomic ratio plot (S/Ca vs Al/Ca) for M2 - HPC ........................................................... 184
Figure 6-18: Si/Ca vs Al/Ca plots of calcium silicates phases in the three HPCs .............................. 186
Stellenbosch University https://scholar.sun.ac.za
xxi
List of Tables
Table 2-1: Strength classes for normal weight concrete according to BS EN 206-1:2001 and
classification according to fib Model Code 2010 (Dehn, 2012) ........................................................... 10
Table 2-2: Classification of HPC (Mehta & Monteiro, 2014) .............................................................. 15
Table 2-3: Effect of maximum aggregate size 𝑑𝑚𝑎𝑥 on base value of fracture energy 𝐺𝐹𝑂 (CEP FIP
MC 90) .................................................................................................................................................. 64
Table 2-4: Effect of type aggregates on the modulus of elasticity 𝐸𝑐𝑖 (fib MC 2010) ........................ 65
Table 2-5: Tangent modulus and elastic modulus of elasticity (fib MC 2010)..................................... 65
Table 3-1: Mix constituents of reference HPC mixtures ...................................................................... 72
Table 3-2: Summary of particle size distribution of available fine aggregates ..................................... 88
Table 3-3: Summary of particle size distribution and BET surface area .............................................. 91
Table 4-1: pH-values of CPS ................................................................................................................ 97
Table 4-2: Mix constituents and fresh properties of HPC mixtures from binary cements .................... 99
Table 4-3: Mix constituent and fresh properties of HPC mixtures from ternary cements .................... 99
Table 4-4: Influence of SAP and binder type on degree of hydration of HPC ................................... 107
Table 4-5: Oxides composition of the binders obtained through SEM/BSE ...................................... 119
Table 4-6: Test between Subject Effects ............................................................................................. 122
Table 4-7: Duncan's multiple range test (W/B effect on Early-age Compressive Strength) ............... 124
Table 4-8: Duncan's multiple range test (Binder type effect on Early-age Compressive Strength) ... 124
Table 4-9: Duncan's multiple range test (SAP contents effect on Early-age Compressive Strength). 124
Table 4-10: Duncan's multiple range test (SAP type effect on Early-age Compressive Strength) ..... 124
Table 4-11: Duncan's multiple range test (Curing Age effect on Early-age Compressive Strength) . 124
Stellenbosch University https://scholar.sun.ac.za
xxii
Table 5-1: Density of Binary cements - HPC with SAP ..................................................................... 127
Table 5-2: Density of Ternary cements - HPC with SAP ................................................................... 127
Table 5-3: Compressive Strength of Binary cements - HPC with SAP .............................................. 128
Table 5-4: Compressive Strength of Ternary cements – HPC with SAP............................................ 129
Table 5-5: Between Effect Test for Density ....................................................................................... 131
Table 5-6: Between Effect Test on Compressive Strength ................................................................. 133
Table 5-7: Summary of Trend Line (𝐴 + 𝐵log𝑡𝑑𝑡1) for Compressive Strength of HPCs with SAP . 136
Table 5-8: Correction factor for Reference HPCs............................................................................... 138
Table 5-9: E-modulus of Binary cements - HPC with SAP ................................................................ 142
Table 5-10: E-modulus of Ternary cements - HPC with SAP ............................................................ 142
Table 5-11: Between Test Effects on E-modulus ............................................................................... 147
Table 5-12: Summary of Fracture Energy Results for Ternary Cement HPCs ................................... 149
Table 5-13: Summary of Fracture Energy Results for Binary Cements HPCs ................................... 149
Table 5-14: Tests of Between-Subjects Effects for Splitting Force (Fsp) ................................... 153
Table 5-15: Tests of Between-Subjects Effects for Fracture Energy .................................................. 155
Table 6-1: Summary of Influence of SAP contents and curing age on void distribution for M1F – HPC
............................................................................................................................................................ 165
Table 6-2: Summary of Influence of SAP contents and curing age on void distribution for M1S – HPC
............................................................................................................................................................ 165
Table 6-3: Summary of Influence of SAP contents and curing age on void distribution for M2 – HPC
............................................................................................................................................................ 166
Table 6-4: Summary of Influence of SAP contents and curing age on void distribution for M3 – HPC
............................................................................................................................................................ 166
Stellenbosch University https://scholar.sun.ac.za

xxiii
Table 6-5: Summary of void distribution in triplicate HPC - M2 with both SAP types ...................... 170
Table 6-6: Summary of curing age influence and W/B on void distribution using triplicate specimens
............................................................................................................................................................ 173
Table 6-7: Quantitative Analysis of Typical concrete Polished Section (M1F as Sample).................. 177
Table 6-8: SEM Quantitative Analysis of Aggregates in M1F – HPCs by Weight% .......................... 179
Table 6-9: Quantitative Analysis of a Typical M2 – HPC SEM Image by Element Weight% ........... 181
Table 6-10: Summary of Quantitative Analysis of Spectrum B ......................................................... 185
Table 6-11: Summary of Quantitative Analysis of Spectrum D ......................................................... 185
Stellenbosch University https://scholar.sun.ac.za

xxiv
List of Symbols
𝑎 Actual air content (% relative to volume of concrete)
𝑎0 Reference air content
∝𝑐 Degree of hydration of binder
∝𝑚𝑎𝑥 Ultimate degree of hydration
𝑓𝑐,𝑐𝑢𝑏𝑒 Cube compressive strength (N/mm
2)
𝑓𝑐,𝑐𝑢𝑏𝑒28 28
th day cube compressive strength (also known as 𝑓𝑐28)
𝑓𝑐,𝑐𝑦𝑙 Cylinder compressive strength (N/mm
2)
Eci E-modulus (N/mm2) at concrete age of 28 days
𝐸𝑐𝑜 E-modulus value of 21.5 x 10³ N/mm
2
𝐺𝐹 Fracture energy (N/m)
𝐺𝐹𝑂 Base value of fracture energy (N/m)
𝐾𝐵𝑜𝑙𝑜𝑚𝑒𝑦 Material constant given by the Bolomey’s formula (A)
𝑅𝑐28 Compressive strength of standard mortar after 28 days of curing (N/mm2)
𝑉𝑚 Total surface area of the solid phases is related to the computed cement composition
𝑋𝑝𝑐 Gel-space ratio of the HPC mortar paste
𝑑𝑚𝑎𝑥 Maximum size of aggregate
𝑓𝑐 Characteristic strength obtained (also known as 𝑓𝑐𝑘 ) - (N/mm2)
𝑓𝑐𝑚 Mean cylinder compressive strength (N/mm2)
𝑓𝑐𝑟
Target strength at maturity (often 28 days) - (N/mm2)
𝑓𝑐𝑡.𝑓𝑙 Flexural tensile strength
Stellenbosch University https://scholar.sun.ac.za

xxv
𝑓𝑐𝑡.𝑠𝑝 Splitting tensile strength
𝑓𝑐𝑡𝑘 Characteristic tensile strength
𝑓𝑐𝑡𝑚 Mean value of tensile strength (N/mm2)
𝑣𝑐 Specific volume of anhydrous binder (i.e. binary or ternary)
𝑤𝑛 Non-evaporable water
𝜌𝑐 Relative density of the cementitious material
𝐵 Second material constants by Bolomey
𝜎 standard deviation
Stellenbosch University https://scholar.sun.ac.za
xxvi
List of Abbreviations
2D Two Dimensional
3D Three Dimensional
ACV Aggregate crushing value
BET Brunauer–Emmett–Teller
BSE Backscattered electron
bwoc by weight of cement
bwob by weight of binder
C&CI Cement and Concrete Institute of South Africa
CD crusher dust
CEM I cement type I
CMOD crack mouth opening displacement (mm)
COD crack opening development
CPS CPS
CS corex slag
C-S-H Calcium-silicate-hydrate
Cc Coefficient of gradation
Cu Coefficient of uniformity
D.O.E Department of Environment in United Kingdom
D10 Cumulative 10% passing
D50 Cumulative 50% passing
Stellenbosch University https://scholar.sun.ac.za

xxvii
D90 Cumulative 90% passing
EA Expansive additives
EDX Energy Dispersive X-ray
FA fly ash
FHWA Federal Highway Administration of United States Department of Transport
FM fineness modulus
Fsp splitting force (kN)
FTIR Fourier Transmission Infra-red Spectroscopy
GGBS ground granulated blast-furnace slag
HDC high-durability concrete
HES high early strength
HESC high-early strength concrete
HPC High performance concrete
HPM High performance mortar
HSC High strength concrete
HVFA high-volume fly ash concrete
IC-agent IC agent
LOI Loss on ignition
LVDT linear variable displacement transducers
LWA Lightweight aggregates
M1F 0.2 W/B HPC reference mix containing fly ash as additional cementitious material
M1S 0.2 W/B HPC reference mix containing corex slag as additional cementitious material
Stellenbosch University https://scholar.sun.ac.za

xxviii
M2 0.25 W/B HPC reference mix
M3 0.3 W/B HPC reference mix
mFabs SAP absorption in solution
MK metakaolin
mSAP, t swollen SAP after a time of immersion in a solution
mTBT, f mass of moist tea bag
N natural sand
NSC Normal strength concrete
OPC ordinary Portland cement
PCE Polycarboxylate Ether
pH power of hydrogen (it has a numeric value defined as a negative base 10 logarithm of
the molar concentration of hydrogen ions). This is a measure of acidity (< 7) and
alkalinity (> 7).
PPC Pretoria Portland cement
PR penetration resistance
PSD Particle size distribution
PVA polyvinyl acetates
PVC polyvinyl chloride
RH Relative humidity
RH7 factor Rate of hydration based on 7th day degree of hydration for reference mixtures
RPC reactive powder concrete
SAP Superabsorbent Polymers
SCC self-consolidating concrete
Stellenbosch University https://scholar.sun.ac.za
xxix
SCM Supplementary cementitious materials
SEM Scanning Electron Microscopy
SF silica fume
SFRHPC Self-compacting Fibre Reinforced High Performance Concrete
SHRP Stratgic Highway Research Program
SHRP Strategic Highway Research Programme
SN1 sieved natural sand type one (≥ 300 µm)
SN2 sieved natural sand type two (≥ 150 µm)
Sp1 SAP size I
Sp2 SAP size II
SPSS Statistical Package for Social Sciences
SRA Shrinkage reducing agent
STAR State-of-the-art-report
t1 early age at time of one day curing
td early age duration of curing after casting taken as greater than 1 and up to day 10
UHPC Ultra-high performance concrete
VES very early strength
VGI volume graphics image
VHS very high strength
W mixing water
We entrained water
W/B water: binder ratio
Stellenbosch University https://scholar.sun.ac.za

xxx
W/C water: cement ratio
WIC/C inter curing water: cement ratio
WDS Wavelength Dispersive Spectroscopy
Wf work of fracture
X-ray CT X-ray computed tomography
Stellenbosch University https://scholar.sun.ac.za
1
1
Introduction
Concrete is a versatile material for construction work and its production process requires adequate
mix proportioning, materials handling and curing for effective development of strength, durability and
other mechanical characteristics. In normal strength concrete (NSC) the curing methods of immersion
in water, sprinkling and other approaches as outlined in the codes of concrete practices (ACI, 308-01,
2008; BS EN 12390 - 2, 2009) suffices for prevention of moisture loss from the concrete surface.
High performance concrete (HPC) on the other hand is defined by ACI (1999) as concrete meeting
special combinations of performance and uniformity requirements that cannot always be achieved
routinely using conventional constituents and normal mixing, placing, and curing practice (ACI
THPC/TAC, 1999). It is a type of concrete specially designed to meet a combination of performance
and requirements which specifically includes high strength or high early strength, durability and high
elastic modulus (Kosmatka, et al., 2002; Neville, 2012). Its application includes precast pylons, piers
and girders of many long span bridges in the world; tunnels, tall and ultra-high buildings; shotcrete
repairs, poles, parking garages and agricultural applications (Kosmatka et al., 2002).
HPC is made with conventional materials as used in normal concrete, carefully selected high quality
ingredients and optimised mixtures involving high standard of production processes. It comprises very
high cement content and low water cement-cementitious materials (i.e. water/binder, W/B) ratio
which, according to Kosmatka et al., (2002), can be at a range of 0.20 to 0.45 while Aītcin (1998) and
Neville (2012) believe that HPC is a concrete with a W/B equal to or lower than 0.35.
HPC is performance oriented and often defined on the basis of specific requirements encountered for
a particular application, the most common being compressive strength. Although strength alone is not
the required characteristic, it is noted to be almost always of higher strength than normal concrete
(Kosmatka et al., 2002). On their part, Beushausen & Dehn (2009) state that the terminology of high-
Stellenbosch University https://scholar.sun.ac.za

2
strength concrete (HSC) is sometimes used for HPC. The meaning of high strength concrete based on
28 day compressive strength (𝑓𝑐,𝑐𝑢𝑏𝑒28) varies significantly over the years as pointed out by Neville
(2012). 𝑓𝑐,𝑐𝑢𝑏𝑒28 of 40 MPa was considered high at one time while 60 MPa became the minimum
benchmark later on. HSC generally can be considered HPC for certain applications. However,
Beushausen & Dehn, (2009) are of the view that high performance does not necessarily mean high
strength. Typical HPC, according to them, has compressive strength ranges of 60 to 130 MPa while
Kosmatka et al., (2002) places a threshold on strength requirement of HPC as 28 day cube strength
(𝑓𝑐,𝑐𝑢𝑏𝑒28) of 70 MPa and Neville (2012) thinks HPC has concrete with compressive strength in
excess of 80 MPa. South Africa envisaged the adoption of Eurocode 2: Design of concrete structures
(EC2 - (British Standard Institution, 2004)) which includes HSC up to 90 MPa cylinder strength / 105
MPa cube strength (C90/C105).
Issues of serious concern in HPC production are its workability and inadequate curing. The use of
superplasticiser has been identified by previous researches (Aītcin, 1998; Beushausen & Dehn, 2009;
Kosmatka et al., 2002; Neville, 2012) as enhancing good workability in HPC while effort is also being
intensified at achieving good internal curing (IC) in HPC as a means of improving the curing needs.
Schrofl, et al., (2012) stated that HSC/HPC is particularly susceptible to autogenous-shrinkage-
caused-cracking under restraints. Autogenous shrinkage is defined by Jensen, et al., (2010) as the
bulk deformation of a closed (sealed), isothermal, cementitious material system not subject to external
forces.
Conventional concrete curing methods are noted (ACI 363R-92; ACI, 308R-01, 2008) to be
insufficient for mitigating autogenous shrinkage in HPC, even with intensive wet curing applied.
Typical HPC has very dense microstructure even at an early age, which hinders the possibility of
sufficient rapid transportation of curing water into the interior of concrete members especially those
with relatively large dimensions. Hence the need for IC in HPC through the use of high water storing
materials as admixtures in concrete especially HPC, thereby supplying water to the surrounding
matrix soon as self-desiccation begins (Schrofl et al., 2012).
Stellenbosch University https://scholar.sun.ac.za

3
Researchers have introduced different materials as IC-agents in concrete with pre-soaked light weight
aggregates (LWA) and superabsorbent polymers (SAP) been the most acceptable (ACI (308-213)
R13, 2013; RILEM Rep 041 - Jensen and Lura (eds.), 2006).
The use of Super-absorbent polymers (SAP) as IC-agent has been adjudged to be effective for
mitigation of self-desiccation and autogenous shrinkage in concrete especially HPC/ ultra-high
performance concrete (UHPC) via its absorption and desorption of water internally as concrete
hydrates (Siriwatwechakul, et al., 2010).
The works of Jensen & Hansen (2001 & 2002), have generated increased research interests on
utilisation of SAP as concrete admixture thus leading to the establishment of the RILEM Technical
Committee (TC) 225-SAP “Application of Superabsorbent Polymers in Concrete Construction” in
2007. The State-of-the-Art Report (Mechtcherine & Reinhardt, 2012) prepared by this committee
summarised the available knowledge on SAP application in concrete and provided a basis for further
study.
1.1 Statement of Research Problem
Shrinkage deformation in normal concrete is well documented and understood in literature with less
work on autogenous shrinkage especially when drying is prevented by sealing or curing by immersion
in water. The emergence of HPC has brought to the fore the problem of autogenous shrinkage caused
by insufficient water for complete hydration (Braam et al., 2006; Schrofl et al., 2012).
HPC with low W/B ratio experience considerable chemical shrinkage and self-desiccation during
hydration resulting in high autogenous shrinkage deformation and hence early age cracks which can
adversely affect the durability of the concrete. Research efforts in the past two decades had thereby
been directed towards enhancing IC by introducing materials such as pre-soaked light weight fine
aggregates (LWA) and super-absorbent polymers (SAP).
SAP has been identified to be the most appropriate and promising material as IC-agent in concrete.
This is evident in the State-of-the-Art-Report (STAR) published by RILEM TC 225 which was
constituted in 2007. The STAR summarised all the available knowledge on SAP effectiveness as a
Stellenbosch University https://scholar.sun.ac.za
4
source of water for mitigating self-desiccation and autogenous shrinkage in concrete (Mechtcherine &
Reinhardt, 2012). The application of SAP in concrete was extensively discussed at various
conferences held by researchers in the field (Jensen et al., 2010; Kovler & Jensen, 2007;
Mechtcherine & Schroefl, 2014).
The views of the various researchers revealed that more research effort is required to provide better
understanding on the utilisation of SAP in concrete construction. Although the researchers
unanimously agreed that SAP addition is beneficial in the mitigation of autogenous shrinkage in
cement paste, mortar and concrete, several other issues are yet to be resolved, some of which include:
Level to which SAP addition prevents autogenous shrinkage
Side effects of SAP in concrete such as loss of strength, stiffness, inappropriate fresh
properties including workability, associated segregation and porosity
Determination of the optimum size and volume of SAP in cement paste, mortar and concrete
(especially HPC) and
An understanding of the micro-structure of the calcium-silicate-hydrate (C-S-H) and
intermolecular relations of the concrete constituent particles
To unravel the issues identified above, the research works of Hasholt et al., (2010a & b) are of
particular interest to this study and therefore considered a point of departure for this research. Their
studies investigated the mechanical properties of concrete with emphasis on the compressive strength
and elastic modulus using concrete specimens with W/B ratio ranges of 0.35 - 0.50 varying the
proportion of SAP ranging between 0% and 0.6% cured in water up to 28 days. The studies modelled
the effect of SAP on concrete strength and elastic modulus by combining Bolomey’s formula and
Powers’ model and observed that the net effect of SAP (negative or positive) depends on the mix
design and curing age. The research concluded that SAP has little effect on hydration and hence leads
to reduced strength when the W/B is high (> 0.45) especially at early ages and large SAP additions. It
was argued by Hasholt et al., (2010a) that concrete specimens with low W/B ratio and low SAP
addition exhibit compressive strength increase at later ages.
Stellenbosch University https://scholar.sun.ac.za
5
However, Hasholt et al., (2010b) further stated on the modulus of elasticity that there is need for care
on deduction with more empirical models despite their observations that the theoretical models for
mechanical properties work as well for concrete with SAP as for concrete without. This study
examines the effect of SAP on the mechanical properties of HPC specifically with W/B ratio range
0.2 – 0.3 having 28th day strength above 70 MPa (i.e. C55/67 – C100/115).
The trend of developments in concrete research as highlighted in the recent ACI convention is a call
for more coordinated research into cement hydration with the use of kinetics for an understanding of
life cycle performance of concrete (Kenter, 2012). The cohesive strength of concrete is believed to be
governed by the micro-molecular interaction of its constituents as influenced by the properties of the
hydration product calcium-silicate-hydrate (C-S-H) while this is said to determine the mechanical
behaviour of the cement paste and hence concrete (Masoero, et al., 2012). A study of the micro-
structure of HPC having SAP incorporated can thereby be seen as timely in understanding the effect
of SAP on its mechanical behaviour.
This study provides answers to the following pertinent questions:
What impact will the addition of SAP and its absorption capacity have on the rheology of the
HPC?
What effect will grain sizes and volume of SAP have on rate of hydration and long term
strength development?
How will the addition of SAP influence the mechanical behaviour (i.e. strength and stiffness
properties, micro-structure and molecular interaction) of HPC?
1.2 Aim and Objectives of the Study
This study aims at investigating the mechanical behaviour of HPC containing varying sizes and
volume of SAP with a view to evaluating the effect of the performed IC.
The specific objectives are to:
Stellenbosch University https://scholar.sun.ac.za
6
Examine the impact of SAP addition on the rheology of HPC containing varying sizes and
volume of SAP.
Identify and establish the effect of varying sizes of SAP and its volume on rate of hydration
and strength developments in HPC.
Quantify and model the mechanical behaviour (strength in compression, tension, fracture
energy and stiffness) at both short and long term for low W/B (0.2 – 0.30) HPC (C55/67 –
C100/115) with SAP.
Investigate the micro-structure and molecular interaction of the material constituent of HPC.
1.3 Research Proposition
This study proposes that size and volume of SAP in concrete (specifically HPC) have a direct
influence on the micro-structure and molecular interaction of the constituents materials and hence the
mechanical behaviour of HPC.
The sub-propositions are:
The fresh properties (i.e. workability, temperature and demoulded density) are altered by the
increase in particle size and volume of SAP added to HPC.
The higher the SAP particle size and volume added in HPC, the lower the strength and
elastic properties.
The existing Powers’ model can still be adopted for prediction of strength and elastic
properties of HPC with the SAP swelling rate simulated into it.
SAP inclusion in HPC has a significant effect on the micro-structure of the C-S-H of cement
paste and hence the hydration rate and strength development and mechanical behaviour of
HPC.
1.4 Significance of Study
There is a growing trend in the utilisation and adoption of HPC and UHPC in the construction
industry while these concrete types are known to be susceptible to self-desiccation and autogenous
Stellenbosch University https://scholar.sun.ac.za

7
shrinkage. Curing is therefore very important and the fact that the real site situation can hardly offer
effective curing by complete immersion in water to prevent drying in actual concrete elements calls
for an intensive study of the IC-agents being introduced in concrete. Any material for use as an IC-
agent ought to be of appropriate type and optimum proportion while its addition should not result in
any detrimental effect on the required properties of the concrete. The outcome of this study provides a
good basis for appropriate choice and efficient proportioning of SAP for use in high performance
concrete of low W/B (0.2 – 0.3) having minimum 28 day cube strength specification of 70 MPa. It
will offer a prediction on the behaviour of these concrete types at ages beyond the 28 day as required
for high-performance concrete according to the postulations of some authors (Beushausen & Dehn,
2009; Neville, 2012; Portland Cement Association, 2012).
This work intends to further enhance the utilisation of HPC for provision of improved ways of
handling constraints with long span bridges; cable stay bridges and more high rise and ultra-tall
buildings in `concrete works. This will be enabled by providing information on mechanical behaviour,
and guidelines towards sound design.
Outline of the Dissertation
This dissertation on “understanding the mechanical behaviour of high performance concrete with
superabsorbent polymer (SAP)” is presented in seven chapters. It begins with a comprehensive
introduction stating the motivation for the study, the research aim and objectives and the expected
contribution to the field of concrete in general.
A detailed review of existing literature on HPC and its application in construction coupled with
utilisation of SAP in concrete construction is presented in Chapter 2.
In Chapter 3, a description of the methods adopted for carrying out the experiments for an
understanding of the mechanical behaviour of these concrete types which have SAP incorporated as
IC-agent is reported. The test methods described includes those for physical properties of the
constituent materials (particle size distribution, specific surface area, chemical analysis for
determination of oxide contents, pH value determination of cement pore solutions (CPS) and the tea-
Stellenbosch University https://scholar.sun.ac.za
8
bag test for SAP swelling rate), fresh properties of the HPC mixtures (slump flow test, concrete
temperature, setting times of concrete, rate of hydration and early age strength development),
mechanical properties of hardened concrete (strength in compression, tension, fracture energy and
elastic modulus) and image analysis (Scanning electro-microscopy (SEM) - two dimensional and x-
ray computer tomography (x-ray CT) scanning –three dimensional) of the hardened HPC to study the
effect of SAP on the products of hydration, microstructure, air voids created and pore distribution.
Chapter 4 presents the results and discussion of the materials and fresh properties of the HPC
mixtures coupled with the effect of SAP on its hydration and early age strength development process.
In Chapter 5, the results of mechanical properties (compressive strength, elastic modulus, splitting
tensile and fracture energy tests) are presented with statistical software used to examine the data
generated for a discussion on the influence of SAP on the characteristics of the HPC. The several
dependent variables were regressed against the independent variables to assess which variable has
influence and to what level of significance on the concrete behaviour. They were thereby curve-fitted
into the Powers’ model for an inference of the effect of SAP on the HPC mixtures.
Chapter 6 reports on the image analysis tests (back scattered electron (BSE) image analysis via SEM
and 3D air void analysis via x-ray CT-scanner). This was used to explain the effect of SAP on the
change in the microstructural properties of the HPC and hence the reason for observed mechanical
behaviour as influenced by the SAP inclusion in the concrete type.
Finally, Chapter 7 highlights the conclusions of this study on the mechanical behaviour of HPC with
SAP as an IC-agent with recommendations made for practitioners based on the findings from this
study for utilisation of SAP as IC-agent in HPC with areas for future studies also enumerated.
Stellenbosch University https://scholar.sun.ac.za
9
2
HPC with SAP:
Properties and Mechanical Behaviour
This chapter presents a general review on concrete, HPC, properties of concrete at the fresh state and
performance requirements. A detailed discussion is presented on the mechanical properties of
concrete and intenal curing of concrete in general, and HPC in specific. The Chapter further touches
on a review of existing works on SAP’s influence on concrete (with emphasis on HPC) and
cementitious materials. Existing models on the mechanical behaviour of cement pastes, mortar and
HPC are also presented.
2.1 Concrete
Concrete is a composite construction material and is composed primarily of aggregates, cement and
water. Its production requires a good understanding of the basic processes of materials handling,
mixing, transporting and curing to achieve a ‘good concrete’. The requirements generally in the fresh
state are a consistent mix that can be compacted with available means; cohesive enough to be
transported and placed without segregation (Neville & Brooks, 2010; Neville, 2012).
The classification of concrete is often based on application type, performance requirements and
additional ingredients (i.e. admixtures) incorporated. In a broad classification based on 28-day
strength (𝑓𝑐,𝑐𝑢𝑏𝑒28) we can have; normal strength concrete (𝑓𝑐,𝑐𝑢𝑏𝑒28
≤ 50 MPa) and high performance
/ high strength concrete (𝑓𝑐,𝑐𝑢𝑏𝑒28 > 50MPa) (International Federation for Structural Concrete (fib),
2012) - fib Model Code 2010). This classification is further divided into low strength (𝑓𝑐,𝑐𝑢𝑏𝑒28 ≤ 20
MPa); moderate or normal strength (𝑓𝑐,𝑐𝑢𝑏𝑒28 = 20 to 50 MPa); high strength (𝑓𝑐,𝑐𝑢𝑏𝑒28 = 50 to 100
Stellenbosch University https://scholar.sun.ac.za

10
MPa); ultra high strength (𝑓𝑐,𝑐𝑢𝑏𝑒28 = 100 to 150 MPa) and Special (𝑓𝑐,𝑐𝑢𝑏𝑒28 > 150 MPa) (Mehta &
Monteiro, 2014; Neville & Brooks, 2010; Neville, 2012). Concrete can also be classified on the basis
of density (fib Model Code 2010) as lightweight aggregate concrete (800 – 2000 kg/m3), normal
weight concrete (>2000 – 2600 kg/m3) and heavy weight concrete (> 2600 kg/m
3). Table 2.1 extracted
from the work of Dehn (2012) present strength classes of normal weight concretes according to BS
EN 206-1: 2001 (reviewed 2013) and fib Model Code 2010.
Table 2-1: Strength classes for normal weight concrete according to BS EN 206-1:2001 and classification
according to fib Model Code 2010 (Dehn, 2012)
Concrete type Strength class 𝑓𝑐𝑘,𝑐𝑦𝑙/𝑓𝑐𝑘,𝑐𝑢𝑏𝑒
Low strength
concrete C8/10 C12/15 C16/20
Normal strength
concrete C20/25 C25/30 C30/37 C35/45 C40/50 C45/55 C50/60
High strength
concrete C55/67 C60/75 C70/85 C80/95 C90/105 C100/115
Ultra-high strength
concrete* C110/130, C120/140
*not included in BS EN 206-1:2001
Another basis for classification of concrete as offered in literature (Aītcin, 1998; Kosmatka et al.,
2002; Neville, 2012) is the water/binder (W/B) ratio as concrete with W/B below 0.40 behaves
differently from normal strength concrete (NSC). The discussion in this section centres on high
performance concrete.
2.2 High Performance Concrete
HPC is a generic term for all concrete exhibiting properties and constructability which exceeds that of
NSC (Kosmatka et al., 2002). This is a type of concrete specially designed to meet combinations of
performance and requirements which specifically include high workability, high strength, high early
strength; durability and high modulus of elasticity amongst other properties (Aītcin, 1998; Malhotra,
1994; Mehta & Monteiro, 2014; Neville, 2012). It is alternatively referred to as “speciality concrete”,
HSC and is often defined according to the specific property for which performance requirement is
placed in its design (Beushausen & Dehn, 2009; Mehta & Monteiro, 2014; Portland Cement
Association, 2012) .
Stellenbosch University https://scholar.sun.ac.za

11
The American Concrete Institute (ACI THPC/TAC, 1999) defines HPC as “a concrete meeting
special combination of performance and uniformity requirements that cannot be achieved routinely
using conventional constituents and normal mixing, placing and curing practices”.
Mehta & Monteiro (2014) present a definition of HPC on basis of basic requirements of HPC in
Strategic Highway Research Programme (SHRP) in the United States of America as follows:
HPC is a concrete that has been designed to be more durable and if necessary, stronger than
conventional concrete.
HPC mixtures are essentially composed of the same materials as conventional concrete
mixtures, but the proportions are designed or engineered to provide the strength and durability
needed for structural and environmental requirements of the project.
2.2.1 Application of HPC
Application of HPC as observed in literature (Aītcin, 1998; Schrofl et al., 2012) came into the
limelight about three decades ago with the Water Tower Place, built in 1970 in Chicago, Illinois, USA
(adopting 60 MPa concrete with lingosulfonate based water reducers), as the first building structure
made with HPC (Aītcin, 1998). HPC use is now adopted extensively for the fabrication of precast
pylons, piers and girders of many long span bridges in the world (Mehta & Monteiro, 2014). HPC has
been primarily used in tunnels, bridges, and tall buildings for its strength, durability, and high
modulus of elasticity. The use now includes shotcrete repair, poles, parking garages, and agricultural
applications.
Some known structures (with dates) which adopted HPC as found in Aītcin (1998) are outlined below:
Water Tower Place built in 1970 in Chicago, Illinois, USA. This involved concrete of
𝑓𝑐,𝑐𝑢𝑏𝑒28 = 60 MPa having a lingosulfonate based water reducer added.
Norway’s Gullfaks offshore platform built in 1981. It is made of concrete with average
𝑓𝑐,𝑐𝑢𝑏𝑒28 = 79 MPa and a slump of 240 mm in the fresh state.
Stellenbosch University https://scholar.sun.ac.za

12
Sylans and Glacières viaduct built in France in 1986. This utilised concrete of 𝑓𝑐,𝑐𝑢𝑏𝑒28=
60 MPa and 50 MPa at different portions of the structures as against the initial design strength
of 40 MPa.
Scotia Plaza, built in 1988 in Toronto, Canada, made of concrete with average tested strength
of 93.6 MPa at the 91 days.
Île de Ré bridge, built in 1988 in France. The girders of the bridge was designed for 40 MPa
target strength and built with concrete of 𝑓𝑐,𝑐𝑢𝑏𝑒28 = 59.5 MPa; this was chosen due to the
need for 20 MPa compressive strength at 10 to 12 hrs age to enhance stripping off box girders
formwork.
Two Union Square, built in 1988 in Seattle, Washington, USA. Constructed with a concrete
having a W/C of 0.22, utilising naphthalene based super-plasticizer; outstanding aggregates
of 10 mm maximum size and coarse graded sand of 2.80 fineness modulus; its 𝑓𝑐,𝑐𝑢𝑏𝑒28 =
131 MPa.
Joigny bridge, built in 1989 in France. The concrete used for construction of the bridge deck
had tested compressive strengths of 3 days = 26.2 MPa; 7 days = 53.6 MPa; 28 days =
78.0 MPa. The design was actually for 𝑓𝑐,𝑐𝑢𝑏𝑒28 = 60 MPa against the usual 35 – 40 MPa.
Montée St-Rémi bridge built near Montreal, Canada in 1993. The bridge has two continuous
40 m spans made of HPC with 𝑓𝑐,𝑐𝑢𝑏𝑒28 of 60 MPa.
The ‘Pont de Normandie’ bridge, completed in 1993. This was the longest cable-stay bridge
in the world when it was built having an overall length of 2141 m and a centre span of 856 m.
It has approximately 35, 000 m3 of HPC of 𝑓𝑐,𝑐𝑢𝑏𝑒28 = 60 MPa used for construction of the
pylons and cantilever beams.
Hibernia offshore platform, completed in Newfoundland, Canada in1996. It was built with a
‘modified normal weight’ HPC having W/B ratio of 0.31 for the splash zone and 0.33 for the
submerged zone for a design 𝑓𝑐,𝑐𝑢𝑏𝑒28 of 69 MPa. The design constraints included unit mass
of between 2200 and 2250 kg/ m3 for buoyancy and meeting an elastic modulus ≥ of 32 GPa.
Stellenbosch University https://scholar.sun.ac.za

13
Confederation Bridge completed between Prince Edward Island and New Brunswick in
Canada in 1997. It consists of 44 main spans of 250 m length each and massive main pier
shaft and foundation elements fabricated on land. The approach pier foundation and some
mass concrete sections, requiring control of thermal cracking, were built with Class C
(𝑓𝑐,𝑐𝑢𝑏𝑒28 = 30 MPa and 𝑓𝑐,𝑐𝑢𝑏𝑒90 = 40 MPa) concrete which contained cement partially
replaced with approximately 32% fly ash (FA) in addition to 7.5% silica fume (SF) by weight
of cement content. The Class A concrete in this work had 𝑓𝑐,𝑐𝑢𝑏𝑒28 = 55 MPa and a maximum
of 1000 coulombs chloride permeability at 28 days. Some piers with an abrasion resistance
shield were built with 𝑓𝑐,𝑐𝑢𝑏𝑒28 = 80 MPa concrete (Mehta & Monteiro, 2014).
Many structures adopting HPC in particular variants are either ongoing or recently completed all over
the world. Some worth of mention in this work are:
Burj Khalifa Towers in Dubai, United Arab Emirates. The 829.84 m high, World tallest
building, completed in October, 2009 had its foundation made of a high density, low
permeability concrete while ice was added to the mixing water to combat the excessively
high temperature (about 50 o C) of the environment.
Abraj Al-bait Towers (formerly Makkah Clock Royal Towers), Saudi Arabia completed in
2012 is now the World’s second tallest building (601 m tall). It is made of similar concrete as
those used in Burj Khalifa.
The Moses Mabhida Stadium in Durban, South Africa is a structure on the continent which
must enter this list. The main bowl of the stadium comprises of 1750 columns and 216 raking
beams while the façade has 100 columns of varied heights; the highest being with 46 m.
One World Trade Centre in New York City is another example of utilisation of HPC in
recent times. The tower height and slenderness imposed stringent demand on the overall
strength and stiffness of the structure. HSC of C95/105 and E-modulus of 48 GPa specified
are the dual requirements (Rahimian & Eilon, 2012).
Stellenbosch University https://scholar.sun.ac.za
14
The demands of concrete structures as in the projects mentioned above will continually make a case
for the utilisation of HPC with specifics in design requirements for strength, durability, low
permeability and special concepts and approach in materials handling, mixing, transporting and curing
to meet the job demands.
2.2.2 Characteristics of HPC
HPC comprise of a very high cement content and low W/B placed in the range of 0.20 to 0.45
(Kosmatka et al., 2002). Aītcin (1998) and Neville (2012) placed the W/B as equal to or lower than
0.35. Its compressive strength is usually greater than NSC even though the alternative use of HSC for
HPC is not totally correct, high compressive strength value is also a characteristic of HPC (typical
compressive strength values of HPC ranges between 55 MPa and 115 MPa). The benchmark of
𝑓𝑐,𝑐𝑢𝑏𝑒28 to be adopted in this study shall be 70 MPa minimum as specified in recent literature (Aītcin,
1998; Beushausen & Dehn, 2009; EC 2, 2004; Mehta & Monteiro, 2014; Neville, 2012).
The characteristics of HPC considered critical for particular application in practice often differ but
may range within the following properties as outlined in literature (Aītcin, 1998; Beushausen & Dehn,
2009; Kosmatka et al., 2002; Mehta & Monteiro, 2014; Neville, 2012):
high workability
high-early strength
high-strength
high-elastic modulus
high-durability and long life in severe environments
Low permeability and diffusion
Resistance to chemical attack
High resistance to frost and deicer scaling damage
Toughness and impact resistance
Volume stability
Ease of placement
Stellenbosch University https://scholar.sun.ac.za

15
Compaction without segregation
Inhibition of bacterial and mold growth
2.2.3 Classes of HPC
The SHRP in USA has four types of HPC for highway structures on basis of minimum strength,
maximum W/B and minimum durability criteria (Mehta & Monteiro, 2014). This classification of
SHRP with their requirement is as presented in Table 2.2.
Table 2-2: Classification of HPC (Mehta & Monteiro, 2014)
HPC Type Minimum Strength
Criteria
Water/Binder
(W/B) Ratio
Minimum Durability
Factor for Cycles of
Freezing and Thawing
Very Early Strength (VES) 14 MPa in 6 hours ≤ 0.4 80%
High Early Strength (HES) 34 MPa in 24 hours ≤ 0.36 80%
Very High Strength (VHS) 69 MPa in 28 days ≤ 0.35 80%
Fibre Reinforced HES + (steel or PVA) ≤ 0.35 80%
Mehta & Monteiro (2014) had an additional class of HPC called high-volume FA concrete (HVFA)
said to be more durable and resource efficient than those made with conventional Portland – cement
material. The HVFA is said to comprise of FA content above 50 percent of the cementitious material
as component of blended cement.
Portland Cement Association (2012) also presents five classifications of HPC as high-early strength
concrete (HESC); high-strength concrete (HSC); high-durability concrete (HDC); self-consolidating
concrete (SCC) and reactive powder concrete (RPC).
The five classes of HPC given by Aītcin (1998) are based on 25 MPa strength increments derived
from a combination of experience and the present state-of-the-state-art in practice. These are Class I
(50 MPa); Class II (75 MPa); Class III (100 MPa); Class IV (125 MPa) and Class V (150 MPa). The
focus of this study shall be high early strength to very high strength concrete types of FHWA (2012)
same as Class II – IV of Aītcin (1998).
Stellenbosch University https://scholar.sun.ac.za

16
2.2.4 Materials for HPC
HPC being concrete of low W/B (specifically ≤ 0.4) is prone to autogenous shrinkage (also called
self-desiccation or chemical shrinkage) which can occur when cement hydrates. According to Aītcin,
(1998), a 0.38 W/B concrete is not much stronger nor exhibits much better performance than 0.42. If
the W/B deviates significantly from the 0.40 value, the compressive strength, microstructure and
overall performance of HPC differs significantly from that of the NSC (Aītcin, 1998). At this stage it
becomes difficult, if not impossible to achieve a workable and place-able concrete without
introduction of superplasticisers. The lower the W/B, the stickier the concrete and the more difficult
the handling, mixing and transportation becomes. The concrete becomes so dense and impermeable
that even with wet curing by immersion, the internal regions hardly get enough water for complete
hydration hence the need for internal curing.
Chemical admixtures (i.e. superplasticisers, accelerators, retarders and air-entraining agents) and
supplimentary cementitious materials (SCM) application in HPC has been noted in literature (Aītcin,
1998; Beushausen & Dehn, 2009; Mehta & Monteiro, 2014; Neville, 2012) to be a way of controlling
the workability and placeability. Common SCM in use for HPC includes silica fume (SF), fly ash
(FA), ground granulated blast-furnace slag (GGBS) and Metakaolin (MK). The selection and
appropriate proportioning of the SCM is influenced by the specific properties requirements for the
HPC at both the fresh and hardened state (Beushausen & Dehn, 2009).
Special attention is thus required in material handling, mixing and manufacturing procedures of HPC
for achieving consistently high quality concrete. Specific material performance requirement must be
ascertained as met by the mix ingredients prior to selection. The recommendation from literature
(Aītcin, 1998; Beushausen & Dehn, 2009; Neville, 2012) can be summarised as follows:
2.2.4.1 Cementitious Material
All cement conforming to SANS 50197-1 or BS EN 197 -1-2000 is adjudged suitable for HPC
(Beushausen & Dehn, 2009), once compactibility between cement clinker and superplasticisers is
ascertained. However, CEM I 42.5 R is recommended based on its suitability for required workability
Stellenbosch University https://scholar.sun.ac.za

17
and strength development to a long term limit of up to 105 MPa. CEM I 52.5 R is on the other hand
excellent for higher strength but might show higher water demand and heat of hydration thereby
necessitating the use of retarding agent for prevention of rapid hardening (Beushausen & Dehn, 2009;
Neville, 2012). SF, generally of 5 to 15% by weight of total binder and sometimes other SCM such as
FA, GGBS, MK and corex slag (CS) are always necessary additions (Aītcin, 1998; Beushausen &
Dehn, 2009; Neville, 2012). Binder content ranges of 380 – 550 kg/m3 are common in HPC with a
consequence high heat of hydration and autogenous shrinkage during hydration resulting in early-age
cracking if volume changes are restrained.
HPC’s properties of high strength and low permeability although not necessarily concomitant, are
linked to one another since high strength requires a low volume of larger capillary pores. This
requirements warrants making the mix to contain particles graded down to the finest size which is
achieved by the use of SF. The SF filles the spaces between the aggregates and the cement particles
(Neville, 2012). Aside the filler effect of the SF is its high pozzolanic reaction which according to
Detwiller and Mehta (1989) is dominant in improving concrete compressive strength. The need for a
sufficiently workable mixture in low W/B concrete, for solids to be well dispersed towards achieving
a dense packing and deflocculation of cement particles often necessitates addition of other SCM. This
is in addition to the use of large dosage of a compatible sperplasticizer.
2.2.4.2 Aggregates
In HPC the mechanical properties of the aggregates are of great importance, so are the shape, grading
and chemical reactions between aggregate and cement paste. Water demand of the aggregates used in
HPC has to be checked and controlled stringently. This is expected to be made as low as possible
through selection of rounded aggregates and optimised grading of different sizes (Beushausen &
Dehn, 2009).
The fine aggregate ought to be of low fine content (≥ 150 µm) since HPC is rich in fines as a result of
the high cement content. A sand of fineness modulus (FM) of 2.7 – 3.0 is recommended (Aītcin,
1998; Beushausen & Dehn, 2009; Kosmatka et al., 2002; Mehta & Monteiro, 2014; Neville, 2012).
Stellenbosch University https://scholar.sun.ac.za
18
ACI 363R-92 recommends fine aggregate with rounded particle shape and smooth texture surface for
less mixing water requirement in HPC. The State-of-the-Art-Report (ACI 363R-92) also affirms that
sand with an FM of about 3.0 gives best workability and compressive strength. For high packing
density and avoidance of stress concentrations due to lack of homogeneity in the concrete matrix,
Beushausen & Dehn (2009) specify a maximum aggregate of 8 to 16 mm size, preferably crushed
stone (andesite, dolerite and dolomite) as the most suitable coarse aggregate for HPC.
2.2.4.3 Admixture
The required low W/B in HPC will always warrant the use of high quality superplasticisers. The
specific project demands might also place a need on the incorporation of other common admixtures
such as retarders or air-entraining agents (Beushausen & Dehn, 2009). There is the need for a proper
understanding of the compatibility of the superplasticisers with the cement type while optimum
dosage for the required workability has to be established from field or laboratory trials. Issues of
consideration here are the ambient temperature and required slump retention time of concrete. The
saturation point of the superplasticisers as specified by the manufacturer is of importance as addition
beyond this point can result in segregation (Beushausen & Dehn, 2009; Neville, 2012).
2.3 Mix Design for HPC
Mix design refers to the appropriate selection of different ingredients of concrete to be designed for
specific purpose (Addis & Goodman, 2009). This exercise must result in a mixture that:
In the fresh state, can be transported without segregation, placed, compacted and finished (if
necessary) with available equipments.
In the hardened state, satisfactorily meet the required strength, durability and dimensional
stability (Beushausen & Dehn, 2009; Neville, 2012).
The various mixture proportioning methods has the following objective as highlighted by (Aītcin,
1998).
Stellenbosch University https://scholar.sun.ac.za
19
Determine an appropriate and economical combination of concrete constituents that can be
used for a first trial batch to produce a concrete close to that which can achieve a good
balance between the various desired properties of the concrete at the lowest possible cost.
Neville (2012) pointed out that a generalised systematic approach of mix proportioning for high-
performance concrete is yet to be developed. McIntosh also stated succinctly that a precise
relationship has not been established between the properties of concrete, and even the more specific
characteristics of the mix such as water: cement ratio; aggregate: cement ratio and grading let alone
such elusive qualities as aggregate particle shape and texture (cited in Addis and Goodman, 2009).
The data used in selecting mix proportions thereby serve only as a guide. Mix design is therefore said
to be a matter of trial and error. The calculations based on design data are really just a means of
making an intelligent guess towards arriving at a trial mix (Addis & Goodman, 2009).
Despite the above-cited draw-backs, a good concrete practitioner can combine the science of mix
design with experience and intuition to obtain proportions which will be close to the requirements
with only one or two trial mixes. The art requires proper care during sampling and more importantly
the materials have to be as uniform as possible to obtain a representative sample (Addis & Goodman,
2009).
The common approaches to mixture proportioning can be placed under two basic classifications
namely
The American Mix design (ACI 211-1) method and
The British Mix design method (or the Department of Environment (D.O.E) method).
The ACI 211-1 method comprises of eight steps as listed in Neville (2012), namely
Step 1: Choice of slump
Step 2: Choice of maximum size aggregate
Step 3: Estimate of water content and air content
Step 4: Selection of water/cement (W/C) ratio
Step 5: Calculation of cement content
Stellenbosch University https://scholar.sun.ac.za

20
Step 6: Estimate of coarse aggregate content
Step 7: Estimate of fine aggregate content
Step 8: Adjustment to mix
The British mix design method is however presented to comprise five steps as follows.
Step 1: Compressive strength for the purpose of determining the W/C ratio. This thereby
brought to fore the concept of target strength
Step 2: Determination of water content based on required workability recognising influence
of the maximum aggregate size and type
Step 3: Determination of cement content
Step 4: Determination of total aggregate content
Step 5: Determination of fine aggregate content from the total aggregate content. The
governing factors here are the maximum size of aggregate, level of workability required, the
water/cement ratio and the percentage of fine aggregate passing the 600 µm sieve.
The method also makes provision for casting trial mixes and adjustment made to the mix
proportioning till the slump range chosen is arrived at. This serves as a check at the fresh state
of the concrete (Neville, 2012).
In South Africa, the Cement and Concrete Institute (C&CI) has a mix design approach derived from
the ACI 211-1 method and this is what is adopted for proportioning of concrete mixtures (Addis &
Goodman, 2009). A close study of the C&CI method reveals it as an expanded form of the ACI 211-1.
Both the D.O.E method and the ACI 211-1 often result in similar proportions of ingredients of same
properties if used for the same target strength.
The peculiarity and performance requirements in HPC have however made the known mix design
approaches to be inadequate due to the following reasons identified in literature (Aītcin, 1998; Addis
& Goodman, 2009; Neville, 2012).
The use of superplasticisers now, enhances low W/B in HPC.
Stellenbosch University https://scholar.sun.ac.za

21
HPC often contains one or more SCM which in many cases replaces a significant amount of
cement.
The presence of SF in HPC causes significant changes in properties of fresh and hardened
concrete.
Workability of HPC can be adjusted using superplasticisers without altering the W/B.
A recent concept in use for mix propotioning in concrete and cement paste is the particle packing
model as discussed in the works of Fennis, et al., (2012). The approach is adjudged not to be effective
for situations where the material constituent can undergo change in shape, nature, or state during the
mixing process (Fennis et al., 2012), hence it can not be considered in this work with SAP expected to
absorb water during the mixing of the HPC. The approach is also for now being used for concrete
materials basically comprising fine particles only while this study has coarse aggregate incorporated.
The American Concrete Institute offers a method of design for HSC in their state-of-the-art-report on
high-strength concrete (ACI 363 R-92, reapproved in 1997). The procedure like the known method
for normal strength concrete (the D.O.E and ACI 211-1) specified the required target strength fcr’
(MPa) same as in ACI 211-1 as:
𝑓𝑐𝑟′ = 𝑓𝑐 + 1.34𝜎 (2.1)
𝑓𝑐𝑟′ = 𝑓𝑐 + 2.33𝜎 − 3.5 (2.2)
Where: 𝜎 𝑖𝑠 𝑠𝑡𝑎𝑛𝑑𝑎𝑟𝑑 𝑑𝑒𝑣𝑖𝑎𝑡𝑖𝑜𝑛; 𝑓𝑐𝑟’ is target strength at maturity (often 28 days) and 𝑓𝑐 is the
characteristic strength obtained from previous onsite data, making reference to ACI 318 and ACI 322.
Equation 2.1 ensures that there is a 99% probability that the average of all sets of three consecutive
compressive strength tests will be equal to or greater than fc. The second equation ensures that there is
a 99% probability that no single test will have a compressive strength lower than fc -3 MPa (ACI 363
R-92).
Mehta & Monteiro (2014) also proposed a simplified mixture proportioning procedure applicable for
normal weight concrete of compressive strength range 60 MPa to 120 MPa. It is suitable for coarse
aggregate having maximum size range of 10 to 15 mm and slump range of 200 to 250 mm. It assumes
Stellenbosch University https://scholar.sun.ac.za

22
a 2% entrapped air volume for non-air entrained HPC, which can be increased to 5 to 6% and
suggested an optimum aggregate volume of 65%.
Aītcin (1998) on the other hand presented a design approach for HSC said to be initiated by five
different mix characteristics beginning with decision on W/B ratio. The sequence is as follows:
No. 1 – the W/B;
No. 2 – the water content;
No. 3 – the superplasticiser dosage;
No. 4 – the coarse aggregate content and
No. 5 – the entrapped air content (assume value).
The procedure is presented in the chart shown in Figure 2.1.
STEP 1 STEP 2 STEP 3 STEP 4 STEP 5
Binder content
Final composition
Strength
Workability
Trial batch
Sand content
Adjustment
Change W/B
ratio
Air content Coarse aggregate
content
W/B selection Water selection Superplasticiser
s dosage
Yes
No
Yes
No
Figure 2-1: Mix Design Process for HPC (Aītcin, 1998)
Stellenbosch University https://scholar.sun.ac.za

23
This study adopts the above mix design method with proper attention given to choice and treatment of
the constituent materials before use in production of the HPC mixes. The specified cement content in
literature for HPC is adhered to while compatibility and the manufacturers guide on superplasticiser
determines the superplasticiser’s choice and dosage. The W/B became the first guiding principle for
this design while preliminary tests on available fine sand as presented in Section 3.3.1 led to the
decision of sieving the natural sand available to reduce the high dust content and the retained on
300 µm used in the trial mixes for a reduced quantity of mixing water.
2.4 Superabsorbent Polymers
Superabsorbent polymer (SAP) is defined by Siriwatwechakul et al., (2010) as a general term
referring to polymers that are able to retain a large amount of water. SAPs are cross-linked
polyelectrolytes which starts to swell upon contact with water or aqueous solutions, resulting in the
formation of a hydrogel (Mechtcherine & Reinhardt, 2012). The two main categories of SAPs are
thermoplastic polymers (or linear polymers) and thermoset polymers (or cross-linked polymers).
Thermoplastic polymers are noted to be of high molecular weight, having overlapping polymer chains
with the junctions acting as physical cross-links which form pseudo-three dimensional structures.
Thermoset polymers, on the other hand, are three-dimensional polymer networks with chemical cross-
links which hold polymer chains together, thus preventing their being dissolved when soaked in
solvents (Siriwatwechakul et al., 2010). This study focuses on thermoset polymers in general, and,
specifically on, the covalently cross-linked polymers of acrylic acid and accrylamide, neutralised by
alkali hydroxide which, according to Mechtcherine & Reinhardt (2012), have been proven to be
efficient as IC-agents in concrete.
The main driving force for the swelling of SAP as reported in the RILEM State-of-the-Art Reports
(STAR) Volume 2 by the TC 225 is the osmotic pressure which is proportional to the concentration of
ions in the aqueous solution (Mechtcherine & Reinhardt, 2012). As the ions in SAP are forced closely
together by the polymer network, there exists a very high osmotic pressure within. By absorption of
water, the osmotic pressure is reduced by diluting the charges (Figure 2.2). The reset force of the
Stellenbosch University https://scholar.sun.ac.za

24
polymer network and the external osmotic pressure thus work together to offset the osmotic driving
force. Other external pressure such as from the swelling of SAP or retention of water against external
mechanical forces, reduces the absorption capacity of the SAP. The swelling is thereby in equilibrium
when all forces are equal (Mechtcherine & Reinhardt, 2012).
Figure 2-2: SAP polymer network based on polyacrylic acid (courtesy of BASF) cited in RILEM STAR
TC 225 (Mechtcherine & Reinhardt, 2012)
The absorption of a SAP is argued Mechtcherine & Reinhardt (2012) to be strictly dependent on the
concentration of ions in the swelling medium. Kinetics of water migration in cement-based materials
systems containing SAP is thereby of importance to this study with focus on the behaviour of HPC
with SAP as IC-agent. The RILEM STAR volume 2 (Mechtcherine & Reinhardt, 2012) has a
summary of studies on this topic which is presented in the following sections.
2.4.1 Water Absorption and Desorption of SAP
The effectiveness of IC by SAP, as argued by Siramanont et al. (2010) is dependent on the swelling
ratio of SAP. This is defined as the rate at which SAP absorbs and releases water and the spacing
within the SAP particles in concrete. These factors are noted to be heavily related to the structure and
polymerisation technique of the SAP.
Stellenbosch University https://scholar.sun.ac.za

25
The kinetics of water migration in cement-based systems containing SAP as shown in Figure 2.3 can
be discussed on two basic concepts of absorption and desorption with previous studies as summarised
by Mechtcherine & Reinhardt (2012) as follows:
Figure 2-3: Schematic representation of water migration in cement-based systems, after Mönnig (2009).
The item labelled A in Figure 2.3 above is the SAP, B is the cement, C is the water, and D is the
aggregate. Figure 2.3(a) is the initial condition which shows homogenous dispersion of cement
particles, water, SAP and aggregates. Figures 2.3(b) represent the state when SAP has reached final
absorption and Figure 2.3(c) refers to the state after desorption when the water has been transported
into the cementitious matrix and almost empty pore remains (Mechtcherine & Reinhardt, 2012).
2.4.2 Absorption in pore solution
Absorption of pore fluid into the SAP is the result of a competitive balance between expansive and
shrinkage forces. The two main factors responsible are the high concentration of ions existing inside
the SAP leading to a water flow into the SAP by osmosis and the increase in the swelling due to water
solvation of hydrophilic groups present along the polymer chain (Mechtcherine & Reinhardt, 2012).
Also of importance depending on the SAP architecture, is the ionic strength of the aqueous solution
which change the interaction (inter- and intra-molecular) of the polyelectrolytes due to the shielding
of charges on the polymer (Jensen & Hansen, 2001). Mönnig (2009) observed that the calcium (Ca2+
)
ions present in the pore solution of concrete can cause additional interlinking of the polymer and limit
their swelling. Increase in the concentration of the ions outside the SAP results in decrease in the
osmotic pressure inside the gel and hence a reduced swelling of the SAP (Jensen & Hanse, 2001). The
A
B
C
D
(a) (b) (c)
Stellenbosch University https://scholar.sun.ac.za
26
SAP particle size also influences the absorption of pore fluids. Very large SAP particles may have a
reduced efficiency due to insufficient time for water uptake during mixing while very small SAP
particles on the other hand, may also show reduced absorption as caused by less active surface zone
compared to the bulk (Jensen & Hansen, 2002). Esteves (2010) confirmed the significant influence of
SAP particle size on both the amount of pore solution absorbed and the rate of water absorption. He
used Fick’s second law of diffusion to describe the kinetics of absorption within a group of SAP as
dependent on its particle size distribution.
Lothenbach & Winnefeld’s Thermodynamic modelling of the hydration of Portland cement (2006) is
one of the many studies carried out on concentration of different ions in the pore solution of cement
pastes as a function of hydration time. The potassium (K+), sodium (Na
+) and sulphate (SO4
2-) ions are
the highest concentration commonly found. High concentrations has been reported by Lura &
Lothenbach (2010) to develop immediately after mixing and remains roughly constant until the setting
time. The ionic strength decreases at later ages as a result of precipitation. According to Lura &
Lothenbach (2010), the ionic strength of CPS differs considerably among Portland cements depending
on their alkali contents and SCM is argued to further influence the ionic strength.
Many research reports of SAP absorption of synthetic pore fluids exists. Notable amongst them is the
work of Jensen & Hansen (2002) with absorption of 20 g/g in 60 minutes for suspension-polymerised
SAP (round particles of average 200 µm size), while a solution-polymerised SAP (crushed irregular
particles of 125 – 250 µm size) was reported to absorb 37 g/g in 30 minutes. The SAP swelling in
cement pastes gave a total absorption of about half the amount shown in the CPS which in turn is
several times less than the absorption in distilled water (Jensen & Hansen, 2002).
Craeye & De Schutter (2006), using SAP particles sizes of 100 to 800 µm arrived at 130 g/g in
distilled water after 5 minutes but above 500 g/g water absorption after 24 hours. The latter absorption
level was then used to estimate the SAP to be added to concrete by Craeye & De Schutter (2006) with
no account taken for the SAP’s much less absorption in CPS than in water. Esteves (2010) using
optical microscope observed the growth of individual SAP particles in the CPS over time. The work
Stellenbosch University https://scholar.sun.ac.za

27
concludes that particle size had a significant influence on both the absorption kinetics and total
amount of absorbed fluid.
SAP absorption in cement paste is more difficult to determine when compared to absorption in CPS.
Partial answers have been offered by previous studies on the amount of fluid absorbed and the
kinetics of absorption. According to Mechtcherine & Reinhardt (2012), there is no information
available on the differential swelling of different-sized particles in cement pastes. Jensen & Hansen
(2002) are of the opinion that large particles may not have enough time for full expansion. The
distribution of the SAP particles in concrete is also an issue of concern, as the particles can form
clusters or agglomerate (Mönnig, 2009). Mechtcherine & Reinhardt (2012), in addition to issues
raised above identify the need to investigate crushing possibility of swollen SAP, especially the larger
particles during vigorous mixing.
A popular approach adopted by researchers in estimating SAP absorption in cement pastes and
concrete is by observing the changes in rheology of mixtures containing SAP. Mönnig (2005 & 2009)
compared the slump flow as a function of additional mixing time (up to 15 minutes) of concrete
mixtures containing SAP to arrive at absorption of 10 ml/g and 45 ml/g for two SAP types. Most
water uptake by the SAP was judged to occur in the first five minutes (Mönnig, 2005). Dudziak &
Mechtcherine (2008) estimated SAP absorption in a coarse-grained fibre-reinforced UHPC by
adjusting the water to obtain the same slump flow of a reference mixture.
Many approaches have been developed by researchers for determination of SAP absorption capacity
in cement pastes and concrete such as:
i) those based on the principle of stereology (Jensen, 2005);
ii) collection of digital images from polished paste surface using a high resolution scanner in
combination with SEM images for comparing particle size distribution of SAP at both the
dry and swollen state at 2D image analysis level (Mechtcherine et al., 2006; Dudziak &
Mechtcherine, 2008; Mechtcherine et al.,2009); and
iii) use of X-ray micro-tomography (3D images) for dry SAP particle size distribution and their
distribution in high-performance mortars (Lura et al, 2008).
Stellenbosch University https://scholar.sun.ac.za
28
Lura et al. (2008) characterised the pore structure of a mortar with SAP with round pores at a peak
diameter of 150 µm which was clearly different from a plain mortar. They also performed a micro-
tomography study of SAP in UHPC producing an image of the 3D distribution of the voids without
quantitative analysis.
Neutron tomography was used by Trtik et al. (2010) to observe the water uptake of a large SAP
particle (about 1 mm size in dry state) inserted in a fresh cement paste with W/C of 0.25. The study
reports 12 g/g SAP absorption of the CPS at 3 hours with about 90% of the uptake taking place at 35
minutes after casting, which was the time of completing the first tomography (Trtik et al., 2010).
Nuclear magnetic resonance (NMR) relaxation is another technique used to study water absorption by
SAP in fresh concrete. The NMR experiments with high time resolution shows a fast water uptake of
SAP, within less than five minutes after water addition (Nestle et al., 2009).
The fluid absorbing capacity of SAP is expressed as the swelling ratio i.e. the ratio of the weight of
swollen SAP (swollen state) to the dried SAP (collapsed state). This is also referred to as absorbency
in the works of Esteves (2014). This is a basic property of SAP which determines the final
characteristics (i.e. microstructure, pore structure and the nature of hydration products) of concrete
and mortar pastes. The values adopted by previous researchers ranges between 45 g/g (Craeye, et al.,
2011) and 12.5 g/g (Hasholt, et al., 2012) for SAP swelling capacity in concrete. The most popular
approach for the determination of SAP absorbency is the “Tea-Bag test” which according to
Mechtcherine & Reinhardt (2012) is simple and easy to carry out on-site and in a laboratory.
Researchers have reported SAP absorbency through the tea-bag test of 20 g/g to 35 g/g in CPS
depending on the SAP ionic concentration (Jensen and Hansen, 2002; Schroefl, et al., 2012; Assmann,
et al., 2014). SAP swelling capacity in cement pastes is judged as about half the amount shown in
cement pore fluid (Jensen and Hansen, 2002). Esteves (2014) however proposed the use of the laser
diffraction particle method for measurement of SAP absorbency in cement-based materials and
reported an absorbency value of 13.8 ml/g using a stimulated exposed liquid (a CPS) at a certainty
level of 0.1 ml/g. He however pointed out some factors such as the storing condition and the choice of
optical model or the refractive index which could influence the accuracy and reproducibility of the
Stellenbosch University https://scholar.sun.ac.za
29
result. It then follows that there is also a possibility of the influence of solid contents of concrete in
SAP absorption and desorption of the CPS or available water in concrete. The need for determination
of SAP absorbency thereby becomes an important factor in research on its influence on concrete
properties especially HPC.
2.4.3 Desorption in pore solution
The covalentlty cross-linked thermoset polymers type of SAP absorbs water when brought in contact
with water thereby causing water molecules to diffuse into the void space inside the polymer network
to the hydrated polymer chain resulting in a swollen polymer gel (Siriwatwechakul et al., 2010). This
process can be reversed by removing water and the SAP will return to the collapsed state. The driving
force for desorption is the gradient in water activity generated within the concrete between the SAP
absorbed water and the pore fluid in the cement paste resulting from self-dessication of the paste due
to cement hydration (Mechtcherine & Reinhardt, 2012). Capillary pressure develops in the pore fluid
by part of the gradient of water activity causing emptying of the pore due to hydration or external
drying (Lura et al., 2006; Friedemann et al., 2006). Osmotic pressure caused by difference in the
composition of the absorbed solution in SAP and that of the pore soultion in the cement paste at the
setting time and later also is a contributory factor. The desorption process can be described as a
competition for water between the SAP and the cement paste (Mönnig, 2009).
Determination of the desorption of water and pore solution by SAP is more difficult than the SAP
absorption. Among the few attempts at determining desorption is the work of Jensen & Hansen (2002)
which presented desorption isotherm of a solution-polymerised SAP. The report shows that the SAP
retained only 3 g/g of pore fluid and less than 1 g/g at 86% RH from the 350 g/g free liquid uptake in
distilled water and 37 g/g in CPS recored at 98% RH (Jensen & Hansen, 2002). This implies that
almost all the pore solution absorbed in the SAP will be released within the first day of hydration in a
low W/B concrete known for rapid self-dessication.
Mönnig (2009) conducted a study to measure desorption rate of SAP particles through mass loss at
different RH of layers of saturated SAP particles with a thickness of one particle. The result shows
Stellenbosch University https://scholar.sun.ac.za

30
that the water close to the surface of the polymers is lost rapidly but water closer to the core of the
polymer has to overcome more side-chains in the ploymer, which interact with the water molecules
through the Van-der-Waal’s forces.
The factors influencing the desorption kinetics of the SAP in cement paste are properties of the SAP,
kinetics of hydration, microstructure of the cement paste and the interface between the SAP and the
cement paste, through which the water transport takes place. Mechtcherine & Reinhardt (2012)
presents some experimental techniques for quantifying the amount of water remaining in the SAP (or
lost from SAP) at a given point during cement hydration. They however make a case for further
studies on understanding the desorption process of SAP including the determination of transport
distance of water into the hardening cement paste.
Mönnig (2009) in his observation of water transport from a single SAP in cement paste (W/C = 0.5)
with an optical microscope shows a water transport distance from the SAP of at least 50 – 60 µm
(SAP original section of 168 µm had an influence zone of 280 µm diameter). Pieper (2006) in his
study of SAP made to absorb water with dye added, reports that during mixing of cement paste, the
SAP particles released some part of the absorbed water. Low-field NMR relaxation had also been
used to study hydration in hardening cement paste with and without SAP (Friedemann et al., 2009;
Nestle et al., 2009). Nestle et al. (2009) reports that there is about 15% contribution of the curing
water in the SAP to the total water content of the cement paste. The work further infers that the water
transfer from the SAP into the cement matrix is almost completed after 1 day. Performing pulse field
gradient NMR diffusion to study water mobility of SAP particles as a function of water content, as
well as SAP inside hydrating cement paste. It was reported that self-diffusion coeffients in SAP
decrease slightly with increasing weight fraction of SAP, but remains high in the range of free water
which equals 10-9
m2/s (Nestle et al., 2009; Friedemann et al., 2006). This implies that a fast exchange
of water molecules exists between the SAP gel particles and the interface with the cement matrix. The
research report on diffusion length determined by NMR in the above studies (Nestle et al., 2009;
Friedemann et al., 2006) is found to be in good agreement with water transport measurements from
saturated LWA to cement paste (Lura et al., 2006; Henkensiefken, et al., 2011; Trtik, et al., 2011).
Stellenbosch University https://scholar.sun.ac.za

31
Synchrotron X-ray micro-tomography and Neutron radiography, as used in the study of water
transport from saturated LWA to cement paste (Benz et al., 2006; Maruyama, et al., 2009), are also
possible techniques as suggested by Mechtcherine & Reinhardt (2012) for application to IC with SAP.
Trtik et al., (2010), from their study using Neutron tomography to monitor water release in large
particles, observe emptying of absorbed fluid by the SAP around the setting time and that about 80%
of the water was released in the first day of the cement hydration.
Another approach is to derive indirect evidence on the kinetics of water desorption of SAP from the
measurements of degree of hydration, heat of hydration, internal RH and autogenous deformation in
the cement-based system (Mechtcherine & Reinhardt, 2012). The works of Jensen & Hansen (2002)
and Pierard et al., (2006) are examples which adopted measurement of autogenous deformation
approach with an inference that the development of autogenous deformation in cement pastes
followed the trend in RH development. Lura et al., (2006) observed higher non-evaporable water
(𝑤𝑛) at 28 days in cement pastes with SAP compared to reference pastes. The work of Klemm (2009)
on measurement of rate of heat of liberation on white Portland cement paste (W/C = 0.3, 20% SF),
with or without SAP, observed significant influence due to SAP addition on the dormant period of the
paste. Water release by SAP was observed to correspond to the main hydration peak and up to the first
couple of days of hydration.
2.5 Superabsorbent Polymer in Concrete
SAP are primarily used as absorbent for water and aqueous solution in baby diapers, feminine hygiene
products and other applications. The use in concrete and cement-based materials as IC-agent is well
documented in literature (Khare and Peppas, 1995; El-Dieb, 2007 cited in Siriwatwechakul et al.,
2010) with the works of Jensen, et al., ( 2001 & 2002) being the most extensive studies. This has led
to an increased research interest on utilisation of SAP as concrete admixture thus leading to the
establishment of the RILEM Technical Committees; TC 196 – ICC: Internal Curing of Concrete, TC
225-SAP: Application of Superabsorbent Polymers in Concrete Construction and TC RSC:
Recommendations for the use of Superabsorbent Polymers in Concrete. These committees have
Stellenbosch University https://scholar.sun.ac.za
32
brought researchers together for discussions on IC of concrete, SAP and its applications in concrete at
different fora with RILEM Conference proceedings (RILEM Pro 052, 2006; Pro 074, 2010 and Pro
095, 2014) coupled with State-of-the-Art Reports (RILEM Report 41 by TC 196 – ICC - (Kovler &
Jensen (eds.), 2007) and TC 225-SAP - (Mechtcherine & Reinhardt, 2012)) summarising the available
knowledge on IC of concrete and SAP application in concrete. Highlights of theses reports are thus
presented in the following sections as basis for further study on SAP application in concrete.
2.5.1 Previous Studies on Superabsorbent Polymer in Concrete
The RILEM Report 41 by TC 196-ICC (Kovler & Jensen (eds.), 2007) highlights the positive effects
of the use of SAP in HSC as an efficient IC-agent. Self-dessication and resulting autogenous
shrinkage of these low W/B concretes were adjudged to be reduced or even totally prevented by
providing internal water reservoirs. LWA and SAP were identified as the prominent materials in use
as IC-agent in HPC (Kovler & Jensen, 2007), while SAP is seen as more effective in mitigating
autogenous shrinkage due to their high water absorption capacity following evidence from a pilot
project executed with SAP as IC-agent applied to HPC on a large scale (Mechtcherine et al., 2006).
The work of the RILEM TC 196-ICC brought about broader research on the topic of SAP with many
researchers investigating effects of SAP addition on concrete’s rheological behaviour, shrinkage,
strength, durability and other properties which are summarised in the STAR volume 2 by RILEM TC
225-SAP (Mechtcherine & Reinhardt, 2012). The previous discussion in Section 2.4 centred on the
kinetics of absorption and desorption of SAP while the following sections will review the available
previous studies on effects of SAP on the rhelogical behaviour, shrinkage, strength, durability, and
other properties as well as change in concrete’s microstructure.
2.5.2 Effect of SAP on Workability of Concrete and Mortar
HPC and UHPC are materials with exceptional mechanical properties and enhanced durability. They
are low W/B mixtures susceptible to high autogenous shrinkage and early age cracking potential when
the deformation is restrained (Mechtcherine et al., 2009). SAP addition in the HPC/UHPC is primarily
as IC-agents to mitigate autogenous deformation due the polymers’ capacity to absorb liquids many
Stellenbosch University https://scholar.sun.ac.za

33
times their own weight, with a resultant gel forming. This characteristic can, on the other hand,
considerably change the rheology of concrete containing SAP and hence the workability of the fresh
concrete. Jensen & Hansen (2002) reported that a 0.4% (bwoc) addition of a particular SAP type led to
a lowering of the free W/C by 0.06. The change in the W/C produces an increase in the yield stress
and the plastic viscosity of concrete. Contributing to the pure binding effect on the yield stress and
plastic viscosity increase is the physical presence of the swollen SAP particles (Jensen, 2008).
The works of Mechtcherine et al., (2006) is among the few results available in literature on influence
of SAP on the workability of concrete. They developed a special UHPC for the construction of the
FIFA World Cup pavilion in Germany. Examining four UHPC mixtures, two without SAP at similar
mixture composition (Reference and Pavilion at W/C of 0.24 and 0.25 respectively) and the other two
made of 0.4% SAP (bwoc) with additional water for SAP absorption increasing the W/C to 0.28
(Reference with SAP) and 0.29 (Pavilion with SAP). The fresh properties of concrete were measured
using the slump flow spread and the V-funnel time tests. Increases in slump flow and a decrease in V-
funnel flow time values was reported for SAP addition in the reference mixtures, while the Pavilion
mixtures (with or without SAP) presented same slump flow values. The V-funnel flow time reading
on the other hand show a slight difference with higher values observed for the mixture containing
SAP (Mechtcherine et al., 2006).
Dudziak & Mechtcherine (2010a) also measured the workability of fresh concrete containing SAP
using the slump flow test with two types of UHPC reference mixtures. A fine-grained UHPC
enriched with steel fibres and a fibre-free UHPC containing coarse aggregate. The work involves five
UHPC mixtures containing SAP of varying contents (0.3 – 0.4% bwoc) with additional water (0.04 -
0.07% bwoc). Slump flow values of 750 mm and 830 mm were recorded for fine-grained UHPC with
or without SAP and additional water respectively, while an average slump flow value of 680 mm and
695 mm were reported for both reference UHPCs made from coarser particles and fibre and its SAP-
containing mixture respectively. The outcome of the various studies by Mechtcherine et al., (2006,
2009, 2010a & b); Dudziak & Mechtcherine (2008) led to the conclusion that adding an extra W/C
content of 0.015 is required for every 0.1% of SAP addition for the same workability to be
Stellenbosch University https://scholar.sun.ac.za
34
maintained. This is however said to be valid only for the acrylamide/acrylic acid polymer, spherical
shape type of SAP with approximately 150 µm diameter size in the dry state and water uptake of
approximately 16±1 g/g used in their studies. The results revealed that all UHPC mixtures with SAP
experienced an increase in air content. All the UHPC mixtures with SAP were reported to show some
decrease in density at the fresh state. Results from the work of Paiva et al., (2009) were also in good
agreement, showing that SAP addition with extra water resulted in decreased density and an increase
in the air content of fresh mortar.
Mönnig (2005 & 2009) studied the time evolution of the spreading flow of mortar mixtures containing
varied contents of different SAP materials. Slump flow measurements were expressed as a function of
additional mixing time with 2 or 5 minute intervals. The work suggested that some SAP materials had
significant influence on the workability of cement-based materials, enhancing longer slump retention
time. Mönnig (2009) also reported results on air content and density as recorded for numerous
combinations of mortars and concrete. The presence of varied SAP types, particle size distribution
and content as well as the magnitude of total W/C are parameters of interest in the above listed
research works.
The limitations of the various studies, examining SAP influence on concrete workability using slump
flow measurement is the inability to derive answer to the extent to which SAP incorporation changes
the rheological behaviour. Slump flow is arguably an insufficient tool for quantitative assessment of
rheological variables (Mechtcherine & Reinhardt, 2012).
Use of rheometer and V-funnel tests was reported in Mechtcherine & Reinhardt (2012) as adopted to
examine the rheological behaviour of fibre-free finely grained UHPC. The results showed that the
effect of SAP addition in UHPC is beneficial. It was further pointed out that an underestimation of
SAP absorption capacity in one of the experiments led to pronounced loss of workability. A slight
overestimation of SAP absorption can on the other hand, provoke a pronounced decrease in concrete
viscosity (Mechtcherine & Reinhardt, 2012). SAP addition in cement-based systems without
additional water is equivalent to removing water from the system and thus increases the yield stress
and viscosity values, causing a thickening action (Mechtcherine & Reinhardt, 2012). Jensen (2008)
Stellenbosch University https://scholar.sun.ac.za

35
believes that the thickening effect caused by SAP in cement-based systems can be used with
advantage in some practical applications such as pumping.
2.5.3 Binder Hardening and Microstructure Development
The mechanism behind reduction of self-desiccation in HPC containing SAP is the free water release
from saturated SAP leading to an increasing RH and promoting further cement hydration. The added
SAP changes the kinetic of the hydration process and the development of microstructure in concrete.
Issues of interest therefore are the degree of cement hydration as influenced by SAP addition and
influence of SAP on the development of microstructure characteristics. That is, porosity, pore size
distribution, morphology and connectivity of bulk cement paste, interfacial transmission zone (ITZ)
between the cement pastes and SAP and the voids introduced by SAP (Mechtcherine & Reinhardt,
2012). The following sections present a discussion of the available studies on SAP influence on
degree of hydration and microstructure development in cement paste.
2.5.3.1 Degree of hydration of cement paste
The rate of change of the degree of hydration due to IC provided by SAP is influenced by the size and
amount of SAP in the mixture, the original W/C and the procedure of SAP addition in the concrete or
mortar mixture (Reinhardt et al., 2008). The procedures of SAP addition are: i) addition of dry SAP
particles without extra water; ii) addition of SAP particles along with the dry constituents and extra
water added for SAP absorption; iii) addition of saturated SAP particles to the concrete, mortar or
cement paste. The mechanisms of SAP’s water uptake in cement paste and the rate of water
desorption by SAP directly control further hydration (as discussed in Section 2.4 above).
Reported influence of SAP on the hydration process to date had been only in few studies (Lam, 2005;
Ingarashi & Watanabe, 2006; Lura et al, 2006). Ingarashi & Watanabe (2006), through BSE image
analysis, observed no significant difference on degree of hydration for 0.25 W/C cement paste (with
or without SAP) till an age of 14 days, while that SAP addition as IC-agent led to increased degree of
hydration after the 14 days. Lura et al. (2006) measured 𝑤𝑛 content and noted a 10% increase in the
relative degree of hydration for SAP-modified cement paste at the 56 days age. Esteves (2009)
Stellenbosch University https://scholar.sun.ac.za
36
reported the measured degree of hydration of cement pastes and mortar containing SF with or without
SAP. He stated that use of SAP as IC-agent promotes both the cement hydration and the pozzolanic
reaction, especially in the first few days of hydration.
2.5.3.2 Pore structure
The main reason for changes in the microstructure, especially the pore structure of concretes (NSC or
HPC) containing SAP as highlighted by Mechtcherine & Reinhardt (2012) are:
i. SAP acts as soft aggregate when fully filled with water, but as air void when empty.
ii. Non-uniformity of the dispersion of SAP during concrete mixing operation.
iii. SAP water absorption changes the effective W/C in the early hydration stage while the
water desorption by swollen SAP affects the further hydration of cement.
iv. More pores may be induced by the interface between SAP and the cement paste matrix.
The effect of SAP on the pore structure therefore can be total porosity as well as the pore size and the
pore size distribution.
Mechtcherine et al., (2009) showed that SAP increases the total porosity of concrete due to voids
introduced by SAP particles. The total porosity measured by mercury intrusion porosity (MIP) on the
concrete containing 0.6% (bwoc) SAP (with extra water) at all ages was 6% higher than plain concrete
and 2% higher than the mixture with 0.3% (bwoc) SAP (plus extra water). The extra water added in the
SAP-enriched mixtures compensated for the expected loss of workability due to water absorption by
SAP particles and thus changed the total W/C in these mixtures. Mönnig (2005), MIP results showed
no difference or even lower porosity at 1 day for SAP-modified mixtures with no additional water
compensating the change in the rheological properties. According to Mechtcherine et al., (2009), the
pore diameter measured by MIP technique ranges between few nanometres (nm) to about 120 µm,
while the voids introduced by SAP particles in concrete on average should be above 150 µm size.
The MIP is thus limited to measuring only a part of the SAP created voids (those with smaller size).
The need for improved technique examining SAP created voids in concrete as adopted in this research
Stellenbosch University https://scholar.sun.ac.za
37
will be an important contribution to the available knowledge on influence of SAP addition on the
behaviour of concrete specifically HPC.
Pore size and pore size distribution of surrounding cement matrix can be affected by SAP addition.
Mechtcherine et al., (2009) found no significant effect of SAP addition on the most frequent pore
diameter of the UHPC investigated for different ages. Ingarashi & Watanabe (2006) revealed that
pastes with SAP as IC-agent have smaller porosity and more cement gel than paste without SAP. This
was shown using a BSE image analysis on volume fraction of constituent phases in the cement pastes
made with or without SAP. This suggests that the water released from SAP further enhanced
continued hydration of cement and hence a decrease in porosity at later ages, especially in the range
of capillary pores. Results of the studies by Dudziak & Mechtcherine (2010a) on UHPC samples with
SAP (plus extra water) collaborates this finding. The BSE image analysis by Ingarashi & Watanabe
(2006) revealed little change in the pore diameter in the pastes without SAP after 24 hours while pores
in SAP-enriched pastes appreciably decreased with time. It was thus suggested by Ingarashi &
Watanabe (2006) that addition of saturated SAP particles decreased the volumes of large pores in the
coarse pore structures of the paste.
Lam (2005) through SEM image analysis with a BSE detector reported that SAP-modified mortar had
empty voids seen as black spots with dark greyish rim which were the remains of the spherical SAP
particles. The remnant of the SAP particle had some cement paste on its outer surface which had
likely broken away from the cement matrix due to drying at the sample preparation leaving a gap
(Lam, 2005). Also noticed were large voids, greater than 300 µm which according to Lam (2005) is
due to non-uniform distribution of the SAP particles in the samples. Different techniques and different
preparation methods were reported to show the interfacial transition zone (ITZ) differently. The ITZ
observed by SEM in a gaseous secondary electron (GSE) mode can be completely different from that
obtained in a BSE detector mode. Reports from both the GSE mode based SEM and the X-ray
diffraction conducted by Mechtcherine et al., (2009) were in agreement, stating no visible difference
in element distribution between the microstructure formed directly in the surrounding of SAP pores
and the other matrix.
Stellenbosch University https://scholar.sun.ac.za
38
The structure of SAP introduced as IC has a significant positive influence on the frost/thaw resistance
in concrete (Lausten et al., 2008). Lura et al., (2008) presented micro-CT images of 3D distribution of
SAP in mortars which revealed a number of large, spherical pores in SAP-containing mixtures. The
SAP induced pores were noted to be evenly distributed over the concrete volume (Mechtcherine et al.,
2009). Mechtcherine et al., (2006) showed that the final pores correspond well to the spherical shape
of dry SAP particles as observed before addition to the mixture but are considerably larger. Ye (2003)
used 3D micro-CT images to examine the pore size and structure for quantitative characterisation of
the microstructure. Grey level histograms were adopted for classifying the black parts which represent
the voids and pores volume was distinguished. The volume of pore images was assessed by
multiplying the number of pixels with the image resolution and calculations made using the
equivalent diameter of a sphere to obtain the cumulative pore volume fraction against the equivalent
pore diameter.
2.5.4 Effect of SAP on Concrete Shrinkage
Shrinkage deformation leads to volume changes in concrete with resultant instances of cracking. Four
common types of shrinkage which are relevant in the context of the study, are: i) plastic shrinkage –
occurring during the first few hours after mixing the concrete (before the concrete sets);
ii) autogenous shrinkage of hardening concrete – this is the apparent (external, macroscopical, bulk )
volume reduction resulting from the cement hydration process; iii) drying shrinkage – caused by the
loss of water to the surrounding environment; and iv) carbonation shrinkage – resulting from carbon
dioxide reaction with water (Mechtcherine & Reinhardt, 2012). Discussions on the first three
shrinkage types with reference to current state of research on effect of SAP are presented in the
following sections.
2.5.4.1 Plastic Shrinkage
Plastic shrinkage is the volumetric change in concrete occurring at very early age of concrete after
mixing and casting before hardening. It refers to the concrete’s exhibition (in the plastic state) of its
properties of drying suspension consisting of densely-packed solid particles in a liquid phase. This
Stellenbosch University https://scholar.sun.ac.za
39
results from rapid water loss from the concrete surface by evaporation (Mechtcherine & Reinhardt,
2012). Insufficient curing as a result of lack of protective cover for concrete surfaces exposed to
strong winds, high temperatures and/or low humidity are the major causes of plastic shrinkage in
concrete. According to Mechtcherine & Reinhardt (2012), available information on particular effect
of SAP addition in cement-based materials on plastic shrinkage is limited.
The work of Dudziak & Mechtcherine (2010b) is among the few attempts made at determining the
plastic shrinkage behaviour of fresh cement pastes containing SAP. The authors reported a reduction
in the plastic deformation and capillary pressure due to SAP addition with extra water, but settlement
deformation was found to increase compared to the control mixture. Set retardation was also observed
for the cement paste with SAP and extra water (Dudziak & Mechtcherine, 2010b). Dudziak and
Mechtcherine (2010b) are of the view that the less pronounced settlement of the reference mixture
was due to two phenomena acting simultaneously. These are: i) early and high rise of temperature due
to heat of hydration; and ii) high positive autogenous deformation within the first hour or two after
casting.
Kratz et al. (2007) observed a common behaviour of expansion or low plastic deformation for SAP-
enriched mixes (with additional water) while SAP-free mixes showed pronounced plastic shrinkage.
Results obtained by the authors for the mixes with SAP without additional water were less conclusive
while some apparent inconsistencies in the result of mass loss measurement gave some difficulties in
interpretation of their findings. As noted by Kratz et al. (2007), there is need for further investigation
before a comprehensive discussion of the shrinkage mechanism.
2.5.4.2 Autogenous shrinkage
Autogenous shrinkage is defined as the external bulk deformation of a closed (sealed), isothermal
cement-based system, not subject to external forces (RILEM Report 41, 2007). This is an important
phenomenon in young concrete especially at low W/C (less than about 0.42), in which all the water is
rapidly drawn into the hydration process and the demand for more water creates very fine capillaries.
The surface tension within the capillaries leads to autogenous shrinkage (through two mechanisms –
Stellenbosch University https://scholar.sun.ac.za

40
chemical shrinkage or self-desiccation) which can lead to cracking. HPC due to their fine pore
structure and low W/B are very susceptible to self-desiccation-caused autogenous shrinkage.
Lyman (1934) was the first to describe this deformation type, observing a decrease in concrete
volume without any notable change in its mass or temperature. The subject of autogenous shrinkage
in NSC, being considerably smaller than drying shrinkage, however received little attention until
application of HPC in construction became popular in recent times. At the fresh state of concrete
(before setting), the internally occurring and externally measurable volume changes are alike, hence
autogenous shrinkage has been regarded as equal to chemical shrinkage.
Chemical shrinkage is defined in by Mechtcherine & Reinhardt (2012) as the internal microscopical
volume reduction due to a resultant lower absolute volume of the hydration products as compared to
that of the reacting constituents (i.e. binders and water). Chemical shrinkage (being the change in
absolute volume) is distinct from autogenous shrinkage deformation which is defined as the change in
apparent volume (Jensen & Hansen, 2001). Although chemical shrinkage has drawn less attention in
research than autogenous shrinkage, it is said to be the main driving mechanism behind the
macroscopically observed autogenous shrinkage after a commencement of solid skeleton development
in concrete (Mechtcherine & Reinhardt, 2012). Mechtcherine & Reinhardt (2012) offers assessment
of hydration reactions of the main mineral components of cement as the most straightforward
approach to study the absolute volumetric changes in concrete.
Nawa & Horita (2004) showed that reaction of Tricalcium silicate with water resulted in 16.5%
reduction in the absolute volume (166.4 cm3 of reagents produced 138.9 cm
3 of hydrates). In the
study, the density of the reactants and the products of the chemical reaction as well as the molar
weight of the compounds were incorporated in the input parameters for the calculations. Kratz et al.
(2007) suggests adoption of the same approach for calculating the chemical shrinkage with further
calculations made for the secondary reactions (e.g. ettringite formation). It is however the view of
researchers that chemical shrinkage (as a rule of thumb) is equal to 0.06-0.07 ml/g of Portland cement
reacted (Powers & Brownyard, 1948) while for SF it increases to 0.22 ml/g of SF reacted (Jensen,
1993). Absolute volume of unhydrated cement is noted to increase from 1 cm3 to approximately 2.2
Stellenbosch University https://scholar.sun.ac.za
41
cm3 after the hydration process is finished (Powers & Brownyard, 1948; Hansen, 1986). According to
Lura (2003), the global reduction of volume takes place at the expense of water while the solid
volume increases.
According to Mechtcherine & Reinhardt (2012), all commonly used approaches for chemical
shrinkage assessment ensures constant water saturation of the pores within the cement-based system
under examination. This makes the amount of water needed to replace the volume decrease a key
principle of the measurement while chemical shrinkage is determined by normalising the volume
change to the solid mass in the measured sample. Mechtcherine & Reinhardt, (2012) observed that
there is currently no experimental evidence suggesting need to adjust the measurement protocol of
chemical shrinkage characterisation in SAP-free systems for verification of changes caused by use of
an IC-agent. No study in literature is noted to provide conclusive information on chemical shrinkage
due to incorporation of IC-agents. Esteves (2009) and Lura (2003) arrived at similar results in their
respective experiments on SAP-enriched cement pastes of W/C of 0.3% and 0.4% SAP content bwoc.
They used similar protocols, although the pastes in Esteves (2009) work had a15% bwoc SF content.
They reported that all the SAP-enriched pastes mixtures showed higher chemical shrinkage compared
to the SAP-free paste. This was said to be clearly driven by the highest rate of hydration. SAP
addition was adduced to be responsible for the change as a result of the higher moisture content
present as entrained water in the paste (RILEM Report 41, 2007).
The cement-based material in a liquid-like state is unable to sustain internal voids created by chemical
shrinkage. As the solid skeleton forms of the hydration products, the bulk deformations of the entire
concrete system observed (macroscopically) are smaller than the changes in the internal volume of the
materials. Examining this in a microscope, shows formation of a large number of fine pores in the
cement paste referred to regarded as significant volume changes due to hydration. The measured
reduction in concrete specimen (macroscopically) – autogenous shrinkage, is therefore, only a fraction
of the real material (i.e. chemical) shrinkage.
The extent to which chemical shrinkage is converted to autogenous shrinkage depends on the water
content and the pore distribution resulting from hydration. In NSC, mainly for reason of workability,
Stellenbosch University https://scholar.sun.ac.za

42
the mixing water provided is more than required for complete hydration of cement. Thus, pores
formed due to chemical shrinkage are either filled with water or at least the concrete air pore has a RH
of 100%. In this case, there is no significant self-desiccation during the entire hydration process and
the thermodynamic equilibrium of the system is undisturbed. The adjoining pressure between the
particles of C-S-H gel experience can be offered similar consideration, hence no pronounced driving
force for autogenous deformations (Mechtcherine & Reinhardt, 2012).
The amount of water in the low W/B HPC is insufficient to achieve complete hydration of cement.
Hence, this concrete type experience pronounced decrease in RH within the pore system. This leads to
a resultant self-desiccation-caused shrinkage deformation based on two mechanisms: i) a decrease in
the disjoining pressure between the particles of the C-H-S gel, and, ii) a decrease in the menisci radii
of the pore water, causing tension increase both within the pore water and at its surface. The second
phenomenon is known to result in simultaneous development of compressive stresses in the solid
skeleton of the system towards restoring equilibrium by compensating the tensile stresses in the fluid
phase. The extent to which either of the two phenomena stated above dominates the material
behaviour observed is yet to be ascertained by further experiment of studies (Mechtcherine &
Reinhardt, 2012).
Contributory factors to the increased autogenous shrinkage in this low W/B HPC is the fact the
mixtures usually contain superplasticiser and SF. SF incorporation in HPC mixtures leads to finer
pore structure and thus increased capillary stress. The pozzolanic reaction of SF involves chemical
shrinkage and thus higher bulk shrinkage of SF-concretes (Mechtcherine & Reinhardt, 2012).
Investigations on approaches to mitigate autogenous shrinkage by adding materials with high water
storing capacity to the mixture, which would supply water to surrounding matrix as soon as self-
desiccation occurs has identified the use of saturated LWA and SAP as appropriate (ACI (308-213)
R13, 2013; RILEM Report 41, 2007; Bentur et al., 2001; Weber & Reinhardt, 1997).
In reference to the work of Jensen & Hansen (2001 & 2002), researchers have tested various types of
SAP, and shown some has good ability to mitigate autogenous shrinkage in HPC (Mechtcherine et al.,
2006; Ingarashi & Watanabe., 2006). Preference for SAP is based on the fact that they can be
Stellenbosch University https://scholar.sun.ac.za
43
engineered for special purpose of IC by designing the necessary particle size and shape, water
absorption capacity and other properties. The application as IC-agent involves only a small amount of
SAP with some additional water added directly as constituent materials of the concrete during the
production process.
The effect of SAP on autogenous shrinkage can be treated on the concept of IC, targeted at mitigating
volume reduction of hardening and hardened cement paste component of concrete. Considering the
fact that shrinkage of concrete (autogenous or otherwise) is generally known to be smaller in
comparison to that of cement paste. Two opposing issues highlighted by Mechtcherine & Reinhardt,
(2012) of relevance on effect of SAP addition to cement paste versus concrete (or mortar) are: i) the
distribution of SAP particles over the cement paste volume might be more homogenous in the
concrete due to involvement of generally higher mixing intensity, and ii) the presence of aggregates
and fibres in concrete may cause some additional mechanical loading on SAP in fresh concrete, which
could lead to destruction of some unstable SAP particles.
Mechtcherine & Reinhardt (2012) present the works of previous researchers on effect of SAP on
autogenous shrinkage of cement paste. Jensen & Hansen (2002) reports that SAP addition (0.3% and
0.6% bwoc) led to a successful mitigation of autogenous shrinkage and some induced expansion.
Ingarashi & Watanabe (2006) noted drastic reduction on autogenous shrinkage in a cement paste of
0.25 W/C through SAP addition (0.35% bwoc) while autogenous shrinkage was completely prevented
in the 0.33 W/C paste at higher SAP content. A further reduction of autogenous shrinkage to
approximately one third was reported by the authors for a 0.25 W/C paste containing SF by the
addition of 0.35% (bwoc) SAP and corresponding amount of extra water. An increase in SAP content
to 0.70% in the paste with SF still led to slight shrinkage at the early ages, a contrast to the
corresponding SF-free cement paste, for which SAP completely prohibited autogenous shrinkage
(Ingarashi & Watanabe, 2006).
Lura et al., (2006), in a study of the effect of SAP particle size and content reported that the size of
expanded particles in the cement paste was 2-3 times greater due to pore fluid absorption. The authors
reported that SAP pore absorption of approximately 12.5 g/g during the mixing of the cement paste.
Stellenbosch University https://scholar.sun.ac.za
44
They showed that at 0.3% bwoc SAP addition with extra water, contrary to the usually expected IC-
efficiency enhancement due to better particle in the pastes with smaller-size SAP particles, the overall
efficiency was somewhat lower than that of the mixes with larger particles. In the opinion of Lura et
al (2006), the particle influence on the initial expansion mainly during the first day of measurement
and that the small-sized SAP particles released IC-water less promptly at early ages, thus the bulk of
the SAP acted as the main water reservoir. At the doubled level of SAP addition (0.6% bwoc) and extra
water sufficient for complete prevention of self-desiccation in the first two weeks, the effect of
particle size became less pronounced (Lura et al., 2006). Esteves (2009) findings affirm that smaller
particles reached saturation more rapidly but absorbed less water as compared to larger particles of the
same chemical composition and production process.
The work of Geiker et al., (2004) is one of the few investigations of SAP effect on mortars. Their
study showed that addition of small quantity of SAP (0.4% bwoc) is as efficient in mitigating
autogenous shrinkage as the replacement of a considerable amount (20%) of normal weight aggregate
by LWA.
Research works on effect of SAP as IC-agent in concrete (specifically HPC and UHPC) on
autogenous deformation mitigation has shown similar trends as found for cement pastes and mortar.
Ingarashi & Watanabe (2006) studied a 0.25 W/C concrete containing 10% SF (bwoc), river gravel of
10 mm maximum aggregate, natural river sand, a Polycarboxylate ether (PCE) superplasticiser with
an acrylamide/acid copolymer SAP powder added as IC-agent (0.35% bwoc, IC water to cement ratio
(WIC/C) of 0.05 which is sufficient enough to saturate the SAP particles). The authors reported that
the moderate SAP addition led to reduction of autogenous shrinkage but doubling the amount of SAP
resulted in the concrete exhibiting a small expansion during the initial 24 hours, which was
maintained up to the 7 days age. Another concrete of higher W/B of 0.3 experienced a smaller
autogenous shrinkage than the reference mixture (0.25 W/B), which was far larger than that of same
0.3 W/B concrete with SAP incorporated as IC-agent. Thus, the autogenous shrinkage reduction in
concrete containing SAP was clearly shown to result from the effective IC with SAP and not from the
Stellenbosch University https://scholar.sun.ac.za
45
possible increase in effective W/C which could have been due to a smaller than the expected water
absorption by SAP (Ingarashi & Watanabe, 2006).
Mechtcherine et al. (2006), working with self-compacting fibre reinforced high performance concrete
(SFRHPC) and Dudziak & Mechtcherine (2008) with UHPC, further revealed that concrete mixtures
containing SAP and extra water exhibit pronounced reduction shrinkage deformations which were
particularly dramatic at very early age (i.e. the first 12 hours after final set). The results showed that
the reduction was up to 64% for 0.3% bwoc SAP plus extra water (WIC/C of 0.04 and 0.05,
respectively) in the first day of measurement with increasing amounts of SAP and additional water
(e.g. from 0.3% bwoc SAP, WIC/C of 0.04 and 0.05 to 0.4% bwoc SAP, WIC/C of 0.07; 1.0% bwoc SAP,
WIC/C of 0.16). More considerable reduction in autogenous shrinkage deformations as recorded in
Mechtcherine et al., (2009) was observed making the autogenous shrinkage of the UHPC mixtures
negligible. The degree of internal curing was adjudged as causing the changes in the development of
the autogenous shrinkage over time beyond the first few days. The strain curves were noted to follow
approximately the same trend at the beginning (one or two days) with or without SAP addition, while
curing effect of the entrained water continued to work even at concrete ages higher than the mere first
few days especially in mixes with smaller quantity of SAP plus additional water (Mechtcherine &
Reinhardt, 2012).
2.5.4.3 Drying shrinkage
Drying Shrinkage is the progressive loss of gel water to the surrounding environment over a long time
by concrete kept in drying conditions. The cement paste is known to shrink more than mortar and
mortar shrinks more than concrete. Aggregate size also contributes to the extent of concrete
shrinkage. Concrete made with smaller size aggregate shrinks more than concrete made with bigger
size aggregate. Drying shrinkage is also a function of the gel fineness. Finer gel results in higher
shrinkage ((Mechtcherine & Reinhardt, 2012).
Jensen & Hansen (2002) are among the few researchers that examined the effect of SAP as an IC-
agent on both autogenous shrinkage and drying shrinkage of cement pastes. Working with 0.3 W/B
Stellenbosch University https://scholar.sun.ac.za
46
pastes exposed to drying (RH = 50%, T = 20oC), taking the specimens out of corrugated moulds at
approximately 4.5 months, the authors showed that the drying shrinkage increased for SAP modified
pastes, while autogenous shrinkage decreased drastically. The negative effect of IC on drying
shrinkage was reported not to have significant influence on the total deformations, which decreased
clearly with increasing SAP content and extra water in the mixtures (Jensen & Hansen, 2002).
Reinhardt & Mönnig (2006) studied the effect of IC on total shrinkage of concrete adopting two
reference mixtures (0.36 W/C and 0.42 W/C). The 0.36 W/C concrete was modified with a
suspension-polymerised particles of SAP (0.7% bwoc) and extra water to arrive also at 0.42 W/C (i.e.
0.36 + 0.06), while pre-saturated LWA was used as IC in another mixture for comparative study. The
authors reported decreased total shrinkage values in the SAP modified concrete when compared to the
two reference mixtures. According to Reinhardt & Mönnig (2006), the shrinkage reducing effect of
SAP on the shrinkage rate of concrete within the first week was a result of the densification of the
paste and the binding of the water by the polymers.
Mechtcherine et al. (2009), from their study of effect of IC on total shrinkage of fine-grained UHPC
observed an increase in total shrinkage in the SAP-modified mixtures. An increase in the amount of
curing water resulted in an increase in total shrinkage. This according to the authors can be attributed
significantly to higher drying shrinkage in the case of concretes containing IC-agents as caused by the
presence of a larger amount of free water in the SAP-modified concretes. The reduction in autogenous
shrinkage of the concretes containing SAP as IC-agents was more pronounced than the total shrinkage
due to IC (Mechtcherine et al., 2009).
2.5.5 Effect of SAP on Mechanical Properties of Concrete
Utilisation of SAP mainly as IC-agent in HSC/HPC aimed at mitigation of self-desiccation caused
autogenous shrinkage has some accompanying effect of moderate strength reduction especially at the
early ages because of higher porosity and moisture of the specimens (for those tested after sealed
curing). According to the Mechtcherine & Reinhardt, (2012), SAP-enriched specimens tested at age
of maturity sometimes indicate higher strength and elastic modulus than the mixtures without SAP.
Stellenbosch University https://scholar.sun.ac.za

47
The strength increase is possibly due to enhanced cement hydration caused by the IC, which
compensate for strength reduction from the slightly higher porosity (Mechtcherine & reinhardt, 2012.
Effect of IC by means of SAP on other mechanical properties of concrete such as tensile strength
(uniaxial, bending and splitting) and elastic properties have been investigated and reported to some
extent in literature while no record on studies on creep and fracture mechanics characteristics of
concrete with SAP are known (Mechtcherine & Reinhardt, 2012).
Another possible application of SAP is as a water reducing agent (WR-agent). The fast water
absorption of SAP within the first few minutes of mixing after contact with water results in decrease
of the effective W/C in the cement matrix leading to a strength increase of the hardened concrete
(Mechtcherine & Reinhardt, 2012). According to the report by RILEM TC 225 – SAP (Mechtcherine
& Reinhardt, 2012), the tensile strength and elastic modulus of the concrete are expected to increase
as well, but this is not always the case, especially in HPC mixtures. The available research results as
compiled in the report and other literature on effect of SAP addition as IC-agent on mechanical
properties of concrete are discussed in the following grouped sections.
2.5.5.1 SAP effect on compressive strength
The outcome of the International RILEM Conference on Use of Superabsorbent Polymer and other
New Additives in Concrete – PRO 74 presented diverse opinions by researchers on the effect of SAP
on concrete. Although all affirmed that SAP is effective in mitigating autogenous shrinkage, the views
on its effect on concrete strength differs; some argued that SAP incorporation leads to strength
reduction and others were of the view that it enhance strength increase.
The view of the various researchers revealed that much remains to be done for a good understanding
and utilisation of SAP in concrete construction. The beneficial contribution of SAP to mitigation of
autogenous shrinkage in cement paste, mortar and concrete has been generally agreed on. Many
researchers were however of the view that complete prevention was not always attained (Craeye et al.,
2010; Ingarashi & Watanabe, 2006). In their study, Siramanont, et al. (2010) succinctly emphasise the
need for an understanding of the SAP structure for a study of its impact on the IC mechanisms.
Stellenbosch University https://scholar.sun.ac.za
48
Mechtcherine & Reinhardt, (2012) states the resulting strength of concrete with SAP as generally
depending on curing conditions, age and material composition. Jensen & Hansen (2002) reported a
19% compressive strength reduction due to SAP addition in mortar (0.6% bwoc SAP) when compared
to the reference mixture (0.3 W/C), both specimen were subjested to 1 day sealed curing, followed by
27 days of water curing at 20oC. Bentz et al. (2002) obtained higher or equal later age strength in
mortar with SAP (adding extra W/C of 0.046 for IC) compared to the reference mortar.
Mönnig (2005) conducted compressive strength tests on reference 0.55 W/C mortar with addition of
different SAP types as part of an attempt to study freeze-thaw resistance of normal-strength mortar.
The author concluded that there is no significant difference in the compressive strength development
of mortars at different W/C using different SAP types. The W/C of the reference mortar mixture
(0.55) is rather high and not typical for traditional SAP applications in high strength cement-based
materials.
Craeye & De Schutter (2006) reported strength reduction of concrete containing SF (0.32 W/B) at
different SAP contents (with an estimated SAP absorption capacity of 134 g/g). The strength
reduction was noted to be very pronounced at higher SAP dosages and contents of entrained water
(We). Another experiment condusted in the same laboratory (Craeye et al., 2010) with another type of
SAP (with estimated absorption capacity of 45 g/g) showed similarly significant reduction in the 28
days compressive strength. The authors of the two studies above were however believed to have
overestimated the SAP absorption capacity and thus added too much water into the concrete leading
inevitably to the strength reduction (Mechtcherine & Reinhardt, 2012; Hasholt et al., 2012).
Lam & Hooton (2005) in a study of IC effects adopting 0.35 W/C reference concrete with two SAP
contents (0.3% and 0.6% bwoc) to which the same amount of extra water (We/C = 0.10) was provided
reported that SAP introduction reduced the compressive strength. The mixture with 0.3% bwoc SAP
addition has the lowest strength while the highest was obtained in the reference (0.35 W/C) mixture.
The strength of the mix with 0.6% SAP (bwoc) was found to be same (approximately) as that of the
0.45 W/C reference mixture, to which it can be said to have equivalent porosity and microstructure as
characterised by the combination of capillary porosity and degree of hydration (Mechtcherine &
Stellenbosch University https://scholar.sun.ac.za
49
Reinhardt, 2012). According to Mechtcherine & Reinhardt (2012), it can be assumed that the negative
effect of additional voids induced by SAP particles addition was compensated by the improved degree
of hydration in the mix containing 0.6% SAP (bwoc).
Studies on compressive strength of cement pastes and concrete (basic W/C of 0.25) with or without
SAP was conducted by Ingarashi & Watanabe (2006) using mono-sized spherical particles (200 µm
diameter size) of acrylamide/acrilic acid copolymer having absorption capacity of about 13 g/g. The
result showed that SAP introduction in the specimens (both paste and concrete) resulted in
compressive strength decrease. The lower the W/C, the more sensitive the materials to the quantity of
SAP added (Ingarashi & Watanabe, 2006). Piérard et al., (2006) measured compressive strength of
0.35 W/B concrete cubes containing SF and two SAP contents (0.3% and 0.6% bwoc) cured at 20±2oC
temperature, 95% minimum RH for 2, 7 and 28 days curing ages. The results showed that SAP
addition slowed down the early strength development (2-7 days) and a reduction of 7% and 13% for
the 0.3% and 0.6% SAP-modified mixtures respectively at the 28 days curing (Piérard et al., 2006).
According to the authors, strength losses can be attributed to the increased porosity of the concrete
due to empty voids left behind by swollen SAP particles after desorption of the absorbed water. The
SAP-enriched mixtures were viewed to have possibility of showing similar or higher strength, as the
hydration proceeds at higher rate due to the higher RH maintained in the specimens (Piérard et al.,
2006).
Lura et al., (2006) from the study of pastes mortars with or without silical fume, reported that SAP
incorporation as an IC-agent had no significant influence on the compressive strength of high
performance mortars (HPM), while the compressive strength of paste was reduced by 20% at the early
age and 10% at later ages (up to 56 days). Largest aggregate size (resulting in largest defects),
significantly larger than SAP particles was seen by the authors as responble for the differences in
effect of SAP addition. Lura et al., (2006) concluded that since aggregate or the ITZ and not cement
paste, are the limiting factor for mortar strength, SAP’s influence on strength of mortar and concrete
should be negligible.
Stellenbosch University https://scholar.sun.ac.za
50
In the list of authors with report of reduction of compressive strength due to SAP addition as IC-agent
in mortar and concrete are: Mechtcherine et al. (2006) – adopted 0.25 W/C reference mortar and
concrete with 0.4% bwoc SAP (0.29 W/C total); Esteves et al. (2007) – mortar mixes of different W/C
(0.25 – 0.35) under different curing conditions (30% to 100% RH at 20oC temperature and water
curing); and Wang et al. (2009) – observed that higher SAP content or entrained water in concrete
results to decreased compressive strength.
SAP containing UHPC (W/C 0.22) was reported by Mechtcherine et al. (2009) to show noticeable
compressive strength decrease at the early ages (1 – 7 days), but exhibited only slight decrease in
compressive strength at the 28 days for relatively small content of SAP (0.3% bwoc ) and extra water.
Considerable decrease in compressive strength was observed at higher (0.6% bwoc) SAP content.
In another study from the same laboratory, Dudziak & Mechtcherine (2008) reported that though SAP
addition resulted in reduction of compressive strength of UHPC, the effect is not pronounced when
the right quantity of extra water is added for IC purpose. Results of the experiments stated above
(Mechtcherine et al., 2009; Dudziak & Mechtcherine, 2008), with noticeable decrease of compressive
strength at early age , but only slight decrease at 28 days are consistent with the observed trend in
mortar and concrete adopting other IC approach (use of LWA and IC-agents, other than SAP) as
reported in RILEM Report 41 by TC-196 ICC (Kovler & Jensen (eds.), 2007). Internally cured
concrete was reported to experience increased compressive (or flexural) strength, compared to
reference mixes for concrete with LWA (Weber & Reinhardt, 1997; Lura, 2003; Zhutovsky et al.,
2004).
Possible reason for compressive strength enhancement with age by SAP and other IC-agents offered
in Mechtcherine & Reinhardt, (2012), is the improved degree of hydration of cement grains.
Reinhardt et al. (2008) suggested that the cement hydration products grows at later ages inside the
grain boundaries of swollen SAP particles, thus contributes to strength of the cement-based system at
maturity.
Craeye et al., (2010) studied the mechanical and thermal properties of HPC using different degrees of
IC and asserted in their conclusion that addition of SAP leads to a significant reduction of mechanical
Stellenbosch University https://scholar.sun.ac.za

51
strength and modulus of elasticity. Hasholt et al., (2012) in response to this argue that the conclusion
of Craeye et al., (2010) is misleading. In their view, the additional water added to required mixing
water to compensate for water absorbed by SAP in the concrete examined by Craeye et al., (2010)
was in excess of the absorption capacity of SAP; hence the water in the concrete was in excess of
what is required for complete hydration. This is said to be responsible for the significant reduction in
strength as recorded by Craeye et al., (2010). The appropriate determination of SAP absorption in
cement paste, mortar and concrete holds the key to good understanding of the influence of SAP
addtion on the compressive strength and other mechanical properties of the concrete.
Schrofl et al., (2012) examined the relationship between the molecular structure and efficiency of
SAP in the mitigation of autogenous shrinkage in concrete. Working with different SAP types, they
observed that the type of SAP and its water kinetics are relevant to mechanical properties of cement
paste, mortar and concretes. The work inferred that SAP with higher anion concentration performs
well in efficient mitigation of autogenous shrinkage and hence enhanced hydration leading to no or
moderate decrease in strength. Most of the studies above however (except few, for instance the works
of Hasholt, et al., (2010a & b) and Craeye, et al., (2011)) focussed on cement pastes and mortar.
Hasholt et al., (2010a & b) investigated the mechanical properties of concrete with emphasis on the
compressive strength and elastic modulus using concrete specimens with W/B ranges of 0.35 - 0.50
varying the proportion of SAP between 0% and 0.06% cured in water up to 28 days. They modelled
the effect of SAP on concrete strength and elastic modulus by combining Bolomey’s formula and
Powers’ model and observed that the net effect of SAP (negative or positive) depends on the mix
design and curing age (Hasholt et al, 2010a &b). They also concluded that SAP has little effect on
hydration and hence leads to reduced strength when the W/B is high (> 0.45) especially at early ages
and large SAP additions. Concrete specimen with low W/B ratio and low SAP addition are said to
experience compressive strength increase at later ages (Hasholt et al., 2010a).
Stellenbosch University https://scholar.sun.ac.za

52
2.5.5.2 SAP effect on tensile strength
Tensile strength is considered a good indication of the crack resistance and depends majorly on the
existing micro-cracks which often provoke formation of macro-cracks under tensile stresses. Tensile
strength can be determined through different loading types – uniaxial, flexural (bending) and splitting.
Mechtcherine & Reinhardt (2012) presents a review of studies on the effect of SAP on tensile strength
of concrete, some extracts of which are as follows:
Many researchers reported reduction in the tensile strength similar to the compressive strength
reported earlier (Section 2.5.5.1) despite difference of their specimen and test procedure
(Mechtcherine et al., 2006; Ingarashi & Watanabe 2006; Dudziak & Mechtcherine, 2008).
Mechtcherine et al. (2006) measured uniaxial tensile strength on special dog-bone shaped prism
(40x24 mm cross section by 80 mm long) with non-rotatable loading plates. Flexural strength test was
also conducted on beams (40x40 mm cross section by 160 mm long) using a 120 mm span. SAP
addition was reported to result in decrease in tensile strength, similar to the trend observed for
compressive strength. The uniaxial tensile strength was determined on oven-stored specimen for 0.25
W/C concrete at ages 7 and 28 days. Dudziak & Mechtcherine’s (2008) work was on bending strength
of low W/C UHPC cured internally by SAP addition with extra water.
Mortar mixes of different W/C (0.25 to 0.35) were tested under different curing condition (ranging
from 30% to 100% RH at 20oC) by Esteves et al. (2007). Although the type of tensile strength
conducted was not mentioned, an approximately 30% reduction in tensile strength was reported for
the SAP-modified mortars in the study. The test results for mortar subjected to adverse curing
conditions were more favourable for the SAP mixes, having some cases of higher tensile strength than
the reference mixtures at the 28 days (Esteves et al., 2007). Result of the splitting tensile strength
experiments conducted by Lam and Hooton (2005) on different IC materials showed a different trend
from that obtained under compression. The specimen from 0.35 W/C reference concrete was better at
ages 3 to 7 days, as in the compressive strength tests. The mixture made with 0.6% bwoc SAP content
gave the best result for splitting tensile strength at the 28 days, far better than the reference mixture
(0.3% bwoc SAP-containing mixture been argued as having too much entrained water). Based on this
Stellenbosch University https://scholar.sun.ac.za

53
finding, the highest tensile strength of the SAP-modified concrete at the 28 days was explained by
Mechtcherine & Reinhardt (2012) as resulting from the fact that SAP, in parallel to shrinkage
mitigation, successfully increase the tensile cracking resistance of the cement-based system. The
review above shows that the technique adopted for conducting the tensile strength can influence the
result obtained, as also the SAP contents and the amount of entrained water.
2.5.5.3 Effect of SAP on elastic properties
Elastic moduli of internally cured ultra high performance mortars (UHPM) and concretes as reported
by Dudziak and Mechtcherine (2010) showed no significant difference when compared with those of
reference mixtures. The W/C in the reference mixtures were 0.22, while the additional water for IC
was based on We/C = 0.04 for the SAP-modified mixtures. The E-modulus values obtained by the
authors for the respective mixtures are: UHPM – 48.8 GPa at 28 days, 0.3% bwoc SAP internally cured
mixture – 46.8 GPa, steel reinforced fibre UHPC – 54.7 GPa and the SAP-enriched UHPC – 53.4 with
a standard deviation of ≤ 1.35 GPa. This shows clearly that only a slight decrease of E-modulus was
experienced by SAP addition.
Hasholt et al. (2010b) observed that though the outcome of their test on modulus of elasticity reflects
that the theoretical models for mechanical properties work as well for concrete with SAP as for
concrete without, there is need for further studies with more empirical models.
2.6 Mechanical Behaviour of HPC
Mechanical behaviour of HPC refers to the characteristic quality, traits or distinctive features of HPC
often determined by use of equipment to ascertain its meeting some of the basic performance
requirements. In general the mechanical properties often examined for HPC are compressive strength,
flextural strength (or modulus of rupture), splitting tensile strength and elastic modulus (Hueste, et al.,
2004).
Stellenbosch University https://scholar.sun.ac.za
54
HPC application has been noted to be necessitated by some basic performance requirements which
the NSC cannot offer as listed in Section 2.2.2. Amongst these are the strength and elastic modulus
characteristics which are often placed as a demand in HPC mixes.
The strength properties of concrete can be said to comprise compressive and tensile strength, while
tensile strength can be of three types; flexural, splitting and direct. This study shall investigate the
compressive strength, elastic modulus, splitting tensile strength and fracture energy of HPC.
Studies on mechanical properties of HPC with SAP are scarce in literature. The works of Craeye &
De Schutter (2006), Craeye et al., (2010) and Hasholt, et al., (2010a, b & 2012) are amongst the few
that looks at SAP inclusion in actual concrete (not cement paste or mortar). Hasholt et al., (2012)
however argued that the assumed swelling ratio of SAP used by Craeye et al., (2010) leads to excess
additional mixing water used in their concrete that contains SAP hence their conclusion on SAP
causing a decrease in strength is mis-leading.
The work of Hasholt et al., (2010a & b), is of particular interest to this study. Hasholt et al., (2010a &
b) studied the mechanical properties of concrete with SAP with emphasis on compressive strength and
elastic modulus and examined the compatibility of the results with the Powers’ Model. The concrete
samples studied were noted to be those with 0.35 to 0.50 W/B; this cannot actually be classified as
HPC according to the definitions offered above, while the concern on autogenous shrinkage is
basically to be an issue with concrete having low W/B (i.e. less than or equal to 0.35 W/B).
There is need for simulating the water absorption of SAP into the existing model (i.e. the Powers’
Model) for strength and elastic properties of concrete and specifically the HPC with characteristic
strength C55/67 – C100/115 as provided for in the EC2 which adoption in South Africa is currently
being envisaged. The need for a good understanding of the effect of SAP addition on the micro-
structure and molecular interraction of the constituent materials will be handy in explaining the
mechanical behaviour of HPC of very low W/B (0.20 to 0.35). This study thereby is an attempt to fill
the gap in literature with a focus on the effect of SAP incorporation on the mechanical behaviour of
HPC with W/B values between 0.2 and 0.30, having a minimum 70 MPa, 28 day cube strength
(C55/67 – C100/115) in both the fresh and hardened states.
Stellenbosch University https://scholar.sun.ac.za

55
2.7 Existing Models on Mechanical Properties of HPC
Mechanical properties of concrete can be influenced by many factors such the material constituents;
cement/binder type; proportion of mixing water (W/B); porosity and the curing environment aside
material handling and mixing as mentioned in Section 2.5. Previous works have emanated
mathematical expressions relating mechanical properties of concrete to some of the factors
highlighted above and this section presents a review of these models.
2.7.1 Powers’ Model
Studies on mechanical behaviour of concrete are rooted in the work of Powers and Brownyard (1947)
referred to as the Powers’ Model. This states that the principal factors governing the ultimate degree
of hydration regardless of the time required are the relative proportion of particles having mean
diameters greater than about 50 µm and the original water-cement ratio. It was further argued that
cements having no particles larger than 50 µm (or thereabout), becomes completely hydrated if W/C
is not too low (i.e. W/C ≥ 0.4). Ultimate degree of hydration (αmax) is said to be inversely
proportional to the 325-mesh residue (particles ≥ 44 µm). The work deduced that at a limiting average
W/C value of about 0.44 (bwoc); αmax is proportional to the water content of the paste in all cement
pastes. Pastes with low W/C are said to experience lower rate of hydration except during the short
initial period and hence require longer time for ultimate hydration (Powers & Brownyard, 2003a & b).
Cement gel is composed of hydration products that contain all the principal oxides (CaO, SiO2, Al2O3
and Fe2O3). The total surface area of the solid phases is related to the computed cement composition
by:
𝑉𝑚 = 0.230(𝐶3𝑆) + 0.320(𝐶2𝑆) + 0.317(𝐶3𝐴) + 0.368(𝐶4𝐴𝐹) (2.3)
where: 𝐶3𝑆 is a short hand notation for 3𝐶𝑎𝑂. 𝑆𝑖𝑂2 (i.e. Tricalcium silicate); 𝐶2𝑆 is a short hand
notation for 2𝐶𝑎𝑂. 𝑆𝑖𝑂2 (i.e. Dicalcium silicate); 𝐶3𝐴 is a short hand notation for 3𝐶𝑎𝑂. 𝐴𝑙2𝑂3 (i.e.
Tricalcium aluminate) and 𝐶4𝐴𝐹 is a short hand notation for 4𝐶𝑎𝑂. 𝐴𝑙2𝑂3. 𝐹𝑒2𝑂3 (i.e. Tetracalcium
aluminate).
Stellenbosch University https://scholar.sun.ac.za
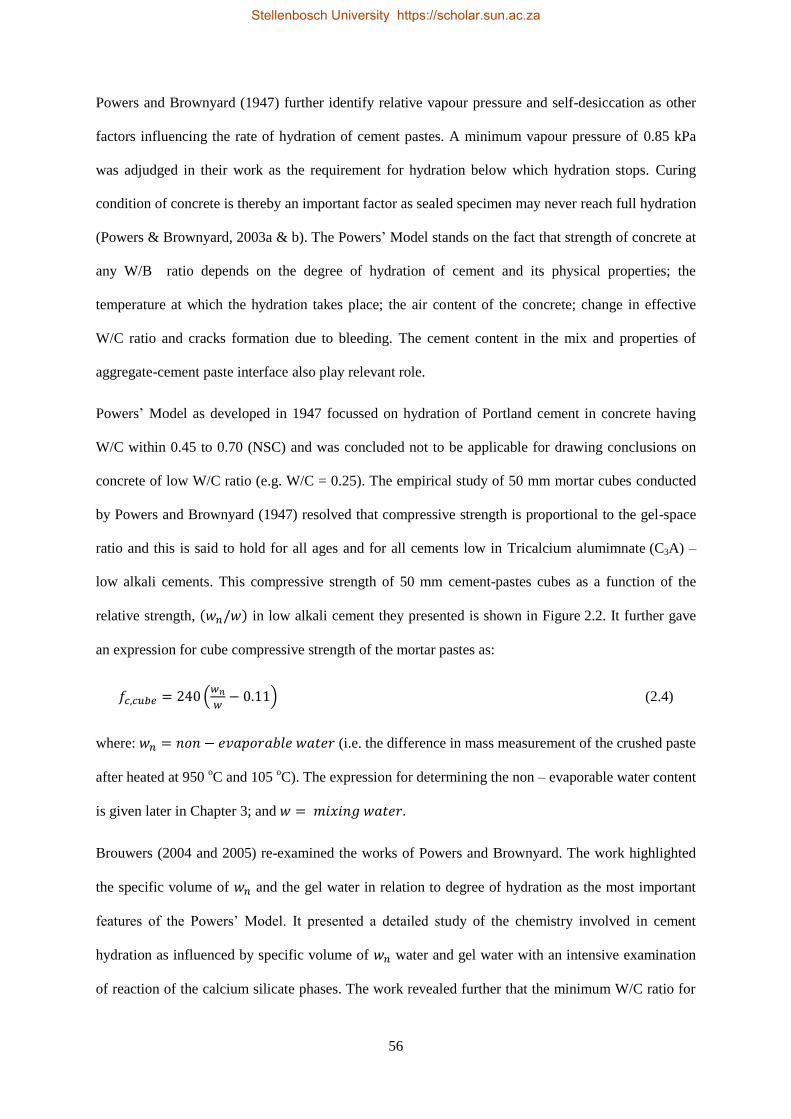
56
Powers and Brownyard (1947) further identify relative vapour pressure and self-desiccation as other
factors influencing the rate of hydration of cement pastes. A minimum vapour pressure of 0.85 kPa
was adjudged in their work as the requirement for hydration below which hydration stops. Curing
condition of concrete is thereby an important factor as sealed specimen may never reach full hydration
(Powers & Brownyard, 2003a & b). The Powers’ Model stands on the fact that strength of concrete at
any W/B ratio depends on the degree of hydration of cement and its physical properties; the
temperature at which the hydration takes place; the air content of the concrete; change in effective
W/C ratio and cracks formation due to bleeding. The cement content in the mix and properties of
aggregate-cement paste interface also play relevant role.
Powers’ Model as developed in 1947 focussed on hydration of Portland cement in concrete having
W/C within 0.45 to 0.70 (NSC) and was concluded not to be applicable for drawing conclusions on
concrete of low W/C ratio (e.g. W/C = 0.25). The empirical study of 50 mm mortar cubes conducted
by Powers and Brownyard (1947) resolved that compressive strength is proportional to the gel-space
ratio and this is said to hold for all ages and for all cements low in Tricalcium alumimnate (C3A) –
low alkali cements. This compressive strength of 50 mm cement-pastes cubes as a function of the
relative strength, (𝑤𝑛/𝑤) in low alkali cement they presented is shown in Figure 2.2. It further gave
an expression for cube compressive strength of the mortar pastes as:
𝑓𝑐,𝑐𝑢𝑏𝑒 = 240 (𝑤𝑛
𝑤− 0.11) (2.4)
where: 𝑤𝑛 = 𝑛𝑜𝑛 − 𝑒𝑣𝑎𝑝𝑜𝑟𝑎𝑏𝑙𝑒 𝑤𝑎𝑡𝑒𝑟 (i.e. the difference in mass measurement of the crushed paste
after heated at 950 oC and 105
oC). The expression for determining the non – evaporable water content
is given later in Chapter 3; and 𝑤 = 𝑚𝑖𝑥𝑖𝑛𝑔 𝑤𝑎𝑡𝑒𝑟.
Brouwers (2004 and 2005) re-examined the works of Powers and Brownyard. The work highlighted
the specific volume of 𝑤𝑛 and the gel water in relation to degree of hydration as the most important
features of the Powers’ Model. It presented a detailed study of the chemistry involved in cement
hydration as influenced by specific volume of 𝑤𝑛 water and gel water with an intensive examination
of reaction of the calcium silicate phases. The work revealed further that the minimum W/C ratio for
Stellenbosch University https://scholar.sun.ac.za
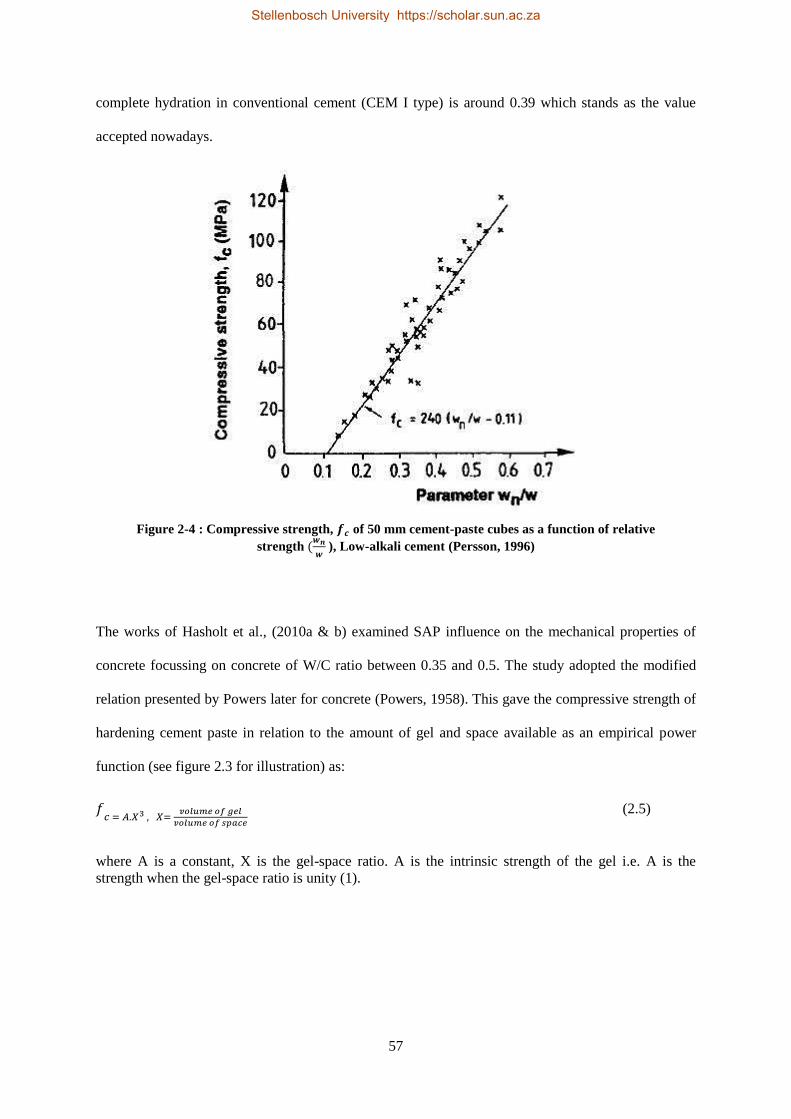
57
complete hydration in conventional cement (CEM I type) is around 0.39 which stands as the value
accepted nowadays.
Figure 2-4 : Compressive strength, 𝒇𝒄 of 50 mm cement-paste cubes as a function of relative
strength (𝒘𝒏
𝒘 ), Low-alkali cement (Persson, 1996)
The works of Hasholt et al., (2010a & b) examined SAP influence on the mechanical properties of
concrete focussing on concrete of W/C ratio between 0.35 and 0.5. The study adopted the modified
relation presented by Powers later for concrete (Powers, 1958). This gave the compressive strength of
hardening cement paste in relation to the amount of gel and space available as an empirical power
function (see figure 2.3 for illustration) as:
𝑓𝑐 = 𝐴.𝑋3 , 𝑋=
𝑣𝑜𝑙𝑢𝑚𝑒 𝑜𝑓 𝑔𝑒𝑙
𝑣𝑜𝑙𝑢𝑚𝑒 𝑜𝑓 𝑠𝑝𝑎𝑐𝑒
(2.5)
where A is a constant, X is the gel-space ratio. A is the intrinsic strength of the gel i.e. A is the
strength when the gel-space ratio is unity (1).
Stellenbosch University https://scholar.sun.ac.za
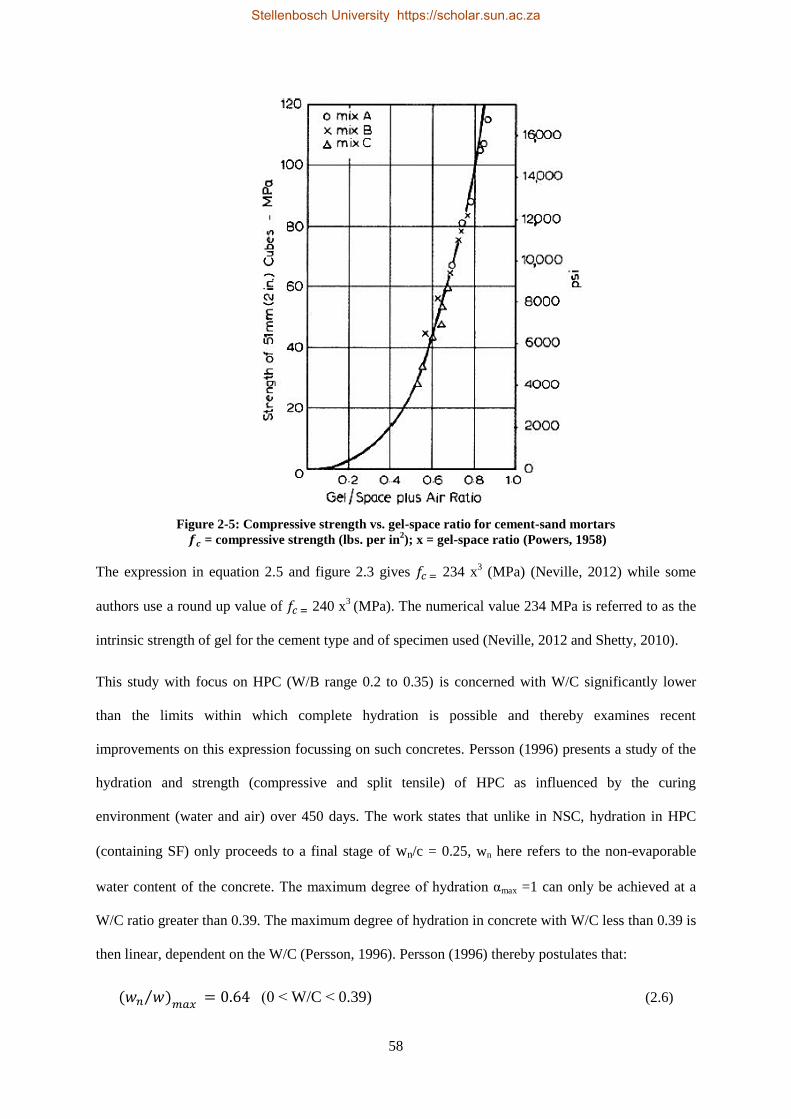
58
Figure 2-5: Compressive strength vs. gel-space ratio for cement-sand mortars
𝒇𝒄 = compressive strength (lbs. per in2); x = gel-space ratio (Powers, 1958)
The expression in equation 2.5 and figure 2.3 gives 𝑓𝑐 = 234 x3 (MPa) (Neville, 2012) while some
authors use a round up value of 𝑓𝑐 = 240 x3
(MPa). The numerical value 234 MPa is referred to as the
intrinsic strength of gel for the cement type and of specimen used (Neville, 2012 and Shetty, 2010).
This study with focus on HPC (W/B range 0.2 to 0.35) is concerned with W/C significantly lower
than the limits within which complete hydration is possible and thereby examines recent
improvements on this expression focussing on such concretes. Persson (1996) presents a study of the
hydration and strength (compressive and split tensile) of HPC as influenced by the curing
environment (water and air) over 450 days. The work states that unlike in NSC, hydration in HPC
(containing SF) only proceeds to a final stage of wn/c = 0.25, wn here refers to the non-evaporable
water content of the concrete. The maximum degree of hydration αmax =1 can only be achieved at a
W/C ratio greater than 0.39. The maximum degree of hydration in concrete with W/C less than 0.39 is
then linear, dependent on the W/C (Persson, 1996). Persson (1996) thereby postulates that:
(𝑤𝑛 𝑤)⁄𝑚𝑎𝑥
= 0.64 (0 ˂ W/C ˂ 0.39) (2.6)
Stellenbosch University https://scholar.sun.ac.za

59
and
(𝑤𝑛 𝑤)⁄𝑚𝑎𝑥
= 0.25 × 𝑐/𝑤 (W/C ˃ 0.39) (2.7)
Persson (1996) developed a modified relation between relative hydration and compressive cylinder
strength of HPC (with or without SF) as:
𝑓𝑐,𝑐𝑦𝑙= 260 × (
𝑤𝑛
𝑤− 0.085) (No SF; R
2 = 0.93) (2.8)
and
𝑓𝑐,𝑐𝑦𝑙= 310 × (ln 𝑡 × (0.030 − (
𝑤𝑛
𝑤− 0.46)2) − 2.25 × (
𝑤𝑛
𝑤− 0.54)
2
+ 0.31)
(10% SF; R2 = 0.97) (2.9)
Where: 𝑤𝑛 is the non-evaporable water content of concrete (kg/m3), 𝑤 is the mixing water, c is the
cement content of the concrete (kg/m3) and 𝑓𝑐,𝑐𝑦𝑙
is the cylinder strength of concrete.
2.7.2 Bolomey’s Model
Bolomey’s model is an expression which gives a relation between the water-cement ratios to
compressive strength in normal weight concretes. The original expression postulated by Bolomey
(1935) as shown in Equation 2.10 is basically a linear equation with little or no consideration for
neither parameters relating to coarse aggregate nor the air content in the concrete.
𝑓𝑐 = A (1 𝑊/𝐶)⁄ + B (2.10)
where: A & B are constants for given sets of materials; W/C is the water-cement ratio while 𝑓𝑐 is the
cylinder compressive strength of concrete.
There have however been variations of the Bolomey’s Equation (2.10) in literature to suit particular
types of concrete with the most common for practical grades of concrete (Brandt, 1995a & b) shown
as:
𝑓𝑐 = A ( (1 𝑊/𝐶) − 0.5⁄ ) (2.11)
where: the value of B is taken as -0.5 * A.
Stellenbosch University https://scholar.sun.ac.za
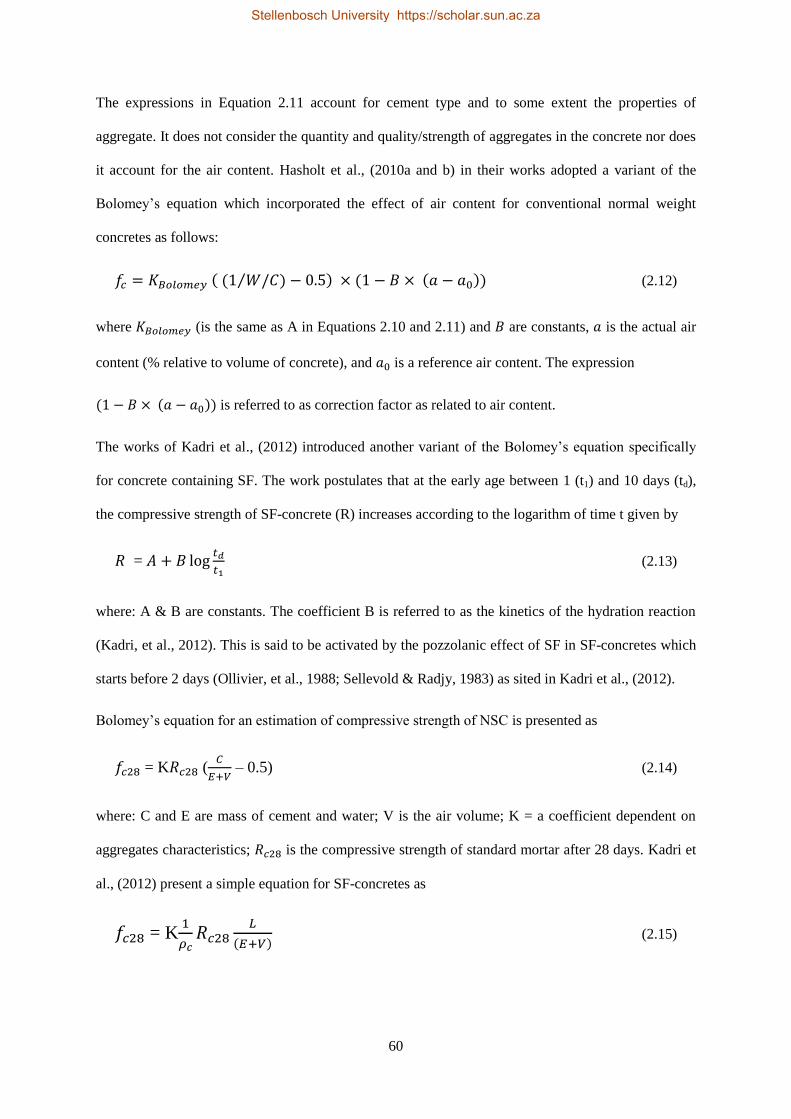
60
The expressions in Equation 2.11 account for cement type and to some extent the properties of
aggregate. It does not consider the quantity and quality/strength of aggregates in the concrete nor does
it account for the air content. Hasholt et al., (2010a and b) in their works adopted a variant of the
Bolomey’s equation which incorporated the effect of air content for conventional normal weight
concretes as follows:
𝑓𝑐 = 𝐾𝐵𝑜𝑙𝑜𝑚𝑒𝑦 ( (1 𝑊/𝐶) − 0.5⁄ ) × (1 − 𝐵 × (𝑎 − 𝑎0)) (2.12)
where 𝐾𝐵𝑜𝑙𝑜𝑚𝑒𝑦 (is the same as A in Equations 2.10 and 2.11) and 𝐵 are constants, 𝑎 is the actual air
content (% relative to volume of concrete), and 𝑎0 is a reference air content. The expression
(1 − 𝐵 × (𝑎 − 𝑎0)) is referred to as correction factor as related to air content.
The works of Kadri et al., (2012) introduced another variant of the Bolomey’s equation specifically
for concrete containing SF. The work postulates that at the early age between 1 (t1) and 10 days (td),
the compressive strength of SF-concrete (R) increases according to the logarithm of time t given by
𝑅 = 𝐴 + 𝐵 log𝑡𝑑
𝑡1 (2.13)
where: A & B are constants. The coefficient B is referred to as the kinetics of the hydration reaction
(Kadri, et al., 2012). This is said to be activated by the pozzolanic effect of SF in SF-concretes which
starts before 2 days (Ollivier, et al., 1988; Sellevold & Radjy, 1983) as sited in Kadri et al., (2012).
Bolomey’s equation for an estimation of compressive strength of NSC is presented as
𝑓𝑐28 = K𝑅𝑐28 (𝐶
𝐸+𝑉 – 0.5) (2.14)
where: C and E are mass of cement and water; V is the air volume; K = a coefficient dependent on
aggregates characteristics; 𝑅𝑐28 is the compressive strength of standard mortar after 28 days. Kadri et
al., (2012) present a simple equation for SF-concretes as
𝑓𝑐28 = K1
𝜌𝑐𝑅𝑐28
𝐿
(𝐸+𝑉) (2.15)
Stellenbosch University https://scholar.sun.ac.za

61
where: 𝜌𝑐 is the relative density of the cementitious material and L is the effective cementitious
content such that L = C + ∝ (𝑠𝑓 𝑐⁄ ) C. The function ∝ (𝑠𝑓 𝑐⁄ ) is referred to by Kadri et al., (2012) as
the SF contribution in cement “equivalent” to compressive strength of concrete. The efficiency of SF
is assumed to be linked to the presence of cement and only depends on 𝑠𝑓 𝑐⁄ ratio. The experimental
work of Kadri et al., (2012) on compressive strength of standardised mortar thereby led to
∝ (𝑠𝑓 𝑐⁄ ) = 0.36 - [2.1(𝑠𝑓 𝑐⁄ ) 0.6]2 (2.16)
Substituting Equation 2.16 and V = y 𝐸 (an account for air volume) into Equation 2.15 gives a
generalised equation at any time as:
𝑓𝑐 (t) = K𝑅𝑐28 𝐶
(𝑦+1)𝐸 * {𝐴(𝑡) + 1.36 − [2.1 (
𝑠𝑓
𝐶)
2
− 0.6]2
} (2.17)
where: K depends on aggregates and is to be calculated from reference concrete strength without SF
at 28 days; 𝐴(𝑡) is a kinetic function determined from the reference concrete at a time t which ranges
between 0 and 28 days; y is a coefficient dependent on concrete type having the following values:
0.13 for firm concrete, 0.10 for plastic concrete and 0.07 for very plastic or fluid concrete.
This modified model by Kadri et al., (2012) valid for W/C less than 0.4 thereby gave the compressive
strength of SF-concrete at 28 day as
𝑓𝑐28 = 𝐾𝑅𝑐28
[1+3.1((𝐸𝐶⁄ )/(1.4−0.4 𝑒𝑥𝑝(−
11𝑠𝑓
𝑐))]
(2.18)
This study will examine the validity of this modified Bolomey’s equation for HPC (being a SF-
concrete) as combined with the Powers’ Model for predicting the mechanical behaviour of HPC
containing SAP as an IC-agent.
2.7.3 Constitutive Relations of Mechanical Properties of Concrete
The fib model code 2010 gives constitutive relations for the mechanical properties of concrete. The
compressive strength as presented in Table 2.1, serves as the reference to which other properties of
concrete are related. The highlights of the codes provisions can be presented as follows:
Stellenbosch University https://scholar.sun.ac.za
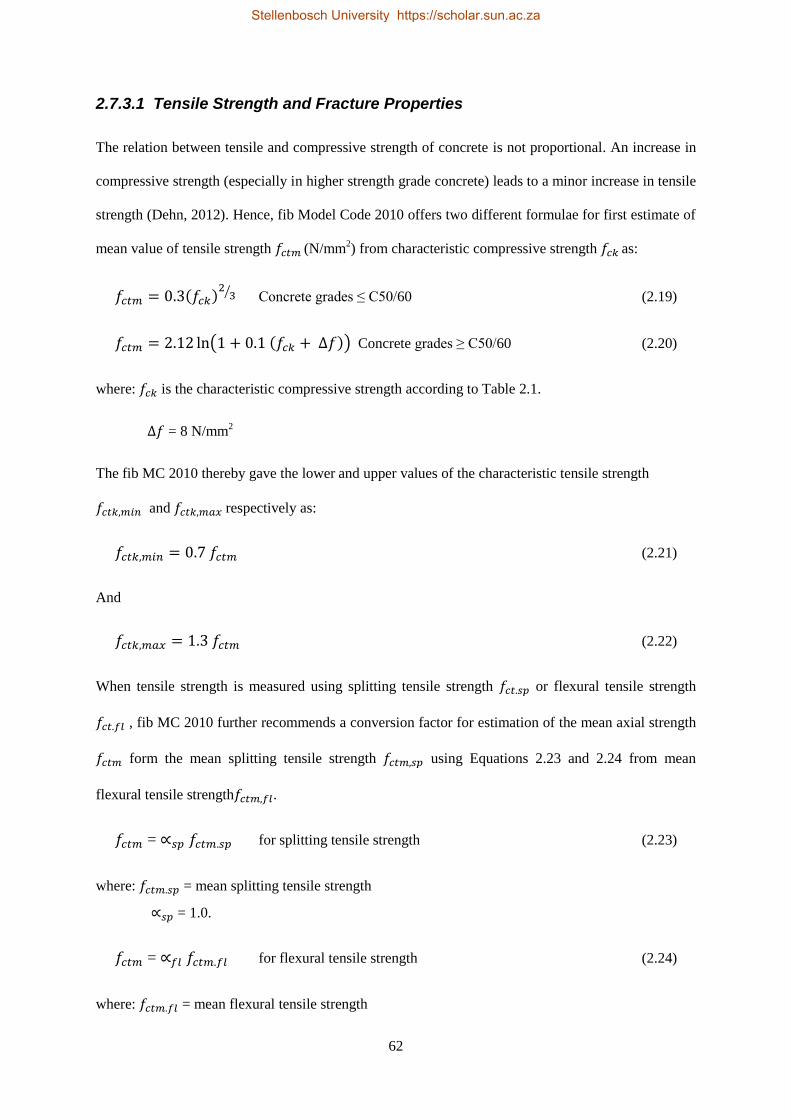
62
2.7.3.1 Tensile Strength and Fracture Properties
The relation between tensile and compressive strength of concrete is not proportional. An increase in
compressive strength (especially in higher strength grade concrete) leads to a minor increase in tensile
strength (Dehn, 2012). Hence, fib Model Code 2010 offers two different formulae for first estimate of
mean value of tensile strength 𝑓𝑐𝑡𝑚 (N/mm2) from characteristic compressive strength 𝑓𝑐𝑘 as:
𝑓𝑐𝑡𝑚 = 0.3(𝑓𝑐𝑘)2
3⁄ Concrete grades ≤ C50/60 (2.19)
𝑓𝑐𝑡𝑚 = 2.12 ln(1 + 0.1 (𝑓𝑐𝑘 + ∆𝑓)) Concrete grades ≥ C50/60 (2.20)
where: 𝑓𝑐𝑘 is the characteristic compressive strength according to Table 2.1.
∆𝑓 = 8 N/mm2
The fib MC 2010 thereby gave the lower and upper values of the characteristic tensile strength
𝑓𝑐𝑡𝑘,𝑚𝑖𝑛 and 𝑓𝑐𝑡𝑘,𝑚𝑎𝑥 respectively as:
𝑓𝑐𝑡𝑘,𝑚𝑖𝑛 = 0.7 𝑓𝑐𝑡𝑚 (2.21)
And
𝑓𝑐𝑡𝑘,𝑚𝑎𝑥 = 1.3 𝑓𝑐𝑡𝑚 (2.22)
When tensile strength is measured using splitting tensile strength 𝑓𝑐𝑡.𝑠𝑝 or flexural tensile strength
𝑓𝑐𝑡.𝑓𝑙 , fib MC 2010 further recommends a conversion factor for estimation of the mean axial strength
𝑓𝑐𝑡𝑚 form the mean splitting tensile strength 𝑓𝑐𝑡𝑚,𝑠𝑝 using Equations 2.23 and 2.24 from mean
flexural tensile strength𝑓𝑐𝑡𝑚,𝑓𝑙.
𝑓𝑐𝑡𝑚 = ∝𝑠𝑝 𝑓𝑐𝑡𝑚.𝑠𝑝 for splitting tensile strength (2.23)
where: 𝑓𝑐𝑡𝑚.𝑠𝑝 = mean splitting tensile strength
∝𝑠𝑝 = 1.0.
𝑓𝑐𝑡𝑚 = ∝𝑓𝑙 𝑓𝑐𝑡𝑚.𝑓𝑙 for flexural tensile strength (2.24)
where: 𝑓𝑐𝑡𝑚.𝑓𝑙 = mean flexural tensile strength
Stellenbosch University https://scholar.sun.ac.za

63
∝𝑓𝑙 = 0.06 ℎ𝑏
0.7
1+ 0.06 ℎ𝑏0.7 (2.25)
ℎ𝑏 = the beam depth.
A smaller value than 0.06 is however required for HSC/HPC in ∝𝑓𝑙 calculation from Expression 2.25.
The fracture energy GF (N/m), defined as energy required for propagating a tensile crack of unit area
is recommended to be determined from related tests with axial tensile strength adjudged most
appropriate (fib MC 2010). The MC 2010 offers that in the absence of experimental data, the fracture
energy for normal weight concrete may be estimated by the relation
𝐺𝐹 = 73𝑓𝑐𝑚0.18
(2.26)
where: 𝑓𝑐𝑚 = mean cylinder compressive strength in MPa = 𝑓𝑐𝑘+∆𝑓; ∆𝑓 = 8 MPa.
The factors influencing fracture energy (GF - values) of NSC as highlighted in literature are W/C ratio;
maximum aggregate size, age of concrete, curing condition, and size of structural members (Hu &
Wittmann, 1990; Mechtcherine & Müller, 1997; Wittmann et al., 1987; fib MC 2010). The same
factors’ influence on fracture energy applies to HPC but at a smaller magnitude. Hansen, et al., (1996)
argue that aggregate type and content seem to have the greatest influence on fracture energy of HPC
as a phenomenon caused by transition from interfacial fracture to trans-aggregate fracture. High
strength aggregates’ utilisation (e.g. Basalt or Granites) is said to lead to increased GF – values in HPC
(International Federation for Structural Concrete (fib), 2008) - fib Bull42, 2008). This is said to
impede crack propagation leading to concrete fracture such that breaking tougher aggregates, change
in crack orientation and multiplication of cracks all resulting in higher energy dissipation.
Fracture energy estimation from the compressive strength is given in CEB-FIP MC 90 (as sited in fib
Bull42 2008) as:
𝐺𝐹 = 𝐺𝐹𝑂 (𝑓𝑐𝑚
𝑓𝑐𝑚𝑜)
0.7
(2.27)
where: 𝐺𝐹 = fracture energy (N/mm)
𝐺𝐹𝑂 = base value of fracture energy which depends on maximum aggregate size 𝑑𝑚𝑎𝑥 as
provided by CEP FIP MC 90 (1993) sited in fib Bull42 (2008).
𝑓𝑐𝑚 = mean cylinder compressive strength (MPa)
𝑓𝑐𝑚𝑜 = 10 MPa
Stellenbosch University https://scholar.sun.ac.za

64
Table 2-3: Effect of maximum aggregate size 𝒅𝒎𝒂𝒙 on base value of fracture energy 𝑮𝑭𝑶 (CEP FIP MC 90)
𝑑𝑚𝑎𝑥 (mm) 8 16 32
𝐺𝐹𝑂 (N/mm) 0.025 0.03 0.058
Fracture energy determined using Equation 2.27 in comparison with experimental results was said (fib
Bull42, 2008) to present an under-estimation (for concretes with 16 mm maximum aggregates) for all
concrete grades except very high strength concretes (𝑓𝑐𝑚 > 120 MPa). In concretes with 32 mm
maximum aggregates, over-estimation of fracture energy is said to be reported by the relation for
concretes with mean compressive strength above 40 MPa (fib Bull42, 2008). Therefore many
postulations of relations exist for estimating fracture energy on basis of type of aggregate or concrete
class. The two relations offered by Fib Bull42, 2008 are as follows:
𝐺𝐹 = 𝐺𝐹𝑂 [1 − 0.77𝑓𝑐𝑚𝑜
𝑓𝑐𝑚 ] (2.28)
where: 𝐺𝐹𝑂 = 0.18 N/mm and 𝑓𝑐𝑚𝑜 = 10 MPa or
𝐺𝐹 = 𝐺𝐹𝑂 (𝑓𝑐𝑚
𝑓𝑐𝑚𝑜)
0.18
(2.29)
where: 𝐺𝐹𝑂 = 0.11 N/mm and 𝑓𝑐𝑚𝑜 = 10 MPa
These are however inconsistent with very low strength (below C12/15) and low strength concretes,
but are adjudged to be suitable for C40 concrete grades and above. The Fib Bull42, 2008 states that
Equation 2.28 provides a relatively better fit to experimental data than Equation 2.29.
2.7.3.2 Modulus of Elasticity and Poisson’s Ratio
Modulus of elasticity (E-modulus) is defined as the tangent modulus of elasticity at the origin of the
stress-strain diagram (fib MC 2010). Equation (2.30) is given by the fib Model Code 2010 for an
estimation of E-modulus from characteristic compressive strength of normal weight concrete made
from sand and gravel.
𝐸𝑐𝑖 = 𝐸𝑐𝑜 ∝𝐸 [𝑓𝑐𝑘+ ∆𝑓
10]
13⁄
(2.30)
Stellenbosch University https://scholar.sun.ac.za

65
where: Eci is E-modulus (N/mm2) at concrete age of 28 days
𝐸𝑐𝑜 = 21.5 x 10³ N/mm
2; 𝑓𝑐𝑘 and ∆𝑓 as defined in Equation 2.19 and 2.20.
∝𝐸 = 1.0 for quartzite aggregates.
Table 2.4 gives qualitative values ∝𝐸 for different aggregate types.
Table 2-4: Effect of type aggregates on the modulus of elasticity 𝑬𝒄𝒊 (fib MC 2010)
𝐸𝑐𝑜 × ∝𝐸
Types of aggregate ∝𝐸 [N/mm²]
Basalt, dense limestone aggregates 1.2 25800
Quartzite aggregates 1.0 21500
Limestone aggregates 0.9 19400
Sandstone aggregates 0.7 15100
The following is given by the fib MC 2010 as an estimation of the E-modulus in situations where
actual compressive strength (𝑓𝑐𝑚) of the concrete at 28 day is known.
𝐸𝑐𝑖 = 𝐸𝑐𝑜 ∝𝐸 [𝑓𝑐𝑚
10]
13⁄
(2.31)
The fib MC 2010 however allows for use of a reduced E-modulus according to the following equation
where only elastic analysis of concrete structure is to be carried out. According to Dehn (2012), this is
to account for initial plastic strain, causing some irrecoverable deformations.
𝐸𝑐 = ∝𝑖 𝐸𝑐𝑖 (2.32)
where: ∝𝑖 = 0.8 + 0.2𝑓𝑐𝑚
10 ≤ 1.0 (2.33)
Values of tangent modulus (𝐸𝑐𝑖) and reduced modulus (𝐸𝑐) for different grades of concrete as given in
the Code (fib MC 2010) are presented in Table 2.5:
Table 2-5: Tangent modulus and elastic modulus of elasticity (fib MC 2010) Concrete grade C12 C16 C20 C25 C30 C35 C40 C45 C50
𝐸𝑐𝑖 [GPa] 27.1 28.8 30.3 32.0 33.6 35.0 36.3 37.5 38.6
𝐸𝑐 [GPa] 22.9 24.6 26.2 28.0 29.7 31.4 33.0 34.5 36.0
∝𝑖 0.845 0.855 0.864 0.875 0.886 0.898 0.909 0.920 0.932
Concrete grade C55 C60 C70 C80 C90 C100 C110 C120
𝐸𝑐𝑖 [GPa] 39.7 40.7 42.6 44.4 46 47.5 48.9 50.3
𝐸𝑐 [GPa] 37.5 38.9 41.7 44.4 46 47.5 48.9 50.3
∝𝑖 0.943 0.955 0.977 1.000 1.000 1.000 1.000 1.000
It can be observed from Table 2.5 that concrete of very high grade (i.e. > C70) has same values for
both tangent modulus and elastic modulus.
Stellenbosch University https://scholar.sun.ac.za
66
2.8 The modified Wedge Splitting Test Setup for Fracture Energy
The modified wedge splitting test setup (Figure 2.6) is an approach for obtaining nonlinear fracture
mechanics parameters based on the RILEM recommendation AAC 13.1. Two wedges are pressed
symmetrically between four roller bearings in order to split the specimen into two halves. The test
setup is similar to the RILEM recommendation AAC 13.1. The only difference is that the specimen is
placed on two line supports, not only one single line support in the middle of the specimen (Figure
2.7). The supports are placed directly under the mass concentration of each half specimen.
The advantage of this loading arrangement according to Trunk et al. (1999) is that a multiaxial stress
distribution at the end of the crack may be avoided, thus preventing the crack being forced to
propagate through the damage material. This single line support type of setup of the RILEM
recommendation AAC 13.1 is known to result in the later damage type which often influences the
measured fracture energy (Trunk et al., 1999).
The measurements taken during the test are the crack mouth opening displacement (CMOD) and the
applied vertical load (𝐹𝑣). The measured CMOD is the mean of value of the readings of two linear
variable displacement transducers (LVDT) placed both sides of the specimen, immediately under the
loading points, while the vertical load is recorded directly from the testing equipment. The horizontal
splitting force (𝐹𝑠𝑝) is calculated from measured vertical load and the wedge angle. The test is
normally run under the CMOD control at a specified rate.
The work of fracture (Wf) is calculated from the area under the splitting force CMOD diagram while
the specific fracture energy (Gf) is the work of fracture divided by the ligament area (Alig). The Alig is
the projected area on a plane parallel to the ideal crack direction. That is the ligament height
multiplied by the specimen thickness (i.e. 𝐹𝑠𝑝=𝐹𝑣
2 𝑡𝑎𝑛 (∝)). Brühwiler (1998), recommend the use of a
mean deflection diagram for determination of the nonlinear fracture mechanics parameters from the
experimental results.
Stellenbosch University https://scholar.sun.ac.za

67
Figure 2-6: Principle of wedge splitting test: (a) specimen on two linear supports, (b) LVDT on both sides
of the specimen, (c) steel holding devices with roller bearings, (d) transvers with wedges
Figure 2-7: Modified wedge splitting test setup according to RILEM: AAC 13.1. (a) One single line
support at the end of the theoretical crack path. (b) Two line supports under the mass concentration
points under each half specimen
The wedge splitting test of RILEM recommendation AAC 13.1 and its modified test setup approach is
has been applied in many previous research on Autoclaved Aerated Concrete (AAC) (Brühwiler &
Wittmann, 1990; Guofan et al., 1991; Gils et al., 1995; Trunk et al., 1999) and Fibre Reinforced
Concrete (FRC) (Löfgren, 2005; Löfgren et al., 2004; NT BUILD 511, 2005) but no evidence of
fracture energy parameters determination has been found in literature.
2.9 Summary
The use of HPC is gaining more attention in construction works while the issue of its susceptibility to
self-desiccation and autogenous shrinkage has been addressed by introduction of IC-agents. SAP
introduction as IC-agent is generally agreed as a possible a way of mitigating autogenous shrinkage
Stellenbosch University https://scholar.sun.ac.za
68
but an in-depth understanding of SAP influence on the mechanical properties of HPC is still lacking.
Reports on the influence of SAP on concrete are scarce in literature while the few experimental works
in this regard are seen to have utilised mortar pastes or concrete having W/B ≥ 0.35 which does not
fall within the real classification of HPC. A review of the existing body of knowledge has been
presented and it is clear that a need exists for a thorough study of the influence of SAP on the
behaviour of low W/B (0.2 – 0.35) concrete which are the real classification called HPC. Models exist
giving constitutive relation between compressive strength and other mechanical properties of
concrete. This work examines influence of SAP addition as IC-agent on the mechanical behaviour of
HPC with efforts made to simulate the voids created by SAP into the existing mathematical models.
The work is categorised into fresh and early age properties, mechanical properties and non-destructive
tests for easy understanding.
Stellenbosch University https://scholar.sun.ac.za

69
3
Materials and Experimental Procedures
A proper understanding of the mechanical behaviour of composite materials like HPC will be
impossible without a detailed study of the physical and chemical properties of the constituent
materials, the characteristics of the concrete mixtures in the fresh state, early age strength
development trends and the response of the hardened HPC mixtures to the effect of applied force (in
compression and tension), stiffness (i.e. elastic modulus) and fracture properties. These processes
require specific material treatment, specimen preparation and handling to conform to the requirements
of the requisite standards and available facilities. This section of the dissertation gives a detailed
discussion on the properties of the materials used for the experiments, the general procedure for their
handling, specimen sizes, sample preparation and respective treatment. It also includes experimental
setup for the various tests (destructive and non-destructive) involved towards the achievement of the
research objectives. Discussions in this chapter are therefore placed under three major groups:
materials, experimental procedures and characterisation of constituent materials.
3.1 Materials
SAP was introduced as an IC-agent in four reference HPC mixtures for an examination of the effect of
SAP sizes, contents and binder types on the mechanical behaviour of the HPC mixtures at both short
and long hydration periods. The materials used for this study are as discussed in the following sub-
sections.
3.1.1 Superabsorbent Polymers
The type of SAP used in this study is a thermoset polymer specifically the covalently cross-linked
polymers of acrylic acid and acrylamide, neutralised by alkali hydroxide produced by SNF Floerger in
France. Two grain sizes of SAP (˂ 300µm with product label FLOSET CS 27 and ˂ 600 µm, labelled
Stellenbosch University https://scholar.sun.ac.za
70
FLOSET CC 27) as specified by the manufacturer were used with the SAP contents varied (0%, 0.2%,
0.3%, and 0.4%) by weight of binder.
3.1.2 Binders
Cement CEM I 52.5 N supplied by PPC, Western Cape, South Africa conforming to BS EN 197-1-
2000 and SANS 50197-1 served as the main binder while SF by SiliconSmelters of the FerroAltantica
group; FA from AshResources and CS supplied by PPC; all in powdered form were used as
supplementary cementitious materials (SCM) for the various HPC mixtures as required by the mix
design. The blend of the binders are categorised into three types as follows:
Binder Type 1 is the combination of CEM I 52.5 N and SF which is also referred to as binary cement
and adopted for reference HPC mixtures M2 (0.25 W/B) and M3 (0.30 W/B). Binder Type 2 is
composed of CEM I 52.5 N, SF and FA used for M1F (0.2 W/B) while Binder Type 3 is made of
CEM I 52.5 N, SF and CS used for M1S (0.2 W/B). Binder Types 2 and 3 are thereby referred to as
ternary cements.
Tests were conducted on the CEM I 52.5 N and the SCM for first-hand information on their physical
and chemical properties towards a better understanding of their possible influence on the cement
hydration process and its products; microstructure; early-age and long term strength characteristics
and the microstructure of various hardened HPC mixtures.
3.1.3 Aggregate
A natural sand with minimum particle size of 300 µm (i.e. all the particles smaller than 300 µm were
removed using the sieving method), having physical property values (Fineness Modulus, FM =2.79,
coefficient of uniformity (Cu = 2.43), coefficient of gradation (Cc = 1.02) and dust content (0.3%)) of
medium sand classification (Shetty, 2004) as observed in the preliminary sieve analysis reported in
Section 3.3 below was used as fine aggregate. 13mm crushed greywacke stone served as coarse
aggregate in compliance with typical HPC mixes found in literature (Beushausen & Dehn, 2009;
Neville, 2012) and based on observations from the trial mixes carried out at the preliminary stage. The
crushed stone were also washed and spread in open air for surface drying before measuring the
Stellenbosch University https://scholar.sun.ac.za

71
required quantity for particular reference HPC mixture production. This was to reduce the dust
content of the coarse aggregate in order to achieve a low water demand for the HPC mixtures
(especially) the M1F and M1S which are of extremely low W/B.
3.1.4 Water
Clean, potable water supplied by the local municipality was used for concrete mixing.
3.1.5 Admixtures
The choice of superplasticiser was governed by the required long slump retention period to allow for
sieving out mortar from the fresh HPC mixtures to be used for setting times and rate of hydration tests
in accordance to ASTM C403 – 08 and compatibility with the particular binder as pointed out in
literatures (Aītcin, 1998; Mehta & Monteiro, 2014; Neville, 2012). Trial tests made with available
materials however favour the choice of Chryso fluid Premia 310 for this study. The water content of
the superplasticiser was appropriately accounted for and deducted from the volume of mixing water to
maintain the W/B designed for as recommended in the work of Aītcin (1998).
3.1.6 HPC Mixtures
Table 3.1 presents the mix composition of the four references HPC mixtures designed for 28 day
target cube strength of 70 MPa minimum (i.e. C55/67 – C100/115 HSC of EC2) used for this study.
The Binder Type 1 (i.e. CEM I 52.5 N+ SF) was adopted for M2 and M3 – HPC mixtures with M 2
being of 0.25 W/B while M3 is of 0.3 W/B. Binder Type 2 was adopted for M1F – HPC mixture and
the Binder Type 3 for M1S – HPC mixture. These two ternary cements HPCs were however
maintained as 0.2 W/B with FS and CS respectively as alternative additional SCM to achieve good
workability in these extremely low W/B HPC mixtures while working within the limit of the
manufacturer’s optimum content specified for the water reducing admixtures chosen on basis of the
findings of the preliminary tests.
SAP at varied contents (0%, 0.2%, 0.3%, and 0.4% by weight of binder) was then introduced as
admixture with provision made for additional water on basis of the SAP absorbency determined via
Stellenbosch University https://scholar.sun.ac.za
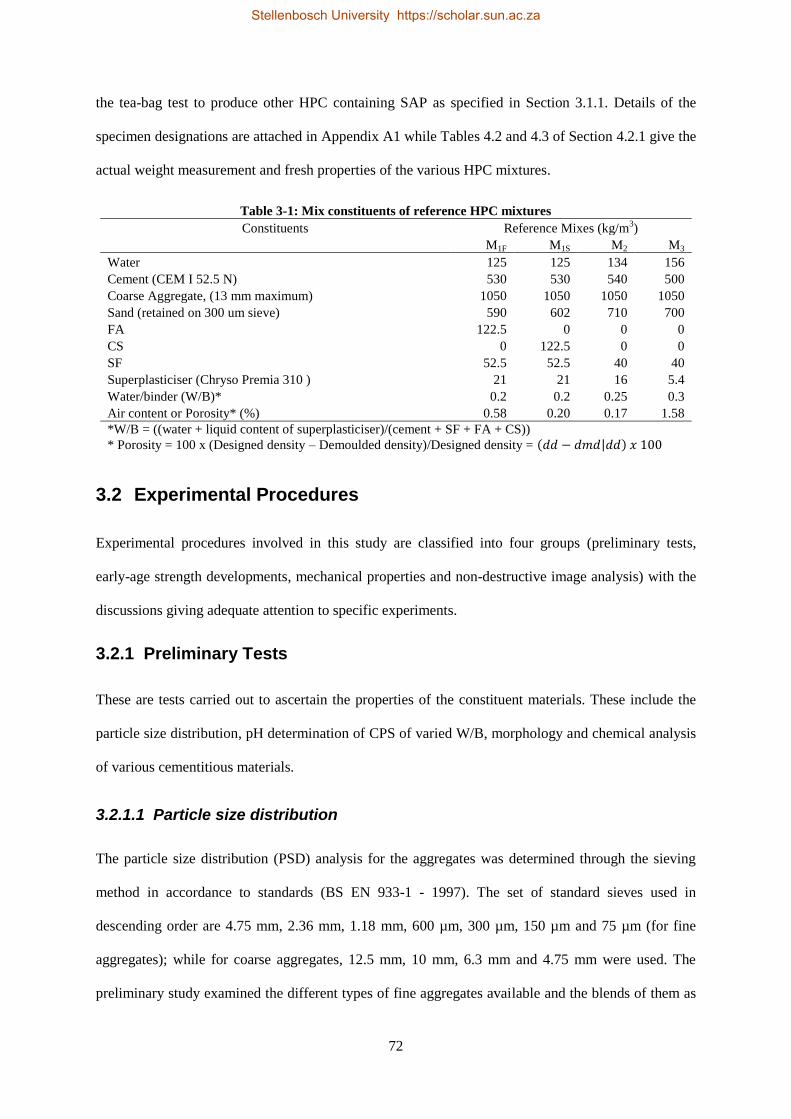
72
the tea-bag test to produce other HPC containing SAP as specified in Section 3.1.1. Details of the
specimen designations are attached in Appendix A1 while Tables 4.2 and 4.3 of Section 4.2.1 give the
actual weight measurement and fresh properties of the various HPC mixtures.
Table 3-1: Mix constituents of reference HPC mixtures
Constituents Reference Mixes (kg/m3)
M1F M1S M2 M3
Water 125 125 134 156
Cement (CEM I 52.5 N) 530 530 540 500
Coarse Aggregate, (13 mm maximum) 1050 1050 1050 1050
Sand (retained on 300 um sieve) 590 602 710 700
FA 122.5 0 0 0
CS 0 122.5 0 0
SF 52.5 52.5 40 40
Superplasticiser (Chryso Premia 310 ) 21 21 16 5.4
Water/binder (W/B)* 0.2 0.2 0.25 0.3
Air content or Porosity* (%) 0.58 0.20 0.17 1.58
*W/B = ((water + liquid content of superplasticiser)/(cement + SF + FA + CS))
* Porosity = 100 x (Designed density – Demoulded density)/Designed density = (𝑑𝑑 − 𝑑𝑚𝑑|𝑑𝑑) 𝑥 100
3.2 Experimental Procedures
Experimental procedures involved in this study are classified into four groups (preliminary tests,
early-age strength developments, mechanical properties and non-destructive image analysis) with the
discussions giving adequate attention to specific experiments.
3.2.1 Preliminary Tests
These are tests carried out to ascertain the properties of the constituent materials. These include the
particle size distribution, pH determination of CPS of varied W/B, morphology and chemical analysis
of various cementitious materials.
3.2.1.1 Particle size distribution
The particle size distribution (PSD) analysis for the aggregates was determined through the sieving
method in accordance to standards (BS EN 933-1 - 1997). The set of standard sieves used in
descending order are 4.75 mm, 2.36 mm, 1.18 mm, 600 µm, 300 µm, 150 µm and 75 µm (for fine
aggregates); while for coarse aggregates, 12.5 mm, 10 mm, 6.3 mm and 4.75 mm were used. The
preliminary study examined the different types of fine aggregates available and the blends of them as
Stellenbosch University https://scholar.sun.ac.za
73
reported in Section 3.3 before the choice of the specific material conforming to the requirements of
the HPC mixtures for this work.
The binders and SAP particles were however analysed for PSD using a Saturn DigiSizer 5200 V1.10
(5200 LSHU V2.01 S/N 216) high definition digital particle size analyser with a Mie model, while
specific surface area in Nitrogen (N2) adsorptive medium using 3Flex (Version 1.02 and S/N 103)
Surface Characterisation (both equipment made by Micrometrics Instruments Corporation). The laser
diffraction particle size adopted a wet technique using Isopropanol (an ethanol non-absorbent liquid
medium) at a Refractive Index (RI) of 1.376 with a Laser 658 nm light source and analysed particle
range by specification was 0.1 to 1000 µm up to a lower limit of 0.07 µm on the instrument. The
instrument is of 600 ml reservoir at a 1.2 litre/min pump speed.
The dry SAP particles were also examined using the computed tomography (CT) scanner as discussed
in Chapter 6 to ascertain the grain sizes for a clear assessment of the absorption capacity of the SAP in
HPC in a non-destructive test approach.
3.2.1.2 Tea-bag test
The tea-bag test as standardised by EDANA (2002) reported in literature (Assmann et al., 2014;
Mechtcherine & Reinhardt 2012; Schrofl et al., 2012), is the most popular method for determination
of SAP absorption capacity. It is a differential weighing method used to characterize the sorption
behavior of SAP or similar liquid absorbent materials in water or a particular liquid. The basic
apparatus for this test are: 500 ml beaker; tea filters (available commercially, as oblong, with
dimensions: approximately 185 mm x 85 mm), gloves, towel, analytical balance (precision: 0.0001 g)
with glass Petri dish (d = 60 mm), spatula, stopwatch, and a shallow bowl for weighing the test
material (say about 4 mm x 4 mm).
The SAP particle as received in the original container from the manufacturer was used as the test
substance. The test procedure involves immersing a tea filter (“tea-bag”) in a beaker containing about
300 ml of test fluid and completely moisturised. This was lifted out of the liquid within 10 seconds
and placed between two fingers with light pressure to drain out excess liquid from the filter. The tea-
Stellenbosch University https://scholar.sun.ac.za
74
bag was then placed on a towel in another 10 seconds blotted from both sides with the flat surface of
one’s hand and rolled over. This was then placed on the weighing balance in a petri glass dish to
measure the mass of moist tea-bag (mTBT, f).
About 0.2 g (equivalent to mSAP, t) of the test substance to be tested (dry SAP) is weighed accurately
and placed in a dried tea bag with a uniform distribution of the particles at the bottom of the tea-bag
ensured. This was immersed in the liquid and the stop watch made to start for time measurements.
The substance in tea-bag was then brought out of the test fluid, drained and weighed at time intervals
of 30 sec, 2 min, 5 min, 10 min, 15 min, 30 min, 60 min and 180 min following the same repeat
process described above for the empty dried tea-bag. The test samples were brought out, weighed and
returned back to the test fluids within 25 seconds in all and vessel containing the test fluid was sealed
airtight specifically for longer test times (60 min and above). A test fluid was adopted for one test
routine with new liquids prepared for every test.
Visual features such as depositions and precipitation were noted. Also recorded was such other
information as test specimen, test liquid and date while the calculated mass of the wet weight of the
tea-bag and the swollen SAP (mTBT, f + mSAP, t) were recorded in tabular form for the respective
time records.
The test liquids examined in the aspect of the study are water and five different mix of CPS - CPS
(5.2, 6.5, 7.8, 9.1 and 10.4 W/C ratio) to stimulate expected CPS in HPC mixtures of different W/B
(0.2, 0.25, 0.3, 0.35 and 0.4). SAP absorption was then calculated using the following.
mFabs = mTBT,f + mSAP,t – (mTBT, f + mSAP,t) (3.1)
3.2.1.3 PH determination of CPS
A determination of the pH-value of CPS was carried out for a study of the influence of the pore
concentration on the absorbency of SAP in concrete. This was carried out using a Crison pH meter
Basic 20+ (Crison, Barcelona, Spain). The pH meter was standardised using buffer solutions of pH
9.02 ± 0.01, 7.00 ± 0.01 and 4.01 ± 0.01 at 20 ºC.
Stellenbosch University https://scholar.sun.ac.za
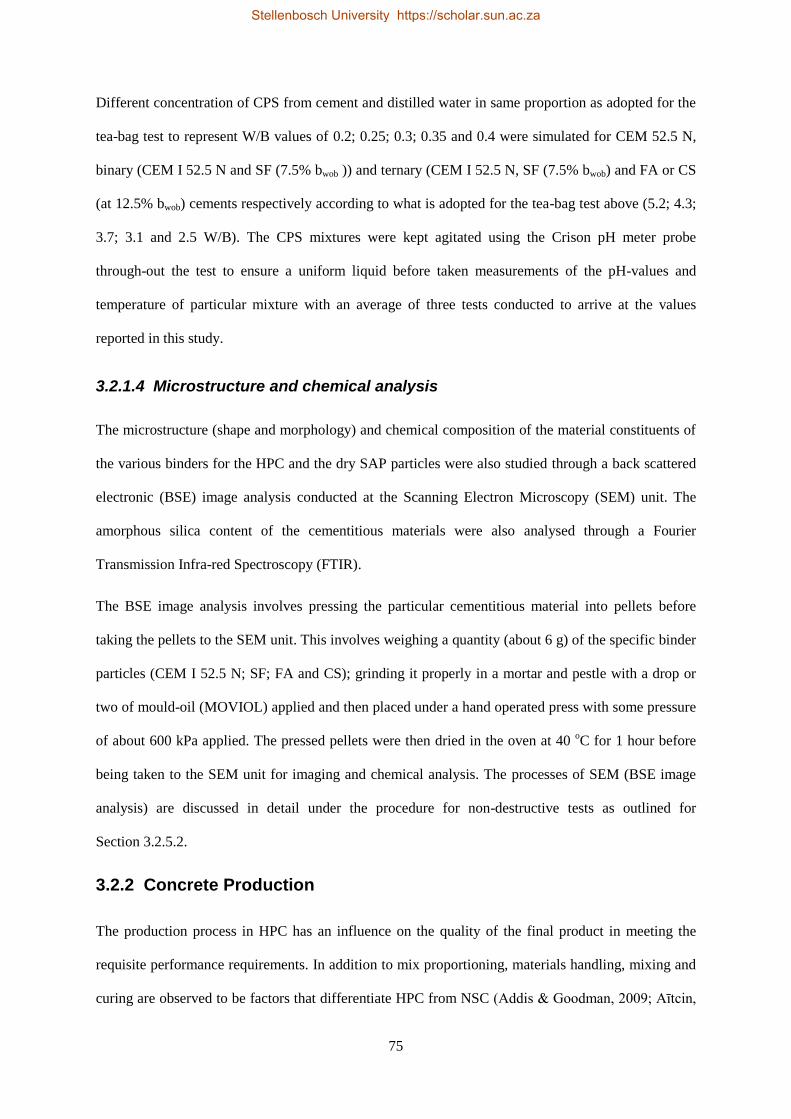
75
Different concentration of CPS from cement and distilled water in same proportion as adopted for the
tea-bag test to represent W/B values of 0.2; 0.25; 0.3; 0.35 and 0.4 were simulated for CEM 52.5 N,
binary (CEM I 52.5 N and SF (7.5% bwob )) and ternary (CEM I 52.5 N, SF (7.5% bwob) and FA or CS
(at 12.5% bwob) cements respectively according to what is adopted for the tea-bag test above (5.2; 4.3;
3.7; 3.1 and 2.5 W/B). The CPS mixtures were kept agitated using the Crison pH meter probe
through-out the test to ensure a uniform liquid before taken measurements of the pH-values and
temperature of particular mixture with an average of three tests conducted to arrive at the values
reported in this study.
3.2.1.4 Microstructure and chemical analysis
The microstructure (shape and morphology) and chemical composition of the material constituents of
the various binders for the HPC and the dry SAP particles were also studied through a back scattered
electronic (BSE) image analysis conducted at the Scanning Electron Microscopy (SEM) unit. The
amorphous silica content of the cementitious materials were also analysed through a Fourier
Transmission Infra-red Spectroscopy (FTIR).
The BSE image analysis involves pressing the particular cementitious material into pellets before
taking the pellets to the SEM unit. This involves weighing a quantity (about 6 g) of the specific binder
particles (CEM I 52.5 N; SF; FA and CS); grinding it properly in a mortar and pestle with a drop or
two of mould-oil (MOVIOL) applied and then placed under a hand operated press with some pressure
of about 600 kPa applied. The pressed pellets were then dried in the oven at 40 oC for 1 hour before
being taken to the SEM unit for imaging and chemical analysis. The processes of SEM (BSE image
analysis) are discussed in detail under the procedure for non-destructive tests as outlined for
Section 3.2.5.2.
3.2.2 Concrete Production
The production process in HPC has an influence on the quality of the final product in meeting the
requisite performance requirements. In addition to mix proportioning, materials handling, mixing and
curing are observed to be factors that differentiate HPC from NSC (Addis & Goodman, 2009; Aītcin,
Stellenbosch University https://scholar.sun.ac.za

76
1998; Mehta & Monteiro, 2014; Neville & Aitcin, 1998; Neville, 2012). This process attracted some
attention in this work, with consideration given to the timing and sequence of the various operations
involved in this important aspect of concrete production.
The fine aggregate was first poured into the 50 litres capacity pan-mixer, followed by the binders
which had first been thoroughly hand-mixed to enhance even dispersion of the SF and the other
cementitious materials (FA or CS as appropriate) and a uniform colour observed. After mixing for
about 30 seconds, the dry SAP particles were then poured in and all the fine contents mixed for
another 30 seconds. The coarse aggregate were then added and mixing continued for another 1
minute, before water already mixed with superplasticiser (Chryso fluid Premia 310 – a PCE) was
added. The mixing was allowed to continue for another 3 minutes as recommended in literature
(Aītcin, 1998, Neville, 2012; Mehta & Monteiro, 2014). Only about half of the mixer volume was the
maximum volume of concrete produced per batch noting that for these low W/B concrete, the mix is
very stiff and becomes difficult if 50% volume of mixer is exceeded.
Slump flow measurement was then carried out using the flow table test (as described in BS EN 12350
– 5:2009) as a measure of workability of the HPC mixture while both the room and concrete
temperature were also measured using a digital pocket thermometer (Checktemp 1, Model No. H1-
740024 by HANNA Instruments Incorporated). After ascertaining that the mixture met the required
workability and cohesion for specified design mix, specimen for the various tests were then cast in
two layers on a vibrating table into the already oiled moulds. These were thereafter covered in the
Laboratory with thick polythene sheets and allowed to harden for 24 hours, before demoulding and
curing in water bath at 20 ± 3 oC till the required curing ages (7, 28, 56 and 90 days respectively)
before testing in accordance to standards (BS EN 12390 – 1, 2, 3, 4, 6 & 7, 2009). Procedures and
specimen preparation for the individual tests are discussed in detail in the following sections.
3.2.3 Early-age strength properties of HPC
The tests carried out for investigation of the early age strength properties are the setting time tests,
rate of hydration and early age compressive strength of the HPC with SAP.
Stellenbosch University https://scholar.sun.ac.za
77
3.2.3.1 Setting times tests
The setting times (initial and final) of the HPC mixtures were determined using a penetration
resistance method in accordance to ASTM C403 – 08. A standard 4.75 mm sieve was used to extract
mortar samples from the fresh HPC mixtures which were cast in two layers into 150 mm cube moulds
to about 10 mm below the height edge. The specimens were then kept in a climate control room set at
21 ± 2 oC temperature and 65 ± 5% humidity. A penetrometer Model C213, S/No – C213/AB/0010
(Matest S.P.A.) was then used to measure the resistance of the concrete to 25 mm depth penetration of
respective needle heads beginning from the biggest as specified by the code at regular time intervals.
This plot of penetration resistance (on ordinate axis) against time in minutes (abscissa axis) gives the
initial (3.5 MPa resistance) and final setting (27.6 MPa resistance) times respectively using a direct
fitting on a powers regression line.
3.2.3.2 Strength development and degree of hydration of HPC with SAP
An assessment of early-age strength development and degree of hydration of HPC with SAP was
conducted on sieved mortar samples of HPC mixtures obtained as explained in Section 3.2.3.1. The
study adopted the same approach as reported by Hasholt et al., (2010a). The process is broken down
into the following stages:
i. Mortar samples (50 mm cube) were cast and crushed after different curing ages (i.e.
immediately after demoulding (24 hrs); 48 hrs; 72 hrs and 7days) to assess the strength
development trends of the HPC with SAP.
ii. The remains of the sample in (i) above was then milled properly using the mould for
Aggregate Crushing Value (ACV) Test and a 25 mm diameter bar (as shown in Figure
3.1) as mortar and pestle. The milled sample was then vacuum-dried for 1 hour to stop
further hydration.
iii. The sample was then sieved and from the particles passing the 300 µm standard sieve, a
known weight of about 50 g was measured and oven dried for 24 hours at 105 oC and
Stellenbosch University https://scholar.sun.ac.za

78
weighed again (to determine the amount of evaporable water i.e. capillary water + gel
water).
iv. It was then heated and kept at 950 o C for 1 hour and weighed (this measurement is used
for determination of amount of chemically bound water). All calculations were then made
based on ignited weight basis to give the following:
Loss on ignition (LOI) of the binders (CEM I 52.5 N, SF, FA and CS) and hydrated
mortar pastes calculated by
LOI (%) = 100 x (as received weight – ignited weight)/as received weight (3.2)
𝑤𝑛 (i.e. non-evaporable water) content of the hydrated mortar pastes were determined to evaluate the
degree of hydration, as provided for in literature (Lam, et al., 2000; Neville, 2012). This is the
difference in mass measurement of the crushed paste at 950 oC and 105
oC, to calculate the degree of
hydration (𝛼) on the basis that 1 g of anhydrous cement produces 0.23 g of 𝑤𝑛, hence the 𝑤𝑛 is
calculated by using the following formula
𝑤𝑛% = 100 𝑥 (𝑑𝑟𝑖𝑒𝑑 𝑤𝑒𝑖𝑔ℎ𝑡 𝑜𝑓 𝑝𝑎𝑠𝑡𝑒−𝑖𝑔𝑛𝑖𝑡𝑒𝑑 𝑤𝑒𝑖𝑔ℎ𝑡 𝑜𝑓 𝑝𝑎𝑠𝑡𝑒)
(𝐼𝑔𝑛𝑖𝑡𝑒𝑑 𝑤𝑒𝑖𝑔𝑡ℎ 𝑜𝑓 𝑝𝑎𝑠𝑡𝑒−𝑙𝑜𝑠𝑠 𝑜𝑓 𝑖𝑔𝑛𝑖𝑡𝑖𝑜𝑛 𝑜𝑓 𝑐𝑒𝑚𝑒𝑛𝑡) (3.3)
The degree of hydration (𝛼) is then:
𝛼 = 100 𝑥𝑊𝑛
0.23 (3.4)
Figure 3-1: ACV mould used as mortar and pestle for milling hardened HPC mortars
Stellenbosch University https://scholar.sun.ac.za

79
The degree of hydration in the binary (M2 and M3) and ternary (M1F and M1S) cement pastes were
however calculated with the LOI of the SCM and their proportion made to adjust for their 𝑤𝑛% as
appropriate.
The crushing force in (i) above recorded was used to determine the early-age compressive strength of
HPC containing SAP as IC-agent while multiple regression was carried to assess the influence of SAP
sizes and contents on the early-age strength development of the HPC mixtures.
3.2.4 Mechanical Properties Tests
This is the core experimental work of the research. It involves establishing the mechanical behaviour
of the HPC containing SAP as an IC-agent. The mechanical properties were therefore investigated at
three levels and the tests and specimens sizes involved are:
Compressive strength – 100 mm cubes.
Splitting tensile and fracture energy (i.e. wedge splitting) test – 100 mm cubes.
Elastic modulus test – Ø100 x 200 mm cylinders.
CT Scanning and SEM – Ø50 x 100 mm cylinders.
3.2.4.1 Compressive strength
The compressive strength is a major property of concrete to which many of its characteristics are
related (Neville, 2012). The design and material proportioning for concrete (be it normal, high
strength or high performance) is mostly governed by this unique property. Investigation of
compressive strength of HPC with SAP in this study was based on the following variables:
Four reference mixtures of HPC for the 0.2 to 0.3 W/B as stated in Section 3.1.6
Sizes of SAP - 2
SAP content – four levels (0%; 0.2%; 0.3% and 0.4% bwob)
Curing age before testing - four levels (i.e. 7, 28, 56, and 90 days).
Number of replicates – three
The tests setup are as shown in Figure 3.2 (a & b) in accordance to BS EN 12390 – Parts 1, 2 and 3
(2000) and RILEM Technical Recommendation TC14-CPC 4, 1975.
A total of 384 (100 mm) concrete cubes were tested using the digitised Contest Materials Testing
machine (Grade A type, S/No – 3118 by Contest Instruments.) of 2000 kN maximum loading capacity
ensuring the face in touch with the loading platens are not same as the cast face of the cube. Also
determined were the demoulded density and total porosity % as discussed in Section 4.1.1.
Stellenbosch University https://scholar.sun.ac.za

80
(a) (b)
Figure 3-2: Compressive strength test setup
3.2.4.2 Elastic modulus
High elastic modulus (E-modulus) is one of the specific performance and required properties for
which HPCs are normally designed hence it is important to investigate how addition of SAP in HPC
influences its E-modulus. E-modulus is normally determined from the stress – strain relation during
measurement of compressive strength. This relation is of relevance when the concrete has hardened
and reached some level of strength development with E-modulus value after 28 days of curing
common in specifications, although the value after 7 days curing might be necessitated by specific
project requirements. The E-modulus was conducted for the various HPC mixtures in this study after
28, 56 and 90 days of concrete hydration for ease with result compilation and handling of the multiple
numbers of variable inputs (curing age, SAP type, SAP contents, binder type and W/B). A total of 288
(Ø100 x 200 mm) concrete cylinders were cast and cured as explained in Section 3.2.2 for this
particular test. The test was carried out with four cyclic loads in accordance to standards (ASTM
C469 – 2010 and RILEM TC14-CPC 8, 1975) as setup in the Contest Materials Testing machine
shown in Figure 3.3.
This comprise of a 2000 kN capacity load cell and three linear variable displacement transducers
(LVDT) with a range of 10 mm each attached centrally to the concrete cylinders (Figure 3.3), which
were connected to a HBM spider data acquisition system used for storage and analysis of the stress-
strain relationship for computation of E-modulus of the HPC.
Stellenbosch University https://scholar.sun.ac.za

81
The variables in consideration for this test remain as outlined for compressive strength above except
that the curing ages now becomes three (28, 56 and 90 days) giving a total 288 concrete cylinders
tested for E-modulus.
Figure 3-3: E-modulus test setup for HPC with SAP
3.2.4.3 Splitting tensile strength and fracture energy
Splitting tensile strength and fracture energy for the HPC mixtures were determined through the
modified wedge splitting test approach as explained in Section 2.8 based on the works of Brühwiler &
Wittmann (1990) and RILEM Recommendations AAC13.1 (TC51-ALC, 78-MCA, 1992). The
specimen for the wedge splitting test was cast with a 30 mm x 20 mm groove introduced by insertion
of a wooden block and cured in the water-bath as explained in Section 3.2.2. It was further notched to
50 mm depth from the cube specimen bottom (Figure 3.4 (b)) at the required curing ages (28, 56 and
90 days) and an epoxy glue was used to attach PVC clips (Figure 3.4 (a)) fabricated to hold LVDTs at
the groove edge for a measurement of the CMOD during the test. The test setup developed as shown
in Figure 3.4 (c) using a loading assembly (14 o wedge plate welded to IPE 160 I-section (160 x 82 x
15.8 kg/m3 I-section)) made to move within two Ø25 mm needle roller bearings (NKI 25/30) attached
to the sides of fabricated steel frame (made of C-channels) for a transfer of the vertically applied load
to horizontal loading on the cube specimen.
The cube was placed on a base plate with two 10 mm diameter bars welded to it (for stability) as
observed in Zhao, et al. (2008) and Trunk et al.(1999) to induce crack opening from the notched
Stellenbosch University https://scholar.sun.ac.za

82
groove-end of the wedge splitting specimen instead of the single bar centrally placed specified in the
recommendations above (Brühwiler & Wittmann, 1990; International Union of Testing and Research
Laboratories for Materials and Structures (RILEM), 1994) - RILEM AAC13.1). This is to ensure
stability of the cube specimen during testing. An interlayer of 4 mm thick hardboard of 8 mm width
was placed on the 10 mm diameter bars on the base plate (as shown in Figure 3.4 (d)) to prevent direct
transfer of axial force from the base when carrying out the wedge splitting test.
(a) (b)
(c) (d)
Figure 3-4: Test setup for wedge splitting test – (a) shows the plastic clip (LVDT holder) glued to
concrete specimen; (b) the groove (30mm x 20mm) and notch (20 mm deep); (c) the complete
wedge splitting setup and (d) the crack propagation on the cube specimen.
*Note that the label (A) in Figure 3.4 above plastic clip; (B) is the IPE 160 I-section; (C) is the metal
wedge; (D) is the two Ø25 mm needle roller bearings and (E) is the fabricated steel frame (made of C-
channels).
Notch
Crack
propagation
The wedge (C)
(A) (A)
(D)
Plastic
clip (A)
(B)
(C)
(E)
Stellenbosch University https://scholar.sun.ac.za
83
The load was applied at a crack mouth opening rate of 0.1 mm/min in a closed loop servo control
machine (Instron 50 kN actuator by Instron Ltd.) having maximum loading capacity of 50 kN
(dynamic) / 62.5 kN (static).
The crack opening displacement (COD) was measured on the specimen with two LVDTs attached
using the plastic holders (Figure 3.4 (a)) connected directly to the Instron machine ensuring crack
opening control of the test set up and a direct data transfer to a dedicated computer. A total of 288
(100 mm) cube HPC samples were studied for splitting tensile strength and fracture energy. An
average of the three tests per specific sample gave the values reported in this work.
3.2.5 Non-destructive tests on HPC mixtures
3.2.5.1 X-ray CT scanning
The hardened Ø50 x 100 mm cylinders cast and cured as explained in Section 3.2.2 were placed in the
oven at 40 oC for 30 minutes after removal from the curing tank at the respective hydration period
before taking it to the CT scanner for analysis. 3D X-ray images were examined and analysed in this
study using Avizo Fire, version 8.0 by FEI Visualisation Science Group and VG Studio Max 2.2 by
Volume Graphics to filter and classify the individual voids for determination of the sizes, distribution
and volume analysis of voids created by SAP in the HPC with the respective influence of binder type,
W/B, SAP content and curing age. The CT scanning was also used to affirm the grain sizes and
distribution of the dry SAP particles.
The 3D X-ray images were obtained using a General Electric Phoenix VTomeX L240 X-ray micro
computed tomography scanner (microCT), having mounted the concrete specimen on a less dense
cardboard tube to reduce external influences on the samples during the scan. Reconstruction was
performed with system supplied Datos Reconstruction software and analysis conducted. The voxel
size was set to 100 µm with settings at 170 kV and 150 µA for x-ray generation and image acquisition
settings was 500 ms per image. Figure 3.5a shows the 3D image of the HPC specimen while the 2D
slice image of same is shown in Figure 3.5b.
Stellenbosch University https://scholar.sun.ac.za
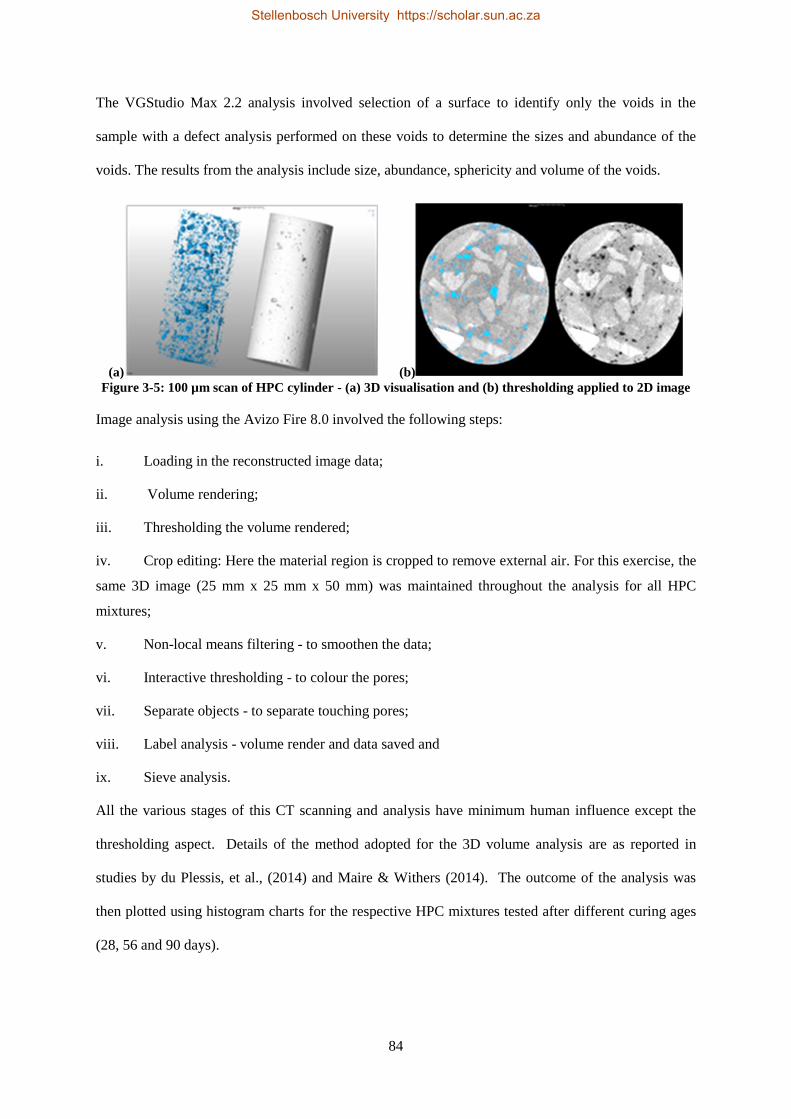
84
The VGStudio Max 2.2 analysis involved selection of a surface to identify only the voids in the
sample with a defect analysis performed on these voids to determine the sizes and abundance of the
voids. The results from the analysis include size, abundance, sphericity and volume of the voids.
(a) (b)
Figure 3-5: 100 µm scan of HPC cylinder - (a) 3D visualisation and (b) thresholding applied to 2D image
Image analysis using the Avizo Fire 8.0 involved the following steps:
i. Loading in the reconstructed image data;
ii. Volume rendering;
iii. Thresholding the volume rendered;
iv. Crop editing: Here the material region is cropped to remove external air. For this exercise, the
same 3D image (25 mm x 25 mm x 50 mm) was maintained throughout the analysis for all HPC
mixtures;
v. Non-local means filtering - to smoothen the data;
vi. Interactive thresholding - to colour the pores;
vii. Separate objects - to separate touching pores;
viii. Label analysis - volume render and data saved and
ix. Sieve analysis.
All the various stages of this CT scanning and analysis have minimum human influence except the
thresholding aspect. Details of the method adopted for the 3D volume analysis are as reported in
studies by du Plessis, et al., (2014) and Maire & Withers (2014). The outcome of the analysis was
then plotted using histogram charts for the respective HPC mixtures tested after different curing ages
(28, 56 and 90 days).
Stellenbosch University https://scholar.sun.ac.za

85
Determination of the dry SAP particle size distribution using X-ray CT involves scanning the two
SAP types separately in a transparent cylindrical container. Reconstruction was performed as
explained above and analysis conducted with the Avizo Fire 8.0 following the steps stated previously.
Scanning for the dry SAP particles was however done at 2 µm voxel size to be able to capture the
actual size of the particles while a crop of 80 mm x 40 mm x 40 mm was made centrally from the VGI
file when loaded before thresholding. The analysis examined a complete particle distribution of the
dry SAP samples rather than individual particle. The 3D image of separated SAP particles with
different colours depicting various size categories is shown in Figure 3.6a below, while Figure 3b
gives the 2D image of cropped dry SAP specimen being analysed with the separated SAP particles in
blue colour with spaces in between them.
(a) (b)
Figure 3-6: 3D Image of separated dry SAP particles with colour indicating sizes classification (a) and (b)
Centrally cropped CT image of dry SAP particles obtained from 3D VGI file
3.2.5.2 Scanning electron microscopy
In quality assurance of concrete, scanning electron microscopy can be used for important information
on degree of hydration of cement, formation and distribution of hydration products, adhesion to
aggregates and homogeneity of cement pastes and possible influence of admixtures on the products of
hydration of cements in concrete (Winter, 2012). This section of the study examined the dry SAP
particles (in powdered (as received) form); binders (in pressed pellets) and HPC samples (in thin
sections). It covers imaging and analysis of the phase compositions of the samples using a Zeiss
EVO® MA15 Scanning Electron Microscope.
Stellenbosch University https://scholar.sun.ac.za

86
Specimen preparation depends on the sample in consideration. The SEM machine accepts samples of
very small thickness (around 3 mm maximum), hence for the binders the pressed pellets as prepared
in Section 3.2.1 is adequate, while the HPC’s requires cutting thin sections out from the 50 mm
diameter x 100 mm concrete cylinders cast in Section 3.2.2 and cured for requisite hydration periods.
The thin circular sections cut out from the central part of the concrete cylinder were then thoroughly
surface-smoothened and well-polished before the Carbon-coating. The dry SAP particles requires no
preparation, as they were only placed on the double sided tape and Carbon-coated appropriately. A
Quorum QT150T was used for the Carbon-coating. The samples (dry SAP particles; pressed pellets or
thin section of HPC’s) were placed in the coating chamber, the carbon rods sharpened and placed
appropriately before the coating process according to equipment guidelines was followed. The
properly coated specimen was then loaded on the Zeiss EVO® MA15 Scanning Electron Microscope
and Energy Dispersive X-ray Spectroscopy (EDX)/Wavelength Dispersive Spectroscopy (WDS) -
SEM procedure followed as below:
i. Load the FC (Faraday Cup) and the sample in the SEM.
ii. Keep the chamber door flush and select pump under SEM status page.
iii. When the vacuum status shows ready switch beam on under icon Beam.
iv. Select under Detection/detectors/CENT for Backscatter detector.
v. Leave the beam on for 5 minutes to stabilise.
vi. Ensure the REMCON program is running – this is the communication port between SEM
and EDS setups.
vii. Beam current of 100 µm (set by default); Accelerating Voltage of 20 kV to be
maintained.
viii. Put FC in the middle of beam, focus the edges as best as possible (not in the middle of the
hole).
ix. Place FC under the beam, select spot mode and when reading on the specimen current
monitor was kept at -4.00 nA. This is controlled by changing the spot size in the SEM
status/Gun dialog window (NB: Spot size varies according to FC reading).
Stellenbosch University https://scholar.sun.ac.za
87
x. When the specimen current monitor reading on the FC ranges between -3.97 and -4.00 nA
and it is stable for a minute/two, the sample was located and focussed on a small sharp
object, before zooming in to 1000X magnification.
xi. Left click on the WD bottom toolbar and note the reading. Type in 13 and use the little
joystick (Z) to focus the sample. This is a crucial step as the WD needs to be within a
0.01 mm limit around 13 mm.
xii. The focusing procedure is repeated if the focus changes during the SEM appointment.
xiii. The spot mode is used when a smooth area (avoiding cracks/polishing
marks/holes/cleavage planes) has been selected. No movement of the spot is done after
the spot mode has been selected. The spot mode is always cancelled before another area is
selected if the first is not satisfactory.
Following the procedures above, the samples were identified with BSE and /or secondary electron
images and phase compositions were quantified by EDX analysis using an Oxford Instruments® X-
Max 20 mm2 detector and Oxford INCA software. Beam conditions were kept at 20 kV, a working
distance (WD) of 8.5 mm maintained and approximate beam current of -20 nA used throughout the
analyses. The counting time was 10 seconds live-time and Internal Astimex Scientific mineral
standards were used for standardisation and verification of the analyses while the works of (Winter,
2012) serve as a guide for quantitative analyses in this study.
3.3 Characterisation of Constituent Materials
A good knowledge of the physical properties of the constituent materials helps with the in-depth
understanding of the mechanical behaviour of concrete. It is important to study the particle size
distribution, shape, structure and surface area of the cementitious materials as this could be of
relevance to what the products of hydration will be especially with an introduction of a new admixture
for IC of low W/B concretes. Fine powders are known to exhibit different properties to the same
material in coalesce form depending on magnitude of their surface area and nature of porosity, so also
are they said to be more reactive (Mehta & Monteiro, 2014; Neville, 2012). The type, shape, size and
Stellenbosch University https://scholar.sun.ac.za

88
molecular structure of constituent materials of the HPC mixtures used in this study are thereby
reported with an attempt made to discuss their effects on the mechanical behaviour of the concrete
with SAP.
3.3.1 Results
Figure 3.7 presents the plot of the sieve analysis of the various available fine aggregates (and their
blends) investigated in this study, while Table 3.2 on the other hand, gives the summary of the particle
size distribution.
Figure 3-7: Plot of sieve analysis of available and blended fine aggregates
Table 3-2: Summary of particle size distribution of available fine aggregates
Available
f/aggregate
SN1
(≥300 µm)
SN2
(≥150 µm) 30CD-70N 40CD-60N CD N*
D10 350 270 160 160 320 150
D30 550 450 420 450 1150 350
D60 850 800 950 1100 2050 740
Cu 2.43 2.96 5.94 6.88 6.41 4.93
Cc 1.02 0.94 1.16 1.15 2.02 1.10
FM 2.79 2.64 2.78 2.97 4.00 2.30
Dust content 0.31 0.27 5.22 6.32 12.52 5.69
NB: *N – Natural sand; SN: Sieved natural sand; CD – Crusher Dust; 30CD-70N is 30% CD/70%N and
40CD- 60N is 40%CD/60%N.
This was the basis for the choice of the natural sand with minimum particle size of 300 µm (i.e. all the
particles smaller than 300 µm removed using the sieving method) as discussed in Section 3.2.1.1.
Stellenbosch University https://scholar.sun.ac.za

89
13 mm crushed greywacke stone serve as coarse aggregate in compliance with typical HPC mixes
observed in literature (Beushausen & Dehn, 2009; Neville, 2012) and based on observations from the
trial mixes carried out at the preliminary stage.
The available natural sand (N) is well graded, belongs to fine sand category (FM of 2.3) of Shetty,
(2004) and has dust content of 5.69% which makes it unsuitable for HPC mixtures as recommended in
literature (Addis & Goodman, 2009; Aītcin, 1998; Neville, 2012). The crusher dust (CD) on the other
shows a gap-grading, very coarse (FM of 4.0) and also has very high dust content (12.52%). Blends of
the natural sand and crusher dust (40CD – 60N and 30CD – 70N) were also unsuitable. An attempt
made at sieving the natural sand with 300 µm (SN1) and 150 µm (SN2) sieves to reduce the dust
content resulted in SN1 with FM of 2.79 and 0.31 dust content which conform well specified
requirement in literature (Aitcin, 1998; ACI 363.2R-98; Addis & Goodman, 2009) been adjudged the
most suitable for workability and strength development of HPC mixtures.
A summary of the PSD and specific surface area of cementitious materials (CEM I 52.5 N, SF, FA
and CS) and dry SAP particles (SP1 and SP2) carried out by laser diffraction particle size distribution
method and Brunauer–Emmett–Teller (BET) nitrogen absorption technique analysis is presented in
Table 3.3 and Figure 3.8 (PSD plot). The laser diffraction particle size analysis was repeated and
similar result obtained with the particle size of SF seen as lower than other cementitious materials.
The results show that the used binders are fine in nature with the CEM I 52.5 N, FA and CS having
over 90% (D90) of the particles below 75 µm size and 50% (D50) of the particles being lower than 25
µm (CEM I 52.5 N) and 12 µm in size (FA and CS) respectively. BET specific surface area of the
CEM I 52.5 N, FA and CS were close in value (5.56, 5.13 and 3.22 m2/g respectively as shown in
Table 3.3). SF surprisingly is reported from the laser diffraction PSD as the coarsest of all the
cementitious materials. It has D50 of 43 µm and D90 of 150 µm but BET specific surface area is 19
m2/g. The BET method is recommended in literature (Silica Fume Association, 2005) as the best
approach for determining the specific surface area of SF while laser or other PSD methods may be
adopted for other SCMs, specific surface area for SF particles is often determined by the BET
method. Neville (2012) is of the view that absolute measurement of specific surface can be obtained
Stellenbosch University https://scholar.sun.ac.za
90
by BET – nitrogen adsorption method as the internal area of the particles is also accessible to the
nitrogen molecules. The measured value by BET is said to be considerably higher than that
determined by the air permeability method (Neville, 2012). The BET specific surface area in this
study for SF falls within the value 13 m2/g to 30 m
2/g specified by Siddique & Khan (2011) and Silica
Fume Association, (2005) as typical for SF in their work, a large surface area indicative of very fine
particles. Zang (2015) in his work on UHPC argues that the size of SF determines the grading and
hence the paste packing. Medium size SF having specific surface area of approximately 12m2/g was
recommended as best for workability and compressive strength while the common SF with relatively
high specific surface area between 15 – 20 m2/g is said to lead to high water demand in UHPC (Wille
et al., 2011; Habel et al., 2008 as sited in Zang 2015). The specific surface area of the SF available in
South Africa is reported by Zang (2015) as 23 ± 3, a range to which the value 19 m2/g obtained for the
SF used in this study complied with, an indication that the BET result from this study is reliable.
UHPC mix in the work of Zang (2015) was based on particle parking density concept which is more
applicable when coarse aggregate are minimal or absent in the mix (Fennis et al., 2012). The concrete
mix in this study has coarse aggregates incorporated while the natural sand used for the mix had been
sieved as discussed in Section 3.1.3 to achieve a more flowable mix.
The BET specific surface area value for SF is higher than that of CEM I 52.5 N, FA and CS (Table
3.3), thereby affirming that SF is much finer than the other three materials. This appears to be a
contradiction to the PSD result obtained from laser diffraction method. CS is slightly coarser than FA
and CEM I 52.5 N. The higher specific surface according to literature (Silica Fume Association,
2005) contributes to the high reactivity of SF in concrete.
The laser diffraction PSD result for grain sizes of SF reported in Table 3.3 and Figure 3.8 (red colour
in Table 3.3 and Figure 3.8) is thus wrong since the grains sizes in SF are expected to be much lower
in value (about 100 to 150 times finer than CEM I 52.5 N), typically ˂ 1 µm. Reports from literature
(Siddique & Khan, 2011) gave an average particle size of 150 nm. The SF came out of the bag in the
condensed form and effort made at grinding with mortar and pestle in the laboratory before the laser
diffraction PSD test, possibly did not result in complete separation of the grains. This could explain
Stellenbosch University https://scholar.sun.ac.za

91
the error in the result of the laser diffraction PSD test on SF. The Laser diffraction method is reported
by DiStefano, et al., (2010) and Kowalenko & Babuin, (2013) as having some inherent errors in
determining particle sizes of very fine materials susceptible to particle aggregation.
Figure 3-8: Particle size distribution of binders
Table 3-3: Summary of particle size distribution and BET surface area
diameter (um)
Characteristics SP1 SP2 CEM I
52.5N
SF FA CS
D90 337.799 472.36 73.669 150.264 60.256 53.179
D50 216.076 298.38 20.381 43.177 11.667 11.21
D10 91.825 108.05 3.541 4.381 2.11 2.182
Mean 214.9 293.8 32.93 61.47 23.04 21.62
Median 216.1 298.4 20.38 43.18 11.67 11.21
Model 300.4 400.5 30.04 112.9 11.29 11.29
BET surface area (m2/g) 3.82 4.45 5.56 19.16 5.13 3.22
Model (1.43,
0.001),
1.376
(1.43,
0.001),
1.376
(1.72,
0.100),
1.376
(1.52,
0.100),
1.359
(1.45,
1.000),
1.376
(1.45,
1.000),
1.376
The dry SAP particles were however more coarse than the cementitious materials with SP2 having
grains ranging between 0 and 600 µm in size, D90 and D50 of 472.4 µm and 298.4 µm respectively
Stellenbosch University https://scholar.sun.ac.za

92
being the coarsest. SP1 on the other hand has particle sizes between 0 and 400 µm sizes, D90 and D50
of 216 µm and 338 µm. BET specific surface area values - 3.82 m2
/g (SP1) and 4.52 m2/g (SP2)
respectively on the other hand are similar but a bit lower than that of CEM I 52.5 N, FA and CS.
These BET values are considerably lower than the BET value of SF.
The X-ray CT scanning result of PSD on the dry SAP particles gave similar result as the laser
diffraction method. SP1 has particle sizes within 3 and 300 µm (i.e. ˂ 300 µm), while SP2 has particles
ranging between 3 and 600 µm (i.e. ˂ 600 µm) as presented in Figure 3.9.
Figure 3-9: Particle of SAP obtained from X-ray CT Scanning
D10, D50, D90 values are 90 µm, 160 µm, 240 µm (SP1) and 110 µm, 260 µm, 390 µm (SP2)
respectively. Minimum particle captured in the CT scanning is 2.481 µm since the scan was done at a
2 µm setting. The maximum particle sizes observed are 298.5 µm (SP1) and 451 µm (SP2). SAP
particle size distribution from both the laser diffraction particle analysis and the X-ray CT scanning
are in agreement and affirms the size specification of the manufacturer (SP1 ˂ 300 µm; SP2 ˂ 600 µm).
Stellenbosch University https://scholar.sun.ac.za
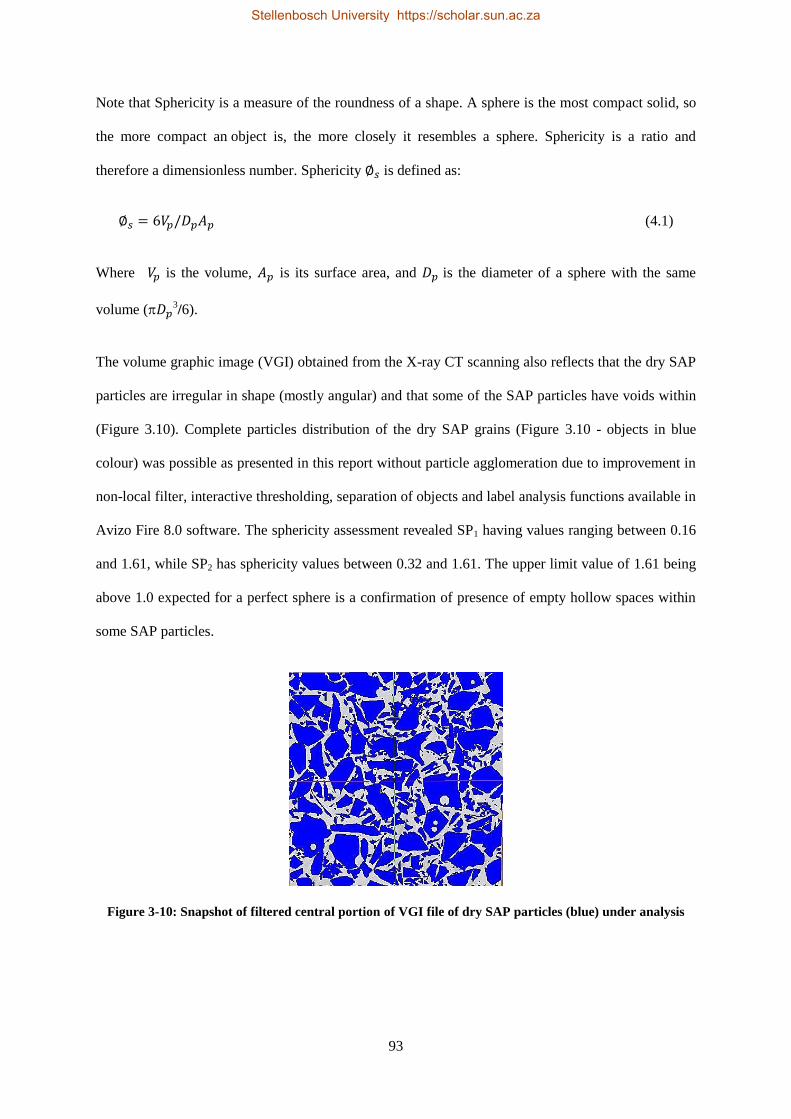
93
Note that Sphericity is a measure of the roundness of a shape. A sphere is the most compact solid, so
the more compact an object is, the more closely it resembles a sphere. Sphericity is a ratio and
therefore a dimensionless number. Sphericity ∅𝑠 is defined as:
∅𝑠 = 6𝑉𝑝/𝐷𝑝𝐴𝑝 (4.1)
Where 𝑉𝑝 is the volume, 𝐴𝑝 is its surface area, and 𝐷𝑝 is the diameter of a sphere with the same
volume (𝐷𝑝3/6).
The volume graphic image (VGI) obtained from the X-ray CT scanning also reflects that the dry SAP
particles are irregular in shape (mostly angular) and that some of the SAP particles have voids within
(Figure 3.10). Complete particles distribution of the dry SAP grains (Figure 3.10 - objects in blue
colour) was possible as presented in this report without particle agglomeration due to improvement in
non-local filter, interactive thresholding, separation of objects and label analysis functions available in
Avizo Fire 8.0 software. The sphericity assessment revealed SP1 having values ranging between 0.16
and 1.61, while SP2 has sphericity values between 0.32 and 1.61. The upper limit value of 1.61 being
above 1.0 expected for a perfect sphere is a confirmation of presence of empty hollow spaces within
some SAP particles.
Figure 3-10: Snapshot of filtered central portion of VGI file of dry SAP particles (blue) under analysis
Stellenbosch University https://scholar.sun.ac.za

94
3.3.2 Inferences
The results and discussion in the previous sections on the constituent materials for this study reflect
that:
i. Choice of fine aggregate for this study was influenced by the demand for coarse sand as
required in literature (Beushausen & Dehn, 2009; Neville, 2012) for HPC of low W/B,
known to have a high fines (i.e. high cement, SF and other pozzolanic materials) content.
The sieved natural sand - SN1 with FM of 2.79 and dust content of 0.31 conforms to the
specifications while the 13 mm greywacke stone used as coarse aggregate is appropriate
for this concrete type.
ii. The binders (CEM I 52.5 N, SF, FA and CS) were all of good fineness with the CEM I
52.5 N, FA and CS reported to be finer than the SF based on laser PSD analysis. This is
however wrong as BET specific surface area analysis reported SF has having the largest
surface area of all the fine constituent materials in the HPCs – an indication of the very
fine nature of the grain sizes of SF. The error in result from laser diffraction was due to
particle agglomeration of SF grains as reported in works of DiStefano et al., (2010) and
Kowalenko & Babuin, (2013).
iii. The CEM I 52.5 N is expected to result in good early strength development and also good
ultimate strength since above 50% of the particles lies between 3 to 30 µm sizes
according to Neville (2012). Same is observed for the particles of FA and CS.
iv. The specific surface area obtained from BET analysis of the various binding materials
including the SF were however noted to be of similar values reported in literature
(Siddique & Khan, 2011) – an indication that the BET results from the study can be taken
as reliable.
v. The SF is thereby adjudged in this study as significantly finer than the other cementitious
materials used and this is responsible for resulting sticky nature of the concrete produced
with SF while FA and CR has additional cementitious materials enhances better
workability of such concretes.
Stellenbosch University https://scholar.sun.ac.za

95
The SAP particles (SP1 and SP2) on the other hand were observed as coarser than the binders. PSD
result from the laser diffraction particle size analysis and the CT-Scanning are in agreement giving
SP1 grains as 0 to 300 µm and SP2 as 0 to 600 µm, affirming the manufacture’s classification of SP1 (
≤ 300 µm) and SP2 ( ≤ 600 µm).
3.4 Summary
Materials, experimental procedure and characterisation of constituent materials adopted for this study
have been presented in this chapter. Properties of the constituent materials for the HPC mixtures and
basis for their choice, the concrete production process and various test set up for preliminary tests,
early age strength properties and the core mechanical properties of the HPC were discussed. Also
included are the procedures for the non-destructive – SEM and CT scanning tests. Results and
discussion of the experimental data for proper understanding of SAP influence on the mechanical
behaviour of this low W/B concrete are presented in the next three chapters.
Stellenbosch University https://scholar.sun.ac.za
96
4
Fresh and Early - Age Strength
Properties of HPC with SAP
Results and discussion of fresh and early-age strength properties of the HPC containing SAP as IC-
agent are presented in this chapter. Results of SAP absorption in water and the CPS conducted with
the tea-bag test and the pH values of the CPS were first reported and discussed as this could explain
the influence of SAP on the cement hydration and early-age strength development process of the HPC
mixtures.
4.1 SAP Absorption and pH-value of CPS
A major property for consideration in SAP utilisation is its absorption and desorption in CPS (CPS) as
discussed in Section 2.4.1 and 2.4.2 with different values of SAP absorbency reported in literature
(Assmann et al., 2014; Jensen & Hansen, 2002; Esteves, 2014; Hasholt et al., 2012, Lura et al., 2006;
Schrofl et al., 2012). There was also an assumption in this study that the concentration of the CPS has
an influence on SAP absorbency and desorption, hence the need to examine SAP absorbency in
different CPS concentrations. Different CPS were simulated and their pH-values determined as
explained in Section 3.2.1.3, just as SAP absorption in these CPS mixtures was determined.
4.1.1 Results
Tables 4.1 reports the results of the pH-value determination of various simulated CPS and the
summary of SAP absorption after 10 minutes in various CPS mixtures. A detailed result of the SAP
absorption for the entire test period (180 minutes) is however presented in Table A2.
Stellenbosch University https://scholar.sun.ac.za
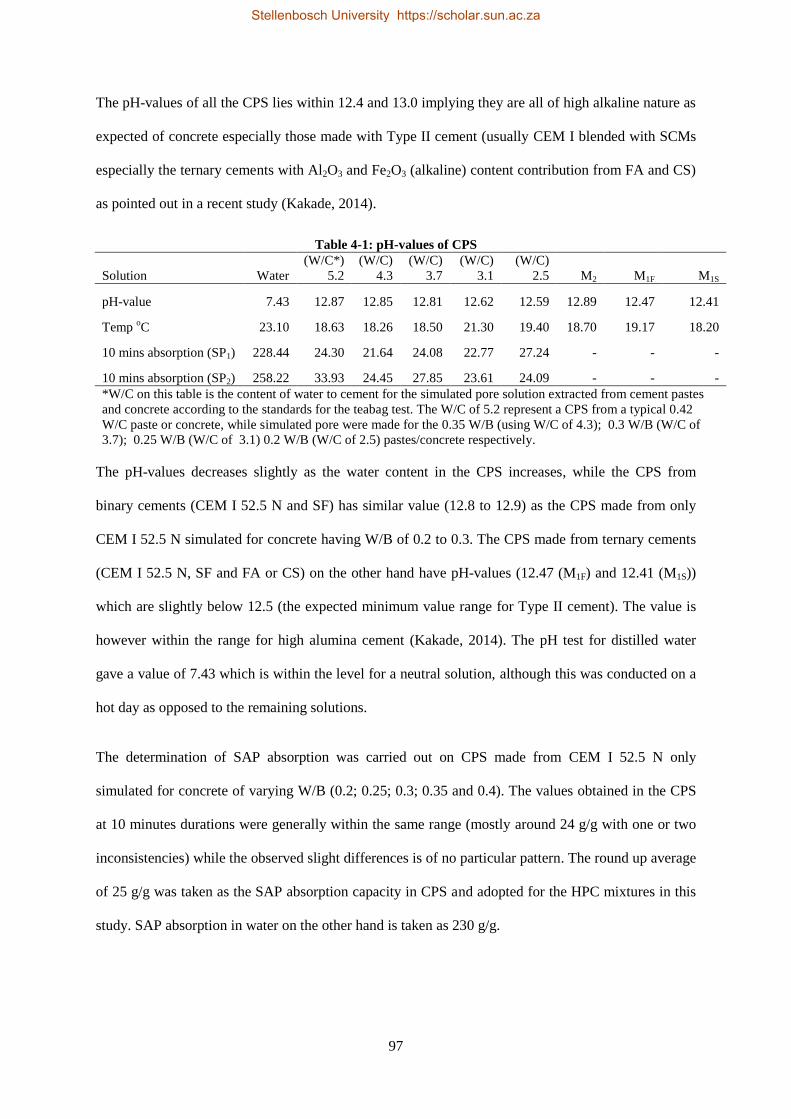
97
The pH-values of all the CPS lies within 12.4 and 13.0 implying they are all of high alkaline nature as
expected of concrete especially those made with Type II cement (usually CEM I blended with SCMs
especially the ternary cements with Al2O3 and Fe2O3 (alkaline) content contribution from FA and CS)
as pointed out in a recent study (Kakade, 2014).
Table 4-1: pH-values of CPS
Solution Water
(W/C*)
5.2
(W/C)
4.3
(W/C)
3.7
(W/C)
3.1
(W/C)
2.5 M2 M1F M1S
pH-value 7.43 12.87 12.85 12.81 12.62 12.59 12.89 12.47 12.41
Temp oC 23.10 18.63 18.26 18.50 21.30 19.40 18.70 19.17 18.20
10 mins absorption (SP1) 228.44 24.30 21.64 24.08 22.77 27.24 - - -
10 mins absorption (SP2) 258.22 33.93 24.45 27.85 23.61 24.09 - - -
*W/C on this table is the content of water to cement for the simulated pore solution extracted from cement pastes
and concrete according to the standards for the teabag test. The W/C of 5.2 represent a CPS from a typical 0.42
W/C paste or concrete, while simulated pore were made for the 0.35 W/B (using W/C of 4.3); 0.3 W/B (W/C of
3.7); 0.25 W/B (W/C of 3.1) 0.2 W/B (W/C of 2.5) pastes/concrete respectively.
The pH-values decreases slightly as the water content in the CPS increases, while the CPS from
binary cements (CEM I 52.5 N and SF) has similar value (12.8 to 12.9) as the CPS made from only
CEM I 52.5 N simulated for concrete having W/B of 0.2 to 0.3. The CPS made from ternary cements
(CEM I 52.5 N, SF and FA or CS) on the other hand have pH-values (12.47 (M1F) and 12.41 (M1S))
which are slightly below 12.5 (the expected minimum value range for Type II cement). The value is
however within the range for high alumina cement (Kakade, 2014). The pH test for distilled water
gave a value of 7.43 which is within the level for a neutral solution, although this was conducted on a
hot day as opposed to the remaining solutions.
The determination of SAP absorption was carried out on CPS made from CEM I 52.5 N only
simulated for concrete of varying W/B (0.2; 0.25; 0.3; 0.35 and 0.4). The values obtained in the CPS
at 10 minutes durations were generally within the same range (mostly around 24 g/g with one or two
inconsistencies) while the observed slight differences is of no particular pattern. The round up average
of 25 g/g was taken as the SAP absorption capacity in CPS and adopted for the HPC mixtures in this
study. SAP absorption in water on the other hand is taken as 230 g/g.
Stellenbosch University https://scholar.sun.ac.za

98
4.1.2 Inferences
The outcome of the study on SAP absorption and pH-value above can be summarised as follows:
i. The pH-values of all the CPS are within 12.4 and 13.0 implying they are all of high
alkaline nature as expected of concrete especially those made with Type II cement as
pointed out in Kakade, (2014).
ii. The pH-values decrease slightly as the water content in the CPS increases, while the CPS
from binary cements (CEM I 52.5 N and SF) have similar value (12.8 to 12.9) as the CPS
made from only CEM I 52.5 N simulated for concrete having W/B of 0.2 to 0.3. The CPS
made from ternary cements (CEM I 52.5 N, SF and FA or CS) on the other hand have
pH-values (12.47 (M1F) and 12.41(M1S)) which are slightly below 12.5 (the expected
minimum value range for Type II cement).
iii. The round up average of 25 g/g (10 mins insertion in CPS) was thereby taken as the SAP
absorption capacity in CPS and adopted for the HPC mixtures in this study while SAP
absorption in water on the other hand is taken as 230 g/g (SP1) and 260 g/g (SP2).
iv. There is no significant difference in influence of CPS concentration on the SAP
absorption capacity. This is within the limit of CPS (5.2 to 10.4 W/C and the binary and
ternary cements (M2, M1F and M1S)) concentration as tested for in this research.
4.2 Fresh Properties of HPC Mixtures
The rheology of fresh concrete is an indication of the possibilities of arriving at the intended strength
and performance properties of the hardened concrete. In HPC, the slump flow as a measure of
workability and consistency is a first measure of appropriateness of the chosen constituent materials
and adequacy of the handling and mix proportioning. The properties examined at the fresh stage of the
HPC mixtures for this study are slump flow, room and concrete temperatures and an assessment of the
actual W/B with account taken of the additional water provided for SAP absorption and the liquid
content of the superplasticiser.
Stellenbosch University https://scholar.sun.ac.za

99
4.2.1 Results of Tests on Fresh Properties
The results of test conducted for fresh properties of the HPC mixtures with SAP are presented in
Tables 4.2 (M2 and M3 from binary cements) and 4.3 (M1F and M1S from ternary cements).
Table 4-2: Mix constituents and fresh properties of HPC mixtures from binary cements
Constituents
(kg/m3)
M₂ M₃
Ref SP₁ SP₂ Ref SP₁ SP₂
SAP contents% 0.0 0.2 0.3 0.4 0.2 0.3 0.4 0.0 0.2 0.3 0.4 0.2 0.3 0.4
Water 134 134 134 134 134 134 134 156 156 156 156 156 156 156
Cement 540 540 540 540 540 540 540 500 500 500 500 500 500 500
SF 40 40 40 40 40 40 40 40 40 40 40 40 40 40
FA 0.0 0.0 0.0 0.0 0.0 0.0 0.0 0.0 0.0 0.0 0.0 0.0 0.0 0.0
CS 0.0 0.0 0.0 0.0 0.0 0.0 0.0 0.0 0.0 0.0 0.0 0.0 0.0 0.0
C. Aggregate 1050 1050 1050 1050 1050 1050 1050 1050 1050 1050 1050 1050 1050 1050
F. Aggregate 710 710 710 710 710 710 710 700 700 700 700 700 700 700
SAP 0.00 1.16 1.74 2.32 1.16 1.74 2.32 0.00 1.08 1.62 2.16 1.08 1.62 2.16
S/plasticizer 16.0 16.0 16.0 16.0 16.0 16.0 16.0 5.4 5.4 5.4 5.4 5.4 5.4 5.4
Additional Water 0.00 29.00 43.50 58.00 29.00 43.50 58.00 0.00 27.00 40.50 54.00 27.00 40.50 54.00
Total W/B 0.25 0.30 0.33 0.35 0.30 0.33 0.35 0.30 0.35 0.37 0.40 0.35 0.37 0.40
Slump Flow 550 530 580 550 550 580 570 500 500 500 450 460 450 450
Room Temperature oC 19.0 17.0 17.0 16.0 14.0 16.5 16.1 18.0 19.5 19.5 19.5 18.0 16.0 16.0
Concrete Temperature oC 26.0 24.0 23.0 22.0 21.0 21.8 20.3 22.0 23.6 23.5 23.5 20.0 18.0 18.0
Designed Density* 2490 2520 2535 2550 2520 2535 2550 2451 2479 2494 2508 2479 2494 2508
Demoulded Density 2486 2457 2431 2407 2469 2429 2409 2413 2399 2344 2357 2382 2405 2394
Total Porosity % 0.17 2.52 4.13 5.61 2.03 4.21 5.53 1.58 3.25 6.00 6.00 3.92 3.56 4.54
air content - SAP voids % 0.17 1.36 2.39 3.29 0.87 2.47 3.21 1.58 2.17 4.38 3.84 2.84 1.94 2.38
(a-a0) 0.00 1.19 2.22 3.13 0.70 2.30 3.04 0.00 0.59 2.79 2.26 1.26 0.36 0.80
(1-B (a-a0)) 1.00 0.96 0.93 0.90 0.98 0.92 0.90 1.00 0.98 0.91 0.93 0.96 0.99 0.97
Table 4-3: Mix constituent and fresh properties of HPC mixtures from ternary cements
Constituents
(kg/m3) M₁F M₁S
Ref SP₁ SP₂ Ref SP₁ SP₂
SAP Contents% 0 0.2 0.3 0.4 0.2 0.3 0.4 0 0.2 0.3 0.4 0.2 0.3 0.4
Water 125 125 125 125 125 125 125 125 125 125 125 125 125 125
Cement 530 530 530 530 530 530 530 530 530 530 530 530 530 530
SF 52.5 52.5 52.5 52.5 52.5 52.5 52.5 52.5 52.5 52.5 52.5 52.5 52.5 52.5
FA 122.5 122.5 122.5 122.5 122.5 122.5 122.5 0.0 0.0 0.0 0.0 0.0 0.0 0.0
CS 0.0 0.0 0.0 0.0 0.0 0.0 0.0 122.5 122.5 122.5 122.5 122.5 122.5 122.5
C. Aggregate 1050 1050 1050 1050 1050 1050 1050 1050 1050 1050 1050 1050 1050 1050
F. Aggregate 590 590 590 590 590 590 590 590 590 590 590 590 590 590
SAP 0.00 1.41 2.12 2.82 1.41 2.12 2.82 0.00 1.41 2.12 2.82 1.41 2.12 2.82
S/plasticizer 21.0 21.0 21.0 21.0 21.0 21.0 21.0 21.0 21.0 21.0 21.0 21.0 21.0 21.0
Additional Water 0.00 35.25 52.88 70.50 35.25 52.88 70.50 0.00 35.25 52.88 70.50 35.25 52.88 70.50
Total w/b 0.20 0.25 0.28 0.30 0.25 0.28 0.30 0.20 0.25 0.28 0.30 0.25 0.28 0.30
Slump Flow 570 550 550 560 550 600 550 450 450 500 500 500 500 550
Room Temperature oC 16.0 16.0 16.0 16.5 16.5 16.0 16.0 11.5 11.0 15.0 14.0 15.0 14.0 15.0
Concrete Temperature oC 23.0 22.0 21.0 22.0 23.0 23.0 23.5 20.0 18.5 20.0 18.0 20.0 18.0 19.5
Designed Density * 2491 2528 2546 2564 2528 2546 2564 2503 2540 2558 2576 2540 2558 2576
Demoulded Density 2477 2417 2379 2394 2466 2402 2406 2498 2438 2444 2412 2450 2431 2412
Total Porosity % 0.58 4.39 6.56 6.66 2.43 5.67 6.17 0.20 3.99 4.47 6.38 3.52 4.96 6.39
air content - SAP voids % 0.58 2.98 4.44 3.84 1.02 3.56 3.35 0.20 2.58 2.35 3.56 2.11 2.84 3.57
(a-a0) 0.00 2.40 3.87 3.26 0.44 2.98 2.77 0.00 2.38 2.16 3.37 1.92 2.64 3.38
(1-B (a-a0)) 1.00 0.92 0.87 0.89 0.98 0.90 0.91 1.00 0.92 0.93 0.88 0.93 0.91 0.88
Stellenbosch University https://scholar.sun.ac.za
100
*Note that the “design density” (dd) in Table 4.2 and 4.3for HPC with SAP was arrived at by the
addition of the weight of SAP and extra water added for SAP absorption to the initial calculated
weight in kg/m3 for the reference mixture, hence the increase. The “demoulded density” (dmd) was
determined by dividing the direct weight of the demoulded concrete with the measured volume of
individual concrete cube. The density value at a specific curing age was the average of three
specimens for that age divided by the average of the demoulded densities for all the twelve specimens
of an HPC mixture.
Total porosity % = 𝑑𝑑−𝑑𝑚𝑑
𝑑𝑑 𝑋 100 (4.1)
It is evident from the results that the total W/B increases as the SAP content increases while the slump
flow values on the other hand remain in the same range for all HPC mixtures (530 to 570 mm – M2;
450 to 500 mm – M3; 550 mm to 600 mm – M1F and 450 to 500 mm – M1S). M1F is however more
flow-able than M1S, while M2 is more flow-able than M3. The result (Tables 4.2 and 4.3), thereby
reflecting that all the HPC mixtures are of similar workability (slump low range 450 mm – 600 mm)
as expected from literature (Neville, 2012). SAP addition and extra water provided for SAP
absorption did not result in higher slump flow values. The difference between room temperature
(RTemp) and concrete temperature (CTemp) decreased gradually as the SAP content increased with
reference mixes having the highest temperature difference values. Evolving high heat of hydration is
typical of binders containing SF and this had always necessitated the introduction of water reducers
especially the lignosulfate based to serve as set retarder by reducing the heat evolved (Silica Fume
Association, 2005). The water-filled swollen SAP within the HPC during the vigorous mixing process
possibly released some of water absorbed, or serves as means of reducing the temperature rise through
conduction, from the agitated solid constituents into the absorbed water within the SAP particles. This
lowers the internal concrete temperature.
All the HPC mixtures irrespective of SAP contents and mix composition were noted to be of slump
flow values conforming to provisions of literature (Aītcin, 1998; ACI 363.2R - 1998; Beushausen &
Stellenbosch University https://scholar.sun.ac.za

101
Dehn, 2009; Mehta & Monteiro, 2014; Neville, 2012). The mixtures were all of similar consistency
even with SAP added and no segregation was observed.
4.2.2 Inferences
The results of tests carried out on fresh concrete as presented above offer the following inferences:
i. SAP addition with extra water has no direct influence on the consistency of the HPC
mixtures.
ii. Although the total W/B increases as the SAP content increases (with extra water added
for SAP absorption), the slump flow values remain in the same range for all HPC
mixtures (530 to 570 mm – M2; 450 to 500 mm – M3; 550 mm to 600 mm – M1F and 450
to 500 mm – M1S).
iii. The temperature difference between room temperature (RTemp) and concrete
temperature (CTemp) decreased gradually as the SAP content increased with reference
mixes having the highest temperature difference values.
iv. All the HPC mixtures irrespective of SAP contents and mix composition were noted to be
of slump flow values conforming to reports in literature (Aītcin, 1998; ACI 363.2R -
1998; Beushausen & Dehn, 2009; Mehta & Monteiro, 2014; Neville, 2012). This implies
that the water added for SAP absorption was effectively taken by the SAP particles in the
mixtures and available for IC purposes when released by SAP as hydration progresses.
4.3 Setting Times and Early-Age Strength Development
Setting times and early-age strength development are properties of concrete which depict the
hydration process of cement in the early ages of concrete. These properties are noted in literature
(Mehta & Monteiro, 2014; Neville, 2012) to be influenced by physical and chemical properties of the
composite materials of concrete, the mix composition and condition of the curing environment.
Stellenbosch University https://scholar.sun.ac.za

102
4.3.1 Results
The results and discussion for this aspect of the study are classified into three major sub-topics and are
presented in the following sections.
4.3.1.1 Setting times of HPC with SAP
Figures 4.1 to 4.4 present the results of setting time test using concrete penetrometer in accordance to
ASTM C403 – 08. The fresh mortar extracted form HPC mixtures cast into 150 mm cube moulds
were kept in a climate control room and readings were taken at intervals as discussed in Section
3.2.3.1. A plot of the penetration resistance (MPa) against the elapsed time (in minutes) as shown in
Figure 4.1 for M2 fitted on a power regression line gave the setting times with the expression:
𝑌 = (2𝐸 − 21)𝑋8.8671 ; having a strong correlation (R2 = 0.9851)
Y in the expression represents the penetration resistance (PR); X represents the elapsed time and the
regression constants c (2E – 21) and d (8.8671) are in similarity to the code (ASTM 403 – 08)
provisions. Plots for individual HPC mixtures summarised as shown in Appendix A4, gave similar
expressions having strong correlations too.
Figure 4-1: Setting times (initial and final) plot of M2-HPC mixture
Stellenbosch University https://scholar.sun.ac.za
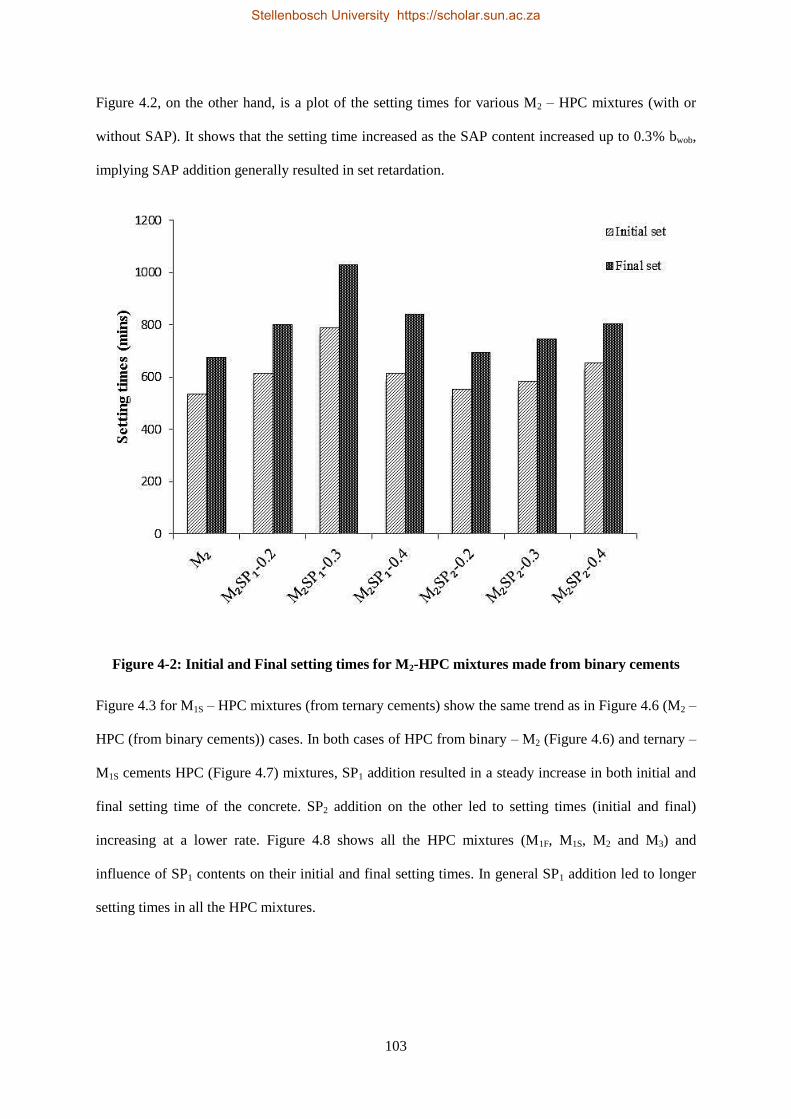
103
Figure 4.2, on the other hand, is a plot of the setting times for various M2 – HPC mixtures (with or
without SAP). It shows that the setting time increased as the SAP content increased up to 0.3% bwob,
implying SAP addition generally resulted in set retardation.
Figure 4-2: Initial and Final setting times for M2-HPC mixtures made from binary cements
Figure 4.3 for M1S – HPC mixtures (from ternary cements) show the same trend as in Figure 4.6 (M2 –
HPC (from binary cements)) cases. In both cases of HPC from binary – M2 (Figure 4.6) and ternary –
M1S cements HPC (Figure 4.7) mixtures, SP1 addition resulted in a steady increase in both initial and
final setting time of the concrete. SP2 addition on the other led to setting times (initial and final)
increasing at a lower rate. Figure 4.8 shows all the HPC mixtures (M1F, M1S, M2 and M3) and
influence of SP1 contents on their initial and final setting times. In general SP1 addition led to longer
setting times in all the HPC mixtures.
Stellenbosch University https://scholar.sun.ac.za

104
Figure 4-3: Initial and Final setting times of M1S - HPC mixtures made from ternary cements
Figure 4-4: Initial and Final setting times of HPC mixtures with SAP1
The results for 0.4% SAP contents in both instances for SP1 deviates slightly from this trend.
The findings of this study of generally retardation as caused by SAP addition is in agreement with the
findings in previous studies as stated earlier in Section 2.4.3. Lura et al. (2012) reported higher 𝑤𝑛 at
28 days in cement pastes with SAP compared to reference mixtures while Klemm (2009) observed
significant influence due to SAP addition on the dormant period of the paste.
Stellenbosch University https://scholar.sun.ac.za

105
4.3.1.2 Degree of hydration of HPC with SAP
Degree of hydration of the HPC with SAP is presented in Figures 4.9 and 4.10 for M2 – HPC mixtures
(made from binary cements [CEM I 52.5 N+ SF]) and M1S – HPC mixtures (made from ternary
cement [CEM I 52.5 N+ SF + CS]), respectively. Table 4.6 gives a summary of results on degree of
hydration for all the HPC mixtures studied. M1F and M3 mixtures were only examined for SP1 while
M2 and M1S were studied for both SP1 and SP2 to investigate influence of SAP types on rate of
hydration when different binder combination types are used.
The result shows that degree of hydration generally increases as the SAP content increases for all
curing ages studied with an indication that SP2 resulted in higher degree of hydration than SP1 with
few inconsistencies. Similarly, the higher the W/B, the higher the early age hydration (M3 – HPCs
with the highest water content – 0.3 W/B recorded the highest degree of hydration). The relative rates
of hydration called RH7 factor (on basis of 7th day degree of hydration for reference mixtures) were
highest for M1F (the ternary cement HPC of 0.2 W/B containing FA).
Examining SAP type for both binder combination types (binary – M2 or ternary – M1S cements) as
shown in Figures 4.5 and 4.6, reveals that SP2 has hydration rate generally higher than SP1 especially
for ages 3days to 7days. Generally, HPC mixtures from ternary cements (M1S) even though with lower
W/B reflected higher degree of hydration at the initial 24 hrs (values for the reference mixes are: -
M1S = 31.3% and M2 = 25.0%); this however progressed at a slower rate than seen in the binary
cements HPC mixtures (M1S at 7th day = 39.2% while M2 = 53.9%). The same trend is maintained
even as SAP addition increases in the HPC mixtures. The degree of hydration between day 3 and 7 is
however highest in the binary cement HPC mixtures (M2 and M3) with the mixture having the higher
W/B (0.3) – M3 HPC displaying highest degree of hydration at these ages up to 7days. The value by
the 7th day was noted to be already above 60% for the specimen with highest SP1 content (M3SP1-0.4).
Stellenbosch University https://scholar.sun.ac.za
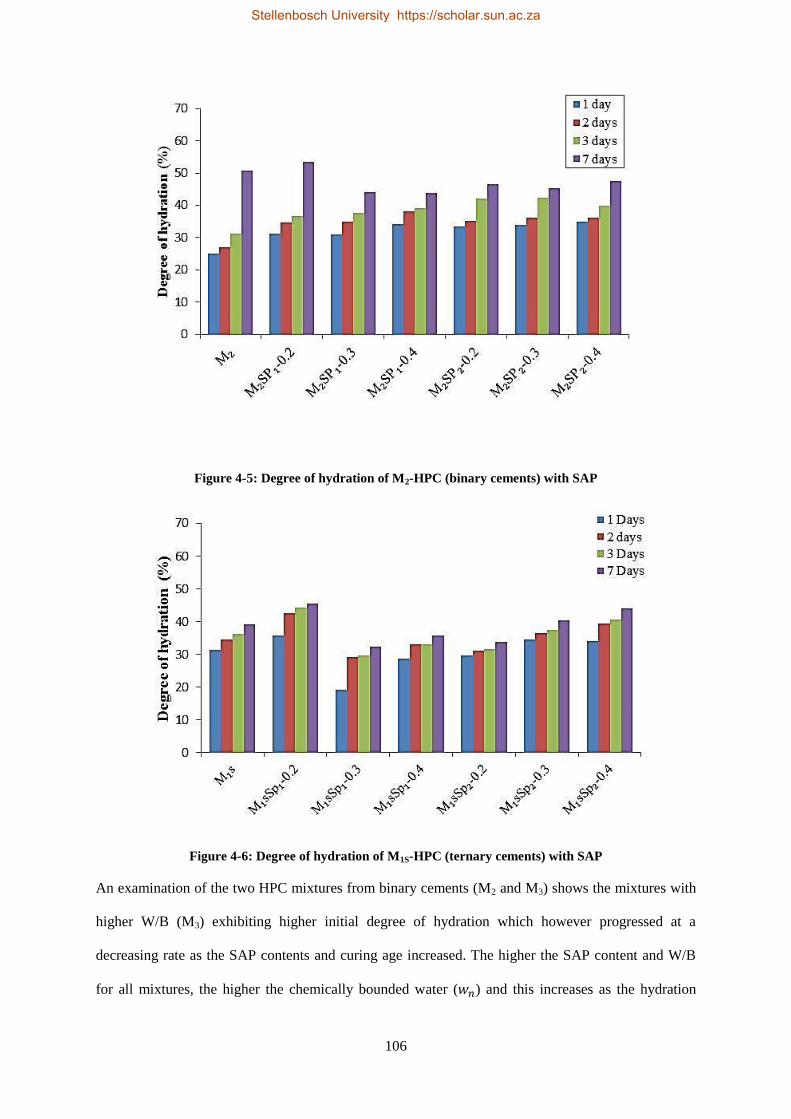
106
Figure 4-5: Degree of hydration of M2-HPC (binary cements) with SAP
Figure 4-6: Degree of hydration of M1S-HPC (ternary cements) with SAP
An examination of the two HPC mixtures from binary cements (M2 and M3) shows the mixtures with
higher W/B (M3) exhibiting higher initial degree of hydration which however progressed at a
decreasing rate as the SAP contents and curing age increased. The higher the SAP content and W/B
for all mixtures, the higher the chemically bounded water (𝑤𝑛) and this increases as the hydration
Stellenbosch University https://scholar.sun.ac.za

107
period increases. The RH7 factor for the HPC mixtures containing SAP shows that hydration
increased as the SAP contents increases for all concrete W/B at the respective ages of curing.
The M1SSP1-0.3 – HPC mixture does not conform to the observed trend of the experimental work in
this aspect as the values obtained for these specimens (green highlights on Table 4.4) generally
deviates from the trend observed. 0.2% bwob for SP1 content was however noted to give similar or
even higher values as reference mixes in all cases and at all ages. The mixing water provided in the
mix proportioning as a function of W/B can be adjudged as a major influence on hydration in general
in these low W/B concretes at the early ages as all mixtures studied had the same SF content. FA and
CS addition in M1F and M1S retard the hydration process for the first two days; their inclusion
however also improved workability and slump retention capacity for the extreme low W/B concretes.
Table 4-4: Influence of SAP and binder type on degree of hydration of HPC
Specimen
Degree of Hydration (%) RH7 Factor
1 day 2 days 3 days 7 days 1 2 3 7
M2 25.0 26.3 30.2 53.9 0.46 0.49 0.56 1.00 M2SP1-0.2 31.2 32.9 34.4 54.0 0.58 0.61 0.64 1.00 M2SP1-0.3 31.1 39.9 57.9 62.6 0.58 0.74 1.08 1.16 M2SP1-0.4 34.2 38.1 63.2 65.5 0.63 0.71 1.17 1.21 M2SP2-0.2 33.4 35.3 42.0 42.7 0.62 0.65 0.78 0.79 M2SP2-0.3 33.4 36.2 42.5 48.8 0.62 0.67 0.79 0.91 M2SP2-0.4 31.1 32.9 40.0 47.6 0.58 0.61 0.74 0.88
M1S 31.3 34.6 36.2 39.2 0.80 0.88 0.93 1.00 M1S SP1-0.2 35.7 42.6 44.4 45.5 0.91 1.09 1.13 1.16 M1S SP1-0.3 19.3 29.2 29.7 32.3 0.49 0.74 0.76 0.82 M1S SP1-0.4 28.8 33.0 33.2 35.7 0.73 0.84 0.85 0.91 M1S SP2-0.2 29.7 31.2 31.7 33.9 0.76 0.80 0.81 0.87 M1S SP2-0.3 34.5 36.4 37.5 40.4 0.88 0.93 0.96 1.03 M1S SP2-0.4 34.1 39.3 40.7 44.2 0.87 1.00 1.04 1.13
M1F 36.3 39.4 41.1 45.9 0.79 0.86 0.90 1.00 M1F SP1-0.2 39.9 45.2 46.9 48.6 0.87 0.98 1.02 1.06 M1F SP1-0.3 37.6 43.1 50.2 55.6 0.82 0.94 1.09 1.21 M1F SP1-0.4 45.1 50.0 53.7 59.5 0.98 1.09 1.17 1.30
M3 43.8 47.9 50.6 57.1 0.77 0.84 0.89 1.00 M3SP1-0.2 47.6 50.6 52.0 58.6 0.83 0.89 0.91 1.03 M3SP1-0.3 52.6 55.1 55.1 62.0 0.92 0.97 0.97 1.09 M3SP1-0.4 53.9 56.6 57.8 65.1 0.94 0.99 1.01 1.14
4.3.1.3 Early-age strength development of HPC with SAP
The early-age strength development plot for the reference mixes (Figure 4.7) shows a conformance
with the relationship postulated for SF- concrete at one to ten days (t1 – t10) of hydration by Kadri et al
(2012) as presented in Equation 2.13. The compressive strength increased linearly according to
Stellenbosch University https://scholar.sun.ac.za

108
logarithm of time t (𝑅 = 𝐴 + 𝐵 log𝑡𝑑
𝑡1 ), the coefficient A being the intercept on the compressive
strength axis while B is the kinetic of the hydration reaction. The coefficient B in this particular test
increased slightly as the W/B increased. Since the SF content was kept constant for all mixes while
two of the HPC mixtures contain additional pozzolanic materials (FA and CS) to achieve the
extremely low W/B concretes (M1F and M1S). Further influence of these other pozzolanic materials is
however noted on the kinetics of the hydration reaction. The results shows a higher value of the B
coefficient for the HPC made from ternary cements having CS as an addition (M1S) than the one in
which FA was added. This implies that CS addition enhances an improved early-age strength
development than FA. The CS boosted reference HPC mixture (M1S) exhibited the highest
compressive strength value of 115 MPa at the 7 day moving from initial one day strength of 44 MPa.
The FA boosted HPC mixture (M1F) on the other hand had a 7 day compressive strength of 100 MPa
moving from one day strength of 39 MPa. The binary cement HPC mixtures (M2 and M3) however
present similar values for the kinetic of the hydration reaction. The 1 and 7 days compressive strength
value of M2 can however be considered non-conforming and the reason for the slight drop in the R2
value of the regression (best fit trend-line) equation for this particular HPC mixture.
Figure 4-7: Early-age strength development of control HPC mixes
Stellenbosch University https://scholar.sun.ac.za

109
Figures 4.8 to 4.12 present the plot of SAP influence on the early-age strength development of the
respective HPC mixtures. The respective reference mixes were studied with SAP Type 1 (SP1) while
only M1S had mixtures produced for this particular experiment using both SAP types (SP1 and SP2).
The results show that compressive strength value at this early age decreases as the SAP content
increases for all HPC mixtures. There is a progressive increase in strength as the hydration period
increases for all samples studied.
Figure 4-8: SP1 influence on early-age strength development of M2- HPC
Figure 4-9: SP1 influence on early-age strength of M3-HPC
Stellenbosch University https://scholar.sun.ac.za

110
Figure 4-10: SP1 influence on early-age strength of M1F-HPC
Figure 4-11: SP1 influence on early-age strength of M1S-HPC
Stellenbosch University https://scholar.sun.ac.za

111
Figure 4-12: SP2 influence on early-age strength of M1S – HPC
The compressive strength increase linearly according to logarithm of time t for all the HPC’s
containing SAP as IC-agent also conforming to the Kadri et al., (2012) expression of:
𝑅 = 𝐴 + 𝐵 log𝑡𝑑
𝑡1 (2.13).
All the HPC mixtures (Figure 4.8 to 4.12) show similar values for coefficient B (kinetic of hydration
reaction) at a good correlation for all levels of SAP addition.
4.3.2 Inferences
The findings of the experiments in this sub-section can thereby be summarised as follows:
i. SAP addition in general resulted in longer setting times (both the initial and final) in all
HPC mixtures. Setting time is observed to increase as SAP content increased up to a limit
of 0.3%, hence SAP addition can be said to result in some level of set retardation. This is
in agreement with the observation of Klemm (2009) that SAP addition led to longer
dormant period as mentioned earlier in Section 2.4.3.
ii. This is of advantage in this low W/B concrete types which are known to be susceptible to
rapid self-desiccation-caused autogenous shrinkage deformation on exposure to
Stellenbosch University https://scholar.sun.ac.za

112
atmosphere especially with very fine cement used (Neville, 2012). SAP addition will
enhance the slump retention time and hence longer time to work with the concrete in the
production process. It might however be a disadvantage in early concrete de-moulding on
site. A slower concrete setting with SAP addition in cement coupled with pozzolanic
materials (FA and CS) addition can also be a way of mitigating strong reaction with
alkali-reactive aggregates in finer cements (Neville, 2012).
iii. SP1 –HPC displayed longer initial and final setting time than the SP2 -HPC. The better
distribution of the smaller water reservoirs (SP1) in these mixtures can be adduced to have
made the water available for longer period and better distributed within the concrete
phases, hence longer water retention.
iv. Addition of both FA and CS resulted in similar setting times (initial and final) for all SAP
contents.
v. The degree of hydration of the HPC mixtures increases as the SAP content increases with
an indication that SP2 results in higher degree of hydration than SP1 in both binder
combination types (binary – M2 or ternary – M1S cements). This is because the larger SP2
grains resulted in bigger swollen SAP and hence higher water desorption at the early age
for cement hydration. This finding agrees well with the postulation made by Mönnig
(2009).
vi. The binary cement with highest W/B (M3) reflected good early age degree of hydration
but progressed at a lower rate as the age increased. The degree of hydration after 1 day is
43.8% and still remains at 57.1% after 7 days.
vii. The influence of SAP addition on rate of hydration is noted to be highest in the HPC
mixtures containing FA (M1F mixtures) and increased at similar rate as HPC mixtures
containing CS (M1S mixtures). The RH7 factor for M1F specimen is 0.79 after 1 day, while
the specimen with highest SAP content – M1FSp1-0.4 already has a RH7 factor of 1.30
after 7 days.
viii. The higher the SAP content and W/B for all mixtures, the higher the chemically bounded
water (𝑤𝑛) at specific times and this increased as the hydration period increased.
Stellenbosch University https://scholar.sun.ac.za

113
4.4 Microstructure and Chemical Composition
The results presented in the following sections are the SEM image, BSE/WDS analysis and FTIR (for
amorphous silica content) of the binders.
4.4.1 SEM images of the binders and SAP particles
4.4.1.1 SEM Images of binders
The SEM images of the various materials combined as binder (CEM I 52.5 N, SF, FA and CS) are
shown in Figures 4.13 to 4.16. The SEM images reveal that CEM I 52.5 N used in this study when
viewed at 50 X magnification (Figure 4.13 a) and 500 X magnification (Figure 4.13 b) settings is
irregular if not angular in shape, it is also interlinked but has some micro-air spaces (dark/black spots
(C) on Figure 4.13 b) separating the grains, thereby making the individual grains to be easily
identified. The SF (Figure 4.14) is more closely packed (sticky) than the CEM I 52.5 N with no or
little air spaces within the particles. Some large particles sizes can however be viewed in the pressed
pellet of the SF (Figure 4.14 b). The CEM I 52.5 N SEM image revealed two grey scale levels for the
particles (i.e. light grey (A) and dark grey (B) in Figure 4.13 b representing alite and belite
respectively). The SEM image for SF show only one sticky grey colour (B) of Figure 4.14 b as
background particles with some scattered white substance (D) all around, while the dark spots (C)
were scanty too. The white substance should indicate presence of some ferrite or aluminate and the
grey should be majorly silica.
The SEM images of CS and FA (Figures 4.15 and 4.16) show two distinct features despite their
similarity by physical visualisation. CS particles are majorly angular while the FA particles are
spherical in shape. CS particles are similar in shape to the CEM I 52.5 N; they inter-connect too with
micro-air spaces (C) within the grains. The CS particles (Figure 4.15 b) are also dominantly of one
grey colour (B) with some white substance (D) within. This also indicates the presence of ferrite or
aluminate in a supposed majorly calcium and silicon composition. The FA particles (Figure 4.16)
being spherical can be identified clearly as individual particles and has many large pieces with hollow
Stellenbosch University https://scholar.sun.ac.za

114
spheres (C) within which according to Ramezanianpour (2014) contain smaller particles. They are of
one grey colour scale (B) and show presence of dispersed white substances (D) too.
(a)
(b)
Figure 4-13: SEM image of microstructure of CEM I 52.5 N (a) 50 X and (b) 500 X magnifications
A
B
C
Stellenbosch University https://scholar.sun.ac.za

115
(a)
(b)
Figure 4-14: SEM image of microstructure of SF (a) 50 X and (b) 500 X magnifications
D
C
C
B
Stellenbosch University https://scholar.sun.ac.za
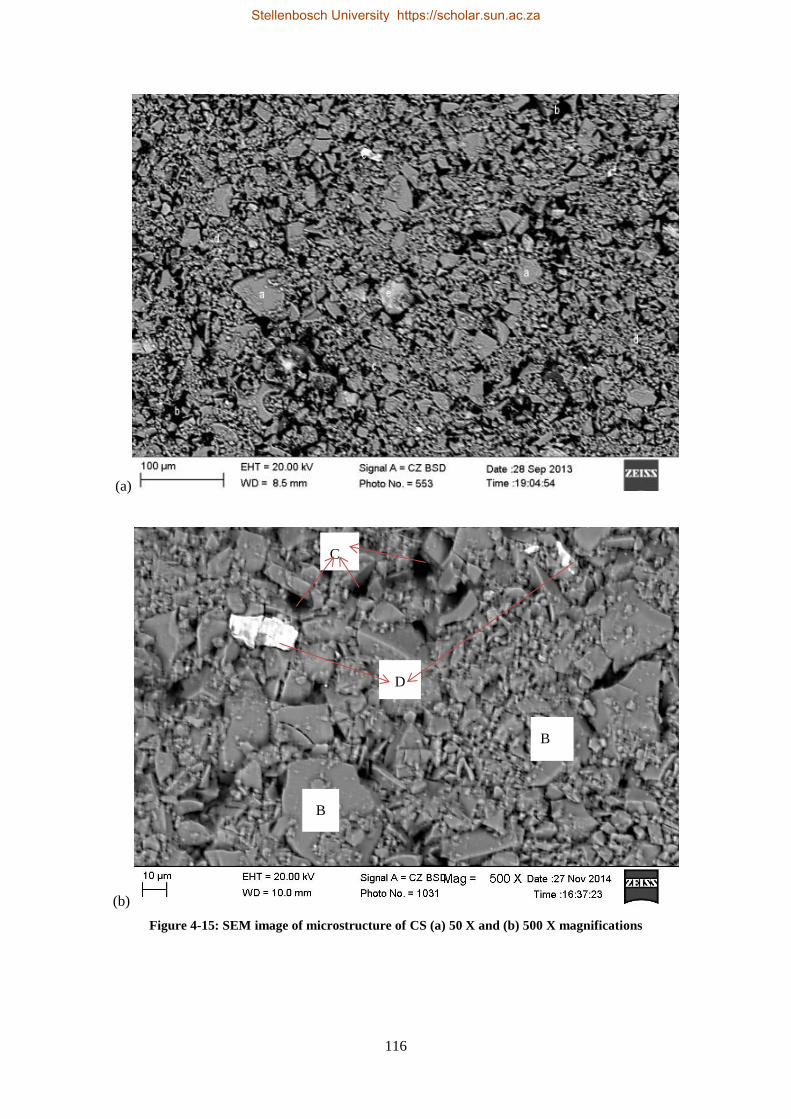
116
(a)
(b)
Figure 4-15: SEM image of microstructure of CS (a) 50 X and (b) 500 X magnifications
D
B
B
C
Stellenbosch University https://scholar.sun.ac.za

117
(a)
(b)
Figure 4-16: SEM image of FA (a) 50 X and (b) 500 X magnifications
The FA being spherical and having more inter-grain spaces could possibly explain their low water
demand in concrete than the SF and the ability to enhance better workability in concrete.
C
E
B
Stellenbosch University https://scholar.sun.ac.za

118
The dry SAP particles were however observed under the SEM (Figure 4.17) as irregular (mostly
angular) in shape with SP1 been about 300 µm maximum diametric size (Figure 4.17a) while SP2 is
slightly above 400 µm in size (Figure 4.17b).
(a)
(b)
Figure 4-17: SEM image SAP particles (a) SP1 and (b) SP2
Stellenbosch University https://scholar.sun.ac.za
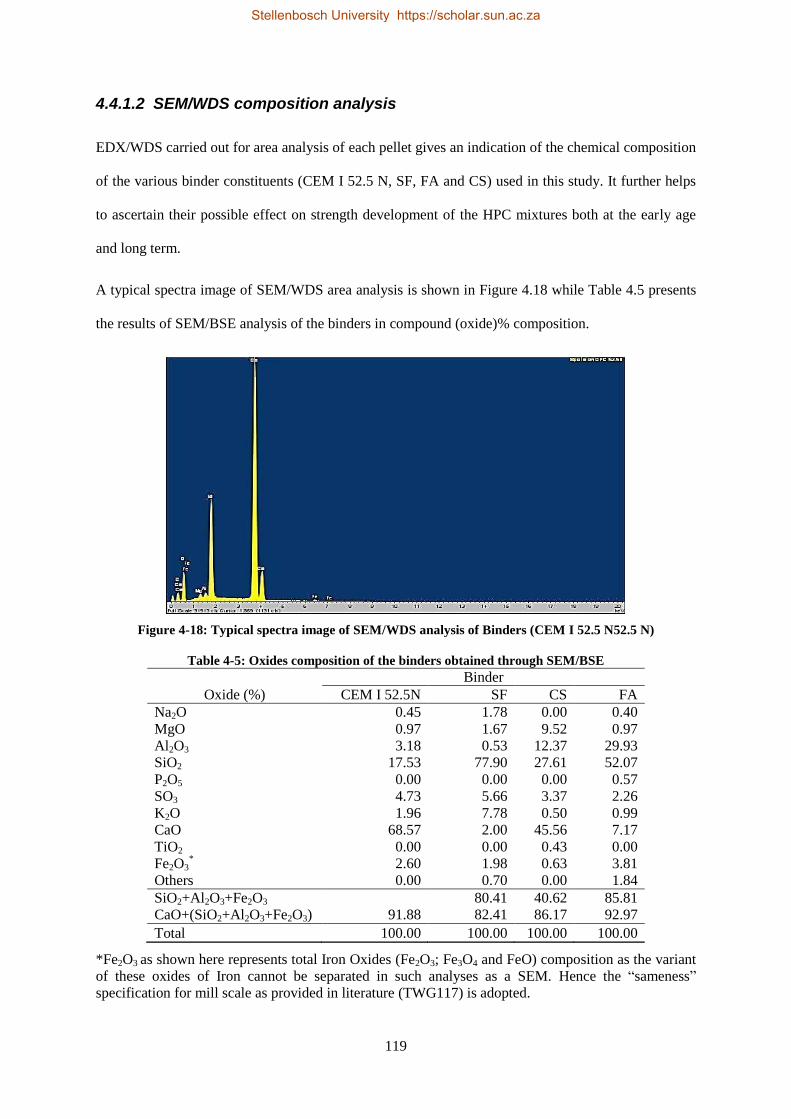
119
4.4.1.2 SEM/WDS composition analysis
EDX/WDS carried out for area analysis of each pellet gives an indication of the chemical composition
of the various binder constituents (CEM I 52.5 N, SF, FA and CS) used in this study. It further helps
to ascertain their possible effect on strength development of the HPC mixtures both at the early age
and long term.
A typical spectra image of SEM/WDS area analysis is shown in Figure 4.18 while Table 4.5 presents
the results of SEM/BSE analysis of the binders in compound (oxide)% composition.
Figure 4-18: Typical spectra image of SEM/WDS analysis of Binders (CEM I 52.5 N52.5 N)
Table 4-5: Oxides composition of the binders obtained through SEM/BSE
Oxide (%)
Binder
CEM I 52.5N SF CS FA
Na2O 0.45 1.78 0.00 0.40
MgO 0.97 1.67 9.52 0.97
Al2O3 3.18 0.53 12.37 29.93
SiO2 17.53 77.90 27.61 52.07
P2O5 0.00 0.00 0.00 0.57
SO3 4.73 5.66 3.37 2.26
K2O 1.96 7.78 0.50 0.99
CaO 68.57 2.00 45.56 7.17
TiO2 0.00 0.00 0.43 0.00
Fe2O3*
2.60 1.98 0.63 3.81
Others 0.00 0.70 0.00 1.84
SiO2+Al2O3+Fe2O3
80.41 40.62 85.81
CaO+(SiO2+Al2O3+Fe2O3) 91.88 82.41 86.17 92.97
Total 100.00 100.00 100.00 100.00
*Fe2O3 as shown here represents total Iron Oxides (Fe2O3; Fe3O4 and FeO) composition as the variant
of these oxides of Iron cannot be separated in such analyses as a SEM. Hence the “sameness”
specification for mill scale as provided in literature (TWG117) is adopted.
Stellenbosch University https://scholar.sun.ac.za
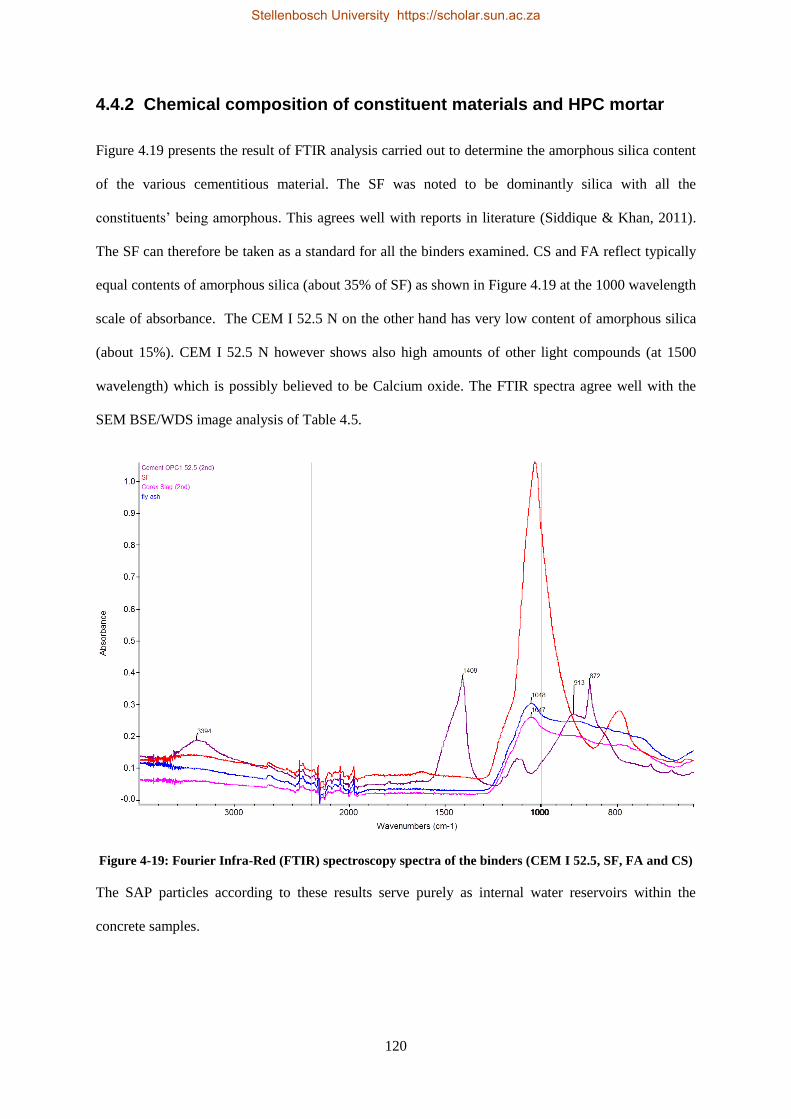
120
4.4.2 Chemical composition of constituent materials and HPC mortar
Figure 4.19 presents the result of FTIR analysis carried out to determine the amorphous silica content
of the various cementitious material. The SF was noted to be dominantly silica with all the
constituents’ being amorphous. This agrees well with reports in literature (Siddique & Khan, 2011).
The SF can therefore be taken as a standard for all the binders examined. CS and FA reflect typically
equal contents of amorphous silica (about 35% of SF) as shown in Figure 4.19 at the 1000 wavelength
scale of absorbance. The CEM I 52.5 N on the other hand has very low content of amorphous silica
(about 15%). CEM I 52.5 N however shows also high amounts of other light compounds (at 1500
wavelength) which is possibly believed to be Calcium oxide. The FTIR spectra agree well with the
SEM BSE/WDS image analysis of Table 4.5.
Figure 4-19: Fourier Infra-Red (FTIR) spectroscopy spectra of the binders (CEM I 52.5, SF, FA and CS)
The SAP particles according to these results serve purely as internal water reservoirs within the
concrete samples.
Stellenbosch University https://scholar.sun.ac.za
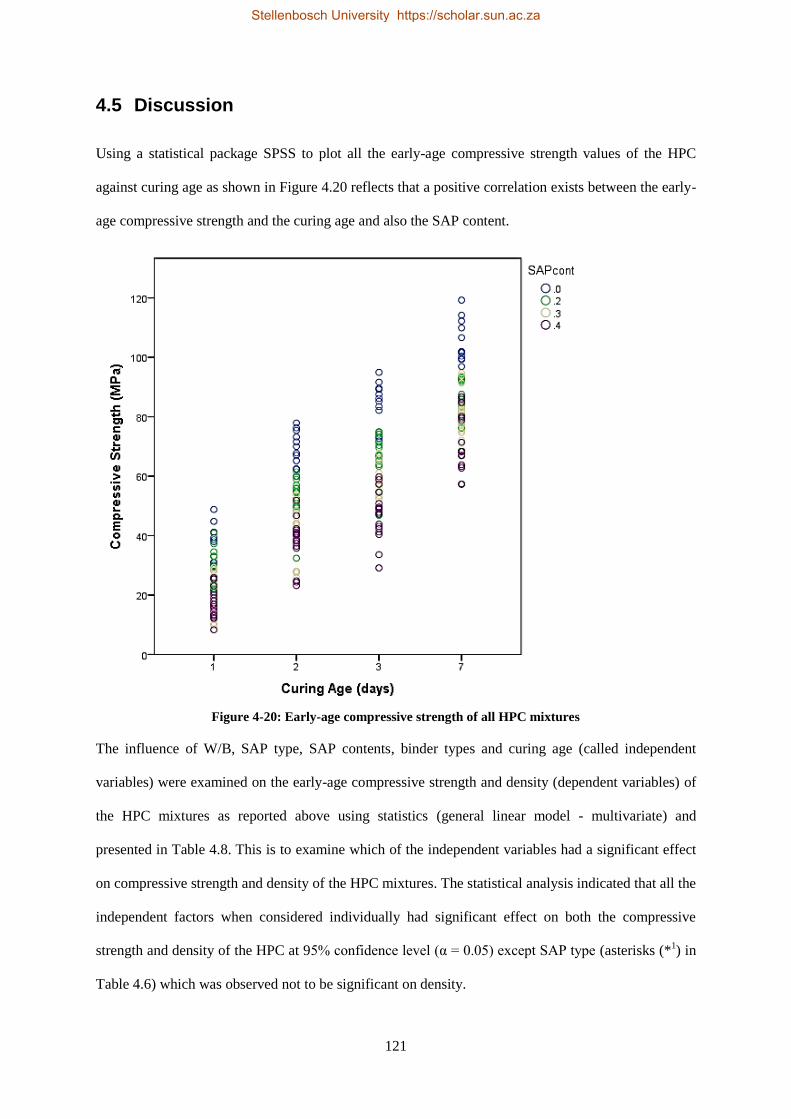
121
4.5 Discussion
Using a statistical package SPSS to plot all the early-age compressive strength values of the HPC
against curing age as shown in Figure 4.20 reflects that a positive correlation exists between the early-
age compressive strength and the curing age and also the SAP content.
Figure 4-20: Early-age compressive strength of all HPC mixtures
The influence of W/B, SAP type, SAP contents, binder types and curing age (called independent
variables) were examined on the early-age compressive strength and density (dependent variables) of
the HPC mixtures as reported above using statistics (general linear model - multivariate) and
presented in Table 4.8. This is to examine which of the independent variables had a significant effect
on compressive strength and density of the HPC mixtures. The statistical analysis indicated that all the
independent factors when considered individually had significant effect on both the compressive
strength and density of the HPC at 95% confidence level (α = 0.05) except SAP type (asterisks (*1) in
Table 4.6) which was observed not to be significant on density.
Stellenbosch University https://scholar.sun.ac.za
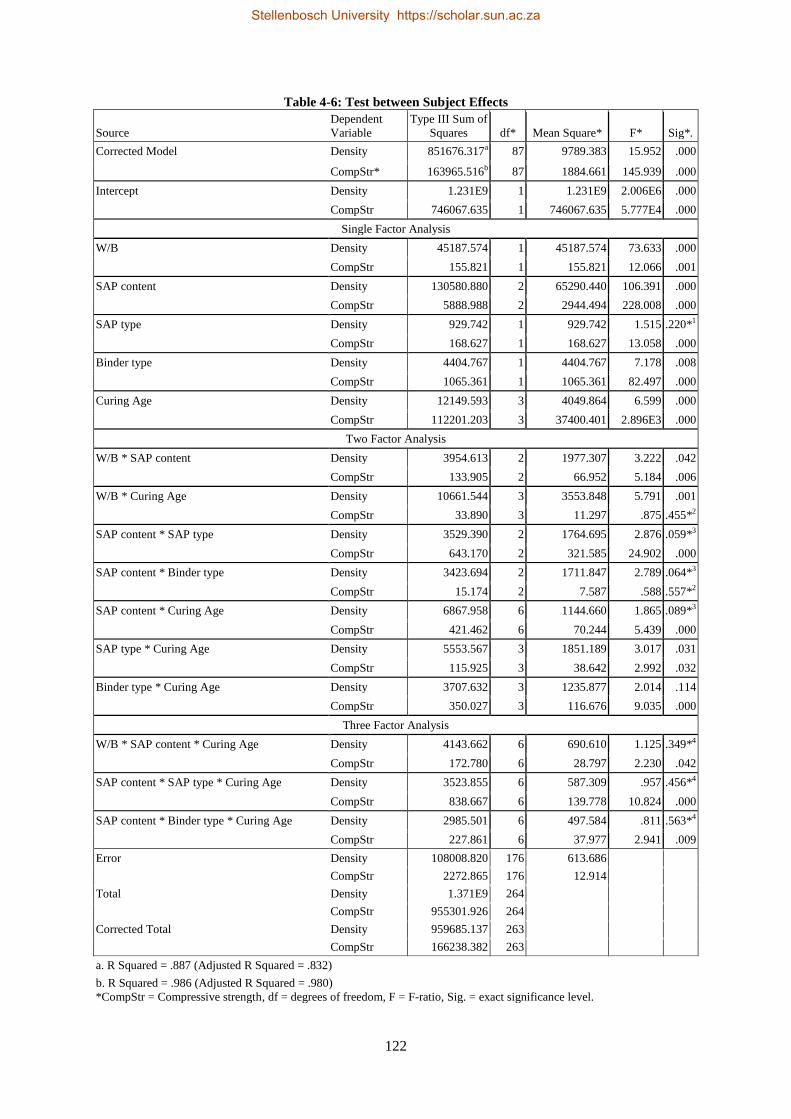
122
Table 4-6: Test between Subject Effects
Source
Dependent
Variable
Type III Sum of
Squares df* Mean Square* F* Sig*.
Corrected Model Density 851676.317a 87 9789.383 15.952 .000
CompStr* 163965.516b 87 1884.661 145.939 .000
Intercept Density 1.231E9 1 1.231E9 2.006E6 .000
CompStr 746067.635 1 746067.635 5.777E4 .000
Single Factor Analysis
W/B Density 45187.574 1 45187.574 73.633 .000
CompStr 155.821 1 155.821 12.066 .001
SAP content Density 130580.880 2 65290.440 106.391 .000
CompStr 5888.988 2 2944.494 228.008 .000
SAP type Density 929.742 1 929.742 1.515 .220*1
CompStr 168.627 1 168.627 13.058 .000
Binder type Density 4404.767 1 4404.767 7.178 .008
CompStr 1065.361 1 1065.361 82.497 .000
Curing Age Density 12149.593 3 4049.864 6.599 .000
CompStr 112201.203 3 37400.401 2.896E3 .000
Two Factor Analysis
W/B * SAP content Density 3954.613 2 1977.307 3.222 .042
CompStr 133.905 2 66.952 5.184 .006
W/B * Curing Age Density 10661.544 3 3553.848 5.791 .001
CompStr 33.890 3 11.297 .875 .455*2
SAP content * SAP type Density 3529.390 2 1764.695 2.876 .059*3
CompStr 643.170 2 321.585 24.902 .000
SAP content * Binder type Density 3423.694 2 1711.847 2.789 .064*3
CompStr 15.174 2 7.587 .588 .557*2
SAP content * Curing Age Density 6867.958 6 1144.660 1.865 .089*3
CompStr 421.462 6 70.244 5.439 .000
SAP type * Curing Age Density 5553.567 3 1851.189 3.017 .031
CompStr 115.925 3 38.642 2.992 .032
Binder type * Curing Age Density 3707.632 3 1235.877 2.014 .114
CompStr 350.027 3 116.676 9.035 .000
Three Factor Analysis
W/B * SAP content * Curing Age Density 4143.662 6 690.610 1.125 .349*4
CompStr 172.780 6 28.797 2.230 .042
SAP content * SAP type * Curing Age Density 3523.855 6 587.309 .957 .456*4
CompStr 838.667 6 139.778 10.824 .000
SAP content * Binder type * Curing Age Density 2985.501 6 497.584 .811 .563*4
CompStr 227.861 6 37.977 2.941 .009
Error Density 108008.820 176 613.686
CompStr 2272.865 176 12.914
Total Density 1.371E9 264
CompStr 955301.926 264
Corrected Total Density 959685.137 263
CompStr 166238.382 263
a. R Squared = .887 (Adjusted R Squared = .832)
b. R Squared = .986 (Adjusted R Squared = .980)
*CompStr = Compressive strength, df = degrees of freedom, F = F-ratio, Sig. = exact significance level.
Stellenbosch University https://scholar.sun.ac.za

123
This implies that whenever any of the factors (W/B, SAP type, SAP contents, binder types and curing
age) vary, the compressive strength and density also changes except for SAP type. The degree of
variation is proportional to the magnitude of the change. The coefficient of determination (adjusted R-
Square value) obtained from the analysis was 0.986 (98.6%) for early-age compressive strength and
0.887 (88.7%) for density. This suggests strong statistical association between each independent
variable and the dependent variables. The independent variables were estimated to account for 98.6%
of the variance in the compressive strength of the concrete. The coefficient of correlation was
obtained as R = 0.98. This implies strong correlation or linear relationship existing between the two
sets of variables being considered.
An examination of influence of the interaction between two and three independent variables on early-
age compressive strength (referred to as two and three factor analysis) reveals that all – except two
scenarios (combined effect of W/B with curing age & SAP content with binder type as shown with
asterisks (*2), Table 4.6) – are all significant. It can therefore be inferred that all the fixed factors
individually and combined had significant effect on early-age compressive strength while only SAP
type as an independent variable does not have significant effect on the density of HPC. Two factor
analysis of density reflects a shared situation of three sets of combination significant (asterisks (*3)
and the other three not significant while the three factor analysis on density shows all (asterisk (*4))
the respective combinations as not significant.
The Duncan’s multiple range post-hoc test (Tables 4.7 to 4.11) – which is a multiple comparison
procedure in statistics used to examine set of means – was also conducted for comparison of the sets
of means amongst the independent variables (W/B, binder type, SAP contents, SAP types, and curing
age) and their effect on the early age compressive strength of HPCs. The test reveals that the mean
early-age compressive strength does not show any significant difference for the various groupings
(whether on basis of W/B, SAP content, SAP type, or curing age).
Stellenbosch University https://scholar.sun.ac.za

124
Table 4-7: Duncan's multiple range test (W/B effect on Early-age Compressive Strength)
W/B N
Subset
1 2
0.2 132 5.408176E1
0.3 48 5.471719E1 5.471719E1
0.25 84 5.556938E1
Sig. .282 .150
Table 4-8: Duncan's multiple range test (Binder type effect on Early-age Compressive Strength)
Binder type N
Subset
1 2
2 48 5.375941E1
3 84 5.426595E1 5.426595E1
1 132 5.525949E1
Sig. .391 .093
Table 4-9: Duncan's multiple range test (SAP contents effect on Early-age Compressive Strength)
SAP content N
Subset
1 2 3 4
0.4 72 4.328406E1
0.3 72 5.050547E1
0.2 72 5.762353E1
0 48 7.356882E1
Sig. 1.000 1.000 1.000 1.000
Table 4-10: Duncan's multiple range test (SAP type effect on Early-age Compressive Strength)
SAP type N
Subset
1 2
2 72 5.010426E1
1 144 5.065440E1
0 48 7.356882E1
Sig. .360 1.000
Table 4-11: Duncan's multiple range test (Curing Age effect on Early-age Compressive Strength)
Curing Age N
Subset
1 2 3 4
1 66 2.427844E1
2 66 4.869777E1
3 66 6.166292E1
7 66 8.404336E1
Sig. 1.000 1.000 1.000 1.000
Means for groups in homogeneous subsets are displayed based on observed means. The error term is Mean Square (Error) = 12.914.
Stellenbosch University https://scholar.sun.ac.za
125
The result of the microstructure and chemical composition as shown in Section 4.5 revealed that the
finer particles of CEM I 52.5 N, FA and CS contribute to the high strength development in the HPC.
The FA and CS introduction in the ternary cements HPC (M1S and M1F) led to low W/B of 0.2 without
this it would have been impossible to achieve this particular mixture. SF presence in the HPC
mixtures was responsible for the sticky nature always experienced in HPC mixtures. The
microstructure of the SF revealing very sticky nature (composing grains of very high fineness) with
difficulty in identifying individual particles affirms the nature of this admixture and its effect in
concrete. This is also in agreement with the BET specific surface area analysis which shows higher
surface area for SF particles than the other cementitious materials – indicative of its very fine grain
sizes. The result obtained from the laser diffraction PSD analysis can therefore not be relied upon for
SF as literature states some inherent limiting factors on use of laser diffraction for PSD in samples of
some particle sizes especially below 1 µm (Kowalenko and Babuin, 2013; Di Stefano et al., 2010).
The chemical composition of SF shows high amorphous silica content and thereby explains its ability
at resulting in higher early strength especially in the first two days. The early strength can also be
attributed to the higher fineness of the SF particles. The high amorphous SiO2 content effectively
reacts fast with the excess lime (CaOH) liberated from the CEM I 52.5 N while the FA and CS
(known to be of latent hydraulic reaction) take a longer time for the pozzolanic reaction. The spherical
nature of the FA contributed to the air spaces within the individual particles while CS larger particle
grains also enhance good workability of concrete containing CS and enhance its contribution to lower
water demand than SF. The CS and FA were noted to be very different in chemical composition.
While FA used in this study is majorly SiO2 (52.1%) and Al2O3 (29.9%), the CS is mainly CaO
(45.6%) and SiO2 (27.1%). The ternary cements-HPC made from CS had higher initial strength and
similar rate of early age cement hydration as the FA based ternary cement-HPC. It will be of interest
to assess how this transfer to the final strength development at concrete maturity. The Kinetic of
hydration (B) for all the HPC mixtures however remains within the same range at this early age and
conforms to the relationship as reported in literature for this class of concrete (i.e. SF-concretes).
Stellenbosch University https://scholar.sun.ac.za
126
5
Mechanical Properties of HPC with SAP
This chapter reports the outcome of the experimental work carried out on the mechanical properties of
HPC containing SAP as IC-agents. The respective major tests are presented as sub-sections with
proper discussion made while efforts were also made to curve-fit the results with a view at assessing
the influence of SAP on the mechanical properties of the HPC.
5.1 Compressive Strength of HPC with SAP
Results and discussion of compressive strength conducted are presented in the following sections.
5.1.1 Results
Tables 5.1 and 5.2 present the density of binary and ternary cements – HPCs (respectively) as
influenced by SAP addition with the SAP porosity factor calculated in comparison with the average
demoulded density of the twelve specimens for the respective reference mixtures. It is observed that
there is a general trend of slight decrease in the density of the HPCs as the SAP contents increase.
This is seen as a reflection that SAP addition led to increased porosity in the HPC as calculated for in
Table 4.1 of Section 4.3.1. The observed porosity increase is in agreement with the expectation of
literature for SAP-modified concrete (Mechtcherine & Reinhardt, 2012).
Results of compressive strength development over the hydration periods (7, 28, 56 and 90 days)
studied for the various HPC mixtures with SAP (SP1 and SP2) added as IC-agent are presented in
Figures 5.1 to 5.4 while Tables 5.3 (binary cement HPC) and 5.4 (ternary cement HPC) gives the
comparative compressive strength (i.e. the strength factor) values with references to the 28 day
strength of control mixtures in parentheses under the compressive strength values.
Stellenbosch University https://scholar.sun.ac.za

127
Table 5-1: Density of Binary cements - HPC with SAP
Curing Age Density (kg/m
3) SAP Porosity factor (%)*
7 days 28 days 56 days 90 days 7 days 28 days 56 days 90 days
M₂ 2504 2495 2494 2494 100.7 100.4 100.3 100.3
M₂SP₁-0.2 2472 2461 2468 2473 99.4 99.0 99.3 99.5
M₂ SP₁-0.3 2431 2436 2441 2460 97.8 98.0 98.2 99.0
M₂SP₁-0.4 2413 2404 2422 2418 97.1 96.7 97.4 97.3
M₂SP₂-0.2 2477 2478 2488 2475 99.6 99.7 100.1 99.6
M₂SP₂-0.3 2431 2428 2434 2428 97.8 97.7 97.9 97.7
M₂SP₂-0.4 2424 2429 2417 2425 97.5 97.7 97.2 97.6
M₃ 2432 2431 2434 2423 100.8 100.7 100.9 100.4
M₃SP₁-0.2 2406 2416 2414 2421 99.7 100.2 100.0 100.4
M₃SP₁-0.3 2358 2341 2362 2372 97.8 97.0 97.9 98.3
M₃SP₁-0.4 2366 2366 2381 2377 98.1 98.1 98.7 98.5
M₃SP₂-0.2 2402 2412 2386 2398 99.6 100.0 98.9 99.4
M₃SP₂-0.3 2409 2408 2393 2409 99.9 99.8 99.2 99.9
M₃SP₂-0.4 2357 2360 2326 2340 97.7 97.8 96.4 97.0
*SAP porosity factor is calculated as a percentage in relation to average of Demoulded density of the twelve
specimens of references HPC mixtures. SAP porosity is therefore 1- SAP porosity factor.
Table 5-2: Density of Ternary cements - HPC with SAP
Curing Age Density (kg/m
3) SAP Porosity factor (%)*
7 days 28 days 56 days 90 days 7 days 28 days 56 days 90 days
M₁S 2486 2510 2503 2521 99.5 100.5 100.2 100.9
M₁SSP₁-0.2 2440 2449 2440 2453 97.7 98.0 97.7 98.2
M₁SSP₁-0.3 2437 2458 2473 2435 97.6 98.4 99.0 97.5
M₁SSP₁-0.4 2420 2432 2448 2451 96.9 97.4 98.0 98.1
M₁SSP₂-0.2 2471 2468 2397 2426 98.9 98.8 96.0 97.1
M₁SSP₂-0.3 2486 2438 2448 2445 99.5 97.6 98.0 97.9
M₁SSP₂-0.4 2436 2437 2416 2413 97.5 97.6 96.7 96.6
M₁F 2494 2487 2488 2498 100.7 100.4 100.5 100.9
M₁FSP₁-0.2 2422 2440 2422 2445 97.8 98.5 97.8 98.7
M₁FSP₁-0.3 2394 2397 2395 2389 96.7 96.8 96.7 96.5
M₁FSP₁-0.4 2405 2412 2401 2402 97.1 97.4 97.0 97.0
M₁FSP₂-0.2 2456 2439 2419 2435 99.2 98.5 97.7 98.3
M₁FSP₂-0.3 2406 2406 2410 2412 97.2 97.2 97.3 97.4
M₁FSP₂-0.4 2407 2420 2416 2414 97.2 97.7 97.5 97.5
*SAP porosity factor is calculated as a percentage in relation to average of demoulded density of the twelve
specimens of references HPC mixtures. SAP porosity is therefore 1- SAP porosity factor.
The result shows that compressive strength increases as the hydration rate increases at a decreasing
rate for all the HPC mixtures. The strength however decreases as the SAP content increases for both
SAP types. The strength factor indicates that for binary cement – HPCs (M2 and M3), similar values as
the 28-day strength of control specimen were attained for HPC containing SAP at the 90-day of
curing up to 0.3% bwob SAP addition for both SAP types while the ternary cements – HPCs (M1F and
M1S) attained similar and above the 28-day strength values for all mixtures (and all SAP contents
studied) at the 90th day. Tables 5.3 and 5.4 (yellow highlights) show the various inconsistencies of the
results as M3Sp1-03 (90 days), M3Sp2-0.3 (56 and 90 days) and M1FSp1-0.2 (7days).
Stellenbosch University https://scholar.sun.ac.za
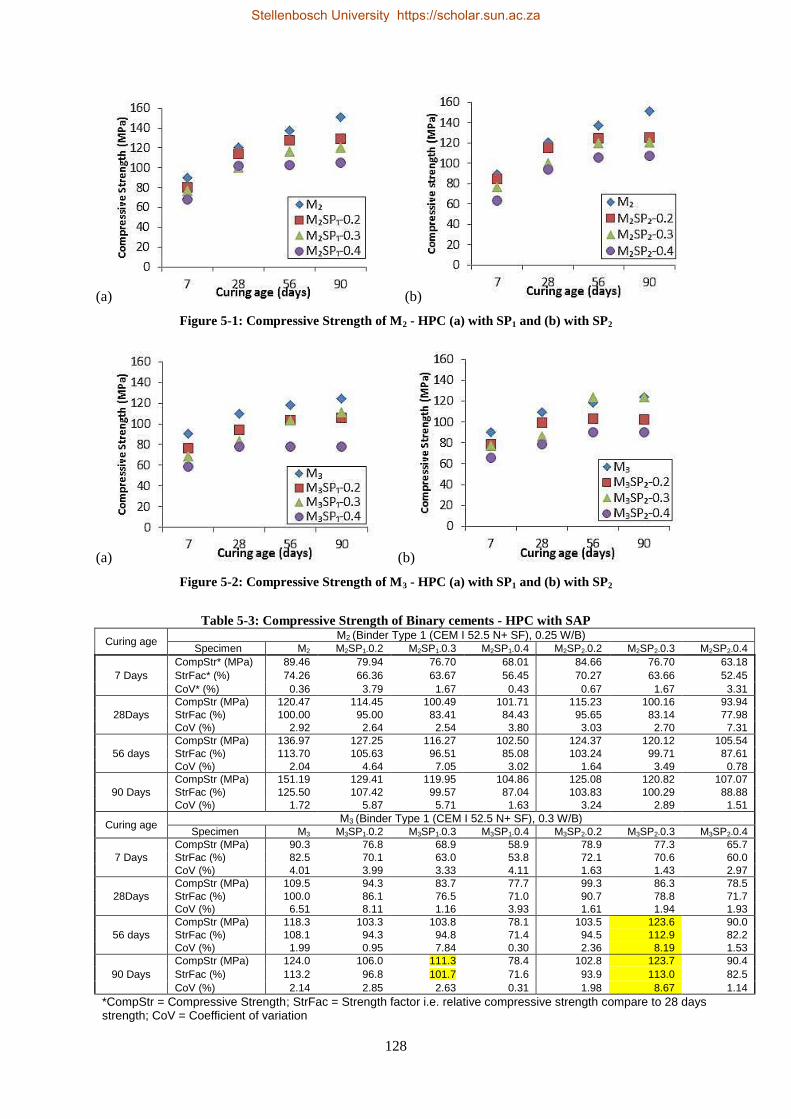
128
(a) (b)
Figure 5-1: Compressive Strength of M2 - HPC (a) with SP1 and (b) with SP2
(a) (b)
Figure 5-2: Compressive Strength of M3 - HPC (a) with SP1 and (b) with SP2
Table 5-3: Compressive Strength of Binary cements - HPC with SAP
Curing age M2 (Binder Type 1 (CEM I 52.5 N+ SF), 0.25 W/B)
Specimen M2 M2SP1-0.2 M2SP1-0.3 M2SP1-0.4 M2SP2-0.2 M2SP2-0.3 M2SP2-0.4
7 Days
CompStr* (MPa) 89.46 79.94 76.70 68.01 84.66 76.70 63.18
StrFac* (%) 74.26 66.36 63.67 56.45 70.27 63.66 52.45
CoV* (%) 0.36 3.79 1.67 0.43 0.67 1.67 3.31
28Days
CompStr (MPa) 120.47 114.45 100.49 101.71 115.23 100.16 93.94
StrFac (%) 100.00 95.00 83.41 84.43 95.65 83.14 77.98
CoV (%) 2.92 2.64 2.54 3.80 3.03 2.70 7.31
56 days
CompStr (MPa) 136.97 127.25 116.27 102.50 124.37 120.12 105.54
StrFac (%) 113.70 105.63 96.51 85.08 103.24 99.71 87.61
CoV (%) 2.04 4.64 7.05 3.02 1.64 3.49 0.78
90 Days
CompStr (MPa) 151.19 129.41 119.95 104.86 125.08 120.82 107.07
StrFac (%) 125.50 107.42 99.57 87.04 103.83 100.29 88.88
CoV (%) 1.72 5.87 5.71 1.63 3.24 2.89 1.51
Curing age M3 (Binder Type 1 (CEM I 52.5 N+ SF), 0.3 W/B)
Specimen M3 M3SP1-0.2 M3SP1-0.3 M3SP1-0.4 M3SP2-0.2 M3SP2-0.3 M3SP2-0.4
7 Days
CompStr (MPa) 90.3 76.8 68.9 58.9 78.9 77.3 65.7
StrFac (%) 82.5 70.1 63.0 53.8 72.1 70.6 60.0
CoV (%) 4.01 3.99 3.33 4.11 1.63 1.43 2.97
28Days
CompStr (MPa) 109.5 94.3 83.7 77.7 99.3 86.3 78.5
StrFac (%) 100.0 86.1 76.5 71.0 90.7 78.8 71.7
CoV (%) 6.51 8.11 1.16 3.93 1.61 1.94 1.93
56 days
CompStr (MPa) 118.3 103.3 103.8 78.1 103.5 123.6 90.0
StrFac (%) 108.1 94.3 94.8 71.4 94.5 112.9 82.2
CoV (%) 1.99 0.95 7.84 0.30 2.36 8.19 1.53
90 Days
CompStr (MPa) 124.0 106.0 111.3 78.4 102.8 123.7 90.4
StrFac (%) 113.2 96.8 101.7 71.6 93.9 113.0 82.5
CoV (%) 2.14 2.85 2.63 0.31 1.98 8.67 1.14
*CompStr = Compressive Strength; StrFac = Strength factor i.e. relative compressive strength compare to 28 days strength; CoV = Coefficient of variation
Stellenbosch University https://scholar.sun.ac.za
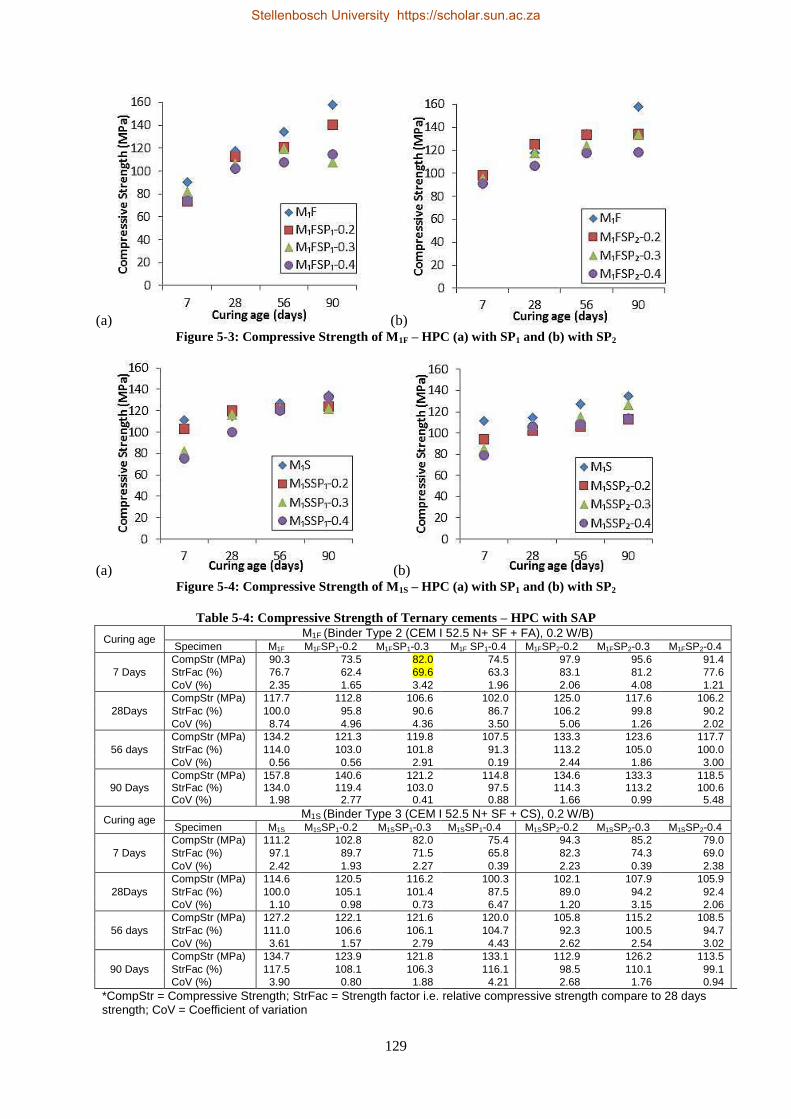
129
(a) (b) Figure 5-3: Compressive Strength of M1F – HPC (a) with SP1 and (b) with SP2
(a) (b) Figure 5-4: Compressive Strength of M1S – HPC (a) with SP1 and (b) with SP2
Table 5-4: Compressive Strength of Ternary cements – HPC with SAP
Curing age M1F (Binder Type 2 (CEM I 52.5 N+ SF + FA), 0.2 W/B)
Specimen M1F M1FSP1-0.2 M1FSP1-0.3 M1F SP1-0.4 M1FSP2-0.2 M1FSP2-0.3 M1FSP2-0.4
7 Days
CompStr (MPa) 90.3 73.5 82.0 74.5 97.9 95.6 91.4
StrFac (%) 76.7 62.4 69.6 63.3 83.1 81.2 77.6
CoV (%) 2.35 1.65 3.42 1.96 2.06 4.08 1.21
28Days
CompStr (MPa) 117.7 112.8 106.6 102.0 125.0 117.6 106.2
StrFac (%) 100.0 95.8 90.6 86.7 106.2 99.8 90.2
CoV (%) 8.74 4.96 4.36 3.50 5.06 1.26 2.02
56 days
CompStr (MPa) 134.2 121.3 119.8 107.5 133.3 123.6 117.7
StrFac (%) 114.0 103.0 101.8 91.3 113.2 105.0 100.0
CoV (%) 0.56 0.56 2.91 0.19 2.44 1.86 3.00
90 Days CompStr (MPa) 157.8 140.6 121.2 114.8 134.6 133.3 118.5 StrFac (%) 134.0 119.4 103.0 97.5 114.3 113.2 100.6 CoV (%) 1.98 2.77 0.41 0.88 1.66 0.99 5.48
Curing age M1S (Binder Type 3 (CEM I 52.5 N+ SF + CS), 0.2 W/B)
Specimen M1S M1SSP1-0.2 M1SSP1-0.3 M1SSP1-0.4 M1SSP2-0.2 M1SSP2-0.3 M1SSP2-0.4
7 Days
CompStr (MPa) 111.2 102.8 82.0 75.4 94.3 85.2 79.0
StrFac (%) 97.1 89.7 71.5 65.8 82.3 74.3 69.0
CoV (%) 2.42 1.93 2.27 0.39 2.23 0.39 2.38
28Days
CompStr (MPa) 114.6 120.5 116.2 100.3 102.1 107.9 105.9
StrFac (%) 100.0 105.1 101.4 87.5 89.0 94.2 92.4
CoV (%) 1.10 0.98 0.73 6.47 1.20 3.15 2.06
56 days
CompStr (MPa) 127.2 122.1 121.6 120.0 105.8 115.2 108.5
StrFac (%) 111.0 106.6 106.1 104.7 92.3 100.5 94.7
CoV (%) 3.61 1.57 2.79 4.43 2.62 2.54 3.02
90 Days
CompStr (MPa) 134.7 123.9 121.8 133.1 112.9 126.2 113.5
StrFac (%) 117.5 108.1 106.3 116.1 98.5 110.1 99.1
CoV (%) 3.90 0.80 1.88 4.21 2.68 1.76 0.94
*CompStr = Compressive Strength; StrFac = Strength factor i.e. relative compressive strength compare to 28 days strength; CoV = Coefficient of variation
Stellenbosch University https://scholar.sun.ac.za

130
The coefficient of variation (CoV) of the compressive strength values was found to be below (8.67)
with one of the non-conforming values (M3SP20.3) having the highest CoV value. The trend of the
results of compressive strength is in agreement with the findings of previous researchers
(Mechtcherine et al., 2009; Dudziak & Mechtcherine, 2008; Hasholt et al., 2012) for moderate SAP
application and extra water provided for SAP absorption.
5.1.2 Discussion
Examining the results obtained from the experiment (Table 5.1 and 5.2) reveals that density of this
concrete type just like the compressive strength is influenced by the SAP contents. Though the density
can be taken as stable over the curing ages, it decreases at relatively small proportion to the increase
in SAP content, an indication that SAP addition also contributes to the air content in the concrete.
Although the density for all the HPCs containing SAP studied were observed as still within the weight
classification of normal weight concrete (as found in Dehn, (2012)). The density values fall within the
2300 kg/m3 to 2500 kg/m
3 range as shown in Figure 5.5 with an indication of negative correlation
between the density and SAP contents of the HPCs.
Figure 5-5: Influence of SAP contents on the density of HPC
Stellenbosch University https://scholar.sun.ac.za
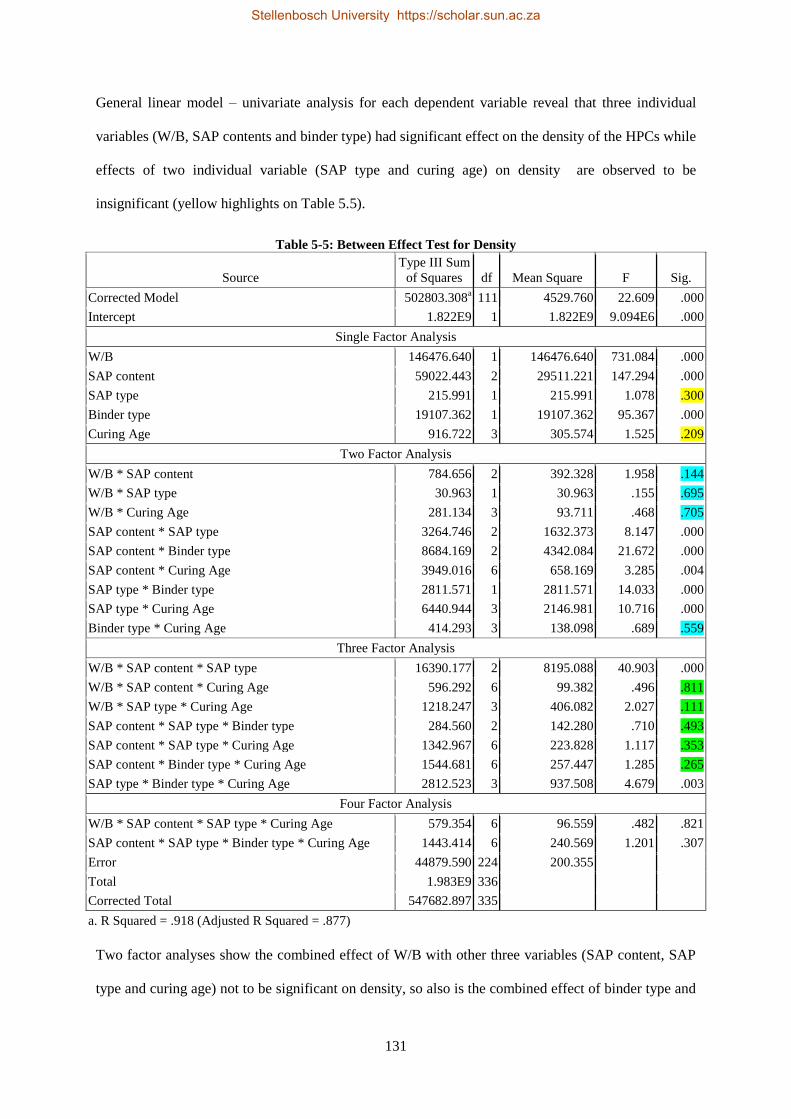
131
General linear model – univariate analysis for each dependent variable reveal that three individual
variables (W/B, SAP contents and binder type) had significant effect on the density of the HPCs while
effects of two individual variable (SAP type and curing age) on density are observed to be
insignificant (yellow highlights on Table 5.5).
Table 5-5: Between Effect Test for Density
Source
Type III Sum
of Squares df Mean Square F Sig.
Corrected Model 502803.308a 111 4529.760 22.609 .000
Intercept 1.822E9 1 1.822E9 9.094E6 .000
Single Factor Analysis
W/B 146476.640 1 146476.640 731.084 .000
SAP content 59022.443 2 29511.221 147.294 .000
SAP type 215.991 1 215.991 1.078 .300
Binder type 19107.362 1 19107.362 95.367 .000
Curing Age 916.722 3 305.574 1.525 .209
Two Factor Analysis
W/B * SAP content 784.656 2 392.328 1.958 .144
W/B * SAP type 30.963 1 30.963 .155 .695
W/B * Curing Age 281.134 3 93.711 .468 .705
SAP content * SAP type 3264.746 2 1632.373 8.147 .000
SAP content * Binder type 8684.169 2 4342.084 21.672 .000
SAP content * Curing Age 3949.016 6 658.169 3.285 .004
SAP type * Binder type 2811.571 1 2811.571 14.033 .000
SAP type * Curing Age 6440.944 3 2146.981 10.716 .000
Binder type * Curing Age 414.293 3 138.098 .689 .559
Three Factor Analysis
W/B * SAP content * SAP type 16390.177 2 8195.088 40.903 .000
W/B * SAP content * Curing Age 596.292 6 99.382 .496 .811
W/B * SAP type * Curing Age 1218.247 3 406.082 2.027 .111
SAP content * SAP type * Binder type 284.560 2 142.280 .710 .493
SAP content * SAP type * Curing Age 1342.967 6 223.828 1.117 .353
SAP content * Binder type * Curing Age 1544.681 6 257.447 1.285 .265
SAP type * Binder type * Curing Age 2812.523 3 937.508 4.679 .003
Four Factor Analysis
W/B * SAP content * SAP type * Curing Age 579.354 6 96.559 .482 .821
SAP content * SAP type * Binder type * Curing Age 1443.414 6 240.569 1.201 .307
Error 44879.590 224 200.355
Total 1.983E9 336
Corrected Total 547682.897 335
a. R Squared = .918 (Adjusted R Squared = .877)
Two factor analyses show the combined effect of W/B with other three variables (SAP content, SAP
type and curing age) not to be significant on density, so also is the combined effect of binder type and
Stellenbosch University https://scholar.sun.ac.za

132
curing age (Table 5.5 – light blue highlight). The combination with least significance here been W/B
combined with curing age. Three and four variable combinations effects on density were mostly not
significant (Table 5.5 - green highlights) with only two cases as an exception. Variables of great
influence on the density of HPCs in this study can therefore be seen as SAP content and binder type,
because individually and their combined effects with other variables resulted in significant influence
on the outcome of density of HPCs.
The general linear model – univariate analysis (Table 5.6) shows each dependent variable to be of
significant effect on the compressive strength individually and also at the two variable interaction
level. The three factor analysis however indicates that two combination (grey colour highlights of
Table 5.6) situations (W/B * SAP type * Curing Age and SAP type * Binder type * Curing Age) are
of no significant effect on compressive strength while all other three factor combination types are
significant. The four factor analysis reveals that binder type in combination with SAP type, SAP
content and curing age had significant effect on the compressive strength, while W/B combination
with the same set of factors (i.e. purple highlight on Table 5.6) is of no significant influence on the
compressive strength. This implies that the binder type is of more importance in the outcome of the
compressive strength than the W/B within the limits of the W/B examined in the study and the three
binder types tested. Although all the independent variables - (W/B, SAP type, SAP contents, binder
type and curing age) individually and at two factor combination - are of significant effect on the
compressive strength, the binder type is of greater impact when the combined effects of all the
variables are under consideration. It is however important here that the supposed influence of binder
type on strength has some influence of W/B incorporated since HPCs made with Binder Type 1 (M2
and M3) comprise of two W/B (0.25 and 0.3) respectively. Figure 5.6 reveals that the ternary cements
(Binder Types 2 (M1F) and 3 (M1S)) had higher strength values after 7 days than the binary cements
and continued with similar improved hydration. Binder Type 2 (CEM I 52.5 N+ SF + FA) – HPC
reports better long term (90 days) strength development trend than Binder Type 3 (CEM I 52.5 N+
SF).
Stellenbosch University https://scholar.sun.ac.za

133
Table 5-6: Between Effect Test on Compressive Strength
Source
Type III Sum
of Squares df Mean Square F Sig.
Corrected Model 136734.418a 111 1231.842 59.748 .000
Intercept 3551504.067 1 3551504.067 1.723E5 .000
Single Factor Analysis
W/B 6882.841 1 6882.841 333.841 .000
SAP content 10730.354 2 5365.177 260.229 .000
SAP type 364.150 1 364.150 17.662 .000
Binder type 374.165 1 374.165 18.148 .000
Curing Age 71010.544 3 23670.181 1.148E3 .000
Two Factor Analysis
W/B * SAP content 794.488 2 397.244 19.268 .000
W/B * SAP type 440.036 1 440.036 21.343 .000
W/B * Curing Age 1524.933 3 508.311 24.655 .000
SAP content * SAP type 378.426 2 189.213 9.177 .000
SAP content * Binder type 313.387 2 156.693 7.600 .001
SAP content * Curing Age 838.172 6 139.695 6.776 .000
SAP type * Binder type 2526.068 1 2526.068 122.523 .000
SAP type * Curing Age 354.791 3 118.264 5.736 .001
Binder type * Curing Age 1218.394 3 406.131 19.699 .000
Three Factor Analysis
W/B * SAP content * SAP type 136.252 2 68.126 3.304 .039
W/B * SAP content * Curing Age 552.093 6 92.016 4.463 .000
W/B * SAP type * Curing Age 20.655 3 6.885 .334 .801
SAP content * SAP type * Binder type 259.746 2 129.873 6.299 .002
SAP content * SAP type * Curing Age 344.189 6 57.365 2.782 .013
SAP content * Binder type * Curing Age 1832.835 6 305.472 14.816 .000
SAP type * Binder type * Curing Age 87.218 3 29.073 1.410 .241
Four Factor Analysis
W/B * SAP content * SAP type * Curing Age 70.805 6 11.801 .572 .752
SAP content * SAP type * Binder type *
Curing Age 630.489 6 105.081 5.097 .000
Error 4618.240 224 20.617
Total 3892976.130 336
Corrected Total 141352.658 335
a. R Squared = .967 (Adjusted R Squared = .951)
Figure 5.7 shows that a negative correlation exists between W/B and the compressive strength of
HPCs. The compressive strength decreases as the W/B increases. HPCs from Binder Types 2 and 3,
referred to as ternary cement – HPCs (M1F and M1S) having 0.2 W/B had similar values of
compressive strength as the Binder Type 1 (binary cement – HPCs (M2)) of 0.25 W/B while M3 –
HPCs of 0.3 W/B (also from Binder Type 1) had the lowest values of compressive strength. The
HPCs from Binder Type 2 (having FA as an additional SCM) however had slightly higher
Stellenbosch University https://scholar.sun.ac.za

134
compressive strength values after 90 days than the Binder Type 3 – HPCs (having CS as additional
SCM) despite both being of the same W/B.
Figure 5-6: Compressive strength of HPC versus binder type as influenced by curing age
Figure 5-7: Compressive strength versus binder type as influenced by W/B
The higher SiO2 content in FA continues to react with excess lime (CaOH) liberated by CEM
I 52.5 N and results in better long term strength than the CS based ternary cement- HPC with
high CaO content. Considering the fact that all the HPCs contains the same proportion of
SF (7.5% bwob), the lower compressive strength result from the HPCs with highest W/B (M3 -
Stellenbosch University https://scholar.sun.ac.za
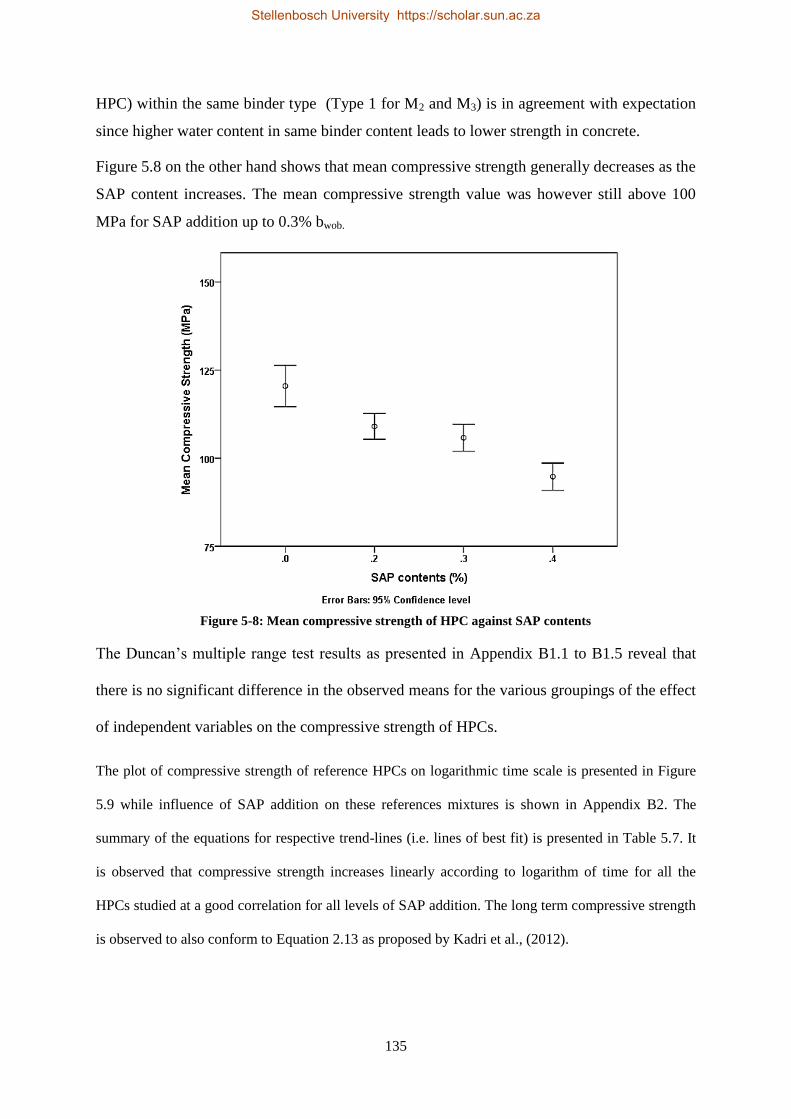
135
HPC) within the same binder type (Type 1 for M2 and M3) is in agreement with expectation
since higher water content in same binder content leads to lower strength in concrete.
Figure 5.8 on the other hand shows that mean compressive strength generally decreases as the
SAP content increases. The mean compressive strength value was however still above 100
MPa for SAP addition up to 0.3% bwob.
Figure 5-8: Mean compressive strength of HPC against SAP contents
The Duncan’s multiple range test results as presented in Appendix B1.1 to B1.5 reveal that
there is no significant difference in the observed means for the various groupings of the effect
of independent variables on the compressive strength of HPCs.
The plot of compressive strength of reference HPCs on logarithmic time scale is presented in Figure
5.9 while influence of SAP addition on these references mixtures is shown in Appendix B2. The
summary of the equations for respective trend-lines (i.e. lines of best fit) is presented in Table 5.7. It
is observed that compressive strength increases linearly according to logarithm of time for all the
HPCs studied at a good correlation for all levels of SAP addition. The long term compressive strength
is observed to also conform to Equation 2.13 as proposed by Kadri et al., (2012).
Stellenbosch University https://scholar.sun.ac.za

136
Figure 5-9: Compressive strength of reference mixtures - HPCs on log time scale
Table 5-7: Summary of Trend Line (𝑨 + 𝑩 𝐥𝐨𝐠𝒕𝒅
𝒕𝟏) for Compressive Strength of HPCs with SAP
Binary Cement - HPCs
Specimen A B R2 Specimen A B R2
M₂ 42.31 23.825 0.997 M₃ 64.85 13.238 0.999
M₂Sp₁-0.2 42.93 20.221 0.968 M₃Sp₁-0.2 54.33 11.808 0.991
M₂Sp₁-0.3 42.62 17.599 0.990 M₃Sp₁-0.3 33.58 16.919 0.954
M₂Sp₁-0.4 43.59 14.686 0.805 M₃Sp₁-0.4 46.03 7.990 0.838
M₂Sp₂-0.2 55.08 16.604 0.945 M₃Sp₂-0.2 61.98 9.899 0.898
M₂Sp₂-0.3 40.77 18.452 0.970 M₃Sp₂-0.3 33.63 20.018 0.829
M₂Sp₂-0.4 30.35 17.990 0.965 M₃Sp₂-0.4 45.49 10.332 0.968
Ternary Cement - HPCs
M₁F 37.33 25.006 0.960 M₁S 90.87 9.003 0.837
M₁F Sp₁-0.2 25.39 25.113 0.981 M₁SSp₁-0.2 88.31 8.411 0.911
M₁F Sp₁-0.3 61.60 12.288 0.743 M₁SSp₁-0.3 54.17 16.294 0.899
M₁F Sp₁-0.4 45.80 15.630 0.975 M₁SSp₁-0.4 29.82 22.425 0.986
M₁F Sp₂-0.2 70.92 15.003 0.954 M₁SSp2-0.2 80.33 6.787 0.952
M₁F Sp₂-0.3 68.19 14.291 0.989 M₁SSp2-0.3 50.01 15.537 0.990
M₁F Sp₂0.4 69.63 11.249 0.975 M₁SSp2-0.4 55.27 13.469 0.937
An increase in the W/B in the binary cement – HPC (M2 and M3) mixtures leads generally to a
decrease in the B coefficients (kinetic of hydration in Table 5.7), so does the increase SAP contents
except in a few cases that can be referred to as non-conforming. The B coefficient (the kinetic of the
hydration reaction as defined in Section 2.6.2 and 4.4.1) in ternary cement HPCs containing FA (M1F
series) also decreases generally as the SAP content increases while the M1S series (containing CS)
reflect a different pattern. The M1S – HPC which was observed to exhibit a high value of the A
coefficient (i.e. the value at td = t1) representing the initial 24 hrs strength were however observed to
display lower values of hydration kinetic for the long term strength development.
Stellenbosch University https://scholar.sun.ac.za

137
CS can then be seen to portray similar early age strength development in HPC than FA, but the FA
inclusion in ternary cement HPC however had higher kinetic of hydration value on the long term –
indicative of higher long term pozzolanic reaction than CS.
5.1.3 Curve – Fitting and Modelling
The curve fitting and modelling is based on the concepts as highlighted by Hasholt et al., (2010a).
These are:
i. Concrete compressive strength is proportional to the compressive strength of the paste phase.
ii. Paste compressive strength depends on gel space ratio, as suggested by Powers (1947).
iii. The influence of air voids created by SAP on compressive strength can be accounted for by
Bolomey’s formula provision for air content in concrete (Hasholt et al., 2010a).
The experimental data on the direct weight measure of demoulded of concrete in this study showed
that air content (excluding SAP voids) vary from 0.0 to 3.87% as influenced by the varied HPC
mixture contents (Tables 4.4 and 4.5, Section 4.3). To study the pure effect of SAP, the measured
cube compressive strength for both the early-age and long term were corrected for the air content on
line with Equation 2.12.
The air content was determined on basis of density by the formula (𝑑𝑑 − 𝑑𝑚𝑑|𝑑𝑑) for reference
HPCs (excluding effect of SAP) varying from 0.17 to 1.58% as shown in Table 3.1. All values of
compressive strength were thereby corrected with respective correction factors.
Using the Bolomey’s Equation (2.12):
𝐾𝐵𝑜𝑙𝑜𝑚𝑒𝑦 remains constant and of the same value for all mixtures (since all the HPCs are made from
the same aggregate), 𝑎 is the actual air content (% relative to volume of concrete), and 𝑎0 is a
reference air content. The value of constant 𝐵 of Equation 2.12 according to Hasholt et al., (2010a), as
a rule of thumb equals 0.04, when the paste phase occupies 25% of the concrete volume. Hence from
Table 3.1, the reference HPCs have paste contents (volume of binder + water) as 29% (M1F and M1S);
31% (M2) and 32% (M3) respectively. The constant 𝐵 for the compressive strength in line with
Equation 2.12 is thereby calculated as shown in Table 5.8.
Stellenbosch University https://scholar.sun.ac.za

138
Table 5-8: Correction factor for Reference HPCs
HPC type Paste content constant 𝐵 Ternary cements HPCs M1F and M1S 0.29 0.034 Binary cements - HPCs M2 0.31 0.032
M3 0.32 0.031
The 28 day compressive strength of the HPC – mortar cubes were calculated by interpolation using
the values obtained from the compressive strength tests conducted on the HPC mixtures with coarse
aggregates from which the mortars were extracted as reported in Section 5.1. The 28 day strength of
mortar cubes were not available from test results because the test on strength development and degree
of hydration as explained in Section 3.2.3 were limited to 7 days due to difficulty of milling the
mortar cubes manually adopting the ACV mould. The compressive strength of HPC mortar cubes
(corrected for air and SAP voids) with age is hereby shown in Figures 5.10 (for HPC containing SP2)
and 5.11 (for HPC containing SP1).
The outcome gave a good trend reflecting that when the compressive strength of the HPC mortars are
corrected for air and SAP voids using the Bolomey’s formula, there exists some differences in the
compressive strength of the HPC - mortar cubes. The HPC containing SAP generally had lower
strength than the reference mixtures. The strength development trend up to 28 days fit into a
logarithmic curve with the trendline cutting across the 0.2% and 0.3% SAP contents (bwob) in most
instances.
(a) (b)
Figure 5-10: Compressive strength of HPC – mortars cubes corrected for both air and SP2 voids
(a) M2 - HPC; (b) M1S – HPC
Stellenbosch University https://scholar.sun.ac.za
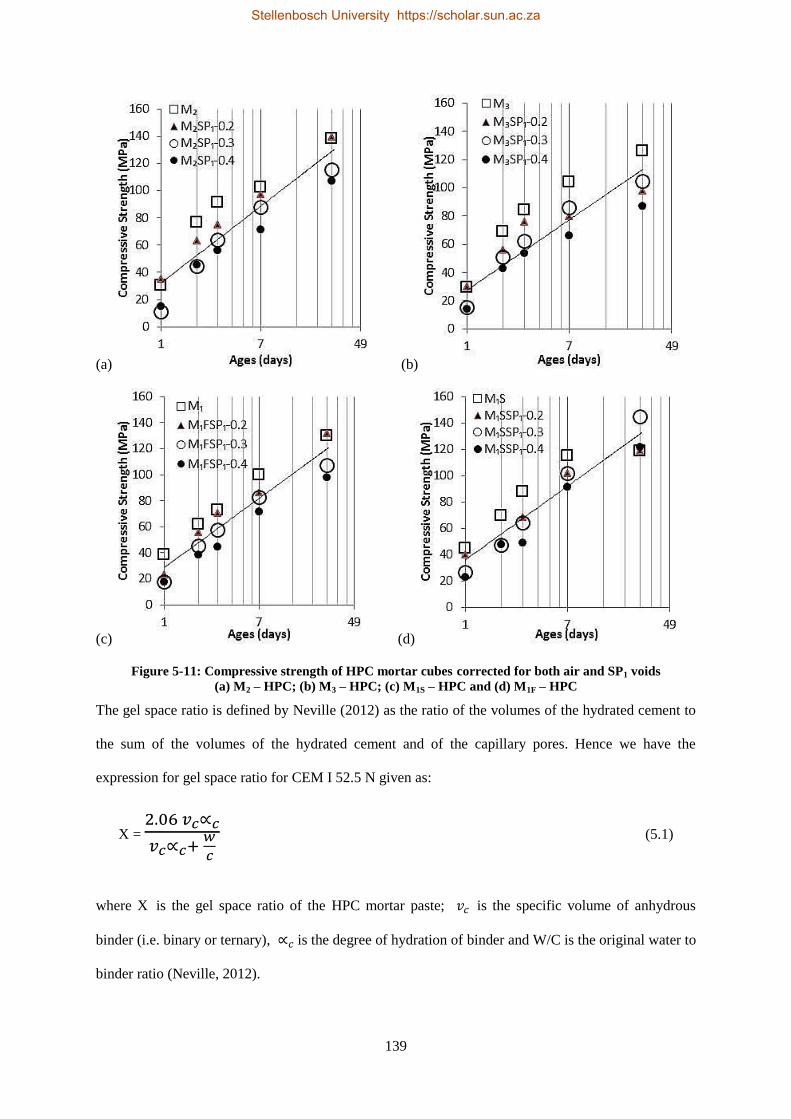
139
(a) (b)
(c) (d)
Figure 5-11: Compressive strength of HPC mortar cubes corrected for both air and SP1 voids
(a) M2 – HPC; (b) M3 – HPC; (c) M1S – HPC and (d) M1F – HPC
The gel space ratio is defined by Neville (2012) as the ratio of the volumes of the hydrated cement to
the sum of the volumes of the hydrated cement and of the capillary pores. Hence we have the
expression for gel space ratio for CEM I 52.5 N given as:
X = 2.06 𝑣𝑐∝𝑐
𝑣𝑐∝𝑐+ 𝑤
𝑐
(5.1)
where X is the gel space ratio of the HPC mortar paste; 𝑣𝑐 is the specific volume of anhydrous
binder (i.e. binary or ternary), ∝𝑐 is the degree of hydration of binder and W/C is the original water to
binder ratio (Neville, 2012).
Stellenbosch University https://scholar.sun.ac.za
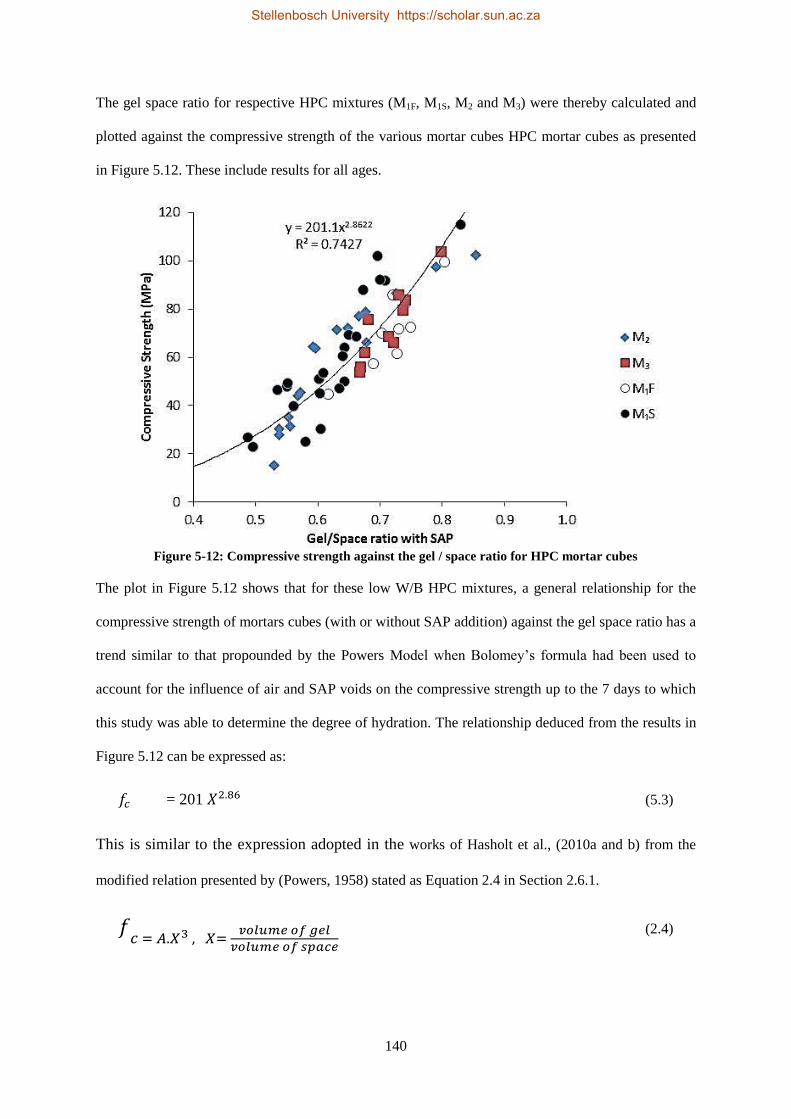
140
The gel space ratio for respective HPC mixtures (M1F, M1S, M2 and M3) were thereby calculated and
plotted against the compressive strength of the various mortar cubes HPC mortar cubes as presented
in Figure 5.12. These include results for all ages.
Figure 5-12: Compressive strength against the gel / space ratio for HPC mortar cubes
The plot in Figure 5.12 shows that for these low W/B HPC mixtures, a general relationship for the
compressive strength of mortars cubes (with or without SAP addition) against the gel space ratio has a
trend similar to that propounded by the Powers Model when Bolomey’s formula had been used to
account for the influence of air and SAP voids on the compressive strength up to the 7 days to which
this study was able to determine the degree of hydration. The relationship deduced from the results in
Figure 5.12 can be expressed as:
𝑓𝑐 = 201 𝑋2.86 (5.3)
This is similar to the expression adopted in the works of Hasholt et al., (2010a and b) from the
modified relation presented by (Powers, 1958) stated as Equation 2.4 in Section 2.6.1.
𝑓𝑐 = 𝐴.𝑋3 , 𝑋=
𝑣𝑜𝑙𝑢𝑚𝑒 𝑜𝑓 𝑔𝑒𝑙
𝑣𝑜𝑙𝑢𝑚𝑒 𝑜𝑓 𝑠𝑝𝑎𝑐𝑒
(2.4)
Stellenbosch University https://scholar.sun.ac.za
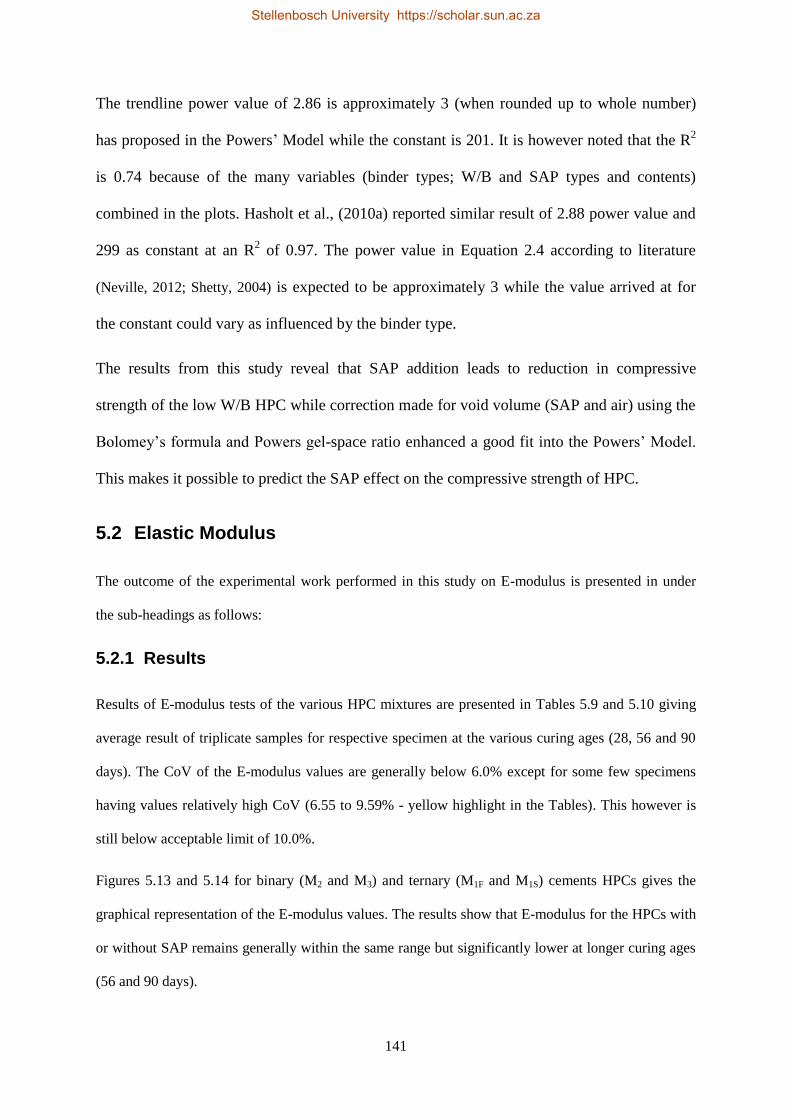
141
The trendline power value of 2.86 is approximately 3 (when rounded up to whole number)
has proposed in the Powers’ Model while the constant is 201. It is however noted that the R2
is 0.74 because of the many variables (binder types; W/B and SAP types and contents)
combined in the plots. Hasholt et al., (2010a) reported similar result of 2.88 power value and
299 as constant at an R2 of 0.97. The power value in Equation 2.4 according to literature
(Neville, 2012; Shetty, 2004) is expected to be approximately 3 while the value arrived at for
the constant could vary as influenced by the binder type.
The results from this study reveal that SAP addition leads to reduction in compressive
strength of the low W/B HPC while correction made for void volume (SAP and air) using the
Bolomey’s formula and Powers gel-space ratio enhanced a good fit into the Powers’ Model.
This makes it possible to predict the SAP effect on the compressive strength of HPC.
5.2 Elastic Modulus
The outcome of the experimental work performed in this study on E-modulus is presented in under
the sub-headings as follows:
5.2.1 Results
Results of E-modulus tests of the various HPC mixtures are presented in Tables 5.9 and 5.10 giving
average result of triplicate samples for respective specimen at the various curing ages (28, 56 and 90
days). The CoV of the E-modulus values are generally below 6.0% except for some few specimens
having values relatively high CoV (6.55 to 9.59% - yellow highlight in the Tables). This however is
still below acceptable limit of 10.0%.
Figures 5.13 and 5.14 for binary (M2 and M3) and ternary (M1F and M1S) cements HPCs gives the
graphical representation of the E-modulus values. The results show that E-modulus for the HPCs with
or without SAP remains generally within the same range but significantly lower at longer curing ages
(56 and 90 days).
Stellenbosch University https://scholar.sun.ac.za
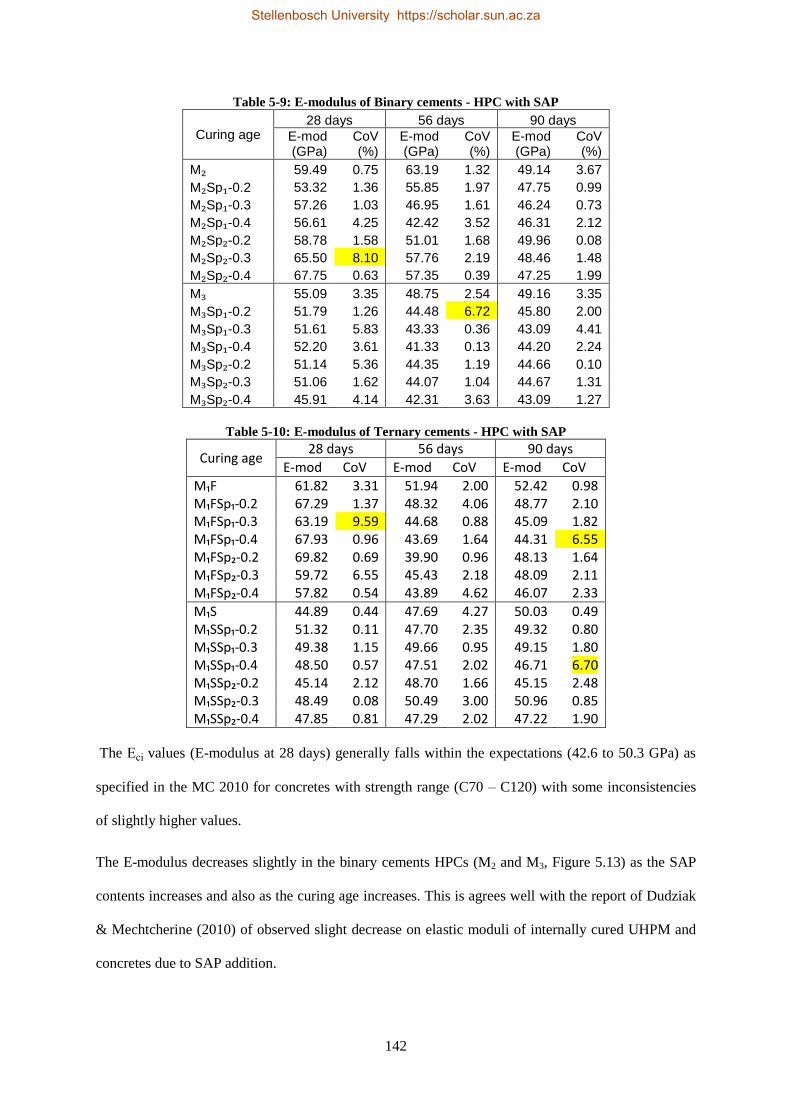
142
Table 5-9: E-modulus of Binary cements - HPC with SAP
Curing age 28 days 56 days 90 days
E-mod (GPa)
CoV (%)
E-mod (GPa)
CoV (%)
E-mod (GPa)
CoV (%)
M₂ 59.49 0.75 63.19 1.32 49.14 3.67
M₂Sp₁-0.2 53.32 1.36 55.85 1.97 47.75 0.99
M₂Sp₁-0.3 57.26 1.03 46.95 1.61 46.24 0.73
M₂Sp₁-0.4 56.61 4.25 42.42 3.52 46.31 2.12
M₂Sp₂-0.2 58.78 1.58 51.01 1.68 49.96 0.08
M₂Sp₂-0.3 65.50 8.10 57.76 2.19 48.46 1.48
M₂Sp₂-0.4 67.75 0.63 57.35 0.39 47.25 1.99
M₃ 55.09 3.35 48.75 2.54 49.16 3.35
M₃Sp₁-0.2 51.79 1.26 44.48 6.72 45.80 2.00
M₃Sp₁-0.3 51.61 5.83 43.33 0.36 43.09 4.41
M₃Sp₁-0.4 52.20 3.61 41.33 0.13 44.20 2.24
M₃Sp₂-0.2 51.14 5.36 44.35 1.19 44.66 0.10
M₃Sp₂-0.3 51.06 1.62 44.07 1.04 44.67 1.31
M₃Sp₂-0.4 45.91 4.14 42.31 3.63 43.09 1.27
Table 5-10: E-modulus of Ternary cements - HPC with SAP
Curing age 28 days 56 days 90 days
E-mod CoV E-mod CoV E-mod CoV
M₁F 61.82 3.31 51.94 2.00 52.42 0.98 M₁FSp₁-0.2 67.29 1.37 48.32 4.06 48.77 2.10 M₁FSp₁-0.3 63.19 9.59 44.68 0.88 45.09 1.82 M₁FSp₁-0.4 67.93 0.96 43.69 1.64 44.31 6.55 M₁FSp₂-0.2 69.82 0.69 39.90 0.96 48.13 1.64 M₁FSp₂-0.3 59.72 6.55 45.43 2.18 48.09 2.11 M₁FSp₂-0.4 57.82 0.54 43.89 4.62 46.07 2.33
M₁S 44.89 0.44 47.69 4.27 50.03 0.49 M₁SSp₁-0.2 51.32 0.11 47.70 2.35 49.32 0.80 M₁SSp₁-0.3 49.38 1.15 49.66 0.95 49.15 1.80 M₁SSp₁-0.4 48.50 0.57 47.51 2.02 46.71 6.70 M₁SSp₂-0.2 45.14 2.12 48.70 1.66 45.15 2.48 M₁SSp₂-0.3 48.49 0.08 50.49 3.00 50.96 0.85 M₁SSp₂-0.4 47.85 0.81 47.29 2.02 47.22 1.90
The Eci values (E-modulus at 28 days) generally falls within the expectations (42.6 to 50.3 GPa) as
specified in the MC 2010 for concretes with strength range (C70 – C120) with some inconsistencies
of slightly higher values.
The E-modulus decreases slightly in the binary cements HPCs (M2 and M3, Figure 5.13) as the SAP
contents increases and also as the curing age increases. This is agrees well with the report of Dudziak
& Mechtcherine (2010) of observed slight decrease on elastic moduli of internally cured UHPM and
concretes due to SAP addition.
Stellenbosch University https://scholar.sun.ac.za

143
(a) (b)
(c) (d) Figure 5-13: E-modulus of binary cements HPC against curing age; (a) M2SP1 - HPC; (b) M2SP2 - HPC;
(c) M3SP1 - HPC and (d) M3SP2 - HPC.
(a) (b)
(c) (d) Figure 5-14: E-modulus of binary cements HPC against curing age; (a) M1FSP1-HPC; (b) M1FSP2-HPC;
(c) M1SSP1-HPC and (d) M1SSP2-HPC
Stellenbosch University https://scholar.sun.ac.za
144
However, in the ternary cement HPCs (Figure 5.14), a difference was observed. While the M1F series
shows a trend of E-modulus decreasing as the curing age increases but having relatively similar values
with or without SAP, the M1S series maintains similar E-modulus values irrespective of the variations
in the SAP contents and curing age studied. This implies that the E-modulus of M1S is not influenced
by the increase in SAP contents or the curing age of the concrete.
5.2.2 Discussion
An examination of the mean E-modulus results for the HPCs mixtures shows that the mean 28 days
E - modulus is higher than the 56 and 90 days which gave similar values with higher variance in 56
days as reflected by the error bars (Figure 5.15). Error bars here refers to the spread of the measure of
the data set which is taken as ± 1 standard deviation. This implies that the least variation in the result
for the E-modulus of the HPCs is observed after 90 days curing. E-modulus specifically is often
reported after 90 days for this type of concrete – HPC (Aītcin, 1998; Mehta & Monteiro, 2014).
Figure 5-15: Mean E-modulus of HPCs against curing age
*Note that the 95% Cl shown in the figure is an indication that the analysis was performed at 95%
confidence level.
Stellenbosch University https://scholar.sun.ac.za

145
The result of the experiment is an indication that the concrete stiffness is high at the 28 days possibly
due to presence of some moisture still retained within the inter-phase while at the longer curing age
almost all the moisture within the concrete had been used up by the hydration process of cement.
Recent work of Liu, et al. (2014), reports that moisture content of concrete has an influence on its
mechanical behaviour and that higher moisture content, results in higher modulus of elasticity for
concrete of same compressive strength range. It can therefore be argued that E-modulus value after 90
days is better adopted for specification in performance-based design of HPCs especially when other
admixtures and IC-agents are incorporated in the mix. The CoV as calculated in Tables 5.9 and 5.10
shows the two E-modulus values with widest variance from the its mean was found in the specimen
tested at 28 days curing. Similar picture is seen at Figure 5.15 for the generalised mean E-modulus
plot against curing age showing the 28 days value having a wider variance from its mean. This study
will thereby want to align with the postulations of Liu et al. (2014) on higher moisture presence at the
28 days age resulting in the higher E-modulus values with wider variation.
The E-modulus values plotted against SAP contents (Figure 5.16a) and SAP type (Figure 5.16b) for
the HPCs reveals further that SAP introduction at the concentrations studied in this work has little or
no influence on the mean E-modulus of this low W/B concrete. The E-modulus plot against binder
type (Figure 5.17a) shows some influence on the mean value of the E-modulus with binder Type 2
(M1F) giving the highest E-modulus value, followed by Type 1 (M2 and M3) while Type 3 (M1S) has
the least value of mean E-modulus. Some influence of W/B on mean E-modulus of HPC with SAP is
presented in Figure 5.17b. The ternary cements HPCs (M1F and M1S series), though been of lower
W/B than M2 series is of lower E-modulus, while M3 which is of the lowest W/B has also the lowest
E-modulus. The influence of M3 series was the reason for the E-modulus plot against binder type
showing M1F (binder type 2) as the best performed of the binder types since M2 and M3 are combined
as binder Type 1. The binder type and W/B can therefore be adjudged as of major influence on E-
modulus of HPC with SAP as IC-agent.
General linear model – univariate analysis using SPSS carried out on the results of E-modulus of this
study as presented in Table 5.11 reveals that all the factors individually had significant effect on the
Stellenbosch University https://scholar.sun.ac.za

146
E-modulus of HPC. The two variable interaction effects analysis also show most variable
combinations to be of significant effect with exception only three combination cases (asterisks (*1)
Table 5.12 - (SAP content* Curing age; SAP type * Binder type and SAP type * Curing Age)).
(a) (b) Figure 5-16: Mean E-modulus of HPCs (a) against SAP contents (b) against SAP type
(a) (b) Figure 5-17: Mean E-modulus of HPCs (a) against binder type (b) against W/B
Three and four factor combination effects were generally observed to be significant too but only a
combination series in three factor analysis (asterisks (*2) - SAP content * SAP type * Binder type) is
not significant. SAP content is noted to be of the least significant level as single factor of all the
dependent variables and the most insignificant effect of the two factor analysis is noted to be with
combination of SAP type and Binder type. The combination of W/B with other factors (be it at two,
Stellenbosch University https://scholar.sun.ac.za

147
three or four factor analysis) was significant in all situations, thereby signifying that W/B has the
highest influence on the outcome of E-modulus. The R2 value 0.944 shows a strong correlation exists
between the fixed factors (i.e. independent variables) and the dependent variable (E-modulus).
Table 5-11: Between Test Effects on E-modulus
Source
Type III Sum
of Squares df Mean Square F Sig.
Corrected Model 11191.330a 83 134.835 34.275 .000
Intercept 589388.334 1 589388.334 1.498E5 .000
W/B 1361.535 1 1361.535 346.098 .000
SAP content 80.439 2 40.220 10.224 .000
SAP type 20.539 1 20.539 5.221 .024
Binder type 590.941 1 590.941 150.215 .000
Curing Age 3037.730 2 1518.865 386.091 .000
Two Factor Analysis
W/B * SAP content 26.501 2 13.251 3.368 .037
W/B * SAP type 277.363 1 277.363 70.505 .000
W/B * Curing Age 288.684 2 144.342 36.691 .000
SAP content * SAP type 104.420 2 52.210 13.272 .000
SAP content * Binder type 91.308 2 45.654 11.605 .000
SAP content * Curing Age 25.462 4 6.365 1.618 .172*1
SAP type * Binder type 3.459 1 3.459 .879 .350*1
SAP type * Curing Age 20.325 2 10.162 2.583 .079*1
Binder type * Curing Age 1947.695 2 973.847 247.549 .000
Three Factor Analysis
W/B * SAP content * SAP type 102.871 2 51.436 13.075 .000
W/B * SAP content * Curing Age 87.554 4 21.888 5.564 .000
W/B * SAP type * Curing Age 86.349 2 43.175 10.975 .000
SAP content * SAP type * Binder type 14.248 2 7.124 1.811 .167*2
SAP content * SAP type * Curing Age 124.218 4 31.055 7.894 .000
SAP content * Binder type * Curing Age 42.759 4 10.690 2.717 .032
SAP type * Binder type * Curing Age 28.893 2 14.447 3.672 .027
Four Factor Analysis
W/B * SAP content * SAP type * Curing Age 97.967 4 24.492 6.226 .000
SAP content * SAP type * Binder type * Curing Age 160.689 4 40.172 10.212 .000
Error 660.904 168 3.934
Total 648425.636 252
Corrected Total 11852.235 251
a. R Squared = .944 (Adjusted R Squared = .917)
The Duncan’s multiple range test results as presented in Appendix B3 reveal that there is no
significant difference in the observed means for the various groupings of the effect of independent
variables on the E-modulus of the HPCs. The grouping 1 of observed means for SAP type (for SP1)
however has a value of significant level slightly above the 95% confidence level (Table B3.3 at a
significant value of 0.079), being the least of the significant levels observed. This is followed by the
Stellenbosch University https://scholar.sun.ac.za

148
groupings 2 for means of SAP contents (i.e. 0.2 SAP contents) with a significant value of 0.641 as
observed in Table B3.1 to B3.5 (Page 211).
5.3 Splitting Tensile Strength and Fracture Energy
Results and discussions of the splitting tensile strength and fracture energy tests conducted using the
wedge splitting tests according to RILEM Recommendations AAC13.1 (TC51-ALC, 78-MCA, 1992)
as explained in Section 3.2.4 are presented in the following sub-sections:
5.3.1 Results
Results of the Wedge Splitting test carried out to determine the splitting strength and fracture energy
are presented in this section. The results extracted from the test setup as explained earlier was the
splitting force (Fsp in kN) against the crack mouth opening displacement (CMOD in mm). Figure 5.18
below shows a typical set of results for triplicate specimen (for M1SSP1-0.4 after 28 days curing).
The data obtained was then computed for each sample for calculation of the work of fracture (Wf)
which is the area under the Fsp - CMOD curve using the trapezoidal rule in accordance to Brühwiler
(1990) recommendations and hence the calculation of the fracture energy (GF) as discussed earlier in
Section 2.8.
Figure 5-18: Typical plot of data extracted from Wedge Splitting Test for Wf and Gf Calculation
Stellenbosch University https://scholar.sun.ac.za
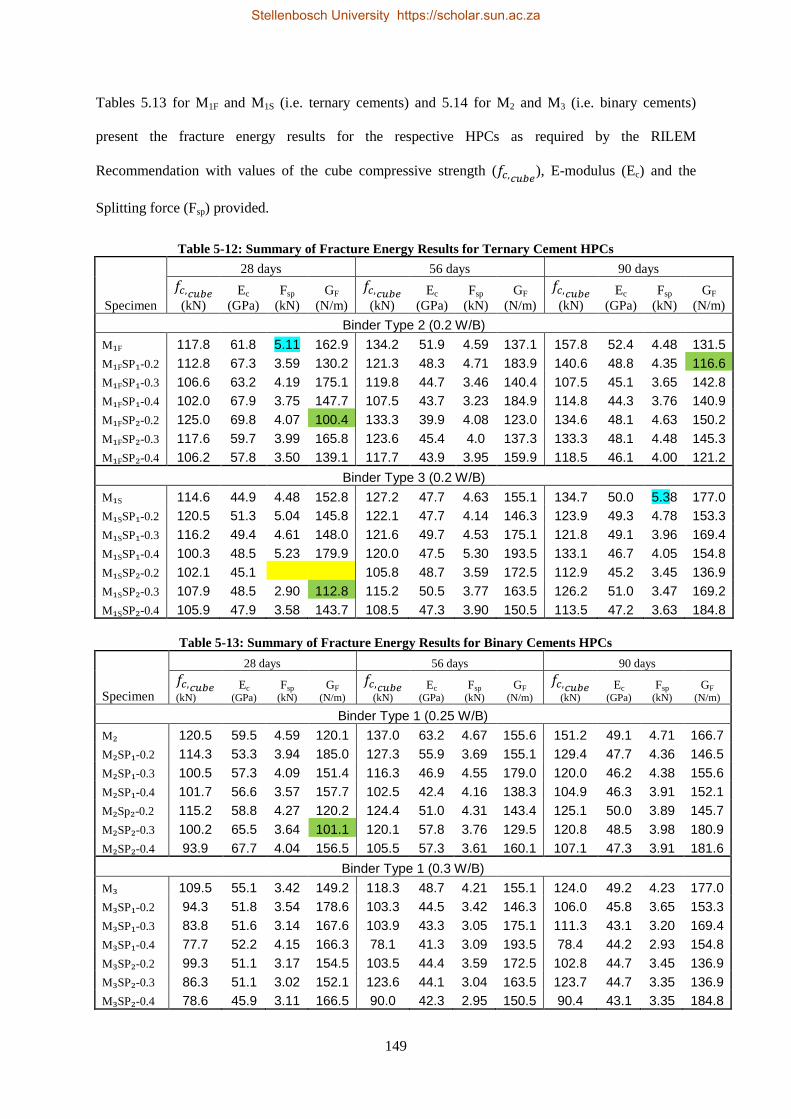
149
Tables 5.13 for M1F and M1S (i.e. ternary cements) and 5.14 for M2 and M3 (i.e. binary cements)
present the fracture energy results for the respective HPCs as required by the RILEM
Recommendation with values of the cube compressive strength (𝑓𝑐,𝑐𝑢𝑏𝑒), E-modulus (Ec) and the
Splitting force (Fsp) provided.
Table 5-12: Summary of Fracture Energy Results for Ternary Cement HPCs
28 days 56 days 90 days
Specimen
𝑓𝑐,𝑐𝑢𝑏𝑒
(kN)
Ec
(GPa)
Fsp
(kN)
GF
(N/m)
𝑓𝑐,𝑐𝑢𝑏𝑒
(kN)
Ec
(GPa)
Fsp
(kN)
GF
(N/m)
𝑓𝑐,𝑐𝑢𝑏𝑒
(kN)
Ec
(GPa)
Fsp
(kN)
GF
(N/m)
Binder Type 2 (0.2 W/B)
M₁F 117.8 61.8 5.11 162.9 134.2 51.9 4.59 137.1 157.8 52.4 4.48 131.5
M₁FSP₁-0.2 112.8 67.3 3.59 130.2 121.3 48.3 4.71 183.9 140.6 48.8 4.35 116.6
M₁FSP₁-0.3 106.6 63.2 4.19 175.1 119.8 44.7 3.46 140.4 107.5 45.1 3.65 142.8
M₁FSP₁-0.4 102.0 67.9 3.75 147.7 107.5 43.7 3.23 184.9 114.8 44.3 3.76 140.9
M₁FSP₂-0.2 125.0 69.8 4.07 100.4 133.3 39.9 4.08 123.0 134.6 48.1 4.63 150.2
M₁FSP₂-0.3 117.6 59.7 3.99 165.8 123.6 45.4 4.0 137.3 133.3 48.1 4.48 145.3
M₁FSP₂-0.4 106.2 57.8 3.50 139.1 117.7 43.9 3.95 159.9 118.5 46.1 4.00 121.2
Binder Type 3 (0.2 W/B)
M₁S 114.6 44.9 4.48 152.8 127.2 47.7 4.63 155.1 134.7 50.0 5.38 177.0
M₁SSP₁-0.2 120.5 51.3 5.04 145.8 122.1 47.7 4.14 146.3 123.9 49.3 4.78 153.3
M₁SSP₁-0.3 116.2 49.4 4.61 148.0 121.6 49.7 4.53 175.1 121.8 49.1 3.96 169.4
M₁SSP₁-0.4 100.3 48.5 5.23 179.9 120.0 47.5 5.30 193.5 133.1 46.7 4.05 154.8
M₁SSP₂-0.2 102.1 45.1
105.8 48.7 3.59 172.5 112.9 45.2 3.45 136.9
M₁SSP₂-0.3 107.9 48.5 2.90 112.8 115.2 50.5 3.77 163.5 126.2 51.0 3.47 169.2
M₁SSP₂-0.4 105.9 47.9 3.58 143.7 108.5 47.3 3.90 150.5 113.5 47.2 3.63 184.8
Table 5-13: Summary of Fracture Energy Results for Binary Cements HPCs
28 days 56 days 90 days
Specimen
𝑓𝑐,𝑐𝑢𝑏𝑒
(kN)
Ec (GPa)
Fsp
(kN)
GF
(N/m)
𝑓𝑐,𝑐𝑢𝑏𝑒
(kN)
Ec
(GPa)
Fsp
(kN)
GF
(N/m)
𝑓𝑐,𝑐𝑢𝑏𝑒
(kN)
Ec (GPa)
Fsp
(kN)
GF
(N/m)
Binder Type 1 (0.25 W/B)
M₂ 120.5 59.5 4.59 120.1 137.0 63.2 4.67 155.6 151.2 49.1 4.71 166.7
M₂SP₁-0.2 114.3 53.3 3.94 185.0 127.3 55.9 3.69 155.1 129.4 47.7 4.36 146.5
M₂SP₁-0.3 100.5 57.3 4.09 151.4 116.3 46.9 4.55 179.0 120.0 46.2 4.38 155.6
M₂SP₁-0.4 101.7 56.6 3.57 157.7 102.5 42.4 4.16 138.3 104.9 46.3 3.91 152.1
M₂Sp₂-0.2 115.2 58.8 4.27 120.2 124.4 51.0 4.31 143.4 125.1 50.0 3.89 145.7
M₂SP₂-0.3 100.2 65.5 3.64 101.1 120.1 57.8 3.76 129.5 120.8 48.5 3.98 180.9
M₂SP₂-0.4 93.9 67.7 4.04 156.5 105.5 57.3 3.61 160.1 107.1 47.3 3.91 181.6
Binder Type 1 (0.3 W/B)
M₃ 109.5 55.1 3.42 149.2 118.3 48.7 4.21 155.1 124.0 49.2 4.23 177.0
M₃SP₁-0.2 94.3 51.8 3.54 178.6 103.3 44.5 3.42 146.3 106.0 45.8 3.65 153.3
M₃SP₁-0.3 83.8 51.6 3.14 167.6 103.9 43.3 3.05 175.1 111.3 43.1 3.20 169.4
M₃SP₁-0.4 77.7 52.2 4.15 166.3 78.1 41.3 3.09 193.5 78.4 44.2 2.93 154.8
M₃SP₂-0.2 99.3 51.1 3.17 154.5 103.5 44.4 3.59 172.5 102.8 44.7 3.45 136.9
M₃SP₂-0.3 86.3 51.1 3.02 152.1 123.6 44.1 3.04 163.5 123.7 44.7 3.35 136.9
M₃SP₂-0.4 78.6 45.9 3.11 166.5 90.0 42.3 2.95 150.5 90.4 43.1 3.35 184.8
Stellenbosch University https://scholar.sun.ac.za

150
*𝑓𝑐,𝑐𝑢𝑏𝑒 = cube compressive strength, Ec = E-modulus, Fsp = splitting force, GF = fracture energy
An assessment of the results reveals no particular trend on influence of SAP addition on the splitting
tensile strength and fracture energy of the HPCs. The works of Lam & Hooton (2005) reported
similar or higher splitting tensile strength for SAP modified concretes on the 28 days. The explanation
offered the better splitting tensile strength at 28 days in SAP modified concrete by Mechtcherine &
Reinhardt (2012) is that SAP, in parallel to shrinkage mitigation, successfully increased the tensile
cracking resistance of the cement-based system. This explanation is applicable in this test too as the
reason for no significant reduction in tensile splitting strength of the SAP modified HPC.
The fracture energy values are generally within the same range of 130 N/m to 185 N/m for all
specimens with or without SAP addition except in a few instances (as highlighted in green in Tables
5.17 and 5.18 which deviates from the range). The GF value obtained is within the expected range for
concrete of this strength range made from maximum aggregate size of 13 mm (fib MC 2010). A check
of the GF in line with MC 2010 provision on basis of maximum aggregate size (GF = a. ϴn) as 183.15
N/m while a second check using a characteristic compressive strength of 90 N/mm2 (using Gf =
72.fcu0.18
) gives a value of 161.85 N/m. Both checks therefore show that Gf values obtained are similar
to the MC 2010 provisions. The result for the 28 day test for M1SSP2-0.2 sample (yellow highlight on
Table 5.17) was however lost as the samples failed suddenly during testing due to poor closed loop
control.
Figures 5.19 to 5.22 further show that curing age influence on the GF values cannot also be placed into
any particular trend too. The splitting force was also observed to generally maintain a value range of
3.0 kN to 5.0 kN for all the HPCs examined except two cases of inconsistencies (blue highlight of
Table 5.10). There was however cases of observed reduction in the value of Gf with decrease in age
(Figure 5.19, M1F and M1FSP1-0.2)
Stellenbosch University https://scholar.sun.ac.za

151
Figure 5-19: Fracture Energy (GF) of M1F – HPC
Figure 5-20: Fracture Energy (GF) of M1S – HPC
Figure 5-21: Fracture Energy (GF) of M2 – HPC
Stellenbosch University https://scholar.sun.ac.za

152
Figure 5-22: Fracture Energy (GF) of M3 – HPC
5.3.2 Discussion
Table 5.15 presents the results of the general linear model – univariate analysis for the splitting force
of the HPC with SAP.
It is observed that three variables (W/B, SAP type and SAP content – asterisks’ (*1), Table 5.12) in
that order had significant effect individually on the force of splitting. W/B showing the highest
influence is as expected, since higher W/B in concrete should infer lower force required to split the
concrete specimen. The two variable interactions further affirm the influence of SAP content and SAP
type when combined with binder type on the splitting force of the HPC containing SAP.
Figure 5.23 show that the mean splitting force (from the statistical analysis) has a negative correlation
with SAP content. The splitting force (and hence the splitting strength) decreases as the SAP content
increases. The widest scatter of splitting force value was noted to be in the reference mixtures, an
indication of the greater influence of W/B on the varied splitting force obtained for reference HPC
mixtures. Figure 5.24 further shows that SP2 inclusion in HPC resulted in lower splitting force than
SP1. The splitting force of HPC containing SP1 was similar to that of the reference mixtures.
Stellenbosch University https://scholar.sun.ac.za

153
Table 5-14: Tests of Between-Subjects Effects for Splitting Force (Fsp)
Source Type III Sum of
Squares df
Mean
Square F Sig.
Corrected Model 69.768a 82 .851 3.401 .000
Intercept 2794.699 1 2794.699 11171.046 .000
Single factor Analysis
W/B 11.774 1 11.774 47.064 .000*1
SAP content 1.642 2 .821 3.281 .041*1
SAP type 2.314 1 2.314 9.250 .003*1
Binder type .015 1 .015 .058 .810
Curing Age .791 2 .395 1.580 .210
Two Factor Analysis
W/B * SAP content .616 2 .308 1.230 .296
W/B * SAP type .028 1 .028 .110 .740
W/B * Curing Age .018 2 .009 .036 .964
SAP content * SAP type .097 2 .048 .193 .824
SAP content * Binder type 1.929 2 .964 3.855 .024*1
SAP content * Curing Age .497 4 .124 .496 .739
SAP type * Binder type 5.658 1 5.658 22.617 .000*1
SAP type * Curing Age .621 2 .310 1.241 .293
Binder type * Curing Age .235 2 .118 .470 .626
Three Factor Analysis
W/B * SAP content * SAP type .670 2 .335 1.339 .266
W/B * SAP content * Curing Age .420 4 .105 .420 .794
W/B * SAP type * Curing Age .912 2 .456 1.822 .166
SAP content * SAP type * Binder type .268 2 .134 .536 .586
SAP content * SAP type * Curing Age 1.621 4 .405 1.620 .174
SAP content * Binder type * Curing Age 2.024 4 .506 2.022 .095
SAP type * Binder type * Curing Age .043 2 .021 .085 .918
Four Factor Analysis
W/B * SAP content * SAP type * Curing Age .966 4 .241 .965 .429
SAP content * SAP type * Binder type * Curing Age 1.307 3 .436 1.741 .162
Error 30.521 122 .250
Total 3271.795 205
Corrected Total 100.289 204
a. R Squared = .696 (Adjusted R Squared = .491)
Stellenbosch University https://scholar.sun.ac.za

154
Figure 5-23: Mean Splitting Force (Fsp) against SAP content
Figure 5-24: Splitting Force (Fsp) vs. W/B as influenced by SAP type
The results of general linear – univariate analysis (using SPSS 22) of fracture energy of the
HPC with SAP as presented in Table 5.16 reflect that binder type, SAP type and SAP content
Stellenbosch University https://scholar.sun.ac.za
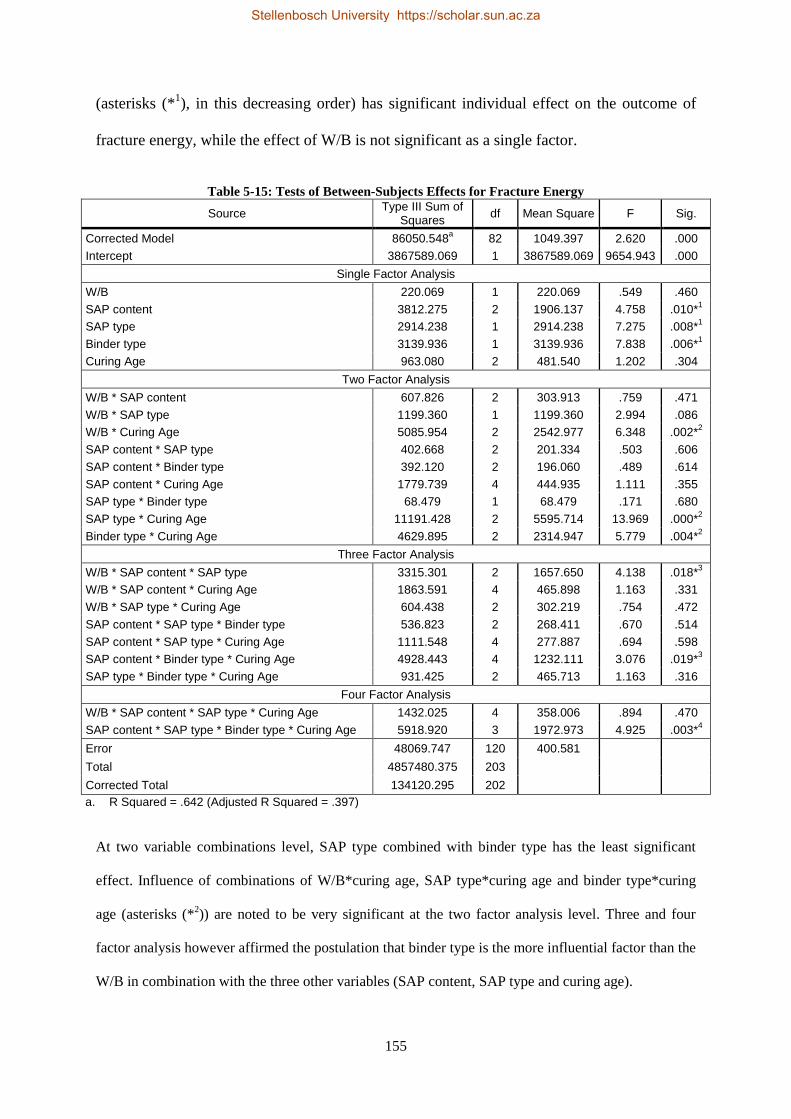
155
(asterisks (*1), in this decreasing order) has significant individual effect on the outcome of
fracture energy, while the effect of W/B is not significant as a single factor.
Table 5-15: Tests of Between-Subjects Effects for Fracture Energy
Source Type III Sum of
Squares df Mean Square F Sig.
Corrected Model 86050.548a 82 1049.397 2.620 .000
Intercept 3867589.069 1 3867589.069 9654.943 .000
Single Factor Analysis
W/B 220.069 1 220.069 .549 .460
SAP content 3812.275 2 1906.137 4.758 .010*1
SAP type 2914.238 1 2914.238 7.275 .008*1
Binder type 3139.936 1 3139.936 7.838 .006*1
Curing Age 963.080 2 481.540 1.202 .304
Two Factor Analysis
W/B * SAP content 607.826 2 303.913 .759 .471
W/B * SAP type 1199.360 1 1199.360 2.994 .086
W/B * Curing Age 5085.954 2 2542.977 6.348 .002*2
SAP content * SAP type 402.668 2 201.334 .503 .606
SAP content * Binder type 392.120 2 196.060 .489 .614
SAP content * Curing Age 1779.739 4 444.935 1.111 .355
SAP type * Binder type 68.479 1 68.479 .171 .680
SAP type * Curing Age 11191.428 2 5595.714 13.969 .000*2
Binder type * Curing Age 4629.895 2 2314.947 5.779 .004*2
Three Factor Analysis
W/B * SAP content * SAP type 3315.301 2 1657.650 4.138 .018*3
W/B * SAP content * Curing Age 1863.591 4 465.898 1.163 .331
W/B * SAP type * Curing Age 604.438 2 302.219 .754 .472
SAP content * SAP type * Binder type 536.823 2 268.411 .670 .514
SAP content * SAP type * Curing Age 1111.548 4 277.887 .694 .598
SAP content * Binder type * Curing Age 4928.443 4 1232.111 3.076 .019*3
SAP type * Binder type * Curing Age 931.425 2 465.713 1.163 .316
Four Factor Analysis
W/B * SAP content * SAP type * Curing Age 1432.025 4 358.006 .894 .470
SAP content * SAP type * Binder type * Curing Age 5918.920 3 1972.973 4.925 .003*4
Error 48069.747 120 400.581 Total 4857480.375 203 Corrected Total 134120.295 202 a. R Squared = .642 (Adjusted R Squared = .397)
At two variable combinations level, SAP type combined with binder type has the least significant
effect. Influence of combinations of W/B*curing age, SAP type*curing age and binder type*curing
age (asterisks (*2)) are noted to be very significant at the two factor analysis level. Three and four
factor analysis however affirmed the postulation that binder type is the more influential factor than the
W/B in combination with the three other variables (SAP content, SAP type and curing age).
Stellenbosch University https://scholar.sun.ac.za

156
Figure 5.25 shows a plot of the fracture energy of the HPC mixtures against SAP contents as
influenced also by the binder type. The figure shows that the fracture energy of the HPCs increases
slightly with increasing SAP contents. The HPCs with the highest SAP content has the highest mean
fracture energy, followed closely by the reference mixtures.
This implies that although the splitting force was higher at lower SAP content, the ductility of the
HPC increases as the SAP contents increase. The ternary binders (Type 2 and Type 3) were generally
observed to show better scatter than the binary binders (Type 1).
The compressive strength vs. fracture energy plots (Figure 5.26 – SAP contents influence and Figure
5.27 – W/B influence) also reflect that observed decrease in compressive strength with W/B and SAP
contents increase does not translate to same change order in fracture energy.
Figure 5-25: Fracture Energy vs. SAP contents as influenced by binder type
The Duncan’s multiple range test results as presented in Tables B4.1 to B4.5 of Appendix B shows
that the groupings of means for the fracture energy as influenced by W/B, SAP contents, SAP type,
binder type, and curing age are all of significant influence. The groupings of means on SAP contents
influence is the closest to the 95% level which serves as the bench-mark for assessing the significant
level of influence for respective factors. It is therefore seen that the splitting tensile strength and
Stellenbosch University https://scholar.sun.ac.za

157
fracture energy of the HPCs are not directly affected by SAP addition neither by the SAP type nor
SAP contents.
Figure 5-26: Compressive Strength vs. Fracture Energy as influenced by SAP contents
Figure 5-27: Compressive Strength vs. Fracture Energy as influenced by W/B
Stellenbosch University https://scholar.sun.ac.za

158
The Duncan’s multiple range test results as presented in Tables B4.1 to B4.5 of Appendix B shows
that the groupings of means for the fracture energy as influenced by W/B, SAP contents, SAP type,
binder type, and curing age are all of significant influence. The groupings of means on SAP contents
influence is the closest to the 95% level which serves as the bench-mark for assessing the significant
level of influence for respective factors. It is therefore seen that the splitting tensile strength and
fracture energy of the HPCs are not directly affected by SAP addition neither by the SAP type nor
SAP contents.
5.4 Summary
The outcome of the various experimental works carried out on the mechanical properties of HPC with
SAP introduced as IC-agents can be summarised as follows:
i. SAP addition to HPCs contribute to the air content in the concrete as the density of the
HPCs decreased at relatively small rate as the SAP content in the concrete increases.
ii. Compressive strength of low W/B HPCs decreases slightly as SAP contents increases.
iii. A combination of void volume correction by the Bolomey’s formula and the Powers gel -
space ratio is a good model for predicting effect of SAP addition on the compressive
strength of the low W/B HPCs.
iv. SAP addition within the limits of the contents used in this study (0.2 to 0.4% bwob) in low
W/B HPCs has no significant influence on the elastic and fracture properties of the
concrete.
SAP addition leads to reduction in compressive strength of HPC, correction made for void
volume (SAP and air) using the Bolomey’s formula and Powers’ gel-space ratio enhanced a good
fit into the Powers’ Model and hence makes it possible to predict the SAP effect on the
compressive strength of HPC. SAP addition within the limits of 0.2% to 0.4% bwob did not lead to
significant decrease in GF of the low W/B HPCs.
Stellenbosch University https://scholar.sun.ac.za

159
6
Non Destructive Tests on HPC with SAP
This chapter presents results and discussion on the non-destructive tests carried out on HPC mixtures
with SAP towards examining the influence of SAP on the porosity, pore distribution, micro-
morphology of the HPC and the crystalline structure of the solid phases of the hydration products in
the various HPC mixtures. The results are classified and discussed in Sections 6.1 and 6.2.
6.1 X-ray CT Scanning
This test involves two stages of investigations namely:
i. X-ray CT scanning of single specimens for all the varied mixtures (M1F, M1S, M2 and M3)
with varied SAP contents (0%, 0.2%, 0.3% and 0.4%) and sizes (SP1 – 0/300 um; SP2 –
0/600 um) cured in water bath at different ages (28, 56 and 90 days) – total of 84 (50 mm
ϴ x 100 mm) concrete cylinders; and
ii. X-ray CT scanning of triplicate specimens of HPC mixtures (M1F, M2 and M3) studied
after 7 and 28 days curing in water. Triplicates of M2 specimen were studied with both
sizes of SAP (SP1 and SP2) – 42 concrete cylinders; while M1F and M 3 triplicates were
studied for SP1 only – also 42 concrete cylinders.
The Stage II (triplicate specimen) analysis was conducted to verify the reason for variation in the
results reported in Stage I.
While casting the triplicate HPC specimens (Stage II), effort was made to keep the fresh concrete on
the vibration table for a longer time (10 mins instead of the 5 mins of Stage I) to ensure that entrapped
air voids are minimised in the HPC mixtures.
The CT scanning analysis enhanced an in-depth view of the internal structure of the HPCs with the
objective of examining the pore spaces within the cement paste matrix and a classification of the air
Stellenbosch University https://scholar.sun.ac.za
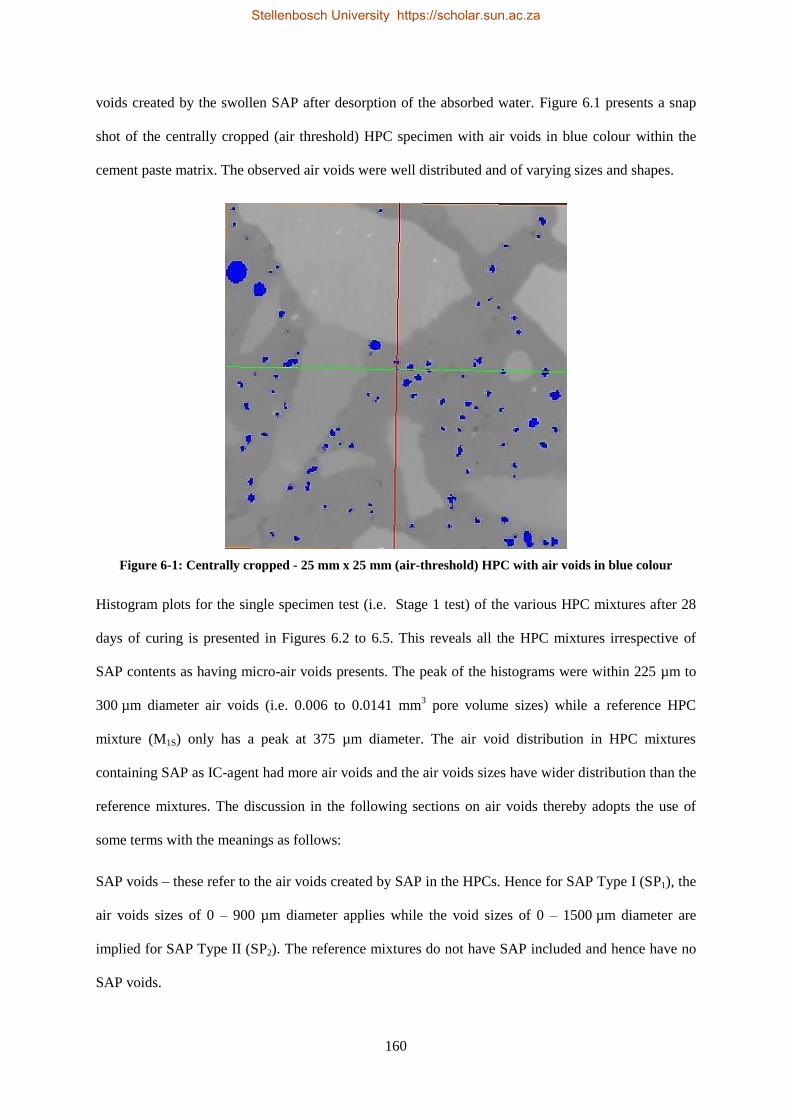
160
voids created by the swollen SAP after desorption of the absorbed water. Figure 6.1 presents a snap
shot of the centrally cropped (air threshold) HPC specimen with air voids in blue colour within the
cement paste matrix. The observed air voids were well distributed and of varying sizes and shapes.
Figure 6-1: Centrally cropped - 25 mm x 25 mm (air-threshold) HPC with air voids in blue colour
Histogram plots for the single specimen test (i.e. Stage 1 test) of the various HPC mixtures after 28
days of curing is presented in Figures 6.2 to 6.5. This reveals all the HPC mixtures irrespective of
SAP contents as having micro-air voids presents. The peak of the histograms were within 225 µm to
300 µm diameter air voids (i.e. 0.006 to 0.0141 mm3 pore volume sizes) while a reference HPC
mixture (M1S) only has a peak at 375 µm diameter. The air void distribution in HPC mixtures
containing SAP as IC-agent had more air voids and the air voids sizes have wider distribution than the
reference mixtures. The discussion in the following sections on air voids thereby adopts the use of
some terms with the meanings as follows:
SAP voids – these refer to the air voids created by SAP in the HPCs. Hence for SAP Type I (SP1), the
air voids sizes of 0 – 900 µm diameter applies while the void sizes of 0 – 1500 µm diameter are
implied for SAP Type II (SP2). The reference mixtures do not have SAP included and hence have no
SAP voids.
Stellenbosch University https://scholar.sun.ac.za
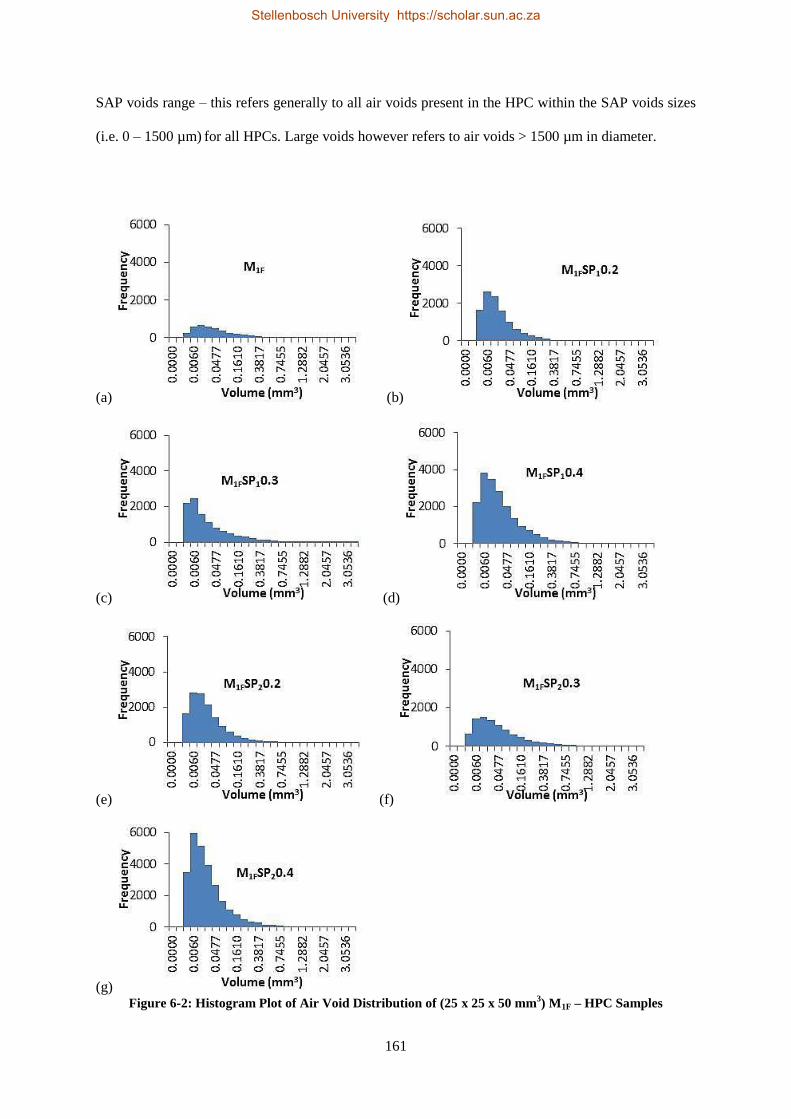
161
SAP voids range – this refers generally to all air voids present in the HPC within the SAP voids sizes
(i.e. 0 – 1500 µm) for all HPCs. Large voids however refers to air voids > 1500 µm in diameter.
(a) (b)
(c) (d)
(e) (f)
(g) Figure 6-2: Histogram Plot of Air Void Distribution of (25 x 25 x 50 mm
3) M1F – HPC Samples
Stellenbosch University https://scholar.sun.ac.za

162
(a) (b)
(c) (d)
(e) (f)
(g)
Figure 6-3: Histogram Plot of Air Void Distribution of (25 x 25 x 50 mm3) M1S – HPC Samples
Stellenbosch University https://scholar.sun.ac.za
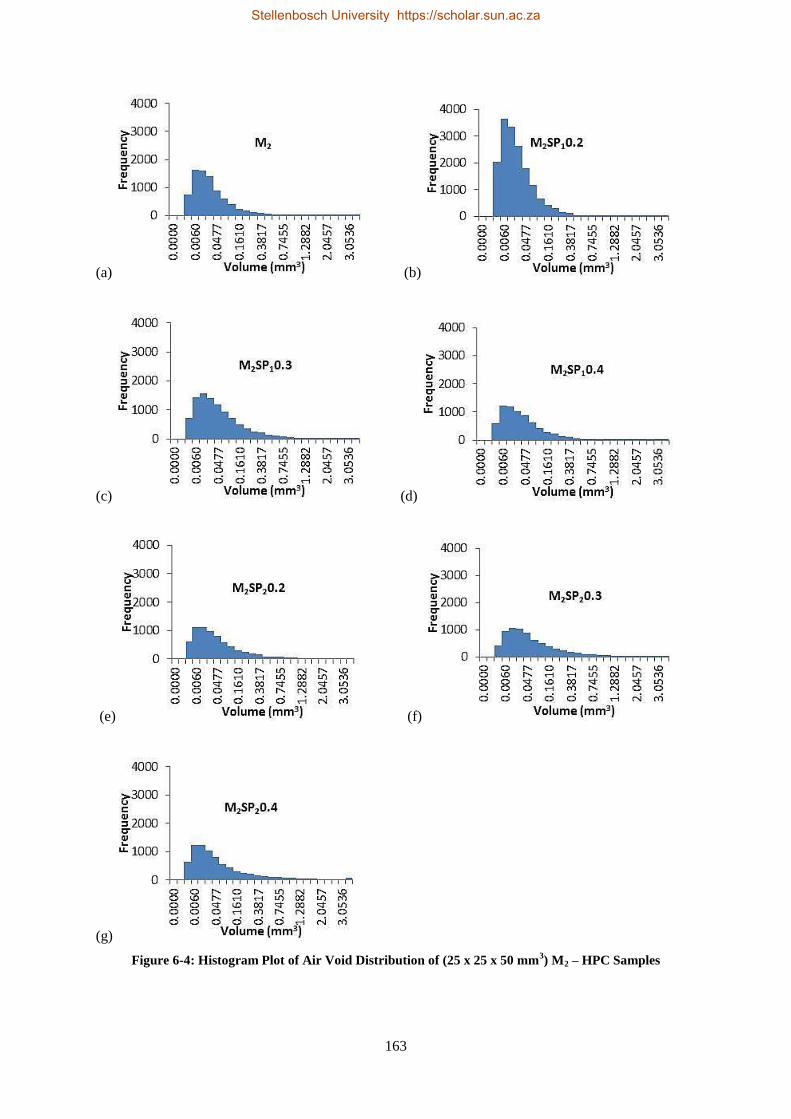
163
(a) (b)
(c) (d)
(e) (f)
(g)
Figure 6-4: Histogram Plot of Air Void Distribution of (25 x 25 x 50 mm3) M2 – HPC Samples
Stellenbosch University https://scholar.sun.ac.za

164
(a) (b)
(c) (d)
(e) (f)
(g)
Figure 6-5: Histogram Plot of Air Void Distribution of (25 x 25 x 50 mm3) M3 – HPC Samples
Stellenbosch University https://scholar.sun.ac.za

165
6.1.1 Influence of SAP Contents on Air Void Distribution
The trend in general (Figure 6.2 to 6.5) is that SAP void% (i.e. SP1 (0 – 900 µm) and SP2 (0 –
1500 µm) as defined in Section 6.1) and total void% (i.e. percentage porosity) increases as the SAP
contents and W/B increases with some inconsistencies present. These results are further summarised
and presented in Tables 6.1 to 6.4 for proper discussion and understanding.
Table 6-1: Summary of Influence of SAP contents and curing age on void distribution for M1F – HPC
Curing Age Influence Ref SAP1 SAP2
M1F-28 days series M1F M1FSP1-0.2 M1FSP1-0.3 M1FSP1-0.4 M1FSP2-0.2 M1FSP2-0.3 M1FSP2-0.4
SAP pore expected%+ 0.00 3.40 5.01 6.56 3.40 5.01 6.56
Demoulded Porosity%++ 0.58 4.39 6.56 6.66 2.43 5.67 6.17
No of voids ˃1500 µm 35 45 48 52 35 57 70
SAP voids% 0.00 1.25 1.51 2.77 2.19 3.05 4.40
Total Porosity% 1.47 2.03 2.91 4.42 2.53 3.53 5.06
Max. void size (mm3) 57.8053 23.1448 65.5331 49.5119 14.7461 11.2816 55.9819
Av. void size (mm3) 0.1535 0.0585 0.0878 0.0707 0.0554 0.1070 0.0556
M1F-56 days series M1F M1FSP1-0.2 M1FSP1-0.3 M1FSP1-0.4 M1FSP2-0.2 M1FSP2-0.3 M1FSP2-0.4
No of voids ˃1500 µm 37 37 37 64 42 67 36
SAP voids% 0.00 1.30 1.87 2.60 1.68 3.91 2.23
Total Porosity% 1.68 2.22 2.68 4.02 2.07 4.49 2.56
Max. void size (mm3) 55.0342 25.5845 57.4526 15.7617 46.9377 32.8651 121.8050
Av. void size (mm3) 0.0287 0.1079 0.0656 0.0570 0.0637 0.1161 0.0604
M1F-90 days series M1F M1FSP1-0.2 M1FSP1-0.3 M1FSP1-0.4 M1FSP2-0.2 M1FSP2-0.3 M1FSP2-0.4
No of voids ˃1500 µm 29 45 53 55 39 152 51
SAP voids% 0.00 1.35 2.21 2.57 1.63 3.88 2.69
Total Porosity% 1.48 2.21 3.31 4.40 2.00 5.31 3.17
Max. void size (mm3) 60.6563 77.9447 55.6584 38.8080 30.2217 31.2426 61.0476
Av. void size (mm3) 0.0861 0.0794 0.0888 0.0878 0.0534 0.1664 0.0560
+Expected pore content by volume based on the 25 g/g pore absorption used for provision of additional water calculated taking the swollen SAP as a spherical substance. ++
Porosity calculated volumetrically using Demoulded density in comparison to designed density
Table 6-2: Summary of Influence of SAP contents and curing age on void distribution for M1S – HPC
Curing Age Influence Ref SAP1 SAP2
M1S-28 days series M1S M1SSP1-0.2 M1S SP1-0.3 M1SSP1-0.4 M1SSP2-0.2 M1SSP2-0.3 M1SSP2-0.4
SAP pore expected%+ 0.00 3.40 5.01 6.56 3.40 5.01 6.56
Demoulded Porosity%++ 0.20 3.99 4.47 6.38 3.52 4.96 6.39
No of voids ˃1500 µm 13 32 26 17 39 29 45
SAP voids% 0.00 1.60 1.92 0.73 2.71 1.70 2.65
Total Porosity% 0.82 2.31 2.60 1.08 3.05 1.98 3.03
Max. void size (mm3) 39.4069 41.7455 17.2391 26.4097 22.1718 23.4150 14.5798
Av. void size (mm3) 0.1085 0.0656 0.0517 0.0391 0.0815 0.1003 0.0934
M1S-56 days series M1S M1SSP10.2 M1SSP10.3 M1SSP1-0.4 M1SSP2-0.2 M1SSP2-0.3 M1SSP2-0.4
No of voids ˃1500 µm 25 21 25 32 21 154 21
SAP voids% 0.00 0.64 1.18 1.89 1.73 3.46 1.47
Total Porosity% 1.32 1.03 1.62 2.77 1.91 4.92 1.68
Max. void size (mm3) 39.5014 42.2539 66.9719 31.1374 13.1822 67.1117 31.0256
Av. void size (mm3) 0.0695 0.0752 0.0716 0.0602 0.0818 0.1977 0.0957
M1S-90 days series M1S M1SSP1-0.2 M1SSP1-0.3 M1SSP1-0.4 M1SSP2-0.2 M1SSP2-0.3 M1SSP2-0.4
No of voids ˃1500 µm 27 29 45 22 47 22 26
SAP voids% 0.00 1.55 1.73 1.86 2.15 2.40 2.45
Total Porosity% 0.86 2.29 2.65 2.63 2.55 2.61 2.69
Max. void size (mm3) 28.2159 15.2320 35.8571 21.9362 23.8276 17.2884 15.4103
Av. void size (mm3) 0.1477 0.0608 0.0817 0.0593 0.0641 0.0784 0.1051
+Expected pore content by volume based on the 25 g/g pore absorption used for provision of additional water calculated taking the swollen SAP as a spherical substance. ++
Porosity calculated volumetrically using Demoulded density in comparison to designed density.
Stellenbosch University https://scholar.sun.ac.za

166
Table 6-3: Summary of Influence of SAP contents and curing age on void distribution for M2 – HPC
Curing Age Influence Ref SAP1 SAP2
M2-28 days series M2 M2SP1-0.2 M2SP1-0.3 M2SP1-0.4 M2SP2-0.2 M2SP2-0.3 M2SP2-0.4
SAP pore expected%+ 0.00 2.85 4.21 5.53 2.85 4.21 5.53
Demoulded Porosity%++ 0.17 2.37 3.98 5.47 1.88 4.06 5.38
No of voids ˃1500 µm 63 50 63 47 98 118 157
SAP voids% 0.00 2.01 1.91 1.19 2.51 3.12 3.12
Total Porosity% 2.33 3.05 3.65 2.22 3.39 4.19 4.65
Max. void size (mm3) 122.1950 101.0430 52.7768 87.1312 43.9629 87.0767 53.5381
Av. void size (mm3) 0.1247 0.0640 0.1244 0.1199 0.1469 0.1907 0.2474
M2-56 days series M2 M2SP1-0.2 M2SP1-0.3 M2SP1-0.4 M2SP2-0.2 M2SP2-0.3 M2SP2-0.4
No of voids ˃1500 µm 49 50 70 44 43 36 195
SAP voids% 0.00 0.93 1.37 1.14 1.86 2.00 2.84
Total Porosity% 2.29 1.71 3.02 2.03 2.23 2.35 4.72
Max. void size (mm3) 28.6351 93.9300 84.8632 34.1548 52.4560 49.9551 72.2334
Av. void size (mm3) 0.0770 0.0707 0.1161 0.0881 0.1293 0.0909 0.3734
M2-90 days series M2 M2SP1-0.2 M2SP1-0.3 M2SP1-0.4 M2SP2-0.2 M2SP2-0.3 M2SP2-0.4
No of voids ˃1500 µm 33 47 36 67 85 40 107
SAP voids% 0.00 1.44 1.77 2.05 2.19 1.98 2.89
Total Porosity% 1.78 2.44 2.60 3.19 2.95 2.37 3.88
Max. void size (mm3) 78.9696 46.8672 41.0228 14.3176 24.7034 34.7591 28.5593
Av. void size (mm3) 0.0913 0.0680 0.0648 0.0733 0.2126 0.1029 0.1779
+Expected pore content by volume based on the 25 g/g pore absorption used for provision of additional water calculated taking the swollen SAP as a spherical substance. ++
Porosity calculated volumetrically using Demoulded density in comparison to designed density.
Table 6-4: Summary of Influence of SAP contents and curing age on void distribution for M3 – HPC
Curing Age Influence Ref SAP1 SAP2
M3-28 days series M3 M3SP1-0.2 M3SP1-0.3 M3SP1-0.4 M3SP2-0.2 M3SP2-0.3 M3Sp2-0.4
SAP pore expected%+ 0.00 2.64 3.91 5.14 2.64 3.91 5.14
Demoulded Porosity%++ 1.58 3.25 6.00 6.00 3.92 3.56 4.54
No of voids ˃1500 µm 65 50 57 191 171 119 199
SAP voids% 0.00 2.27 2.32 1.94 4.04 4.09 3.33
Total Porosity% 3.54 3.85 4.12 5.73 5.63 5.26 5.23
Max. void size (mm3) 50.0416 14.2617 20.4162 103.9910 86.8118 53.2107 48.4244
Av. void size (mm3) 0.1156 0.0821 0.0930 0.2443 0.1742 0.1576 0.2170
M3-56 days series M3 M3SP1-0.2 M3SP1-0.3 M3SP1-0.4 M3SP2-0.2 M3SP2-0.3 M3SP2-0.4
No of voids ˃1500 µm 53 43 42 196 84 149 113
SAP voids% 0.00 1.75 1.39 2.23 3.05 3.34 3.75
Total Porosity% 2.10 2.84 2.33 6.05 3.86 4.71 4.83
Max. void size (mm3) 22.0547 38.5817 46.5664 39.6771 55.8621 60.3435 25.2584
Av. void size (mm3) 0.1185 0.0779 0.0915 0.1973 0.1859 0.1790 0.1508
M3-90 days series M3 M3SP1-0.2 M3SP1-0.3 M3SP1-0.4 M3SP2-0.2 M3SP2-0.3 M3SP2-0.4
No of voids ˃1500 µm 34 35 64 70 51 52 104
SAP voids% 0.00 1.04 1.98 2.06 2.44 2.44 3.19
Total Porosity% 1.98 2.41 3.49 3.85 2.95 2.92 4.15
Max. void size (mm3) 31.7151 28.7177 12.1826 71.1845 45.9914 100.9750 26.2220
Av. void size (mm3) 0.0679 0.1026 0.1134 0.1008 0.1533 0.1634 0.1465
+Expected pore content by volume based on the 25 g/g pore absorption used for provision of additional water calculated taking the swollen SAP as a spherical substance. ++
Porosity calculated volumetrically using Demoulded density in comparison to designed density.
Stellenbosch University https://scholar.sun.ac.za

167
An examination of the maximum void sizes in the HPC mixtures (Tables 6.1 to 6.4) reveals neither a
particular trend nor consistency which is expected as the maximum pore would depend on statistical
probability and the sample size. The reference mixtures after 28 days of curing give maximum void
sizes amongst the largest in most instances ((M1F (57.80 mm3); M1S (39.41 mm
3); M2 (122.2 mm
3) and
M3 (50.04 mm3) - Tables 6.1 to 6.4) while very high numbers (80 – 200) of large voids (> 1500 µm)
are seen in many of the single specimen analysed (pink colour highlights in Tables 6.1 – 6.4). The
study also observed the existence of a high number of air voids larger than SAP created voids (> 900
µm for SP1 (≤ 300 µm) and > 1500 µm for SP2 (≤ 300 µm)); arbitrary extremes (very small and large)
air voids volumes (blue colour highlights in Tables 6.1 – 6.4) were noted too and these definitely
contributed to the value obtained for total porosity as calculated from the X-ray CT scanning analysis.
Average pore (i.e. air void) sizes in the HPCs varied between 0.02 mm3 and 0.40 mm
3 without
following a particular trend (Tables 6.1 to 6.4) in the single specimen analysis.
The porosity created by SAP in the HPC (SAP voids porosity) were generally about halve the value of
porosity expected using the 25 g/g SAP absorption capacity determined via the tea-bag test as
discussed and reported in Sections 3.2.1 and 4.1.2. The demoulded porosity however gave similar
values to the calculated porosity expected (Table 6.1 to 6.4), although a bit higher. The total porosity
from X-ray CT scanning analysis on the other hand is even lower than the demoulded porosity. This
implies that porosity in the HPC generally decreased with cement hydration over time. An indication
that the initial volume occupied by the swollen SAP in the fresh concrete observed as SAP voids
reduces in size and hence volume with increased concrete age as cement hydration products occupy
the spaces created by the swollen SAP. It follows that maintaining the water added to the mixing
water for SAP absorption in concrete mixtures at 12.5 g/g (i.e. halve the 25 g/g used in this study),
similar value to that suggested in previous studies (Esteves, 2014; Hasholt et al., 2012), will reduce
occurrence of SAP created air voids in these HPCs and hence avert the strength reduction effect of
SAP addition observed.
Figure 6.6 shows that for the single specimen analysis, the SAP voids (SP1 (0 -900 µm); SP2 (0 –
1500 µm)) increased with increase in SAP contents for all HPC mixtures irrespective of the SAP size
Stellenbosch University https://scholar.sun.ac.za
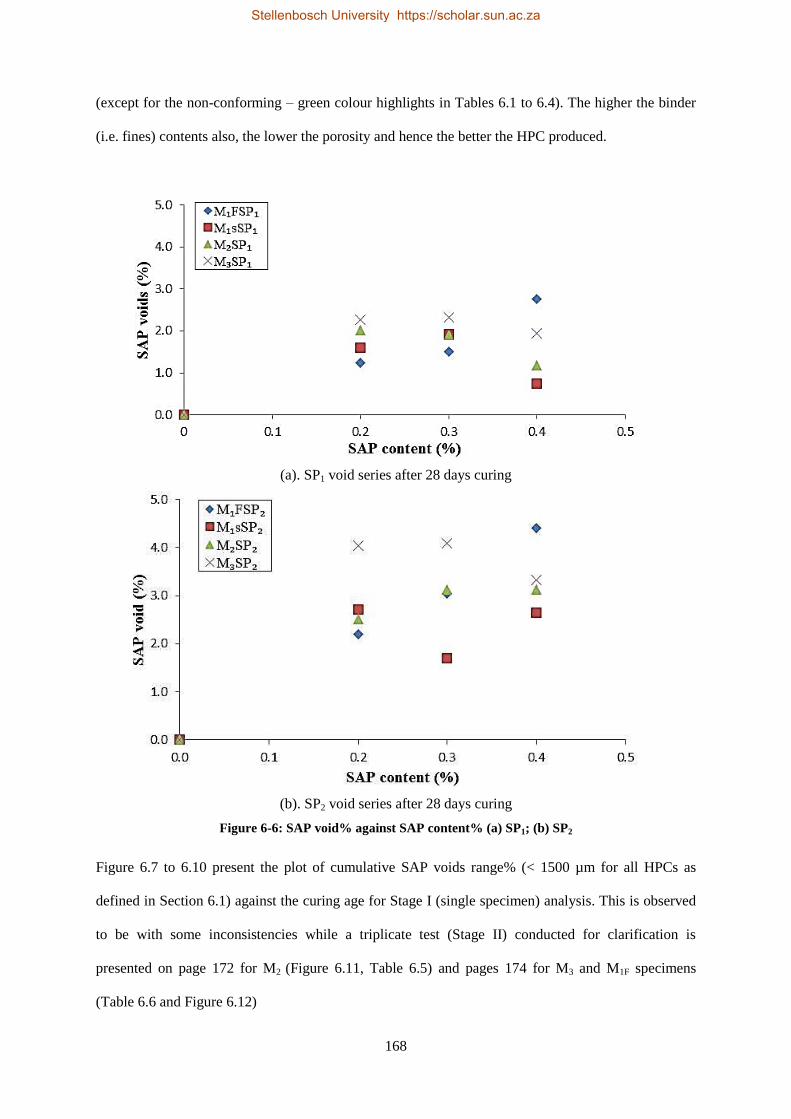
168
(except for the non-conforming – green colour highlights in Tables 6.1 to 6.4). The higher the binder
(i.e. fines) contents also, the lower the porosity and hence the better the HPC produced.
(a). SP1 void series after 28 days curing
(b). SP2 void series after 28 days curing
Figure 6-6: SAP void% against SAP content% (a) SP1; (b) SP2
Figure 6.7 to 6.10 present the plot of cumulative SAP voids range% (< 1500 µm for all HPCs as
defined in Section 6.1) against the curing age for Stage I (single specimen) analysis. This is observed
to be with some inconsistencies while a triplicate test (Stage II) conducted for clarification is
presented on page 172 for M2 (Figure 6.11, Table 6.5) and pages 174 for M3 and M1F specimens
(Table 6.6 and Figure 6.12)
Stellenbosch University https://scholar.sun.ac.za

169
(a) (b) Figure 6-7: Cumulative SAP voids range vs curing age for M1F – HPC (a) SP1; (b) SP2
(a) (b) Figure 6-8: Cumulative SAP voids range vs curing age for M1S – HPC (a) SP1; (b) SP2
(a) (b) Figure 6-9: Cumulative SAP voids range vs curing age for M2 – HPC (a) SP1; (b) SP2
(a) (b) Figure 6-10: Cumulative SAP voids range vs curing age for M3 – HPC (a) SP1; (b) SP2
Stellenbosch University https://scholar.sun.ac.za

170
This gives an indication that although a general decrease in cumulative SAP voids range% as the
curing age increase occurs; there are inconsistencies in the trends of results for this Stage I analysis.
While some specimens show decrease in cumulative SAP voids range%, others exhibit sudden value
jump between the 28 and 56 days of curing. It was however observed that in about 50% of the
specimens, the cumulative SAP range voids% after 56 and 90 days curing had similar values. This is
because there is not significant cement hydration increase between these two ages.
The Stage II (triplicate specimen) analysis conducted to verify the reason for variation in the results
reported in stage I further affirms that SAP voids and total voids percentages increase as the SAP size
and contents increases (Table 6.5 for M2 – HPC mixtures). Figure 6.11 further shows a plot of the
cumulative SAP voids range% against the curing age for Stage II analysis of the M2 – HPC mixture.
The use of triplicate HPC specimen however reveals no variation in the trend of the progressive
increase of SAP voids and total porosity in the HPC as the SAP size and contents increase. The
cumulative SAP range void% (i.e. < 1500 µm as defined in Section 6.1) clearly decreases as curing
age increases with no ambiguity using the triplicate samples (Figure 6.11).
Table 6-5: Summary of void distribution in triplicate HPC - M2 with both SAP types
Curing Age Influence Ref SAP1 SAP2
M2-7 days series M2 M2SP1-0.2 M2SP1-0.3 M2SP1-0.4 M2SP2-0.2 M2SP2-0.3 M2SP2-0.4
SAP pore expected 0 3.4 5.01 6.56 3.4 5.01 6.56
No of voids ˃1500 µm 25 25 25 25 29 36 46
SAP voids% 0.00 0.95 1.16 1.30 1.00 1.71 1.91
Total Porosity% 0.81 1.42 1.68 1.84 1.27 2.04 2.32
Small voids% 0.58 1.19 1.42 1.60 1.00 1.71 1.91
Max. void size (mm3) 23.716 35.789 17.927 34.185 21.598 34.045 50.996
Av. void diameter (mm) 0.658 0.501 0.470 0.457 0.616 0.570 0.594
M2-28 days series M2 M2SP1-0.2 M2SP1-0.3 M2SP1-0.4 M2SP2-0.2 M2SP2-0.3 M2SP2-0.4
No of voids ˃1500 µm 18 16 23 22 14 36 30
SAP voids% 0.00 0.60 1.02 1.20 0.90 1.19 1.46
Total Porosity% 0.72 0.94 1.47 1.74 1.04 1.53 1.74
Small voids% 0.55 0.79 1.25 1.52 0.90 1.19 1.46
Max. void size (mm3) 25.260 42.208 56.197 60.147 21.837 38.206 18.764
Av. void diameter (mm) 0.542 0.525 0.429 0.464 0.549 0.576 0.550
+Expected pore content by volume based on the 25 g/g pore absorption used for provision of additional water calculated taking the swollen SAP as a spherical substance. ++
Porosity calculated volumetrically using Demoulded density in comparison to designed density.
Stellenbosch University https://scholar.sun.ac.za

171
(a) (b)
Figure 6-11: Cumulative SAP voids range vs curing age for triplicate M2 – HPCs (a) SP1; (b) SP2
The maximum void sizes were also observed to be within similar value range (20 – 60 mm3) for both
SAP sizes (Table 6.5 for M2 – HPC mixtures).The total air void% in the mixtures and average void
volumes were noted to be lower than the earlier values obtained for single specimen analyses. The
longer time of vibration (10 minutes) of the HPCs as against the 5 minutes used for Stage I during
concrete casting can therefore be seen to result in better compaction and reduction of trapped air voids
within the concrete. The number of large voids (> 1500 µm) is observed to be of a uniform range (25
for reference and SP1 mixtures and 29 – 46 for SP2) at 7 days of hydration and at 28 days of hydration
(15 – 30 for both SAP sizes) for M2 – HPC mixtures. The average pore diameter determined (taking
the voids as sphere) were seen to be more uniform for both SAP sizes and at both hydration periods
(0.5 to 0.6 mm) in the triplicate specimen analyses. The number of large voids, SAP porosity and
total porosity decreased as the curing age increases for both SAP types in triplicate specimen analysis
of M2 – HPC mixtures.
Results for the triplicate specimen of M1F and M3 examined for only SAP Type 1(SP1) are presented in
Table 6.6 and Figure 6.12 and properly discussed with M2 triplicate specimens for SP1 in Section 6.1.2
to study influence of W/B, binder type and curing age on air voids distribution of HPCs.
6.1.2 Influence of W/B, Binder Type and Curing on Air Void Distribution
Tables 6.1 to 6.4 present a summary of results on influence of curing age, W/B and binder type on air
void distribution for single specimen (Stage I) analyses of the various HPC mixtures examined in this
Stellenbosch University https://scholar.sun.ac.za
172
study while Table 6.6 presents results summary for triplicate specimen (Stage II) for same using SP1.
Graphical presentation of influence of W/B, binder type and curing age on the cumulative SAP voids
range (< 1500 µm) for the respective HPC mixtures is also shown in Figures 6.7 to 6.12.
The result in Figures 6.7 and 6.8 reveal that for single specimen in the ternary cements HPCs (M1F
and M1S, W/B = 0.2 reference mixtures) the cumulative SAP voids range% decreased as the hydration
period increased with some inconsistencies too. The SAP voids were observed to increase as the SAP
size and contents increases at all the respective hydration periods for both HPC mixtures. The number
of air voids larger than 1500 µm (diameter) gave consistent range of value, 30 – 70 with some few
inconsistencies (pink colour highlights in the Tables 6.1 to 6.4) while the maximum void sizes were
also observed to be in a similar range, 20 – 70 mm3 but for two extremes - 11 mm
3 and 121 mm
3 (blue
colour highlights in Tables 6.1 to 6.4). The pattern of the cumulative SAP voids range% present in the
respective HPC (Figures 6.7 – 6.10) also gave similar trends with deviation observed in some
specimens (e.g. M1FSP20.3-56D in Figure 6.7 (d); M1SSP10.4-56D and M1SSP20.4 -56D in Figure 6.8
(c & d)). Effect of large air voids (˃ 1500 µm) was also seen to be glaring in the total void calculated
for these samples. The HPC with CS as SCM (M1S) was observed to exhibit the lowest number of
large air voids present for all hydration periods.
A similar trend is observed for the binary cements HPC (M2 and M3, W/B = 0.25 and 0.3 reference
mixtures) as presented in Figures 6.9 and 6.10 but with large numbers of void sizes above 1500 µm
(i.e. large air voids) and great variation in the value of maximum void size present in these HPC
mixtures (pink and blue colour highlights of Tables 6.3 and 6.4). Volumes of void above 70 mm3
were observed to be more in these HPC samples at hydration period of 28 days, while some reference
mixes also contain very large air void such as 122 mm3
in volume (M2 -28D in Table 6.5). The
numbers of large voids were consistently very high (80 – 200) in the M3 mixtures.
The Stage II analysis using triplicate specimen with SP1 is as presented in Table 6.6 showing summary
of influence of curing age and W/B on air void distribution for three HPC mixtures (M1F, M2 and M3),
while the influence of curing age and SAP sizes for M2-HPC mixtures is as earlier presented in
Table 6.5.
Stellenbosch University https://scholar.sun.ac.za

173
Table 6-6: Summary of curing age influence and W/B on void distribution using triplicate specimens
Curing Age Influence 7 Days 28 Days
M1F-Series M1F M1FSP1-0.2 M1FSP1-0.3 M1FSP1-0.4 M1F M1FSP1-0.2 M1FSP1-0.3 M1FSP1-0.4
No of voids ˃1500 µm 32 26 30 23 16 39 31 32
SAP voids% 0.00 1.08 1.43 1.54 0.00 0.68 0.85 1.07
Total Porosity% 1.39 1.58 2.09 2.10 1.20 1.40 1.41 1.68
Total small voids% 1.09 1.33 1.80 1.88 1.06 1.03 1.12 1.38
Max. void size (mm3) 75.487 31.194 55.396 27.652 26.329 42.09 29.902 35.399
Av. void diameter (mm) 0.525 0.388 0.460 0.424 0.394 0.633 0.515 0.501
M2-Series M2 M2SP1-0.2 M2SP1-0.3 M2SP1-0.4 M2 M2SP2-0.2 M2SP2-0.3 M2SP2-0.4
No of voids ˃1500 µm 25 25 25 25 18 16 23 22
SAP voids% 0.00 0.95 1.16 1.30 0.00 0.60 1.02 1.20
Total Porosity% 0.81 1.42 1.68 1.84 0.72 0.94 1.47 1.74
Total small voids% 0.58 1.19 1.42 1.60 0.55 0.79 1.25 1.52
Max. void size (mm3) 23.716 35.789 17.927 34.185 25.260 42.208 56.197 60.147
Av. void diameter (mm) 0.658 0.501 0.470 0.457 0.542 0.525 0.429 0.464
M3-Series M3 M3SP1-0.2 M3SP1-0.3 M3SP1-0.4 M3 M3SP1-0.2 M3SP1-0.3 M3SP1-0.4
No of voids ˃1500 µm 36 35 26 21 18 12 27 26
SAP voids% 0.00 0.82 0.85 1.03 0.00 0.66 0.72 0.79
Total Porosity% 1.67 1.61 1.48 1.53 0.84 0.99 1.28 1.38
Total small voids% 1.34 1.28 1.23 1.34 0.67 0.88 1.02 1.14
Max. void size (mm3) 61.863 18.602 29.805 57.332 21.941 22.042 55.997 32.302
Av. void diameter (mm) 0.451 0.528 0.502 0.494 0.544 0.510 0.608 0.536
Figures 6.12 further shows a plot of cumulative SAP voids range% (i.e. all voids below 1500 µm
diameter size as defined in Section 6.1 above) against the curing ages examined (7 and 28 days) for
the triplicate samples of M3 and M1F HPC series.
(c) (d)
Figure 6-12: Cumulative SAP voids range vs curing age (triplicates specimen) for (a) M3 (b) M1F
The result shows that in the triplicate specimens’ analyses, the SAP voids% and total voids%
increases as the SAP contents increases while cumulative SAP voids range% decreased as the curing
age increases for all the HPC mixtures studied. The reference HPC with 0.25 W/B (M2 – binary
Stellenbosch University https://scholar.sun.ac.za

174
cement binder) has the lowest porosity values followed by M1F – ternary cement (0.2 W/B with FA as
admixture), while M3 – binary cement (0.3 W/B) has the highest porosity value.
The maximum void size in the triplicate specimen analyses were seen to be in a similar range (20 – 75
mm3) for the HPC mixtures studied with only one variation observed in M3. The average pore size
(0.40 – 0.65 mm, in diameter) determined taking the void volumes as spheres was consistent for all
HPC mixtures studied. There were no excessively large voids present nor were there variations in the
number of large voids (i.e. > 1500 µm) for the three HPC mixtures examined.
6.1.3 Inferences
The following can therefore be inferred from the CT Scanning analysis
i. An increase in SAP content and also the W/B of the HPCs lead to increase in SAP voids
(< 900 um (SP1); < 1500 um (SP2) as defined in Section 6.1) and the total air voids.
ii. The porosity created by SAP in the HPC was generally about half the calculated value
using the 25 g/g SAP absorption capacity determined via the tea-bag test. An indication
that the initial SAP created voids in fresh concrete reduces in size and hence volume with
increased concrete age as cement hydration products occupied the air spaces created by
the swollen SAP. It follows that maintaining the water added to the mixing water for SAP
absorption in concrete mixtures at 12.5 g/g (i.e. half the 25 g/g used in this study), a
similar value to that suggested in previous studies (12.5 g/g by Hasholt et al., 2012 and
Lura et al., 2006; and 13.8 ml/g by Esteves, 2014), will reduce occurrence of SAP created
air voids in these HPCs and hence avert the strength reduction effect of SAP addition
observed.
iii. The cumulative SAP voids range% and total air voids% decreased as the hydration period
increased while SAP voids increased as the SAP size and contents increased for all the
curing ages.
Stellenbosch University https://scholar.sun.ac.za
175
iv. There exists large air voids greater than SAP voids in all the HPCs (especially the single
specimen) analysis, an indication that proper vibration is important in concrete especially
HPC to avert presence of excessively large air voids.
v. The presence of CS as SCM (M1S) in HPC resulted in a lower number of large air voids
present for all hydration periods. This implies that CS enhances a better dispersion of the
CEM I 52.5 N and hence proper compaction of the concrete than the FA in the ternary
cements HPCs.
vi. Porosity value amongst reference HPC mixtures were in the following order; lowest being
M2 binary cement HPC, followed by M1F ternary cement HPC and the highest porosity
being in M3 binary cement HPC. This shows that aside from W/B increase, the binder
type also has an influence on the porosity of HPC.
It can be concluded that though SAP addition increases the air voids content in HPC, the
influence will be minimal when the additional water for SAP absorption is maintained within
12.5g/g (i.e. half the 25g/g obtained in the teabag test).
6.2 Scanning Electron Microscopy of HPC
This section presents the micro-morphology and crystalline structure of the solid phases of the
products of hydration in the various HPC mixtures with a bid to study the effect of SAP (sizes and
contents). The study examines the HPC samples after the 90 days hydration period.
6.2.1 Micro-morphology and crystaline structure
A typical scanning electron microscopy (SEM) image of HPC is as presented in Figure 6.13 showing
the general morphology and crystalline structure of the internal surface of the HPC. The grey scale is
normally used to identify and analyse individual items for definite assessment of the chemical
composition. As shown in the SEM image taken at 50 X magnification, the item labelled number 1
represents the coarse aggregate which is dark grey in colour, large, of irregular shape and often has
small number of almost black spots within. It is observed to be dominantly quartz as the quantitative
Stellenbosch University https://scholar.sun.ac.za
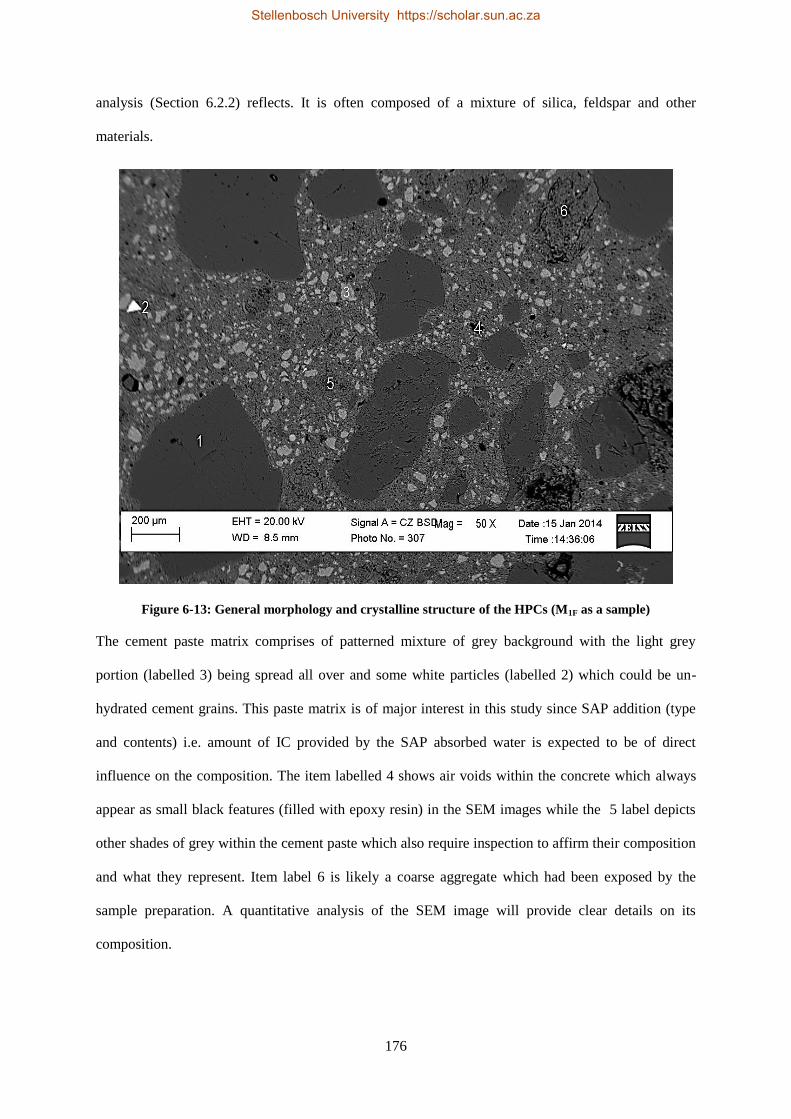
176
analysis (Section 6.2.2) reflects. It is often composed of a mixture of silica, feldspar and other
materials.
Figure 6-13: General morphology and crystalline structure of the HPCs (M1F as a sample)
The cement paste matrix comprises of patterned mixture of grey background with the light grey
portion (labelled 3) being spread all over and some white particles (labelled 2) which could be un-
hydrated cement grains. This paste matrix is of major interest in this study since SAP addition (type
and contents) i.e. amount of IC provided by the SAP absorbed water is expected to be of direct
influence on the composition. The item labelled 4 shows air voids within the concrete which always
appear as small black features (filled with epoxy resin) in the SEM images while the 5 label depicts
other shades of grey within the cement paste which also require inspection to affirm their composition
and what they represent. Item label 6 is likely a coarse aggregate which had been exposed by the
sample preparation. A quantitative analysis of the SEM image will provide clear details on its
composition.
Stellenbosch University https://scholar.sun.ac.za

177
Three sets of HPC mixtures (M1F, M2 and M3) with the respective SAP contents (0.0%, 0.2%, 0.3%
and 0.4%) were examined individually by SEM as explained in Section 3.2.5 while the quantitative
analysis of their paste portion enhances an understanding of SAP influence on the products of
hydration after 90 days of curing.
6.2.2 Quantitative Analysis of HPCs and cement pastes
A typical SEM image analysis of the HPC as presented in Figure 6.13 classify into six different
objects as mentioned in Section 6.2.1. Each component was examined using spot analysis and
spectrum obtained analysed quantitatively using the INCA software. The quantitative analysis for the
various identified phases as shown in Figure 6.13 for M1F – HPC reference mixture is presented in
Table 6.7
Table 6-7: Quantitative Analysis of Typical concrete Polished Section (M1F as Sample)
Spectrum*
Binder Type 2 (0.2 W/B) HPC
1 2 3 4 5 6
Mg 0.00 0.00 0.95 0.00 0.95 0.50 Al 0.00 0.00 2.47 0.00 7.04 5.22 Si 46.74 0.33 41.92 46.74 37.77 40.59 Ti 0.00 0.00 0.47 0.00 0.51 0.28 Mn 0.00 0.41 0.00 0.00 0.00 0.00 Fe 0.00 76.77 2.56 0.00 2.70 1.57 Zn 0.00 0.00 0.00 0.00 0.00 0.00 O 53.26 22.49 51.63 53.26 51.03 51.85
Total 100.00 100.00 100.00 100.00 100.00 100.00
Oxide Composition in Weight%
MgO 0.00 0.00 1.57 0.00 1.58 0.82 Al2O3 0.00 0.00 4.66 0.00 13.31 9.86 SiO2 100.00 0.71 89.68 100.00 80.80 86.83 TiO2 0.00 0.00 0.79 0.00 0.84 0.47 MnO 0.00 0.52 0.00 0.00 0.00 0.00 FeO 0.00 98.77 3.30 0.00 3.47 2.02 ZnO 0.00 0.00 0.00 0.00 0.00 0.00
Total 100.00 100.00 100.00 100.00 100.00 100.00
*The Spectrum numbers in the Table represents the items labelling in the SEM image as presented in Figure 6.13.
Column 1 (yellow colour highlight of Table 6.7) is the coarse aggregate spectrum quantitative
analysis of the M1F – HPC polished surface.
Stellenbosch University https://scholar.sun.ac.za

178
Coarse Aggregates (Spectrum 1)
Figure 6.14 shows the spectrum obtained in the object number 1 (coarse aggregates) in all the HPC
mixtures while Table 6.8 shows the quantitative analysis of spectrum 1 in the M1F – HPCs for various
SAP contents.
Figure 6-14: Spectrum of Quantitative Analysis for Coarse Aggregates in M1F – HPC
The scale shown under the Spectrum image as obtained in the image is not of any particular
importance as the INCA software generates the exact quantitate values for the respective elements or
oxide as imputed. The peaks of the Spectrum image are used for identifying the specific element
present in the specimen being analysed.
The results show that the coarse aggregates as examined in this study for M1F with or without SAP is
100% silica (SiO2) as an oxide compound, individual element weight% composition by each
constituent gave 47% silicon and 53% oxygen (Table 6.7). Similar composition is observed for the
item labelled 6 with an indication of little iron (Fe = 1.57%), aluminium (Al = 5.22%) and magnesium
(Mg = 0.5%) content - implying a mixture of silica, feldspar and other materials.
Stellenbosch University https://scholar.sun.ac.za
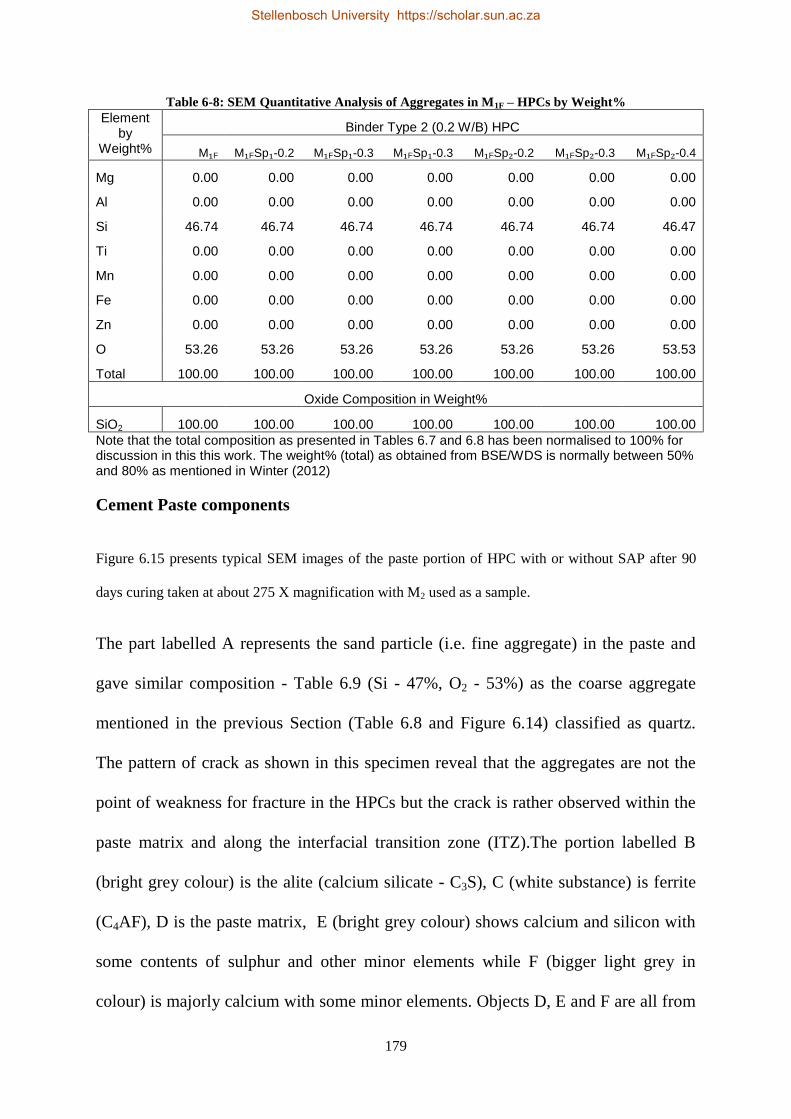
179
Table 6-8: SEM Quantitative Analysis of Aggregates in M1F – HPCs by Weight%
Element by
Weight%
Binder Type 2 (0.2 W/B) HPC
M₁F M₁FSp₁-0.2 M₁FSp₁-0.3 M₁FSp₁-0.3 M₁FSp₂-0.2 M₁FSp₂-0.3 M₁FSp₂-0.4
Mg 0.00 0.00 0.00 0.00 0.00 0.00 0.00
Al 0.00 0.00 0.00 0.00 0.00 0.00 0.00
Si 46.74 46.74 46.74 46.74 46.74 46.74 46.47
Ti 0.00 0.00 0.00 0.00 0.00 0.00 0.00
Mn 0.00 0.00 0.00 0.00 0.00 0.00 0.00
Fe 0.00 0.00 0.00 0.00 0.00 0.00 0.00
Zn 0.00 0.00 0.00 0.00 0.00 0.00 0.00
O 53.26 53.26 53.26 53.26 53.26 53.26 53.53
Total 100.00 100.00 100.00 100.00 100.00 100.00 100.00
Oxide Composition in Weight%
SiO2 100.00 100.00 100.00 100.00 100.00 100.00 100.00
Note that the total composition as presented in Tables 6.7 and 6.8 has been normalised to 100% for discussion in this this work. The weight% (total) as obtained from BSE/WDS is normally between 50% and 80% as mentioned in Winter (2012)
Cement Paste components
Figure 6.15 presents typical SEM images of the paste portion of HPC with or without SAP after 90
days curing taken at about 275 X magnification with M2 used as a sample.
The part labelled A represents the sand particle (i.e. fine aggregate) in the paste and
gave similar composition - Table 6.9 (Si - 47%, O2 - 53%) as the coarse aggregate
mentioned in the previous Section (Table 6.8 and Figure 6.14) classified as quartz.
The pattern of crack as shown in this specimen reveal that the aggregates are not the
point of weakness for fracture in the HPCs but the crack is rather observed within the
paste matrix and along the interfacial transition zone (ITZ).The portion labelled B
(bright grey colour) is the alite (calcium silicate - C3S), C (white substance) is ferrite
(C4AF), D is the paste matrix, E (bright grey colour) shows calcium and silicon with
some contents of sulphur and other minor elements while F (bigger light grey in
colour) is majorly calcium with some minor elements. Objects D, E and F are all from
Stellenbosch University https://scholar.sun.ac.za
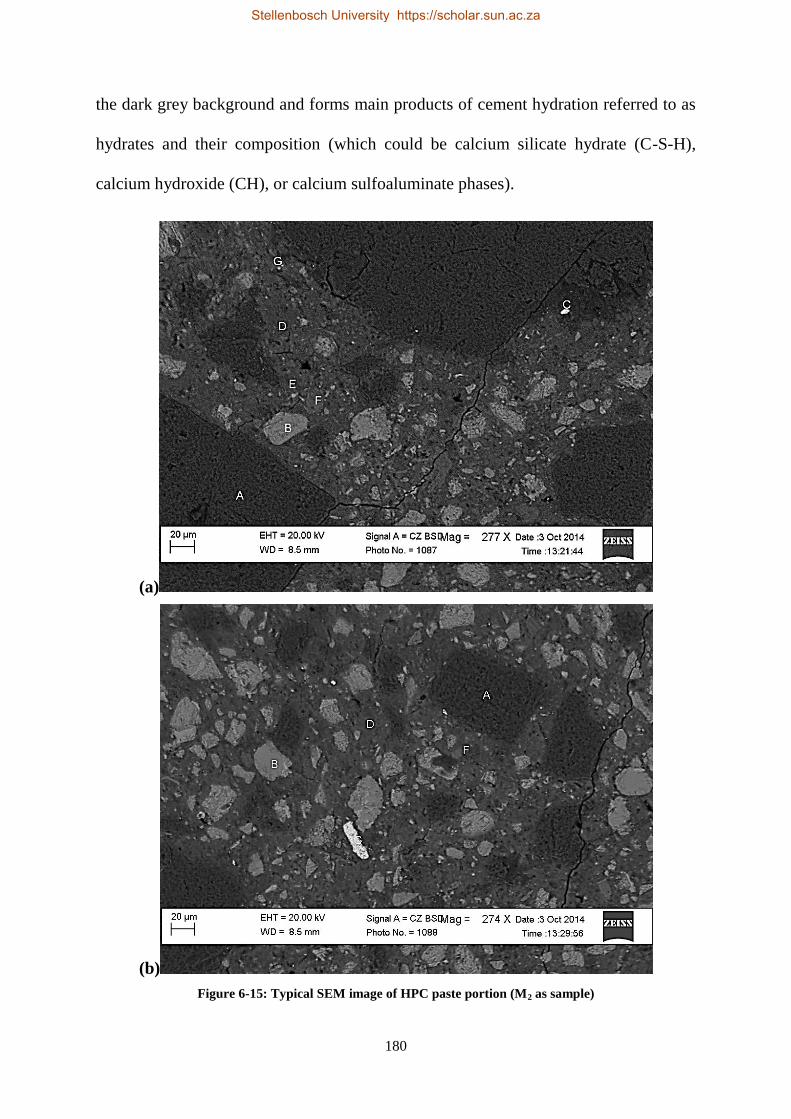
180
the dark grey background and forms main products of cement hydration referred to as
hydrates and their composition (which could be calcium silicate hydrate (C-S-H),
calcium hydroxide (CH), or calcium sulfoaluminate phases).
(a)
(b)
Figure 6-15: Typical SEM image of HPC paste portion (M2 as sample)
Stellenbosch University https://scholar.sun.ac.za

181
There composition is expected to be influenced by the binder type, W/B and the extent of curing
provided (both internal - from SAP and external – from immersion in water). SAP type and content
are the parameters of concern for curing variation in this study since all the HPCs are cured immersed
in water.
Table 6-9: Quantitative Analysis of a Typical M2 – HPC SEM Image by Element Weight%
Spectrum* A B C D E F G
Mg 0.00 0.00 0.00 0.79 0.31 0.42 0.78
Al 0.00 0.84 0.30 3.42 0.97 0.00 7.33
Si 46.74 14.40 1.12 15.29 10.58 1.24 7.92
S 0.00 0.00 0.00 1.58 0.00 0.00 0.00
K 0.00 0.53 0.00 0.29 0.00 0.00 0.24
Ca 0.00 46.94 2.56 37.44 10.38 68.67 31.96
Ti 0.00 0.00 0.00 0.00 0.00 0.00 0.00
Cr 0.00 0.00 0.19 0.00 0.00 0.00 0.00
Mn 0.00 0.00 0.34 0.00 0.38 0.00 0.00
Fe 0.00 1.00 72.09 2.22 46.64 0.44 15.12
Mo 0.00 0.00 0.00 0.00 0.00 0.00 1.60
O 53.26 36.28 23.40 38.98 30.74 29.23 34.42
Total 100.00 100.00 100.00 100.00 100.00 100.00 100.00
*Spectrum labelling in the Table represents the item labelling in SEM image of Figure 6.13
The results in Table 6.9 show these different portions of the cement hydration products in M2 having
compositions mainly of calcium (Ca), silicon (Si), aluminium (Al), iron (Fe) and oxygen (O2) with
others minor elements such as magnesium (Mg), potassium (K), sulphur (S), titanium (Ti) and
manganese (Mn).
The G label in Figure 6.15(a) shows tiny spots of bright grey colour within the cement paste which is
clearly a different composition from the B (also of similar bright grey colour). Although the
quantitative analysis shows G comprise of calcium and silicon as found in B, there is a considerable
content of iron (Fe), aluminium (Al) and magnesium. The variation in the grey scale of objects in the
HPCs becomes wider as the SAP contents, binder type and W/B changes (Appendix C).
Beyond using the grey scale for physical identification, is the need to access influence of the
additives, admixtures and the change in W/B. Neville (2012) observed that the products of cement
hydration may be influenced by compounds interactions and that the amount of water available in the
Stellenbosch University https://scholar.sun.ac.za
182
concrete could be a determinant for which of the calcium silicates (C3S and C2S) results ultimately in
the hydrate. Possibility of having several distinct calcium silicate hydrates (C-H-S) is further stressed
by Neville (2012) and that if lime is absorbed or held in the solid particles the calcium / silica (C: S)
ratio would be affected, and a strong evidence of this results in C2S giving lime/silica ratio of 1.65
(Neville, 2012). Examination of the C: S ratio is specified as a way of distinguishing the calcium
silicates with different test methods reported to yield diverse results for C: S ratio having a variation
as wide as 1.5 to 2.0 while Electro-optical measurements (e.g. SEM) are known to yield low values of
C: S ratio (Neville, 2012). A proper presentation of these results will serve well in understanding SAP
influence on strength development of concrete especially the HPC.
The C-S-H which is referred to as the main hydrates nowadays is believed to have a C: S ratio of a
rounded up value of 2 based on the mole ratio of water to silica taken to be a whole number (Neville,
2012). The work of Winter (2012) presents these results in atomic ratio plots using a minimum of
about thirty analysis of an individual phase or spectrum for proper phase classification as other
elements could have been packed together with the main phases during x-ray excitation and
normalisation of results. The quantitative analysis of the SEM images and atomic ratio plot for Al/Ca
vs. Si/Ca should show a C-S-H cluster in range of (0.04 - 0.08, 0.045 - 0.055) as control with some
CH near the origin (Winter, 2012). Winter (2012) states also the S/Ca vs. Al/Ca plots as means of
affirming the nature of the sulfoaluminate phases. This study thus adopts the use of the atomic ratios
for an indication of the phases observed in the SEM analysis though time and schedule of the machine
could not allow thirty repetitive analyses of individual phases; a plot of all the atomic ratios for the
spectrum taken from phases of similar grey scale appearances in the reference HPCs mixtures with or
without SAP is hereby adopted for phase identification and discussion.
6.2.3 Cement Hydration Products
Three HPCs (M1F, M2 and M3) were examined after 90 days of curing and the results are discussed in
the following sections.
Stellenbosch University https://scholar.sun.ac.za
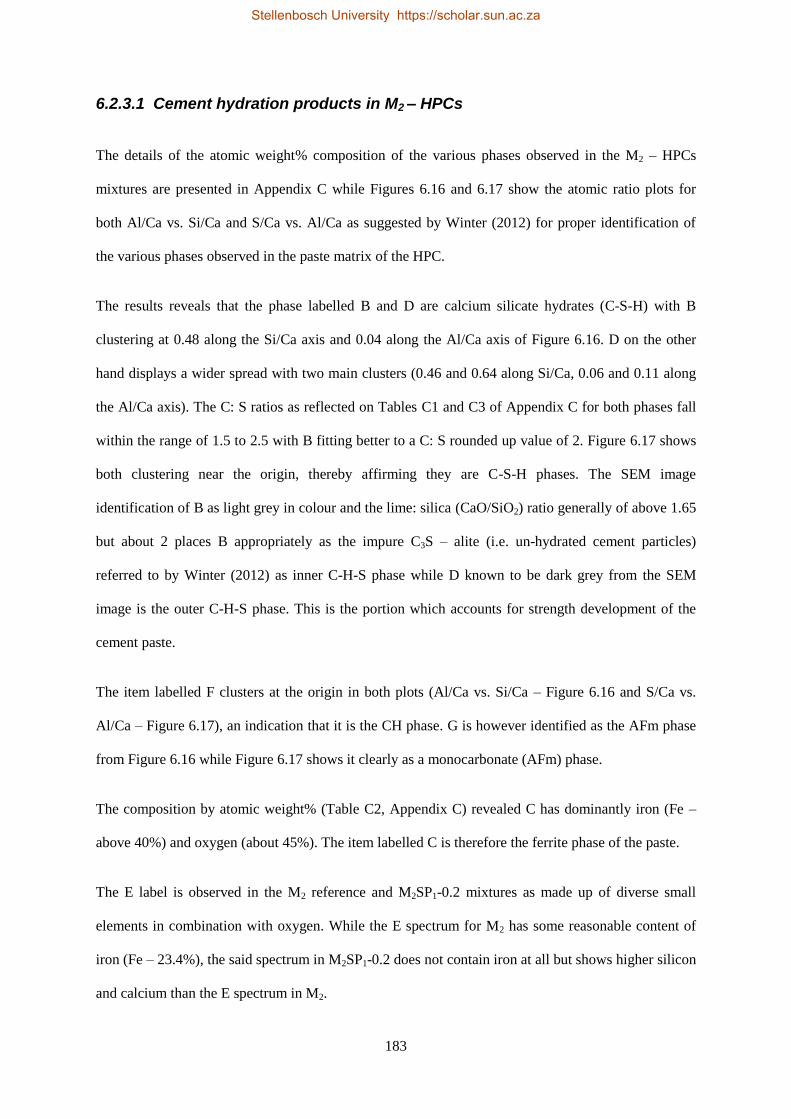
183
6.2.3.1 Cement hydration products in M2 – HPCs
The details of the atomic weight% composition of the various phases observed in the M2 – HPCs
mixtures are presented in Appendix C while Figures 6.16 and 6.17 show the atomic ratio plots for
both Al/Ca vs. Si/Ca and S/Ca vs. Al/Ca as suggested by Winter (2012) for proper identification of
the various phases observed in the paste matrix of the HPC.
The results reveals that the phase labelled B and D are calcium silicate hydrates (C-S-H) with B
clustering at 0.48 along the Si/Ca axis and 0.04 along the Al/Ca axis of Figure 6.16. D on the other
hand displays a wider spread with two main clusters (0.46 and 0.64 along Si/Ca, 0.06 and 0.11 along
the Al/Ca axis). The C: S ratios as reflected on Tables C1 and C3 of Appendix C for both phases fall
within the range of 1.5 to 2.5 with B fitting better to a C: S rounded up value of 2. Figure 6.17 shows
both clustering near the origin, thereby affirming they are C-S-H phases. The SEM image
identification of B as light grey in colour and the lime: silica (CaO/SiO2) ratio generally of above 1.65
but about 2 places B appropriately as the impure C3S – alite (i.e. un-hydrated cement particles)
referred to by Winter (2012) as inner C-H-S phase while D known to be dark grey from the SEM
image is the outer C-H-S phase. This is the portion which accounts for strength development of the
cement paste.
The item labelled F clusters at the origin in both plots (Al/Ca vs. Si/Ca – Figure 6.16 and S/Ca vs.
Al/Ca – Figure 6.17), an indication that it is the CH phase. G is however identified as the AFm phase
from Figure 6.16 while Figure 6.17 shows it clearly as a monocarbonate (AFm) phase.
The composition by atomic weight% (Table C2, Appendix C) revealed C has dominantly iron (Fe –
above 40%) and oxygen (about 45%). The item labelled C is therefore the ferrite phase of the paste.
The E label is observed in the M2 reference and M2SP1-0.2 mixtures as made up of diverse small
elements in combination with oxygen. While the E spectrum for M2 has some reasonable content of
iron (Fe – 23.4%), the said spectrum in M2SP1-0.2 does not contain iron at all but shows higher silicon
and calcium than the E spectrum in M2.
Stellenbosch University https://scholar.sun.ac.za

184
Figure 6-16: Atomic ratio plot (Si/Ca vs Al/Ca) for M2 - HPC
Figure 6-17: Atomic ratio plot (S/Ca vs Al/Ca) for M2 - HPC
Other phases containing different minor elements such as lead (Pb), titanium (Ti), manganese (Mn),
molybdenum (Mo) were noted in the SEM analysis of the HPCs as SAP contents increase. They are
thereby presented only in their oxides form (Table C5 of Appendix C) and are perceived to possibly
be products emanating from interaction of the SAP compounds and that of binders. Similar
observations were recorded for M1F and M3. The Calcium silicate phases in the three HPC mixtures
studied are thereby compared for a discussion on SAP, W/B or binder type influence on the cement
hydration in the HPCs.
Stellenbosch University https://scholar.sun.ac.za

185
6.2.3.2 SAP, W/B and Binder Type Influence on Cement hydration
Tables 6.10 and 6.11 present summary results of the quantitative analysis of the calcium silicates
phases (Spectrum B and D) for the three HPCs (M2, M3 and M1F) studied after 90 days curing in this
work, while detailed results are shown in Appendix C (Tables C7 to C10). Results of some specimens
(as observed in Tables 6.10) were however lost in the process of data gathering of the study.
Table 6-10: Summary of Quantitative Analysis of Spectrum B
HPC Type Spectrum B Ref SP₁-0.2 SP₁-0.3 SP₁-0.4 SP₂-0.2 SP₂-0.3 SP₂-0.4
M₂ - Series
0.25 W/B
Binary cement
Si/Ca 0.467 0.425 0.490 0.476 0.491 0.476 0.415
Al/Ca 0.025 0.020 0.026 0.013 0.034 0.058 0.025
S/Ca 0.000 0.002 0.005 0.000 0.000 0.000 0.000
C: S 2.14 2.35 2.04 2.10 2.04 2.10 2.41
CaO/SiO₂ 1.67 1.66 1.69 2.03 1.09 1.21 1.36
M3 – Series
0.3 W/B
Binary cement
Si/Ca 0.342 0.498 0.336 0.486
Al/Ca 0.023 0.016
0.017
0.010
S/Ca 0.001 0.005
0.000
0.000
C: S 2.92 2.01
2.98
2.06
CaO/SiO₂ 2.50 1.88 2.78 1.76
M₁F – Series
0.2 W/B
Ternary cement
Si/Ca 0.471 0.491 0.391 0.338 0.346
0.491
Al/Ca 0.028 0.027 0.025 0.020 0.019
0.032
S/Ca 0.005 0.004 0.002 0.000 0.000
0.004
C: S 2.12 2.04 2.55 2.96 2.89
2.03
CaO/SiO₂ 1.98 1.90 2.39 2.76 2.72 1.90
Table 6-11: Summary of Quantitative Analysis of Spectrum D
HPC Type Spectrum D Ref SP₁-0.2 SP₁-0.3 SP₁-0.4 SP₂-0.2 SP₂-0.3 SP₂-0.4
M₂ - Series
0.25 W/B
Binary cement
Si/Ca 0.590 0.636 0.459 0.448 0.677 0.751 0.700
Al/Ca 0.114 0.107 0.071 0.060 0.117 0.099 0.136
S/Ca 0.047 0.053 0.044 0.000 0.000 0.030 0.000
C: S 1.69 1.57 2.18 2.23 1.48 1.33 1.43
CaO/SiO₂ 1.58 1.47 2.02 2.08 1.38 1.24 1.33
M3 - Series
0.3 W/B
Binary cement
Si/Ca 0.606 0.526 0.530 0.587
Al/Ca 0.097 0.075
0.088
0.131
S/Ca 0.031 0.036
0.028
0.040
C: S 1.65 1.90
1.89
1.70
CaO/SiO₂ 1.59 1.77 1.76 1.59
M₁F - Series
0.2 W/B
Ternary cement
Si/Ca 0.674 0.784 0.731 0.959 0.650
0.588
Al/Ca 0.138 0.244 0.120 0.158 0.160
0.065
S/Ca 0.033 0.029 0.022 0.048 0.039
0.039
C: S 1.48 1.28 1.37 1.04 1.54
1.70
CaO/SiO₂ 1.38 1.19 1.23 0.97 1.42 1.59
The results (Tables 6.10 and 6.11) revealed that the C: S ratio in Spectrum B generally remained
within the range 1.5 to 2.5 and a rounded value of 2 with few inconsistencies (as shown in red colour)
Stellenbosch University https://scholar.sun.ac.za
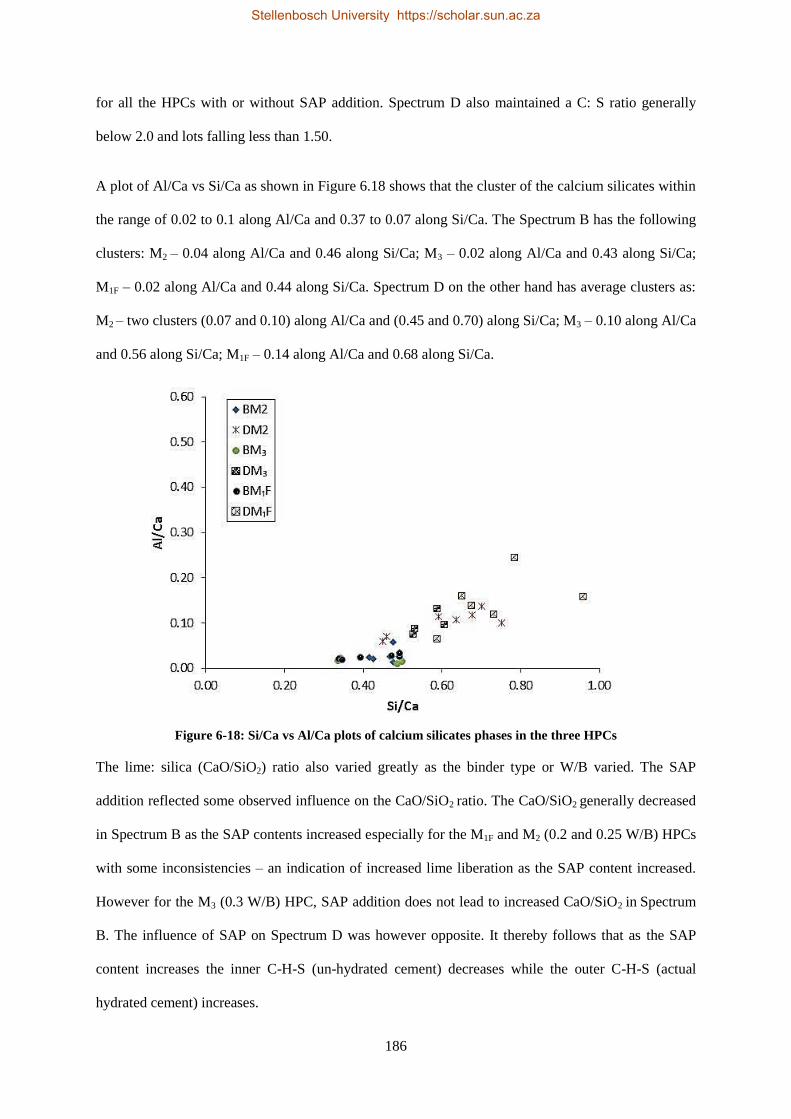
186
for all the HPCs with or without SAP addition. Spectrum D also maintained a C: S ratio generally
below 2.0 and lots falling less than 1.50.
A plot of Al/Ca vs Si/Ca as shown in Figure 6.18 shows that the cluster of the calcium silicates within
the range of 0.02 to 0.1 along Al/Ca and 0.37 to 0.07 along Si/Ca. The Spectrum B has the following
clusters: M2 – 0.04 along Al/Ca and 0.46 along Si/Ca; M3 – 0.02 along Al/Ca and 0.43 along Si/Ca;
M1F – 0.02 along Al/Ca and 0.44 along Si/Ca. Spectrum D on the other hand has average clusters as:
M2 – two clusters (0.07 and 0.10) along Al/Ca and (0.45 and 0.70) along Si/Ca; M3 – 0.10 along Al/Ca
and 0.56 along Si/Ca; M1F – 0.14 along Al/Ca and 0.68 along Si/Ca.
Figure 6-18: Si/Ca vs Al/Ca plots of calcium silicates phases in the three HPCs
The lime: silica (CaO/SiO2) ratio also varied greatly as the binder type or W/B varied. The SAP
addition reflected some observed influence on the CaO/SiO2 ratio. The CaO/SiO2 generally decreased
in Spectrum B as the SAP contents increased especially for the M1F and M2 (0.2 and 0.25 W/B) HPCs
with some inconsistencies – an indication of increased lime liberation as the SAP content increased.
However for the M3 (0.3 W/B) HPC, SAP addition does not lead to increased CaO/SiO2 in Spectrum
B. The influence of SAP on Spectrum D was however opposite. It thereby follows that as the SAP
content increases the inner C-H-S (un-hydrated cement) decreases while the outer C-H-S (actual
hydrated cement) increases.
Stellenbosch University https://scholar.sun.ac.za

187
6.2.4 Inferences
The findings from the study of the SEM on the low W/B concretes with SAP can be summarised as
follows:
i. The SEM image analysis of the HPCs reveals three internal phases categorised as
aggregates, the paste matrix and air voids.
ii. The aggregates were observed to be dark grey in colour, large, of irregular shape and
often have small patterned grey spots within. The quantitative analysis reveals it as
dominantly quartz which is often 100% silica (SiO2) as seen in this study and may
sometimes contain feldspar and other minor materials.
iii. The paste matrix shows diverse phases of objects with six prominent phases identified in
all the HPCs.
iv. The first of these phases identified as fine aggregate (Spectrum A) revealed similar
composition of quartz (i.e. about 100% SiO2) as the coarse aggregate.
v. Spectrum B and D were identified as the calcium silicate phases within the paste matrix
known as the main product of cement hydration responsible for strength development and
observed mechanical behaviour of the concrete.
vi. SEM quantitative analysis affirmed B (bright grey colour) appropriately as the impure
C3S – alite (i.e. the un-hydrated cement particles) while D (dark grey in colour) is the
outer C-H-S (i.e. the hydrated cement particles) of the paste matrix.
vii. Other prominent phases observed are the C (white substance) which is dominantly iron –
the ferrite (C4AF); E (also of bright grey colour) shows calcium and silicon with diverse
small elements (including sulphur and sometimes iron) in combination with oxygen. F
(bigger light grey in colour) is dominantly calcium and identified as the calcium
hydroxide (CH) phase. G (tiny spots of bright grey colour within the paste matrix) is the
monocarbonate (AFm) phase.
Stellenbosch University https://scholar.sun.ac.za
188
viii. Other phases containing different minor elements such as lead (Pb), titanium (Ti),
manganese (Mn), molybdenum (Mo) were noted in the SEM analysis of the HPCs as SAP
contents increases.
ix. SAP addition in the HPCs reflected some observed influence on the lime: silica ratio. The
CaO/SiO2 generally decreases in Spectrum B as the SAP contents increases especially for
the very low W/B HPCs (i.e. M1F – 0.2 W/B and M2 – 0.25 W/B) – an indication of
increased lime liberation as the SAP content increased. SAP addition improves cement
hydration and lead to reduction of the un-hydrated cement particle (i.e. alite - impure C-
H-S) content present in this low W/B HPCs.
Stellenbosch University https://scholar.sun.ac.za
189
7
Conclusion and Recommendations
The mechanical behaviour of HPC containing varying grain sizes and volumes of Superabsorbent
Polymers (SAP) has been investigated with efforts made to evaluate the effect of SAP as an IC-agent.
Experimental works were carried to study the impact of SAP addition on the rheology of the HPCs,
identify and establish the effect of varying sizes and volume of SAP on rate of cement hydration and
strength development. The work involved quantifying and modelling the mechanical behaviour
(strength in compression, tension, elastic and fracture properties) of the low W/B (0.2 – 0.3) HPC
(C55/67 –C100/115) with SAP. Microstructure and molecular interaction of the internal constituent
of the HPC were also investigated using two non-destructive testing methods (i.e. the CT scanning
and scanning electron microscopy). Findings of the study are hereby summarised in the following
sections with conclusions drawn and appropriate recommendations made for future study.
7.1 Fresh and Early–Age Strength Properties
Cement pore solution (CPS) concentration (within the limits tested) does not have a
significant influence on the SAP absorption capacity.
SAP absorption capacity in CPS used for this study is 25 g/g (10 mins insertion in CPS) while
the absorption in water is 230 g/g.
Although the total W/B increases as SAP content increases by adding additional water for
SAP absorption, the slump flow value remains in the same range for all HPC mixtures. This
implies that SAP is mainly a water reservoir for IC of the HPC, absorbs all the additional
water and stores it for IC of the concrete. SAP addition and the additional water provided in
this study thereby have no significant influence on the consistency of the HPCs.
SAP addition reduces the temperature difference increase resulting from concrete mixing in
HPC production and hence helps to mitigate rapid heat development during cement hydration.
Stellenbosch University https://scholar.sun.ac.za
190
The swollen SAP within the HPC during concrete mixing and constituent agitation provides a
means of reducing the temperature rise from the agitated solid constituents into the absorbed
water within the SAP particles and hence lowers the internal concrete temperature.
SAP addition in HPC resulted in a level of set retardation and thereby enhances longer slump
retention time.
The Kinetic of hydration (B) of all the HPC mixtures with or without SAP at the early-age
conforms to the relationship as postulated in literature.
7.2 Mechanical Properties of HPC with SAP
SAP addition to HPCs contribute to the air content in the concrete as the density of the HPCs
decreases at relatively small rate as the SAP content increases.
Compressive strength of low W/B HPCs decreases slightly as SAP contents increases. Higher
SAP content with the additional water on basis of the tea-bag test result led to higher SAP
created voids and hence reduces the HPC’s ability to resist the force applied.
SAP addition within the limits of the contents used in this study (0.2 to 0.4% bwob) in low
W/B HPCs has no significant influence on the elastic and fracture properties of the concrete.
SAP addition led to some reduction in compressive strength of HPC, correction made for void
volume (SAP and air) using the Bolomey’s formula and Powers’ gel-space ratio was in
agreement with the Powers’ Model and hence makes possible a prediction of the effect of
SAP on the compressive strength of HPC.
7.3 Non Destructive Tests on HPC with SAP
Although SAP addition increases the air voids content in HPC, the influence on mechanical
properties of the HPC will be minimal when the additional water for SAP absorption is kept
within 12.5 g/g (i.e. half the 25 g/g obtained in the teabag test).
Vibrating the HPCs with SAP for a longer time (10 minutes) reduces the SAP voids volume
and the existence of large air voids. The longer vibration and agitation of the solid
Stellenbosch University https://scholar.sun.ac.za
191
constituents materials (especially the coarse aggregates) resulted in desorption of some of the
absorbed water in the swollen SAP particles which escapes from the concrete as bleeding
water and hence form part of the reason for reduction in SAP voids in the triplicate samples.
The lime liberation in the low W/B HPCs increased as the SAP contents increased resulting in
improved cement hydration and reduced un-hydrated cement particles content.
The findings from this research hereby propose that the 25 g/g SAP absorption capacity result of the
tea-bag test over-estimates the actual amount of water used up by SAP in the IC of HPC considering
the fact that the solid constituents of the concrete were not incorporated in the tea-bag test SAP
absorption simulation. The revelation from the 3D void analysis of the HPC via CT scanning that SAP
created voids in the HPC is only about half (i.e.12.5 g/g) of the tea-bag test provision of 25 g/g
affirms that the required additional water for SAP’s effective IC of the low W/B HPC is 12.5 g/g. The
excess water of 12.5 g/g above the required is the observed SAP created voids and the reason for the
loss in compressive strength. The optimum additional water for SAP addition in the low W/B HPCs at
no negative effect on mechanical properties is 12.5 g/g.
7.4 Recommendation
Based on the findings from this study the following is recommended:
Additional water for SAP absorption should be kept as 12.5g/g in future studies for SAP
addition in concrete especially HPC to minimise SAP’s contribution to air voids in concrete.
SAP addition within the limits stated above should be considered for slump retention in low
W/B HPC at no negative effect on mechanical properties of the concrete.
Further study to generate more experimental results on influence of SAP addition (with extra
water) on fracture properties of HPC towards establishing a relationship is recommended.
More detailed study on influence of SAP on the final products of hydration is recommended
with a view to determine the contribution of SAP particles and its elements to the chemical
interactions within the cement paste matrix at both the early-age and long term period.
Stellenbosch University https://scholar.sun.ac.za

192
8 References
ACI THPC/TAC (1999), ACI defines high performance concrete, (the Technical Activities
Committee Report (Chairman - H.G. Russell)). U.S.A: American Concrete Institute.
Addis, B., & Goodman, J. (2009), Concrete mix design, In G. Owens (Ed.), Fulton's concrete
technology (pp. 219 - 228), Midrand, South Africa: Cement and Concrete Institute.
Aītcin, P. C. (1998), High performance concrete, London & New York, E & FN Spon.
American Concrete Institute (1992), State-of-the-art report on high strength concrete (ACI 363R-92).
American Concrete Institute (1998), Guide to quality control and testing of high strength concrete,
(ACI 363.2R-98).
American Concrete Institute, (2008), Guide to curing concrete, (ACI Committee Report No. 308R-
01(08)), U.S.A.
American Concrete Institute, (2013), Report on internally cured concrete using pre-wetted absorptive
lightweight aggregate, (ACI Committee Report No. 308-213 R13), U.S.A.
American Standards and Test Methods (ASTM) International (2008), ASTM C40/C403M - 08 -
Standard test method for time of setting of concrete mixtures by penetration resistance, USA, ASTM
International.
ASTM International (2010), ASTM C469/C469M - 10 - Standard test method for static modulus of
elasticity and Poisson's ratio of concrete in compression, USA, ASTM International.
Assmann, A., Mazanec, O., & Eissmann, D. (2014), Study on macroscopic viscosity for prediction of
the swelling capacity of salt-insensitive superabsorbent polymers in cementitious materials.
International RILEM Conference on Application of Superabsorbent Polymers and Other New
Stellenbosch University https://scholar.sun.ac.za
193
Admixtures in Concrete Construction, Technische Universitat Dresden, Dresden, Germany, Pro
095 105-114.
Bentur, A., Ingarashi, S., & Kovler, K., (2001), Prevention of autogenous shrinkage in high-strength
concrete by internal curing using wet lightweight aggregates, Cement Concrete Research, 31
(11): 1587-1591.
Bentz, D. P., Geiker, M., & Jensen, O. M. (2002), On the mitigation of early age cracking, In:
Proceeding 3rd
International Seminar on Self-desiccation and its Importance in Concrete
Technology, Persson, B., & Fagerlund, G. (eds.), Lund University, Lund, Sweden, 195-204
Beushausen, H., & Dehn, F. (2009), High-performance concrete, In G. Owens (Ed.) Fulton's concrete
technology (Ninth ed., pp. 297-304). Midrand, South Africa: Cement and Concrete Institute.
Bolomey, J. (1935), Granulation and forecasting the resistance of concrete. [“Granulation et
pr´evision de la r´esistance probable des b´etons,”] "Travaux" (Works), 30, 228-232.
Braam, C. R., Van-der-Ham, H. W., & Koenders, E. A. (2006), Early-age shrinkage control and
strength development of concrete, International RILEM Conference on Volume Changes of
Hardening Concrete:Testing and Mitigation, Technical University of Denmark, Lyngby,
Denmark. , Proceeding Pro052(20-20 August) 185--194.
Brandt, A. M. (1995a), Cement-based composites: Materials, mechanical properties and
performance, London, E & FN Spon.
Brandt, A. M. (Ed.) (1995b), Optimisation methods for material design of cement-based composites,
London, E & FN Spon.
British Standard Institution (2009), Testing of fresh concrete, BS EN 12350 - 5 - Flow table test,
London, British Standard Institution (BSI).
Stellenbosch University https://scholar.sun.ac.za

194
British Standard Institution (2009), Testing of fresh concrete, BS EN 12350 - 6 - Density, London,
BSI.
British Standard Institution (2009), Testing of hardened concrete, BS EN 12390 - 1- shape, dimension
and other requirement for specimens and mould, London, BSI.
British Standards Institution (2009), Testing of hardened concrete - making and curing specimen for
strength tests, BS EN 12390-2, London, BSI.
British Standard Institution (2009), Testing of hardened concrete, BS EN 12390 - 3 - compressive
strength test specimens, London, BSI.
British Standard Institution (2009), Testing of hardened concrete, BS EN 12390 - 4 -compressive
strength, specification for testing machines, London, BSI.
British Standard Institution (2009), Testing of hardened concrete, BS EN 12390 - 6, Tensile splitting
strength of test specimens, London, BSI.
British Standard Institution (2009), Testing of hardened concrete, BS EN 12390 - 7 - density of
hardened concrete, London, BSI.
British Standard Institution (2006), BS EN 206 - Concrete: specification, performance, production
and conformity, London, BSI.
British Standard Institution (2004), Eurocode 2: Design of concrete structures - Part 1-1: General
rules1, London, BSI.
British Standard Institution (2000), Cement- Composition, Specifications and Conformity Criteria for
common Cements, BS EN 197- 1, London, BSI.
British Standard Institution (1997), Test for geometrical properties of aggregates, BS EN 933 - 1 -
determination of particle size distribution (sieving method), London, BSI.
Stellenbosch University https://scholar.sun.ac.za
195
Brühwiler, E., & Wittmann, F. H. (1990), The wedge splitting test, a new method for performing
stable fracture mechanics test, Engineering Fracture Mechanics, Vol. 35(No. 1/2/3), 117-125.
Craeye, B., & De Schutter, G. (2006), Experimental evaluation of mitigation of autogenous shrinkage
by means of a vertical dilatometer for concrete, In: RILEM Proceeding PRO 52 Volume
Changes of Hardening Concrete: Testing and Mitigation, Jensen, O. M., Lura, P. & Kovler, K.
(eds.), RILEM Publications S.A.R.L., Bagneux, France, 21-30.
Craeye, B., Geirnaert, M., & Schutter, G. D. (2010), Super absorbing polymers as an internal curing
agent for mitigation of early-age cracking of high-performance concrete bridge decks,
Construction and Building Materials, 25(1), 1-13.
Dehn, F. (2012), Constitutive concrete and durability models in the new fib model code 2010.
Encontro Nacional BETÃO ESTRUTURAL (National Concrete Structural) - BE2012 FEUP,
Portugal, (24 - 26 October) 1-12.
DiStefano, C., Ferro, V., & Mirabile, S. (2010), Comparison between grain-size analyses using laser
diffraction and sedimentation methods, Biosystems Engineering, 106, 205-215.
Dudziak, L., & Mechtcherine, V. (2008), Mitigation of volume changes of ultra-high performance
concrete (UHPC) by using super absorbent polymers, Proceedings of 2nd
International
Symposium on Ultra High Performance Concrete, E. Fehling et al., (eds.), Kassel University
Press GmbH, 425-432.
Dudziak, L., & Mechtcherine, V. (2010a), Reducing the cracking potential of Ultra-high performance
concrete by using super absorbent polymers (SAP), In: Van Zijl G. P. A. G. & Boshoff, W. P.
(eds.), Proceedings of the International Conference on Advanced Concrete Materials,
Stellenbosch University, South Africa, 17-19 November, 2009.
Dudziak, L., & Mechtcherine, V. (2010b), Enhancing early age resistance to cracking in high strength
cement-based materials by means of internal curing using super absorbent polymers, In:
Stellenbosch University https://scholar.sun.ac.za

196
Bramesshuber, W. (ed.), Proceedings of International Conference on Materials Science (MatSci),
6-10 September, 2010 (Aachen, Germany), RILEM Proc. PRO 77, Vol III, RILEM Publications
S.A.R.L., Bagneux, France, 129-139.
du Plessis, A., Olawuyi, B. J., Boshoff, W. P., & le Roux, S. G. (2014), Simple and fast porosity
analysis of concrete using X-ray computed tomography, Materials and Structures, online first
(December).
EDANA (2002), Recommended test: Free swell ratio, ERT 440.2-02.
Esteves, L. P., Cachim, P., & Ferreira, V. M. (2007), Mechanical properties of cement mortars with
superabsorbent polymers, Advances in Construction Materials, 451-462.
Esteves, L. P. (2009), Internal curing in cement based materials, PhD Thesis, Aveiro University,
Portugal.
Esteves, L. P. (2014), Recommended method for measurement of absorbency of superabsorbent
polymers in cement-based materials, Materials and Structures, published online 04 May 2014
Fennis, S., Walvaren, J., & Den Uijl, J. (2012), Influence of particle packing on the strength of
ecological concrete, International Conference on Repair, Rehabilitation and Retrofitting
(ICCRRR) III, Cape Town, South Africa, 486.
FEI Visualisation Science Group (2013), Avizo Fire (version 8.0) - 3D Analysis software for
Scientific and Industrials Data, www.vsg3d.com
Friedemann, K., Stallmach, F., & Kärger, J. (2006), NMR diffusion and relaxation studies
during cement hydration - a non-destructive approach to clarification of the mechanism
of internal post-curing of cementitious materials, Cement Concrete Research, 36 (5):
817-826.
Stellenbosch University https://scholar.sun.ac.za

197
Geika, M. R., Bentz, D. P., & Jensen, O. M. (2004), Mitigating autogenous shrinkage by IC, In Ries,
J. P. & Holm, T. A. (Eds.), High performance structural lightweight concrete (Special
Publication 218 ed., pp. 143-148), USA, ACI.
Gils, M. A. J., Dortmans, L.J.M.G., & de With, G. (1995), Fictitious crack modelling of Kiln furniture
ceramics, In: Fracture Mechanics of Concrete Structures, Wittmann, F. H. (eds.), Aedificatio
Publishers, Freiburg, Germany, pp. 1261-1270.
Guofan, Z., Hui, J., & Shilang, X. (1991), Study of fracture toughness and fracture energy by means
of wedge splitting test specimens, In: Brittle Matrix Composites, Brand, A. M., & Marshal, I. H.
(eds.), Elsevier Applied Science, London and New York, pp. 62-71.
Habel, K., Charron, J., Braike, S., Hooton, R.D., Gauvreau, P. & Massicotte, B. (2008),
Ultra-High Performance Fibre Reinforced Concrete Mix Design in Central Canada.
Canadian Journal of Civil Engineering, 35(2).
Hansen, T. C. (1986), Physical structure of hardened cement paste: A classical approach, Materials &
Structures 19 (6): 423-436.
Hansen, E. A., Leive, M., Rodriguez, J., & Cather, R. (1996), Mechanical properties of high strength
concrete - influence of test conditions, specimens and constituents. In I. Holand, & E. J.
Sellevold (Eds.), Proceedings of fourth international symposium on the utilization of high
strength / high performance concrete (pp. 187-196). Paris, France.
Hasholt, M. T., Jespersen, M. H. S., & Jensen, O. M. (2010b), Mechanical properties of concrete with
SAP, part II: Modulus of elasticity. International RILEM Conference on use of Superabsorbent
Polymers and Other Additives in Concrete, Technical University of Denmark, Lyngby,
Denmark. , Proceedings Pro074 (15-18 August) 127--136.
Stellenbosch University https://scholar.sun.ac.za

198
Hasholt, M. T., Jensen, O. M., Kovler, K., & Zhutovsky, S. (2012), Can superabsorbent polymers
mitigate autogenous shrinkage of internally cured concrete without compromising the strength?
Construction and Building Materials, 31, 226 - 230.
Hasholt, M. T., Jespersen, M. H. S., & Jensen, O. M. (2010a), Mechanical properties of concrete with
SAP - Part I: Development of compressive strength, International RILEM Conference on
Superabsorbent Polymers and Other Additives in Concrete, Technical University of Denmark,
Lyngby, Denmark. , Proceeding Pro074(15-18 August) 117--126.
Henkensiefken, R., Nantung, T., & Weiss, J. (2011), Saturated lightweight aggregate for internal
curing in low W/C mixtures: Monitoring water movement using x-ray absorption, Strains 47(s1):
e432-e441.
Hu, X. Z., & Wittmann, F. H. (1990), Experimental method to determine extension of fracture process
zone . Journal of Materials in Civil Engineering, 2, 15-23.
Hueste, M. B. D., Chompreda, P., Trejo, D., Celine, D. B. H., & Keating, P. B. (2004), Mechanical
properties of high strength concrete for prestressed members. ACI Structural Journal (Technical
Paper), Jul.-Aug.(101-S45), 457-466.
IBM® SPSS® Statistics Base (2015), Statistical Package for Social Sciences release version 22,
IBM® SPSS® Statistics.
Ingarashi, S., & Watanabe, A. (2006), Experimental study on prevention of autogenous deformation
by IC using super-absorbent polymer particles, International RILEM Conference on Volume
Changes of Hardening Concrete: Testing and Mitigation, Technical University of Denmark,
Lyngby, Denmark. , Proceeding Pro052(20-23 August) 77-86.
International Federation for Structural Concrete (fib). (2008), Constitutive modelling of high strength
/high performance concrete (HSC/HPC), (fib Bulletin 42), Lausanne:
Stellenbosch University https://scholar.sun.ac.za
199
International Federation for Structural Concrete (fib). (2012), Model code 2010 (final version), (fib
Bulletins 65 & 66), Lausanne: International Federation for Structural Concrete (fib).
International Union of Testing and Research Laboratories for Materials and Structures (RILEM)
(1994), AAC13.1 - Determination of the specific fracture energy and strain softening of AAC
1992, TC51-ALC, 78-MCA, RILEM technical recommendations for the testing and use of
construction materials (pp. 156-158), London, E & FN Spon.
International Union of Testing and Research Laboratories for Materials and Structures (RILEM)
(1994), CPC4 - Compressive strength of concrete 1975, TC14-CPC, RILEM technical
recommendations for the testing and use of construction materials (pp. 17-18), London, E & FN
Spon.
International Union of Testing and Research Laboratories for Materials and Structures (RILEM)
(1994), CPC8 - Modulus of elasticity of concrete in compression 1975, TC14-CPC, RILEM
technical recommendations for the testing and use of construction materials (pp. 25-27),
London, E & FN Spon.
Jensen, O. M. (1993), Autogenous deformation and RH-change - self-desiccation and self-desiccation
shrinkage, PhD Thesis, Technical University of Denmark, Denmark.
Jensen, O. M., & Hansen, P. F. (2002), Water-entrained cement-based materials II: Experimental
observations, Cement and Concrete Research, 32(6), 973--978.
Jensen, O. M., & Hansen, P. F. (2001), Water-entrained cement-based materials: I. principle and
theoretical background, Cement and Concrete Research, 31(4), 647--654.
Jensen, O. M. & Lura, P. (2006), Techniques and materials for internal water curing of concrete,
Materials and Structures, 39, 817 - 825.
Stellenbosch University https://scholar.sun.ac.za

200
Jensen, O. M. (2008), Use of superabsorbent polymers in construction materials, 1st
International
Conference on Microstructure Related Durability of Cementitious Composites, October 13-15,
Nanjing, Peoples Republic of China.
Jensen, O. M., Hasholt, M. T., & Laustsen, S. (Eds.). (2010), Proceedings pro074: International
RILEM conference on use of superabsorbent polymers and other new additives in concrete
RILEM Publications.
Kadri, E. H., Aggoun, S., Kenai, S., & Kaci, A. (2012), The compressive strength of high-
performance concrete and ultrahigh-performance. Advance in Materials and Engineering,
(Article ID 361857), 1-7.
Kakade, A. M. (2014), Measuring concrete surface pH - A proposed test method, Concrete Repair
Bulleting, (March/April), 16-20.
Kenter, P. (2012), Concrete sustainability requires coordinated research into hydration, beliefs expert,
Daily Commercial News and Construction Record (Online), 1.
Kovler, K., & Jensen, O. M. (2007), IC of concrete - state-of-the-art report of RILEM technical
committee 196-ICC, (RILEM STAR Report rep041), RILEM Publications.
Kosmatka, S. H., Kerkhoff, B., & Panarese, W. C. (2002), Chapter 17: High performance concrete,
Design and control of concrete mixture: Engineering bulleting 001 (EB 001) (Fourteenth ed., pp.
299-314), Illinois, USA: Portland Cement Association.
Kowalenko, C. G., & Babuin, D. (2013), Inherent factors limiting the use of laser diffraction for
determining particle size distribution of soil and related samples. Geoderma, 193 -194, 22-28.
Kratz, M., Dudziak, L., & Mechtcherine, V. (2007), Plastic shrinkage of concretes with low and high
W/C ratios, Internal Technical Report, Technical University, Dresden, Germany.
Stellenbosch University https://scholar.sun.ac.za
201
Lam, L., Wong, Y. L., & Poon, C. S. (2000), Degree of hydration and gel/space ratio of high-volume
fly ash/cement systems, Cement and Concrete Research, 30, 747-756.
Lam, H., & Hooton, R. D. (2005), Effects of internal curing methods on restrained shrinkage and
permeability, Portland Cement Association, Research & Development Information Serial
No.2620, In: Proceeding 4th International Seminar on Self-desiccation and its Importance in
Concrete Technology, Persson, B., Bentz, D., & Nilsson, L. O. (eds.), Lund University, Lund,
Sweden, 201-228.
Lausten, S., Hasholt, M. T., & Jensen, O. M. (2008), A new technology for air-entrainment of
concrete, 1st International Conference on Microstructure Related Durability of Cementitious
Composites, 13-15 October, Nanjing, Peoples Republic of China, 1223-1230.
Liu, B. D., Lv, W. J., Li, L., & Li, P. F. (2014), Effect of moisture content on static compressive
elasticity modulus of concrete, Construction and Building Materials, 69, 133-142.
Löfgren, I. (2005), Fibre Reinforced Concrete for Industrial Construction - a fracture mechanics
approach to material testing and structural analysis, PhD Thesis, Chalmers University of
Technology, Goteborg, Sweden 276pp.
Löfgren, I., Stang, H., & Olesen, J. F. (2008), The WST method, a fracture mechanics test method for
FRC, Materials and Structures 41: 197-211.
Lura, P. (2003), Autogenous deformation and internal curing of concrete, PhD Thesis, Technical
University, Delft, The Netherlands.
Lura, P., Durand, F., Loukili, A., Kovler, K., & Jensen, O. M. (2006), Strength of cement
pastes and mortars with superabsorbent polymers, International RILEM Conference on
Volume Changes of Hardening Concrete: Testing and Mitigation, RILEM Proceedings
PRO 52, RILEM Publications S.A.R.L., 117-126.
Stellenbosch University https://scholar.sun.ac.za

202
Lura, P., & Lothenbach, B. (2010), Influence of pore solution chemistry on shrinkage of cement paste,
The 50-year Teaching and Research Anniversary of Prof. Sun Wei on Advances in Civil
Engineering Materials, Miao, C., Ye, G., & Chen, H. (eds.), RILEM Publications S.A.R.L., 191-
200.
Lyman, C. G. (1934), Growth and movement in Portland cement concrete, Oxford University Press,
London.
Maire, E., & Withers, P. J. (2014), Quantitative X-ray tomography, International Materials Reviews,
59(1), 1-43.
Malhotra, V. M. (1994), High-performance concrete: Proceedings, ACI international conference,
Singapore, Detroit, Mich.: American Concrete Institute.
Maruyama, I., Kanematsu, M., Noguchi, T., Iikura, H., Teramoto, A., & Hayano, H. (2009),
Evaluation of water transfer from saturated lightweight aggregates to cement paste matrix by
neutron radiography, Nuclear Instruments and Methods in Physics Research A: Accelerators,
Spectrometers, Detectors and Associated Equipment, 605 (1-2): 159-162.
Masoero, E., Del Gado, E., Pelleng, R. J. M., Ulm, F. J., & Yip, S. (2012), Nanostructure and
nanomechanics of cement: Polydisperse colloidal packing, Physical Review Letters, PR
109(155503), 1-4.
Mechtcherine, V., & Müller, H. S. (1997), Fracture mechanical and fractological investigations on
normal and high strength concrete, In A. M. Brand, V. C. Li & I. H. Marshall (Eds.),
Proceedings of the fifth international symposium on brittle matrix composites (Bigraf/Warshaw
ed., pp. 231-240), Cambridge, Woodhead Publishing Ltd.
Mechtcherine, V., Dudziak, L., Schulze, J., & Staehr, H. (2006), Internal Curing by super absorbent
polymers (SAP) - effects on material properties of self-compacting fibre-reinforced high
performance concrete, International RILEM Conference on Volume Changes of Hardening
Stellenbosch University https://scholar.sun.ac.za

203
Concrete: Testing and Mitigation, Technical University of Denmark, Lyngby, Denmark. ,
Proceeding Pro052 (20-23 August) 87-96.
Mechtcherine, V., Dudziak, L., & Hempel, S. (2009), Mitigating early age shrinkage of Ultra-high
performance concrete by using super absorbent polymers (SAP), Creep, Shrinkage and
Durability Mechanics of Concrete and Concrete Structures - CONCREEP-8, T. Tanabe et. al.
(eds.), Taylor & Francis Group, London, 843-853.
Mechtcherine, V., & Reinhardt, H. (eds.) (2012), Application of super absorbent polymers (SAP) in
concrete construction, RILEM State of the Art Reports, 2
Mechtcherine, V., & Schroefl, C. (eds.) (2014), Proceedings PRO 95: International RILEM
conference on application of superabsorbent polymers and other new admixtures in concrete
construction (PRO 95 ed.). France: RILEM Publications S.A.R.L.
Mehta, P. K., & Monteiro, J. M. (2014), Concrete microstructure properties and materials (4th ed.),
U.S.A.: McGraw-Hill Education.
Mönnig, S. (2005), Water saturated super-absorbent polymers used in high strength concrete, Otto-
Graf-Journal, 16: 193-202.
Mönnig, S. (2009), Superabsorbing additions in concrete - applications, modelling and comparison of
different internal water sources, PhD Thesis, University of Stuttgart, 164 pp.
Nawa, T., & Horita, T. (2004), Autogenous shrinkage of high-performance concrete, In: Proceedings
of the International Workshop on Microstructure and Durability to Predict Service Life of
Concrete Structures, February, Sapporo, Japan.
Nestle, K., Kühn, A., Friedemann, K., Horch, C., Stallmach, F., & Herth, G. (2009), Water balance
and pore structure development in cementitious materials in internal curing with modified super-
absorbent polymer studied by NMR, Microporous Mesoporous Materials, 125 (1-2): 51-57.
Stellenbosch University https://scholar.sun.ac.za

204
Neville, A. M. (2012), Properties of concrete (Fifth ed.), England: Pearson Educational Limited.
Neville, A. M., & Aitcin, P. C. (1998), High performance concrete - an overview, Materials and
Structures/Materiaux Et Constructions, 31(Mars), 111-117.
Neville, A. M., & Brooks, J. J. (2010), Concrete technology (2nd ed.), London: Prentice Hall.
Nordic Innovative Centre (2005), Wedge Splitting Test Method: Fracture Testing of Fibre Reinforced
Concrete (Mode I) - NT BUILD 511, Norway, 5pp.
Ollivier, J. P., Carles-Gibergues, A., & Hanna, B. (1988), Pozzolanic activity and filling action of
silica fume in high strength concrete matrices [Activite pouzzolanique et action de remplissage
d’une fumee de silice dans les matrices de beton de haute resistance], Cement and Concrete
Research, 18(3), 438-448.
Persson, B. (1996), Hydration and strength of high performance concrete, Advance Cement Based
Materials, 3, 107-123.
Pierard, J., Pollet, V., & Cauberg, N. (2006), Mitigating autogenous shrinkage in HPC by IC using
superabsorbent polymers, International RILEM Conference on Volume Changes of Hardening
Concrete: Testing and Mitigation, Technical University of Denmark, Lyngby, Denmark. ,
Proceeding Pro052(20-23 August) 97-106.
Portland Cement Association (2012), Specialty concrete - high end value materials. Retrieved from
www.cee.mtu.edu/~llsutter/classes/cet1141/present/hvalue.ppt
Powers, T. C. (1958), Structure and physical properties of hardened Portland cement paste, [Article
first published online 2nd June, 2006], Journal of the American Ceramic Society, 41(1), 1-6.
Powers, T. C., & Brownyard, T. L. (2003a), Landmark series: Studies into physical properties of
hardened Portland cement pastes, part 2, [originally published in the ACI JOURNAL, V. 18 No.
8, Apr. 1947], Concrete International, 25(9), 31-42.
Stellenbosch University https://scholar.sun.ac.za
205
Powers, T. C., & Brownyard, T. L. (2003b), Landmark series: Studies of the physical properties of
hardened cement paste, [originally published in the ACI JOURNAL, V. 18 No. 8, Apr. 1947]
Concrete International, 25(8), 59-70.
Rahimian, A., & Eilon, Y. (2012), The rise of one world trade centre, STRUCTUREmag - Structural
Engineering Magazine, Tradeshow, Nov. 2012(1564)
Ramezanianpour, A. A. (2014), Chapter 2: Fly ash. Cement replacement materials: Properties,
durability and sustainability (pp. 47-156), Verlag Berlin Heidelberg: Springer
Geochemistry/Mineralogy.
Reinhardt, H., & Mönnig, S. (2006), Results of comparative study of the shrinkage behaviour of
concretes with different internal water sources, In: Jensen, O. M., Lura, P & Kovler, K. (eds.),
Proceedings of International RILEM Conference on Volume Changes of Hardening Concrete:
Testing and Mitigation, (20-23 August), Technical University of Denmark, Lyngby, Denmark,
67-76.
Reinhardt, W., Assmann, A., & Mönnig, S. (2008), Superabsorbent polymers (SAPs) - an admixture
to increase the durability of concrete, 1st International Conference on Microstructure Related
Durability of Cementitious Composites, 13-15 October, Nanjing, Peoples Republic of China,
313-322.
Schrofl, C., Mechtcherine, V., & Gorges, M. (2012), Relation between the molecular structure and the
efficiency of superabsorbent polymer (SAP) as concrete admixture to mitigate autogenous
shrinkage, Cement and Concrete Research, 42, 865-- 873.
Sellevold, E. J., & Radjy, F. F. (1983), Condensed silica fume (microsilica) in concrete: Water
demand and strength development, Fly-Ash, Silica Fume, Slag and Other Mineral by- Products
in Concrete ACI SP-79,
Stellenbosch University https://scholar.sun.ac.za
206
Shetty, M. S. (2004), Concrete technology - theory and practice, New Dhelhi, India: S. Chand and
Company Limited.
Siddique, R., & Khan, M. I. (2011), Chapter 2: Silica fume, Supplementary cementitious materials
(XVI ed., pp. 67-119). Verlag Berlin Heidelberg: Springer.
Silica Fume Association (2005), Silica fume Ushers' Manual.
Siramanont, J., Vichit-Vadaka, W., & Siriwatwechakul, W. (2010), The impact of SAP structure on
the effectiveness of IC, International RILEM Conference on use of Superabsorbent Polymers
and Other New Additives in Concrete, Technical University Denmark, Lyngby, Denmark,
Proceeding Pro074 (15-18 August) 243--252.
Siriwatwechakul, W., Siramanont, J., & Vichit-Vadaka, W. (2010), Superabsorbent polymer
structures, International RILEM Conference on use of Superabsorbent Polymers and Other New
Additives in Concrete, Technical University Denmark, Lyngby, Denmark, Pro074 (15-18
August) 253-262.
South African Bureau of Standards (2001), SANS 50197 - 1 - Cement - Part 1: Composition,
specifications and conformity criteria for common cements, Pretoria, (SABS).
Trtik, P., Münch, B., Weiss, W. J., Kaestner, A., Jerjen, I., Josic, L., Lehmann, E., & Lura, P. (2011),
Release of internal curing water from lightweight aggregates in cement paste investigated by
neutron and X-ray tomography, Nuclear Instruments and Methods in Physics Research A:
Accelerators, Spectrometers, Detectors and Associated Equipment, 651 (1): 244-249.
Trunk, B., Schober, G., Helbing, A. K., & Wittmann, F. H. (1999), Fracture mechanics parameters of
autoclaved aerated concrete, Cement and Concrete Research, 29: 855-859
Stellenbosch University https://scholar.sun.ac.za

207
the IRON Platform (2014), Iuclid 5 composition and analysis guidance document: mill scale
(EINECS number 266-007-8, CAS number 65996-74-9) - TWG117, pg. 2-3, http://www.iron-
consortium.org/assets/files/TWG/Analysis-MillScale-V2_100717.pdf
Volume Graphics (2013), VGStudio Max 2.2 - Application software for analysis and visualisation of
industrial computed tomography/ voxel data, www.volumegraphics.com
Wang, F., Zhou, Y., Peng, B., Liu, Z., & Hu, S. (2009), Autogenous shrinkage of concrete with super
absorbent polymer, ACI Materials Journal, 106 (2): 123-127.
Weber, S., & Reinhardt, H. W. (1997), A new generation of high performance concrete: concrete with
autogenous curing, Advanced Cement Based Materials, 6 (2): 59-68.
Winter, N. B. (2012), Scanning electron microscopy of cement and concrete, Rendlesham,
Woodbridge, UK: WHD Microanalysis Consultants Ltd.
Wille, K., Naaman, A. E., & Parra-Montesinos, G. J. (2011), Ultra-High Performance
Concrete with Compressive Strength Exceeding 150 MPa (22 Ksi): A Simpler Way. ACI
Materials Journal, 108(1), 23 June 2013.
Wittmann, F. H., Roelfstra, P. E., Mihashi, H., Huang, Y. Y., Zhang, X., & Nomura, K. (1987),
Influence of age at loading, water-cement ratio and rate of loading on fracture energy of
concrete, Materials and Structures, Paris, 20, 103-110.
Wyrzykowski, M., Gawin, D., Pesavento, F., & Lura, P. (2006), Multi-scale modelling of autogenous
strains of an internally cured cementitious material, International RILEM Conference on Volume
Changes of Hardening Concrete Testing and Mitigation, Technical University of Denmark,
Lyngby, Denmark, Proceeding Pro052 (20-23 August) 137-146.
Stellenbosch University https://scholar.sun.ac.za

208
Ye, G. (2003), Experimental study and numerical simulation of the development of the microstructure
and permeability of cementitious materials, PhD Thesis, Delft University of Technology, Delft,
Netherlands.
Zang, J. (2015), Developing non-heat treated UHPC in South Africa, PhD Thesis, University of
Stellenbosch, Stellenbosch, South Africa.
Zhao, Z., Kwon, S. H., & Shah, S. P. (2008), Effect of specimen size on fracture energy and softening
curve of concrete: Part I. experiments and fracture energy, Cement and Concrete Research, 38.
Stellenbosch University https://scholar.sun.ac.za

209
Appendix A: Attachments to Chapter Four
Table A1: for Specimen Designation of HPC Mixtures Specimen
Designation Binder Composition
Binder Type 1 (binary cement) = CEM I 52.5 N(92.5%) + (SF (7.5%)
M₂ Reference mixture for binder Type 1 (0.25 W/B)
M₂SP₁-0.2 M2 + SAP Type 1 (0.2% bwob content)
M₂SP₁-0.3 M2 + SAP Type 1 (0.3% bwob content)
M₂SP₁-0.4 M2 + SAP Type 1 (0.4% bwob content)
M₂SP₂-0.2 M2 + SAP Type 2 (0.2% bwob content)
M₂SP₂-0.3 M2 + SAP Type 2 (0.3% bwob content)
M₂SP₂-0.4 M2 + SAP Type 2 (0.4% bwob content)
M₃ Reference mixture for binder Type 1(0.20 W/B)
M₃SP₁-0.2 M3 + SAP Type 1 (0.2% bwob content)
M₃SP₁-0.3 M3 + SAP Type 1 (0.3% bwob content)
M₃SP₁-0.4 M3 + SAP Type 1 (0.4% bwob content)
M₃SP₂-0.2 M3 + SAP Type 2 (0.2% bwob content)
M₃SP₂-0.3 M3 + SAP Type 2 (0.3% bwob content)
M₃SP₂-0.4 M3 + SAP Type 2 (0.4% bwob content)
Ternary cements (0.25 W/B)
M₁F Reference mixture for binder Type 2 = CEM I 52.5 N (75.0%) + SF (7.5%) + FA (17.5%)
M₁FSP₁-0.2 M₁F + SAP Type 1 (0.2% bwob content)
M₁FSP₁-0.3 M₁F + SAP Type 1 (0.3% bwob content)
M₁FSP₁-0.4 M₁F + SAP Type 1 (0.4% bwob content)
M₁FSP₂-0.2 M₁F + SAP Type 2 (0.2% bwob content)
M₁FSP₂-0.3 M₁F + SAP Type 2 (0.3% bwob content)
M₁FSP₂-0.4 M₁F + SAP Type 2 (0.4% bwob content)
M₁S Reference mixture for binder Type 3 = CEM I 52.5 N (75.0%) + SF (7.5%) + CS (17.5%)
M₁SSP₁-0.2 M₁S + SAP Type 1 (0.2% bwob content)
M₁SSP₁-0.3 M₁S + SAP Type 1 (0.3% bwob content)
M₁SSP₁-0.4 M₁S + SAP Type 1 (0.4% bwob content)
M₁SSP₂-0.2 M₁S + SAP Type 2 (0.2% bwob content)
M₁SSP₂-0.3 M₁S + SAP Type 2 (0.3% bwob content)
M₁SSP₂-0.4 M₁S + SAP Type 2 (0.4% bwob content)
Stellenbosch University https://scholar.sun.ac.za

210
Table A2: SAP Absorption
time SAP1(g/g) SAP2(g/g)
(min) Water CPS Water CPS
(W/C)
5.2
(W/C)
4.3
(W/C)
3.7
(W/C)
3.1
(W/C)
2.5
(W/C)
5.2
(W/C)
4.3
(W/C)
3.7
(W/C)
3.1
(W/C)
2.5
0.5 72.34 20.11 24.45 25.63 28.81 26.69 65.80 26.61 25.12 26.77 24.04 27.03
2 170.29 20.84 22.23 23.56 26.42 26.08 180.63 31.49 25.64 26.87 24.01 28.57
5 216.17 22.59 19.99 22.59 26.95 27.09 233.95 32.02 22.85 27.15 23.98 26.37
10 228.44 24.30 21.64 24.08 22.77 27.24 258.22 33.93 24.45 27.85 23.61 24.09
15 242.00 31.64 21.02 25.08 21.93 24.07 284.49 35.80 23.96 24.41 22.99 24.14
30 253.02 35.18 22.08 24.64 21.97 25.76 292.95 36.76 23.55 23.98 23.88 24.75
60 257.07 38.14 21.94 23.30 21.42 25.68 297.54 41.85 19.93 21.75 20.79 24.42
180 260.76 41.80 23.91 22.18 20.35 22.87 298.22 48.24 19.17 22.83 22.85 21.01
Table A3: Setting Times and Strength Developments of HPC Mixtures
Setting Times
Specimen Initial Final Expression R2 R
M2 535 675 2E-24X8.8671
0.9851 0.992522
M2Sp1-0.2 615 800 2E-21X7.626
0.9951 0.997547
M2Sp1-0.3 790 1030 2E-22X7.6766
0.9748 0.98732
M2Sp1-0.4 615 840 2E-18X6.5637
0.9790 0.989444
M2Sp2-0.2 555 695 6E-25X9.0245
0.9754 0.987623
M2Sp2-0.3 585 745 3E-24X8.676
0.9747 0.987269
M2Sp2-0.4 645 805 1E-27X9.7586
0.9856 0.992774
M3 490 625 1E-22X8.3387
0.9766 0.988231
M3Sp1-0.2 595 730 6E-27X9.6518
0.9891 0.994535
M3Sp1-0.3 650 845 3E-22X7.8352
0.9370 0.967988
M3Sp1-0.4 795 945 1E-33X11.522
0.9714 0.985596
M1F 485 580 4E-31X11.534
0.9809 0.990404
M1FSp1-0.2 615 795 9E-23X8.1016
0.9775 0.988686
M1FSp1-0.3 810 1095 3E-20X6.896
0.9586 0.979081
M1FSp1-0.4 515 715 2E-17X6.3395
0.9566 0.978059
M1S 435 600 2E-16X6.1818
0.9362 0.967574
M1SSp1-0.2 730 965 2E-21X7.4311
0.9376 0.968297
M1SSp1-0.3 850 1090 6E-23X7.775
0.9509 0.975141
M1SSp1-0.4 765 965 1E-24X8.4789
0.9546 0.977036
M1SSp2-0.2 790 965 6E-29X9.9256
0.9882 0.994082
M1SSp2-0.3 765 990 3E-21X7.3207
0.8964 0.946784
M1SSp2-0.4 965 1150 5E-34X11.332
0.9564 0.977957
Stellenbosch University https://scholar.sun.ac.za

211
Appendix B: Attachments to Chapter 5
B1 Duncan Multiple Range Test Results for Early Age Properties
Table B1.1: Duncan's multiple range effect of W/B Effects on Compressive Strength
W/B N
Subset
1 2 3
0.3 84 9.297958E1
0.25 84 1.062818E2
0.2 168 1.117036E2
Sig. 1.000 1.000 1.000
Table B1.2: Duncan's multiple range effect of SAP contents on Compressive Strength
SAP contents N
Subset
1 2 3 4
0.4 96 9.476406E1
0.3 96 1.058031E2
0.2 96 1.090167E2
0 48 1.205024E2
Sig. 1.000 1.000 1.000 1.000
Table B1.3: Duncan's multiple range effect of SAP Type on Compressive Strength
SAP type N
Subset
1 2 3
1 144 1.020701E2
2 144 1.043191E2
0 48 1.205024E2
Sig. 1.000 1.000 1.000
Table B1.4: Duncan's multiple range effect of Binder Type on Compressive Strength
Binder type N
Subset
1 2 3
1 168 9.963068E1
3 84 1.101398E2
2 84 1.132674E2
Sig. 1.000 1.000 1.000
Table B1.5: Duncan's multiple range Effect of Curing Age on Compressive Strength
Curing Age N
Subset
1 2 3 4
7 84 8.180663E1
28 84 1.046660E2
56 84 1.154175E2
90 84 1.207785E2
Sig. 1.000 1.000 1.000 1.000
Means for groups in homogeneous subsets are displayed based on observed means. The error term is Mean Square (Error) = 20.617.
Stellenbosch University https://scholar.sun.ac.za

212
B2 Influence of SAP addition Compressive Strength of HPCs
Figure B2.1: Compressive strength of M2 - HPCs with SP1 on log time scale
Figure B2.2: Compressive strength of M2 - HPCs with SP2 on log time scale
Stellenbosch University https://scholar.sun.ac.za
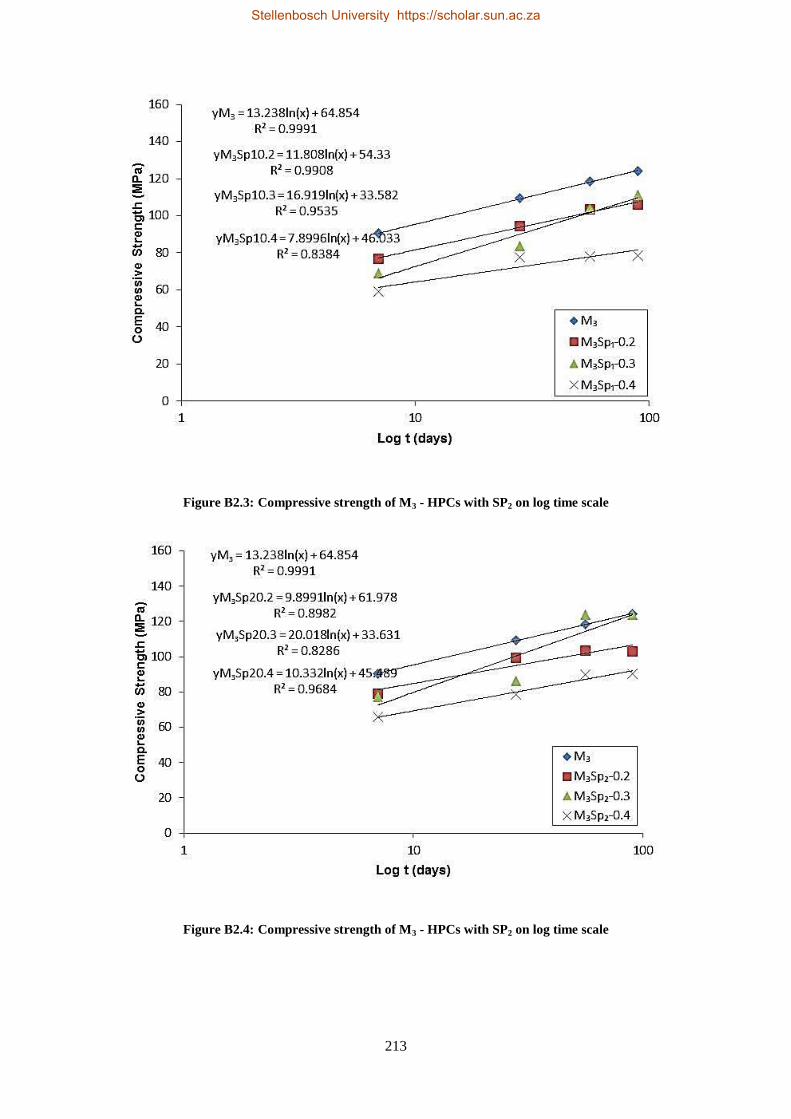
213
Figure B2.3: Compressive strength of M3 - HPCs with SP2 on log time scale
Figure B2.4: Compressive strength of M3 - HPCs with SP2 on log time scale
Stellenbosch University https://scholar.sun.ac.za
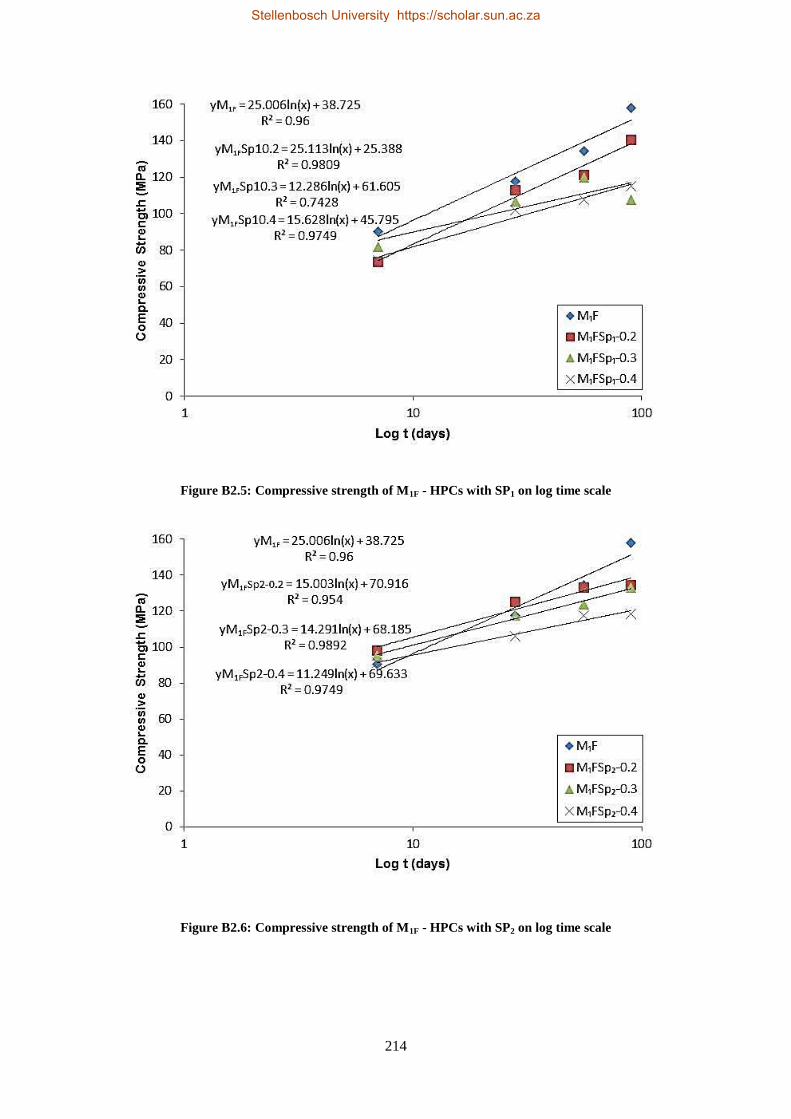
214
Figure B2.5: Compressive strength of M1F - HPCs with SP1 on log time scale
Figure B2.6: Compressive strength of M1F - HPCs with SP2 on log time scale
Stellenbosch University https://scholar.sun.ac.za

215
Figure B2.7: Compressive strength of M1S - HPCs with SP1 on log time scale
Figure B2.8: Compressive strength of M1S - HPCs with SP2 on log time scale
Stellenbosch University https://scholar.sun.ac.za

216
B3 Duncan Multiple Range Test Results for E-modulus of HPC
Table B3.1: Duncan's multiple range effect of W/B Effects on E-modulus
W/B N
Subset
1 2 3
0.3 63 4.6766911E1
0.2 126 5.0272584E1
0.25 63 5.3728611E1
Sig. 1.000 1.000 1.000
Table B3.2: Duncan's multiple range effect for SAP content Effects on E-modulus
SAP content N
Subset
1 2 3
0.4 72 4.8979484E1
0.3 72 5.0179033E1
0.2 72 5.0351677E1
0 36 5.2800817E1
Sig. 1.000 .641 1.000
Table B3.3: Duncan's multiple range effect of SAP type Effects on E-modulus
SAP type N
Subset
1 2
1 108 4.9528370E1
2 108 5.0145094E1
0 36 5.2800817E1
Sig. .079 1.000
Table B3.4: Duncan's multiple range effect of Binder type Effects on E-modulus
Binder type N
Subset
1 2 3
3 63 4.8245208E1
1 126 5.0247761E1
2 63 5.2299960E1
Sig. 1.000 1.000 1.000
Table B3.5: Duncan's Multiple Range effect of Curing Age Effects on E-modulus
Curing Age N
Subset
1 2 3
90 84 4.7186068E1
56 84 4.7857662E1
28 84 5.5736787E1
Sig. 1.000 1.000 1.000
Means for groups in homogeneous subsets are displayed based on observed means.
The error term is Mean Square (Error) = 3.934.
Stellenbosch University https://scholar.sun.ac.za

217
B4 Duncan Multiple range Test for Fracture Energy
Table B4.1: Duncana,b,c
multiple range test on Fracture Energy with W/B
W/B N Subset
1
.20 95 151.8160
.25 56 153.0893
.30 52 153.2626
Sig. .706
Table B4.2: Duncana,b,c
multiple range test on Fracture Energy with SAP content
SAP content N Subset
1 2
0 54 146.7170 0 60 151.7014 151.7014 0 28 155.2023 155.2023
0 61 157.2903
Sig. .056 .211
Table B4.3: Duncana,b,c
multiple range test on Fracture Energy with SAP type
SAP Type N
Subset
1
2 84 148.9072 1 91 155.0693 0 28 155.2023
Sig. .136
Table B4.4: Duncan
a,b,c multiple range test on Fracture Energy with Binder Type
Binder Type N Subset
1 2 3
2 50 142.3822 1 108 153.1727 3 45 162.2980
Sig. 1.000 1.000 1.000
Table B4.5: Duncan
a,b,c multiple range test on Fracture Energy with Curing Age
Curing Age N
Subset
1
28 66 150.6234 56 62 153.1797 90 75 153.6919
Sig. .407
Means for groups in homogeneous subsets are displayed based on observed means. The error term is Mean Square (Error) = 400.581. a. Uses Harmonic Mean Sample Size = 63.006. b. The group sizes are unequal. The harmonic mean of the group sizes is used. Type I error levels are not guaranteed. c. Alpha = 0.05.
Stellenbosch University https://scholar.sun.ac.za
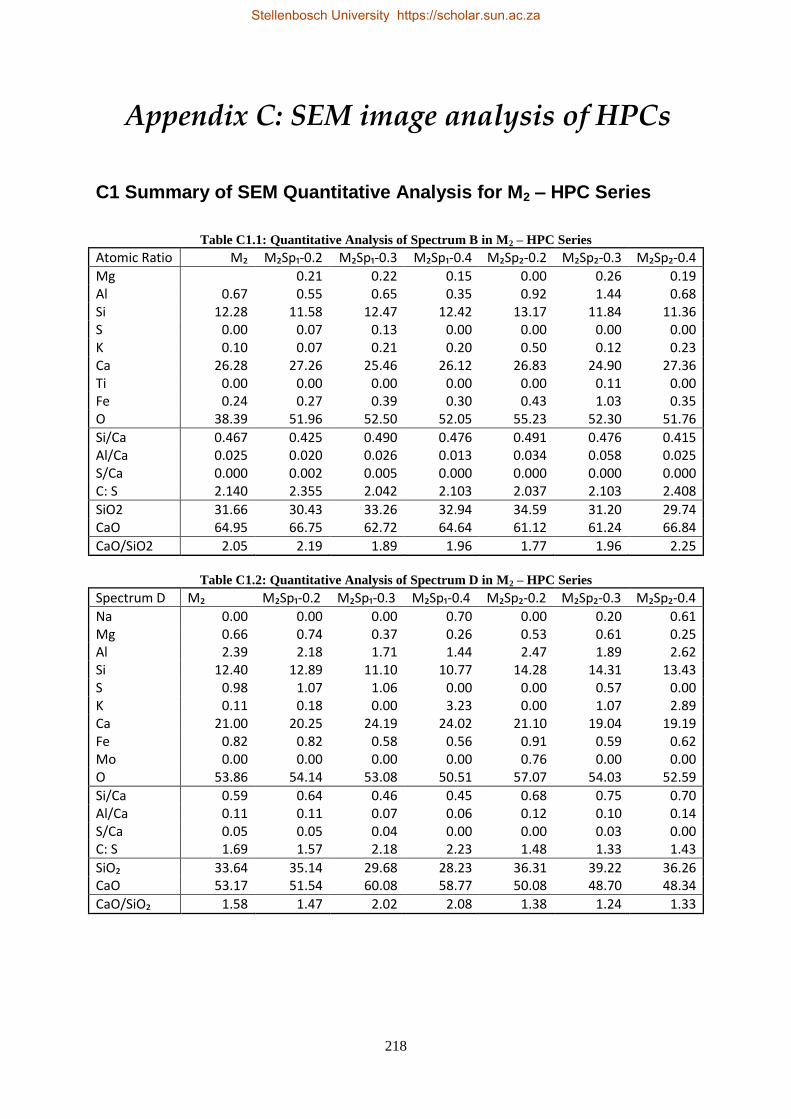
218
Appendix C: SEM image analysis of HPCs
C1 Summary of SEM Quantitative Analysis for M2 – HPC Series
Table C1.1: Quantitative Analysis of Spectrum B in M2 – HPC Series
Atomic Ratio M₂ M₂Sp₁-0.2 M₂Sp₁-0.3 M₂Sp₁-0.4 M₂Sp₂-0.2 M₂Sp₂-0.3 M₂Sp₂-0.4
Mg
0.21 0.22 0.15 0.00 0.26 0.19 Al 0.67 0.55 0.65 0.35 0.92 1.44 0.68 Si 12.28 11.58 12.47 12.42 13.17 11.84 11.36 S 0.00 0.07 0.13 0.00 0.00 0.00 0.00 K 0.10 0.07 0.21 0.20 0.50 0.12 0.23 Ca 26.28 27.26 25.46 26.12 26.83 24.90 27.36 Ti 0.00 0.00 0.00 0.00 0.00 0.11 0.00 Fe 0.24 0.27 0.39 0.30 0.43 1.03 0.35 O 38.39 51.96 52.50 52.05 55.23 52.30 51.76
Si/Ca 0.467 0.425 0.490 0.476 0.491 0.476 0.415 Al/Ca 0.025 0.020 0.026 0.013 0.034 0.058 0.025 S/Ca 0.000 0.002 0.005 0.000 0.000 0.000 0.000 C: S 2.140 2.355 2.042 2.103 2.037 2.103 2.408
SiO2 31.66 30.43 33.26 32.94 34.59 31.20 29.74 CaO 64.95 66.75 62.72 64.64 61.12 61.24 66.84
CaO/SiO2 2.05 2.19 1.89 1.96 1.77 1.96 2.25
Table C1.2: Quantitative Analysis of Spectrum D in M2 – HPC Series
Spectrum D M₂ M₂Sp₁-0.2 M₂Sp₁-0.3 M₂Sp₁-0.4 M₂Sp₂-0.2 M₂Sp₂-0.3 M₂Sp₂-0.4
Na 0.00 0.00 0.00 0.70 0.00 0.20 0.61 Mg 0.66 0.74 0.37 0.26 0.53 0.61 0.25 Al 2.39 2.18 1.71 1.44 2.47 1.89 2.62 Si 12.40 12.89 11.10 10.77 14.28 14.31 13.43 S 0.98 1.07 1.06 0.00 0.00 0.57 0.00 K 0.11 0.18 0.00 3.23 0.00 1.07 2.89 Ca 21.00 20.25 24.19 24.02 21.10 19.04 19.19 Fe 0.82 0.82 0.58 0.56 0.91 0.59 0.62 Mo 0.00 0.00 0.00 0.00 0.76 0.00 0.00 O 53.86 54.14 53.08 50.51 57.07 54.03 52.59
Si/Ca 0.59 0.64 0.46 0.45 0.68 0.75 0.70 Al/Ca 0.11 0.11 0.07 0.06 0.12 0.10 0.14 S/Ca 0.05 0.05 0.04 0.00 0.00 0.03 0.00 C: S 1.69 1.57 2.18 2.23 1.48 1.33 1.43
SiO₂ 33.64 35.14 29.68 28.23 36.31 39.22 36.26 CaO 53.17 51.54 60.08 58.77 50.08 48.70 48.34
CaO/SiO₂ 1.58 1.47 2.02 2.08 1.38 1.24 1.33
Stellenbosch University https://scholar.sun.ac.za
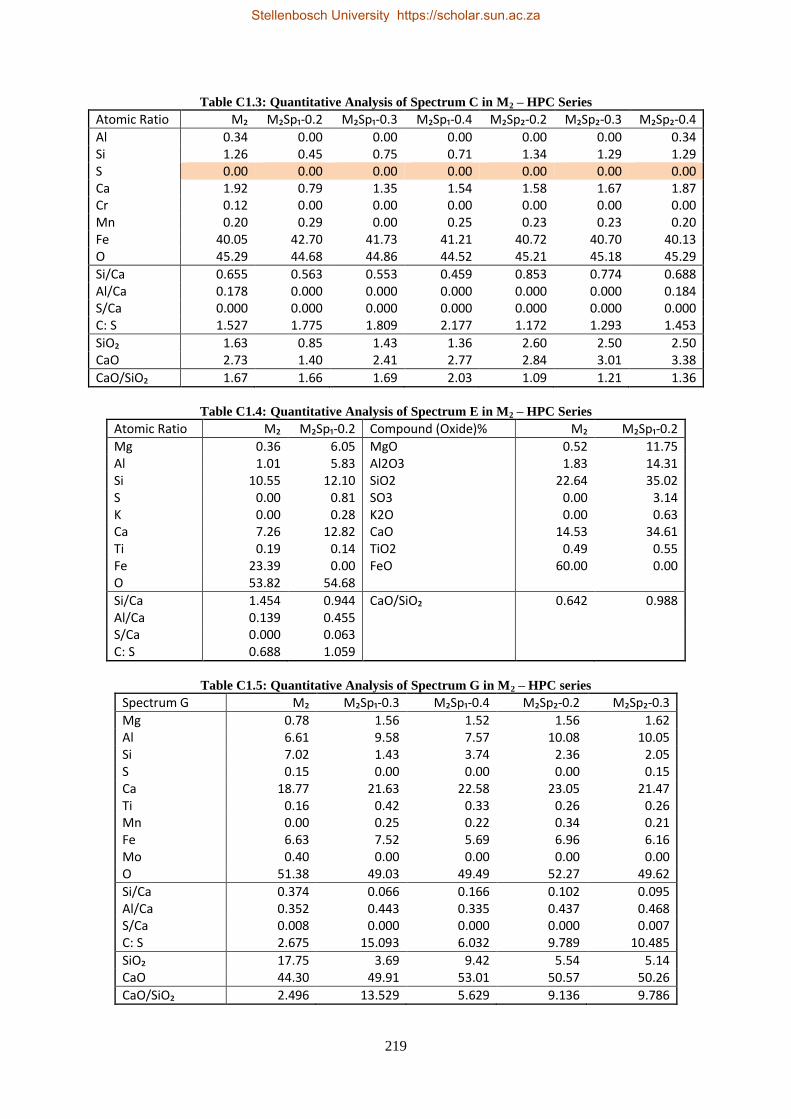
219
Table C1.3: Quantitative Analysis of Spectrum C in M2 – HPC Series
Atomic Ratio M₂ M₂Sp₁-0.2 M₂Sp₁-0.3 M₂Sp₁-0.4 M₂Sp₂-0.2 M₂Sp₂-0.3 M₂Sp₂-0.4
Al 0.34 0.00 0.00 0.00 0.00 0.00 0.34 Si 1.26 0.45 0.75 0.71 1.34 1.29 1.29 S 0.00 0.00 0.00 0.00 0.00 0.00 0.00 Ca 1.92 0.79 1.35 1.54 1.58 1.67 1.87 Cr 0.12 0.00 0.00 0.00 0.00 0.00 0.00 Mn 0.20 0.29 0.00 0.25 0.23 0.23 0.20 Fe 40.05 42.70 41.73 41.21 40.72 40.70 40.13 O 45.29 44.68 44.86 44.52 45.21 45.18 45.29
Si/Ca 0.655 0.563 0.553 0.459 0.853 0.774 0.688 Al/Ca 0.178 0.000 0.000 0.000 0.000 0.000 0.184 S/Ca 0.000 0.000 0.000 0.000 0.000 0.000 0.000 C: S 1.527 1.775 1.809 2.177 1.172 1.293 1.453
SiO₂ 1.63 0.85 1.43 1.36 2.60 2.50 2.50 CaO 2.73 1.40 2.41 2.77 2.84 3.01 3.38
CaO/SiO₂ 1.67 1.66 1.69 2.03 1.09 1.21 1.36
Table C1.4: Quantitative Analysis of Spectrum E in M2 – HPC Series
Atomic Ratio M₂ M₂Sp₁-0.2 Compound (Oxide)% M₂ M₂Sp₁-0.2
Mg 0.36 6.05 MgO 0.52 11.75 Al 1.01 5.83 Al2O3 1.83 14.31 Si 10.55 12.10 SiO2 22.64 35.02 S 0.00 0.81 SO3 0.00 3.14 K 0.00 0.28 K2O 0.00 0.63 Ca 7.26 12.82 CaO 14.53 34.61 Ti 0.19 0.14 TiO2 0.49 0.55 Fe 23.39 0.00 FeO 60.00 0.00 O 53.82 54.68
Si/Ca 1.454 0.944 CaO/SiO₂ 0.642 0.988 Al/Ca 0.139 0.455
S/Ca 0.000 0.063
C: S 0.688 1.059
Table C1.5: Quantitative Analysis of Spectrum G in M2 – HPC series
Spectrum G M₂ M₂Sp₁-0.3 M₂Sp₁-0.4 M₂Sp₂-0.2 M₂Sp₂-0.3
Mg 0.78 1.56 1.52 1.56 1.62 Al 6.61 9.58 7.57 10.08 10.05 Si 7.02 1.43 3.74 2.36 2.05 S 0.15 0.00 0.00 0.00 0.15 Ca 18.77 21.63 22.58 23.05 21.47 Ti 0.16 0.42 0.33 0.26 0.26 Mn 0.00 0.25 0.22 0.34 0.21 Fe 6.63 7.52 5.69 6.96 6.16 Mo 0.40 0.00 0.00 0.00 0.00 O 51.38 49.03 49.49 52.27 49.62
Si/Ca 0.374 0.066 0.166 0.102 0.095 Al/Ca 0.352 0.443 0.335 0.437 0.468 S/Ca 0.008 0.000 0.000 0.000 0.007 C: S 2.675 15.093 6.032 9.789 10.485
SiO₂ 17.75 3.69 9.42 5.54 5.14 CaO 44.30 49.91 53.01 50.57 50.26
CaO/SiO₂ 2.496 13.529 5.629 9.136 9.786
Stellenbosch University https://scholar.sun.ac.za
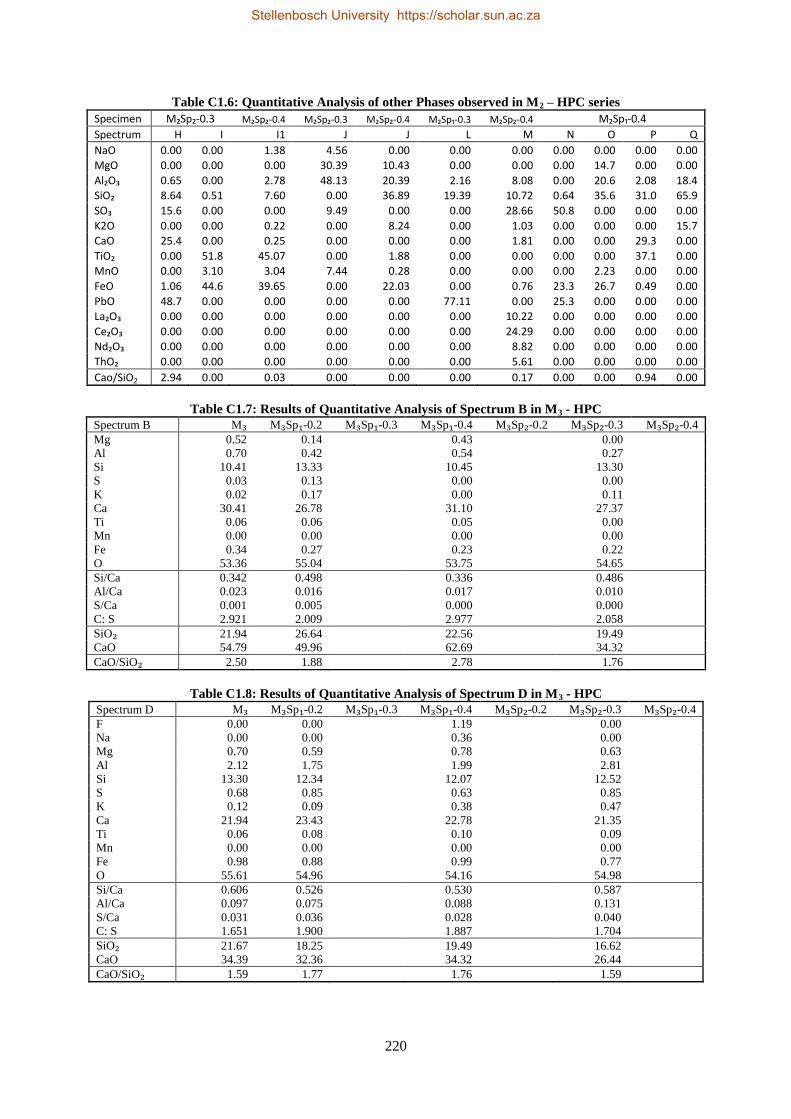
220
Table C1.6: Quantitative Analysis of other Phases observed in M2 – HPC series
Specimen M₂Sp₂-0.3 M₂Sp₂-0.4 M₂Sp₂-0.3 M₂Sp₂-0.4 M₂Sp₁-0.3 M₂Sp₂-0.4 M₂Sp₁-0.4
Spectrum H I I1 J J L M N O P Q
NaO 0.00 0.00 1.38 4.56 0.00 0.00 0.00 0.00 0.00 0.00 0.00
MgO 0.00 0.00 0.00 30.39 10.43 0.00 0.00 0.00 14.7 0.00 0.00
Al₂O₃ 0.65 0.00 2.78 48.13 20.39 2.16 8.08 0.00 20.6 2.08 18.4
SiO₂ 8.64 0.51 7.60 0.00 36.89 19.39 10.72 0.64 35.6 31.0 65.9
SO₃ 15.6 0.00 0.00 9.49 0.00 0.00 28.66 50.8 0.00 0.00 0.00
K2O 0.00 0.00 0.22 0.00 8.24 0.00 1.03 0.00 0.00 0.00 15.7
CaO 25.4 0.00 0.25 0.00 0.00 0.00 1.81 0.00 0.00 29.3 0.00
TiO₂ 0.00 51.8 45.07 0.00 1.88 0.00 0.00 0.00 0.00 37.1 0.00
MnO 0.00 3.10 3.04 7.44 0.28 0.00 0.00 0.00 2.23 0.00 0.00
FeO 1.06 44.6 39.65 0.00 22.03 0.00 0.76 23.3 26.7 0.49 0.00
PbO 48.7 0.00 0.00 0.00 0.00 77.11 0.00 25.3 0.00 0.00 0.00
La₂O₃ 0.00 0.00 0.00 0.00 0.00 0.00 10.22 0.00 0.00 0.00 0.00
Ce₂O₃ 0.00 0.00 0.00 0.00 0.00 0.00 24.29 0.00 0.00 0.00 0.00
Nd₂O₃ 0.00 0.00 0.00 0.00 0.00 0.00 8.82 0.00 0.00 0.00 0.00
ThO₂ 0.00 0.00 0.00 0.00 0.00 0.00 5.61 0.00 0.00 0.00 0.00
Cao/SiO2 2.94 0.00 0.03 0.00 0.00 0.00 0.17 0.00 0.00 0.94 0.00
Table C1.7: Results of Quantitative Analysis of Spectrum B in M3 - HPC
Spectrum B M₃ M₃Sp₁-0.2 M₃Sp₁-0.3 M₃Sp₁-0.4 M₃Sp₂-0.2 M₃Sp₂-0.3 M₃Sp₂-0.4
Mg 0.52 0.14
0.43
0.00
Al 0.70 0.42
0.54
0.27
Si 10.41 13.33
10.45
13.30
S 0.03 0.13
0.00
0.00
K 0.02 0.17
0.00
0.11
Ca 30.41 26.78
31.10
27.37
Ti 0.06 0.06
0.05
0.00
Mn 0.00 0.00
0.00
0.00
Fe 0.34 0.27
0.23
0.22
O 53.36 55.04 53.75 54.65
Si/Ca 0.342 0.498
0.336
0.486
Al/Ca 0.023 0.016
0.017
0.010
S/Ca 0.001 0.005
0.000
0.000
C: S 2.921 2.009 2.977 2.058
SiO₂ 21.94 26.64
22.56
19.49
CaO 54.79 49.96 62.69 34.32
CaO/SiO₂ 2.50 1.88 2.78 1.76
Table C1.8: Results of Quantitative Analysis of Spectrum D in M3 - HPC
Spectrum D M₃ M₃Sp₁-0.2 M₃Sp₁-0.3 M₃Sp₁-0.4 M₃Sp₂-0.2 M₃Sp₂-0.3 M₃Sp₂-0.4
F 0.00 0.00
1.19
0.00
Na 0.00 0.00
0.36
0.00
Mg 0.70 0.59
0.78
0.63
Al 2.12 1.75
1.99
2.81
Si 13.30 12.34
12.07
12.52
S 0.68 0.85
0.63
0.85
K 0.12 0.09
0.38
0.47
Ca 21.94 23.43
22.78
21.35
Ti 0.06 0.08
0.10
0.09
Mn 0.00 0.00
0.00
0.00
Fe 0.98 0.88
0.99
0.77
O 55.61 54.96 54.16 54.98
Si/Ca 0.606 0.526
0.530
0.587
Al/Ca 0.097 0.075
0.088
0.131
S/Ca 0.031 0.036
0.028
0.040
C: S 1.651 1.900 1.887 1.704
SiO₂ 21.67 18.25
19.49
16.62
CaO 34.39 32.36 34.32 26.44
CaO/SiO₂ 1.59 1.77 1.76 1.59
Stellenbosch University https://scholar.sun.ac.za
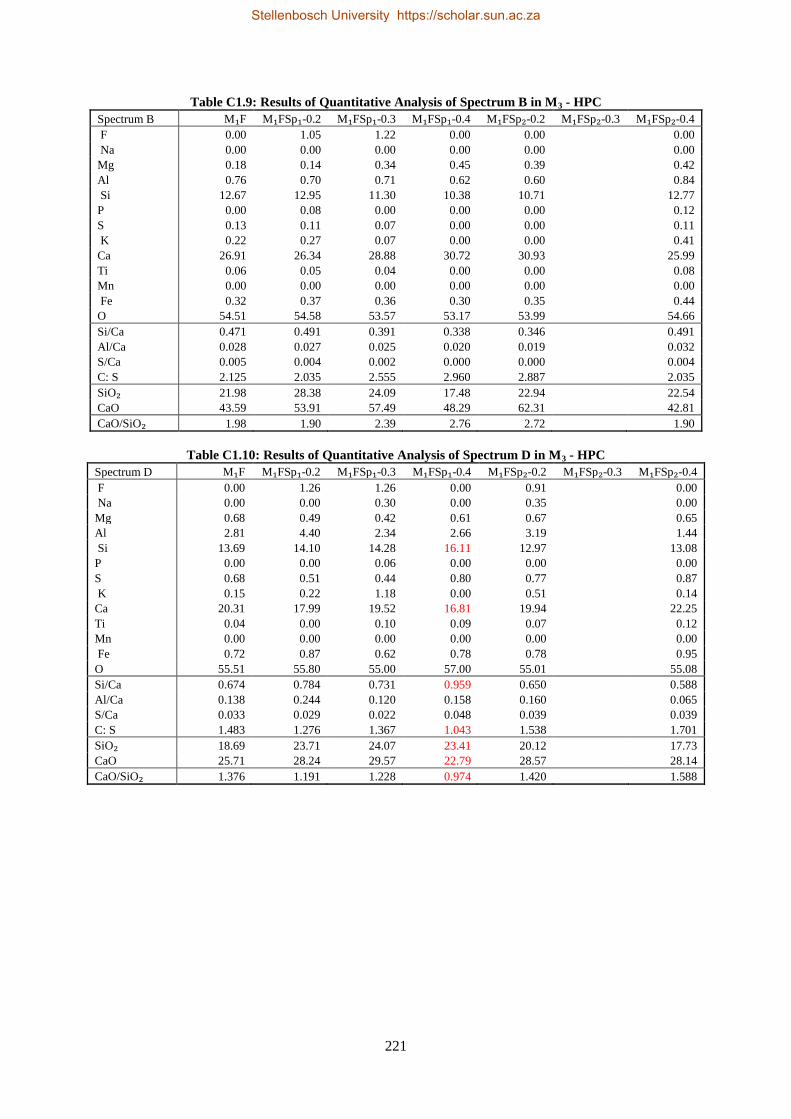
221
Table C1.9: Results of Quantitative Analysis of Spectrum B in M3 - HPC
Spectrum B M₁F M₁FSp₁-0.2 M₁FSp₁-0.3 M₁FSp₁-0.4 M₁FSp₂-0.2 M₁FSp₂-0.3 M₁FSp₂-0.4
F 0.00 1.05 1.22 0.00 0.00
0.00
Na 0.00 0.00 0.00 0.00 0.00
0.00
Mg 0.18 0.14 0.34 0.45 0.39
0.42
Al 0.76 0.70 0.71 0.62 0.60
0.84
Si 12.67 12.95 11.30 10.38 10.71
12.77
P 0.00 0.08 0.00 0.00 0.00
0.12
S 0.13 0.11 0.07 0.00 0.00
0.11
K 0.22 0.27 0.07 0.00 0.00
0.41
Ca 26.91 26.34 28.88 30.72 30.93
25.99
Ti 0.06 0.05 0.04 0.00 0.00
0.08
Mn 0.00 0.00 0.00 0.00 0.00
0.00
Fe 0.32 0.37 0.36 0.30 0.35
0.44
O 54.51 54.58 53.57 53.17 53.99 54.66
Si/Ca 0.471 0.491 0.391 0.338 0.346
0.491
Al/Ca 0.028 0.027 0.025 0.020 0.019
0.032
S/Ca 0.005 0.004 0.002 0.000 0.000
0.004
C: S 2.125 2.035 2.555 2.960 2.887 2.035
SiO₂ 21.98 28.38 24.09 17.48 22.94
22.54
CaO 43.59 53.91 57.49 48.29 62.31
42.81
CaO/SiO₂ 1.98 1.90 2.39 2.76 2.72 1.90
Table C1.10: Results of Quantitative Analysis of Spectrum D in M3 - HPC
Spectrum D M₁F M₁FSp₁-0.2 M₁FSp₁-0.3 M₁FSp₁-0.4 M₁FSp₂-0.2 M₁FSp₂-0.3 M₁FSp₂-0.4
F 0.00 1.26 1.26 0.00 0.91
0.00
Na 0.00 0.00 0.30 0.00 0.35
0.00
Mg 0.68 0.49 0.42 0.61 0.67
0.65
Al 2.81 4.40 2.34 2.66 3.19
1.44
Si 13.69 14.10 14.28 16.11 12.97
13.08
P 0.00 0.00 0.06 0.00 0.00
0.00
S 0.68 0.51 0.44 0.80 0.77
0.87
K 0.15 0.22 1.18 0.00 0.51
0.14
Ca 20.31 17.99 19.52 16.81 19.94
22.25
Ti 0.04 0.00 0.10 0.09 0.07
0.12
Mn 0.00 0.00 0.00 0.00 0.00
0.00
Fe 0.72 0.87 0.62 0.78 0.78
0.95
O 55.51 55.80 55.00 57.00 55.01 55.08
Si/Ca 0.674 0.784 0.731 0.959 0.650
0.588
Al/Ca 0.138 0.244 0.120 0.158 0.160
0.065
S/Ca 0.033 0.029 0.022 0.048 0.039
0.039
C: S 1.483 1.276 1.367 1.043 1.538 1.701
SiO₂ 18.69 23.71 24.07 23.41 20.12
17.73
CaO 25.71 28.24 29.57 22.79 28.57
28.14
CaO/SiO₂ 1.376 1.191 1.228 0.974 1.420 1.588
Stellenbosch University https://scholar.sun.ac.za
Top Related