


Languages
Pages
Legal


The Impact of Unallocated Equity on Agricultural Cooperatives
Invited Paper Prepared for
Farm Credit Council Coordinating Committee
Revised 11-19-2014
Phil Kenkel Regents Professor and Bill Fitzwater Cooperative Chair Oklahoma State University [email protected]

The Impact of Unallocated Equity on Agricultural Cooperatives
Introduction
The term “unallocated equity” is unique to the cooperative firm. From an accounting
standpoint, unallocated equity is similar or perhaps synonymous, with the standard equity
category of retained earnings. Due to the nature of equity and profit distribution, unallocated
equity raises unique issues for cooperatives. In recent years unallocated equity has become a
larger share of total equity for many traditional open membership agricultural cooperatives. For
some cooperatives, the change in equity structure has been quite extreme. This equity change
has led to a discussion of the reasons for the increase, the impacts of unallocated equity on the
cooperative and on the members return from the cooperative, and whether higher levels of
unallocated equity increases the risks of liquidation of the cooperative. At a more fundamental
level, the shift to unallocated equity raises questions as to whether this financial structure is
consistent with the basic cooperative principles. This paper explores these issues and brings
insights from a national survey of cooperative participants.
Background on Cooperative Finance
A cooperative is unique in that it distributes profits to its users in proportion to the
volume of business conducted with the firm. This distribution is referred to as a patronage
refund or patronage distribution and is a fundamental cooperative principle. This structure is in
contrast to that of investor-owned firms where profits are distributed in proportion to ownership.
This profit distribution structure creates a number of unique features of the cooperative firm.
One of these unique features is the method by which cooperatives acquire equity capital.

While there are minor variations in structure, the traditional open membership is used by
over 2,000 agricultural supply and grain marketing cooperatives across the U.S. as well as most
dairy and cotton cooperatives (Cook and Chaddad, 2006). These cooperatives are often described
as open membership cooperatives because producers can join at any time. In order to become a
voting member and receive patronage from the cooperative, a producer has to purchase a
membership share which is often a fairly trivial investment of $50-$100. Traditional open
membership cooperatives create or accumulate the majority of their equity by retaining profits.
In the traditional open membership cooperative most of the equity is created by retaining
profits. This is accomplished in three ways: (1) Retaining a portion of patronage refunds and
issuing equity shares to members instead of cash patronage, (2) Retaining profits from member
business, paying corporate taxes on the profits and retaining the after-tax portion as unallocated
reserves (retaining earnings) and (3) Retaining profits from nonmember business, paying
corporate taxes on the profits and retaining the after tax portion as unallocated reserves (Chaddad
and Cook, 2006). Profit distribution and retention decisions are at the discretion of the board of
directors and impact the cooperative’s balance sheet and cash flow as well as the members
realized return from the cooperative.
The equity shares which are issued in the first of profit retention strategies described
above are generally referred to as “revolving equity.” This equity is not tradeable but is instead
redeemed by the cooperative at its original book value at some later period in time. Cooperatives
use a number of different systems for redeeming equity including systems based on the year the
stock was issued, the age of the patron, a percentage pool and other criteria. The average
agricultural cooperative revolves equity on an 18 year basis (Cook and Chaddad, 2006). Because
the equity is redeemed at book value, the payment that the member receives reflects the profit

distribution from a previous year and is not impacted by the growth of the firm or the current
value of the firm. Because unallocated equity does not revolve, the member never receives the
profits which were retained as unallocated equity unless the cooperative is dissolved or sold.
Cook and Iliopoulos (2000) discuss these issues in the context of what they describe as ill-
defined property rights in U.S. cooperatives.
There are alternative cooperatives structures with different equity systems. These
include the closed cooperative structure, often referred to as “New Generation Cooperatives” and
non-stock cooperatives that accumulate capital through a system of per-unit retains (Cook and
Chaddad, 2006). The issues we discuss with regard to unallocated equity are not as prevalent in
those cooperative structures.
The Growth of Unallocated Equity
The ratio of unallocated equity to total equity has clearly increased over time. From 1954
to 1976 the ratio of unallocated equity to total equity increased from 12% to 15%. (Griffin,
1980). Royer (1992) reported that 21% of cooperative equity was in the form on unallocated
equity in 1987. Reynolds (2013) reported that the ratio for the median U.S. farmer cooperative
increased from 30% in 2003, to 41% in 2011. The median level of allocated equity is more
representative because some cooperatives distribute all profits to cash patronage and allocated
equity and have zero unallocated equity (Reynolds, 2013). Unfortunately the median levels of
unallocated equity are not available in published statistics. Current levels of unallocated equity
vary across types of cooperatives and by the size of cooperative. The most recent USDA
Cooperative Statistics (2012) indicate that the average level of unallocated equity is a little over

3% of total equity for dairy cooperatives and almost 63% for the largest size category of grain
marketing and farm supply cooperatives (Figure 1).
The ratio also tends to increase with the size of the cooperative (Figure 2). The
prevalence of dairy cooperatives (which have very low levels of unallocated equity) in the
highest size category, somewhat distorts the picture. Boland (2012) examined cooperatives in
CoBank’s database for the 1996 to 2010 period subdivided by profitability. He found a similar
trend with respect to profitability with the highest profitability quartile having a ratio of
unallocated to total equity more than twice that of the lowest quartile. Since larger cooperatives
tend to be more profitable, the relationships may be related.
3%11%
38%46%
53%63%
DairyMarketing
CottonGinning
Biofuels Fruit andVegetable
FarmSupply
GrainMarkeingand Farm
Supply
Unallocated Equity as a Percent of Total Equity-2012
Figure 1: Ratio of Unallocated to Total Equity for Various Types of Agricultural Cooperatives

Most of the change in the ratio of unallocated equity to total equity for US agricultural
cooperatives has occurred over the last 5 years. The increase is particularly dramatic for grain
marketing and supply cooperatives, which are the dominant category of cooperatives over much
of the central US. The level of unallocated equity in large grain and farm supply cooperatives
has almost doubled during the 2008 to 2012 period (Figure 3). An explanation for the increase in
this important category of cooperatives is provided later in this paper.
27%32%
42%50%
27%
45% 41%47% 51%
63%
<$5M $5m-$15M $15M-$100M $100M-$500M > $500M
Unallocated Equity as Percent of Total Equity-2012
All Cooperatives Grain and Farm Supply
Figure 2: Ratio of Unallocated Equity to Total Equity by Size of Cooperative

The Rationale for Unallocated Equity
Unallocated equity serves several important functions. Anytime a firm experiences a
loss some equity account on the balance sheet must be reduced. The revolving stock on the
cooperative balance sheet is maintained at book value with the expectation that it will eventually
be redeemed. In the absence of any unallocated equity, the book value of the allocated equity
would have to be adjusted when the cooperative experienced a loss. This requires notifying all
of the patrons of the stock value write down which may also have tax effects at the farm level.
Cooperative leaders typically want to avoid stock write-downs both due to the recordkeeping
issues and the negative perception on the value of holding cooperative equity. Unallocated
equity provides a cushion that can be reduced in the event of an operating loss and therefore
avoiding a stock write down. Based on this criterion, auditors and other consultants often
recommend that cooperatives maintain sufficient unallocated equity to cover an operating loss
32% 32% 32%36% 36%33%
40%
56% 56%63%
2008 2009 2010 2011 2012
Unallocated Equity as a Percent of Total Equity 2008-2012All Cooperatives Grain and Farm Supply
Figure 3: Changes in Ratio of Unallocated Equity to Total Equity

that would be reasonably expected in the normal cycle of business. This level would obviously
be firm specific but is likely in the range of 15-20% of total equity.
Another rationale, or at least an explanation, for unallocated reserves is nonmember
business. Under Sub-Chapter T of the IRS tax code a cooperative can deduct patronage
distributions (both cash and equity) from their taxable income. Except for cooperatives
qualifying for section 521 tax status, non-patronage income cannot be distributed to patrons as
part of a deductible patronage dividend and therefore is included in cooperative taxable income.
Patrons who receive distributions of non-patronage income generally must include these
distributions in their taxable income as well. Thus, many cooperatives find it sensible to retain
non-patronage income remaining after income tax as unallocated equity
Cooperative tax code and federal and state cooperative statues limit nonmember business
to less than 50% of total business. The level of nonmember business varies drastically across
cooperatives. In the case of grain and farm supply cooperatives (where the ratio of unallocated
to total equity has been increasing) nonmember business is often 5-10% o total business volume
and is unlikely to be driving high levels of unallocated equity.
Unallocated Equity as Permanent Capital
Another function of unallocated equity is as permanent equity in the capital structure.
Traditional U.S, farmer cooperatives have relied on revolving equity for a major part of member
investment. As the name implies, revolving capital is eventually paid back to the members so it
is not regarded as permanent capital. There are various definitions, but permanent capital is
generally considered equity which is not redeemed to members. Unallocated equity is the most
common category of permanent capital. Direct investment capital, i.e. the share of stock
purchased as a condition of membership is generally classified as permanent capital even though
it is usually redeemed when a member ceases farming or dies. Direct investment is not a
significant category of equity in traditional open membership cooperatives. Cooperatives can
also create permanent capital by selling dividend-bearing preferred stock to members and to the
public. Historically, that strategy has only been pursued by a few regional cooperatives.
Chaddad and Cook (2006) observe that redeeming capital to members is a continuing
challenge for cooperative management. They conclude that the need for permanent capital has
led to a trend of increasing the percentage of unallocated equity. Dahlgren (2007) makes a
similar argument focusing on the cash flows and ultimately earnings that a cooperative firm has
to make to redeem equity. He maintains that this gives a cooperative a higher financial burden
relative to a non-cooperative firm. Dahlgren (2007) proposes increased permanent equity as a
means of reducing the cash flow burden of equity redemption. Bradley (1972) advocated
replacing revolving funds with permanent unallocated equity. His argument was that investor
owned corporations accumulate retained earnings without an obligation to redeem them which
gives them an advantage over cooperatives. Ryan (1981) argued that lenders preferred
unallocated equity because there was no implied redemption and that a cooperative with a high
ratio of unallocated equity could acquire more leverage relative to one relying on allocated
equity.
Increased volatility of agricultural commodity and input markets has contributed to
arguments for increasing equity in general, and permanent equity in particular. During the 2008
commodity boom, grain and farm supply cooperatives had to greatly increase their seasonal lines
of credit in order to finance grain purchases, input inventories and margin calls. In many cases
seasonal loan requirements doubled relative to previous years. Cooperative lenders (primarily
CoBank) responded to the financing needs but also encouraged cooperatives to increase their
equity capitalization levels. Many lenders also pushed for more permanent capital, perceiving it
as a logical solution to a continuing need for higher equity levels.
A counterpoint could be made that all equity in a cooperative can be as permanent as
necessary. Boland and Barton (2013) describe a system of balance sheet management which
they characterize as “a commonly accepted principle of cooperative finance.” The premise of
this structure is that Boards of Directors are fiduciaries first to the cooperative and are
responsible for maintaining its financial stability. The cooperative’s Board of Directors makes
the decisions on revolving equity and retaining funds from current profits. Under the concept of
balance sheet management, they should use that discretion to adjust the timing of equity
redemption subject to the liquidity and leverage targets for the cooperative. Higher levels of
permanent capital reduce this need for discipline on the part of the Board of Directors in
managing the cooperative balance sheet. However, the Board of Directors can also maintain the
desired financial structure with a disciplined approach to profit retention and equity redemption.
The challenge of applying this discipline should not be trivialized since members expecting
equity redemption can be both dissatisfied and vocal.
Regardless of whether increased permanent capital is necessary for managing the
cooperative balance sheet, cooperative leaders can decide that they prefer that equity structure.
A shift toward more permanent capital does appear to be occurring. Figure 4 illustrates the
equity/asset ratio for large grain marketing and farm supply cooperatives versus the ratio of
unallocated to total equity. The portion of unallocated equity increased dramatically while the
ratio of equity to assets grew only moderately. A similar trend is evident examining the data of
all U.S. agricultural cooperatives but it is much more moderate. In general, it doesn’t appear that

agricultural cooperatives are increasing unallocated equity as a strategy to increase total equity.
They appear to be substituting unallocated equity for allocated equity in their capital structures.
Impact on Cash Patronage and Equity Redemption
Proponents for shifting profit retention from allocated to unallocated equity often
maintain that the shift can reduce the equity revolving period and/or improve cash patronage.
Those statements are not incorrect but they fail to tell the entire story. In the cooperative
financial model profit distribution, equity management and capital structure are interrelated.
However these alternative uses for cooperative’s cash flow are also a zero sum game. If the
rationale for retaining funds as unallocated equity is, as Cook and Chaddad (2006) or Dahlgren
(2007) suggest, improving the cooperative’s cash flows, then cash flows to the members must
decrease. Other factors equal, if the cooperative wants to retain more cash it cannot distribute a
larger dollar amount of cash patronage.
0%10%20%30%40%50%60%70%
2008 2009 2010 2011 2012
Changes in Equity Structure of Grain and Farm Supply Cooperatives
Equity/Assets Unallocated/Total equity
Figure 4: Changes in Equity Structure of Grain and Farm Supply Cooperatives

Retaining funds as unallocated equity can increase the after tax portion of cash patronage.
If, as has historically been the case, the cooperative retains funds by issuing qualified allocated
patronage, the member must include the allocated equity in their current year’s taxable income.
Their effective cash patronage is therefore decreased by the tax obligations on both the cash and
stock patronage. If the cooperative shifts from retaining funds as qualified allocated equity to
unallocated equity the member current tax burden is decreased. That provides a greater after tax
cash flow in the year of distribution. The cost of that higher current year cash flow is giving up
the eventual cash flows from equity redemption. Because profits retained as unallocated equity
remain in the cooperative’s taxable income, that strategy increases the cooperative’s taxes. In
order to be cash flow neutral the amount of cash patronage must be reduced. The member is
receiving less total cash, but with lower tax obligations and giving up future equity redemption
payments. Cooperative members with short time horizons might prefer the higher after tax cash
flow in the current year.
The possibility of a shorter equity revolving period must also be carefully examined. By
issuing a smaller amount of equity the cooperative may be able to redeem it over a shorter cycle.
However the equity redemption budget, i.e. the total amount of redemption cash going to
members, cannot increase without decreasing either the cooperative’s cash flow or the cash
patronage. The member’s net present value from future equity redemption payments is unlikely
to be increased by directing a greater portion of profits to unallocated reserves. Present value
arguments aside, a shorter equity redemption period would tend to keep ownership more
proportional to use. Most members would also likely prefer a smaller equity amount redeemed
over shorter period even if it was equivalent from a present value perspective to receiving a

larger redemption over a longer time frame. There is always the risk that the cooperative will not
be in operation or not be profitable in the year when a future redemption is forecast.
Kenkel, Boland and Barton (2014) used a simulation approach with data from a case
study cooperative to analyze alternative profit distribution strategies. They concluded that
retaining funds as unallocated equity decreased the internal rate of return to the member relative
to strategies involving qualified allocated equity and nonqualified allocated equity. The cash
patronage was adjusted to be tax neutral to the cooperative for all three scenarios. Their
simulation did not consider changes to the equity redemption period.
The Role of the Domestic Production Activities Deduction
A major factor behind the growth of unallocated equity has been the Domestic
Production Activity Deduction (DPAD), also commonly referred to as the Section 199
Deduction. The tax deduction was introduced into U.S. tax law as part of the American Jobs
Creation Act of 2004. In addition to traditional manufacturing activities, the DPAD applies to
producers who manufacture, produce, grow or extract agricultural or horticultural products.
Cooperatives that market agricultural or horticultural products for their patrons could elect to
show the deduction at the cooperative level. A number of private letter rulings were issued by
the IRS beginning in 2008 that clarified how an agricultural marketing cooperative could classify
its payments to members for their commodities as per unit retains paid in money (PURPIM).
The cooperative could exclude the PURPIM payments from its calculation of income for the
DPAD. This substantially increased the potential DPAD available to cooperatives. (Kenkel,
Boland and Barton, 2014)

The DPAD was originally limited to the lower of the qualified production activities
income (QPAI) or 3% of its taxable income or 50% of the production W-2 wages paid during the
year. The deduction increased to 6% of taxable income in 2006 and 9% in 2010. The DPAD
provided cooperatives with tax deductions that could be used to offset the tax liability which
would otherwise result from retaining funds as unallocated reserves. (It should be noted that the
tax advantages of the DPAD can also be captured by issuing nonqualified allocated equity,
Kenkel, Boland and Barton, 2014.) Large grain and farm supply cooperatives in the Midwest
were some of the first cooperative firms to understand and take advantage of the DPAD through
unallocated equity.
The growth of unallocated equity in these large grain and farm supply cooperatives is
illustrated in Figure 5. Most of the growth in unallocated equity started in 2008, a time period
corresponding with the DPAD clarifying private letter rulings. A widely referenced report by
Iowa State University’s Center of Agricultural Law and Taxation which described the
implications of the DPAD for cooperatives was first published in February 12, 2009. The impact
of the DPAD increased in 2010 when the deduction increased. That time frame is also consistent
with the continued growth in unallocated equity. It appears obvious that the creation of the
DPAD impacted the structure by which marketing cooperatives retained profits. What is open to
speculation is whether the DPAD was a catalyst for a well planned alternative financial structure
or whether the pursuit of tax savings led to unintended changes in the equity structure.

The Risk of Unallocated equity
The risk of higher levels of unallocated equity in providing members with an incentive to
liquidate the cooperative has long been recognized. Schrader (1989) noted that cooperative
members can capture the full value of their share of the business only if the cooperative is
dissolved and the business is sold. He went on to state that the presence of unallocated equity
increases the divergence between the members return from continued participation in the
cooperative and public market (liquidation) value. This effect is due to the fact that unallocated
equity does not revolve and the profits represented in that equity are never realized by the
individual member. This structure, which is described by Cook and Iliopoulos (2000) as ill-
defined property rights, creates the incentive for the members to liquidate the cooperative to gain
claim to the unallocated equity.
The temptation for liquidation can be illustrated using actual levels of unallocated equity.
As mentioned, unallocated equity accounted for 12% of the equity in U.S. agricultural
0%
10%
20%
30%
40%
50%
60%
70%
2005 2006 2007 2008 2009 2010 2011 2012
Unallocated Equity to Total Equity for Grain and Farm Supply Cooperatives
Figure 5: Change in Ratio of Unallocated Equity to Total Equity for Large Grain and Farm Supply Cooperatives

cooperatives in 1954. If an outside firm believed that these cooperatives were worth the book
value of their total equity it would offer the members 113.6% of their stock values to purchase
the cooperatives. Currently, unallocated equity accounts for 63% of total equity for large grain
and farm supply cooperatives. An outside firm offering those members book value for a typical
cooperative would tender an offer of 270% of the value of the allocated equity. Higher levels of
unallocated equity clearly increase the temptation to liquidate the cooperative. It is much more
difficult to determine if it is actually a major factor in cooperative liquidations.
Royer (1992) also acknowledged the possibility that the existence of substantial
unallocated equity could provide the current members with an incentive to dissolve the
cooperative for personal gain. However, he questioned the practical implications of that threat
because the members would have to weigh their operational interest from continued access to the
cooperative against the value of the unallocated equity. He also pointed out that there could be
bylaw provisions or requirements in state statutes requiring that the assets of a dissolving
cooperative must be distributed among both current and former members on a patronage basis.
Cook and Chaddad ( 2006) made the opposite conclusion stating that “bylaws typically indicated
that allocated equities are the last criterion for residual claims on the net worth of a cooperative.”
However they noted that, based on Subchapter T of Internal Revenue Code, the value in excess
of allocated equities might have to be distributed on the basis of patronage history.
Whether driven by bylaw provisions or Subchapter T it is possible that some of the value
of the unallocated equity could be distributed to former members who, because their equity has
been redeemed, are not holding allocated equity. This would reduce the current members’ gain
from liquidation. This point is valid only to the extent that the “look back period” used to
consider former patronage is longer than the equity revolving period. Given the long revolving
period in many cooperatives, it seems unlikely that there would be reliable patronage records to
distribute proceeds to former patrons not holding allocated equity.
Liquidation of cooperatives or conversions into investor owned corporate forms is
commonly referred to as demutualization (Birchall, 2001). Studies of demutualization have
generally focused on mutual savings and loan association, mutual insurance companies and other
user owned firms in the financial services sector. Chaddad and Cook (2004) examined
demutualization in U.S. mutual savings and loan associations and mutual insurance companies.
The authors identified a number of factors contributing to demutualization including disruptive
market changes, perceived capital constraints, and weak governance systems. The authors
conceded that there is a lack of empirical evidence on the linkage between unallocated equity
and demutualization. However they did observe that conversion provides members access to
unallocated equity and that members with limited time horizons might favor conversion for that
reason. They stated that minimizing the use of unallocated equity and increasing the portion of
earnings allocated to individual member accounts could reduce the risk of demutualization.
A number of authors including Schrader (1989) Collins (1991) Wadsworth (1998)
Mooney and Gray (2002, and others have examined restructuring of agricultural cooperatives.
The most dominant forms of restructuring involving mergers, alliances and joint ventures among
cooperatives, followed by acquisitions of investor owned firms by cooperatives or joint ventures
between cooperatives and investor owned firms (Mooney and Gray, 2002). Outcome involving
the liquidation of a cooperative or acquisition of the cooperative by and investor owned firm
represented only 8% of total identified cases of restructuring.

Other authors including Boland and McKee (2009) Hardesty (2009), Barton and Boland,
(2009), Hailu and Goddard (2009) and other have examined conversions of agricultural
cooperatives to publically traded firms. In many cases these conversions involved cooperatives
operating in value-added sectors. Most of the conversions were driven by the members desire to
capture the market value of the firm and/or the firm’s need for greater access to the capital. In
some cases (example Diamond Walnut Growers or Calavo) the cooperative’s brand was its chief
asset and the desire to capture the full value from that asset drove the conversion (Hogeland,
2006).
Several general observations emerge from the diverse literature on demutualization.
Demutualization efforts seldom originate with the membership but instead come from the
management or board or from an unsolicited offer from an outside firm (Nadeau and Nilsestuen,
2004). The level of unallocated equity does not appear to be the primary cause of
demutualization but access to the value of unallocated equity is frequently mentioned as a
contributing or supporting factor. When demutualization does occur cooperative members often
receive substantially more than the value of their allocated equity.
Is Unallocated Equity Consistent with Cooperative Principles
Royer (1992) examined the equity practices of agricultural cooperatives and their
relationship with cooperative principles. He noted several issues relating to unallocated equity
which were also articulated by Murray (1983). The growth of unallocated equity appears to be
in conflict with the cooperative principle of “user-owner.” In a cooperative dominated by
unallocated capital, the members can become complacent about the cooperatives activities and
condition because they perceive that they have little financial stake in the firm. Another issue is

that, over time, the increase in funds controlled by the Board of directors can reduce the
importance and thus the authority of the users in relation to the authorities of the cooperative.
Gray and Duffey (1996) made similar observations:
“Cooperatives are often financed by a sizeable amount of unallocated equity capital, and
hence, the members have weaker incentives to involve themselves in the governance of
the cooperatives. They are rather inclined to seek free-riding behavior, as well as to
avoid investing in the cooperative. Such behavior by members may be disastrous for the
cooperative, which means that the management in such cases tends not to listen to the
members”.
Royer (1992) concluded that most cooperatives probably had sufficient allocated equity
to provide members with a perceived financial stake in the cooperative. He did not define what
level of allocated equity was necessary to maintain that perception.
Royer (1992) went on to state that the greatest conflict with high accumulation of
unallocated earnings was with the principle of service at cost, also termed the “user-benefits”
principle. The issue, which was also highlighted by Schrader (1989), is that if margins from
patron business are retained as unallocated equity then the patrons are not being served at cost.
Royer concluded that “the retention of unallocated earnings from patronage income is
inconsistent with the principle of return earnings on a patronage basis.” In fairness, it should be
acknowledged that Royer also discussed the presence of non-member profits. He noted that if
those profits were distributed to members instead of retained as unallocated equity that could
have the opposite effect of providing members with services below costs. Practical

considerations and tax implications often prevent a cooperative from operating in exact harmony
with cooperative principles.
Attitudes toward Unallocated Reserves
Ultimately, many of the issues pertaining to unallocated equity involve member perceptions.
Like any business form, the cooperative business model can evolve to new structures if those
structures better meet the preferences of the stakeholders. If a structure encourages members to
patronize the cooperative, participate in governance and provide financing then it is desirable.
U.S. credit unions have relied almost exclusively on retained earnings for equity capital (Cook
and Chaddad, 2006) and that structure appears to meet the preferences of their members. Over
time, European cooperatives have also relied more on unallocated equity. More recently, larger
European cooperatives have begun to favor allocated equities, often structured with marketing
rights, securitized, appreciable and/or tradable features as well as allocated interest-bearing
certificates with fixed maturity dates (Cook and Chaddad, 2006). Cooperatives in all sectors
continue to explore new structures that meet the needs of their members and allow the firm to
compete effectively.
Cooperative researchers have long been interested in identifying the factors that influence the
commitment of members to their cooperative organization. Fulton and Adamowicz (1993) found
that farmers who placed a greater importance on sharing in the profits through patronage refunds
were more likely to patronize the Alberta Wheat Pool. Their survey did not differentiate
between cash patronage and patronage distributed in the form of allocated revolving equity.
Österberg and Nilsson ( 2009) found that the members’ perceived ability to influence the
democratic control of the cooperative outweighed all other factors in explaining their
involvement in the cooperative and their confidence in the board of directors. Bhuyan (2007)
found that members who considered themselves a part owner of the cooperative were more likely
to be satisfied with the cooperative management.
These results were highlighted because they suggest areas of member perceptions which
might enlighten the discussion of unallocated equity. It would be useful to know what value
members place on their allocated revolving equity. If they place a high value on allocated equity
then the shift from retaining funds as allocated equity would reduce their perceived patronage
refund which could decrease participation. The value that members place on allocated revolving
equity would also impact the degree to which that equity impacted their sense of being a part
owner of the firm, another factor linked to satisfaction. It would also be useful to understand
whether ownership of allocated equity influenced the degree to which members were involved in
the governance of the cooperative. If so, that involvement in democratic control would be
expected to be related to satisfaction and continued patronage. Finally, it would be very useful to
understand how likely it is that cooperative members would liquidate their cooperative to access
the value of unallocated equity.
In order to address these important questions a national survey of cooperative CEOs,
board members and cooperative members was conducted in August 2014. The effort involved a
short (6 question) web-based survey. The Iowa Institute for Cooperatives, the Kansas
Cooperative Council, the Oklahoma Agricultural Cooperative Council, the Mid-American
Cooperative Council, the North Dakota Coordinating Council for Cooperatives, the Northeast
Cooperative Council, the Texas Agricultural Cooperative Council and the Wisconsin Center for
Cooperatives all helped publicize the effort. All of the organizations were asked to forward or
reproduce an email asking the recipient to take a few minutes to complete the short web-based

survey. Because many of the email contacts involved the cooperative CEO, the survey email
also asked the recipient to forward the email to a member of the their Board of Directors and to a
member of the cooperative not currently serving on the board, such as a member serving on the
board nominating committee.
The survey effort yielded 198 responses. Board members represented 53% of the
respondents while 33% were CEOs, 8% were members not serving on the board and 2% were
staff members (Figure 6). While capturing a good representation of CEOs and board members,
responses from members were disappointing. Responses from several of the responding CEOs
stated that they were reluctant to share the survey with a member of the cooperative because of
the question asking how likely it would be for members to liquidate the cooperative Since
cooperative board members are also of course members and patrons of the cooperative, their
perspectives may be reasonably representative of the membership.
33%
53%
8%2%
CEO Board Member Staff
What Activity Bests Describes Your Role in the Cooperative
Figure 6: Profile of Survey Respondents

The vast majority of the respondents were from cooperatives involved in marketing
agricultural commodities, providing agricultural inputs and providing services to agricultural
producers (Figure 7). Roughly half of the respondents indicated that their cooperative provided
credit and/or energy. However all of the respondents that selected those categories also indicated
that their cooperative was involved in agricultural inputs and/or commodity marketing. Almost
three fourths of the respondents indicated that their cooperative had retail sales to non-farmers,
but again, all of those respondents also selected input supply and/or commodity marketing.
Taken as a whole, the survey respondents appeared to represent diversified farm supply and
commodity marketing cooperatives which represent a large segment of U.S. agricultural
cooperatives.
The third question on the survey elicited information on the level of unallocated equity in
relationship to total equity (Figure 8). Twenty seven percent of the respondents indicated that
50% or more of their cooperative’s equity was in the form of unallocated equity while 54% had
82% 84% 88%73%
43%58%
12%
0%20%40%60%80%
100%
What Activities is Your Cooperative Involved in?
Figure 7: Business Activities of Cooperatives Represented by Survey Respondents
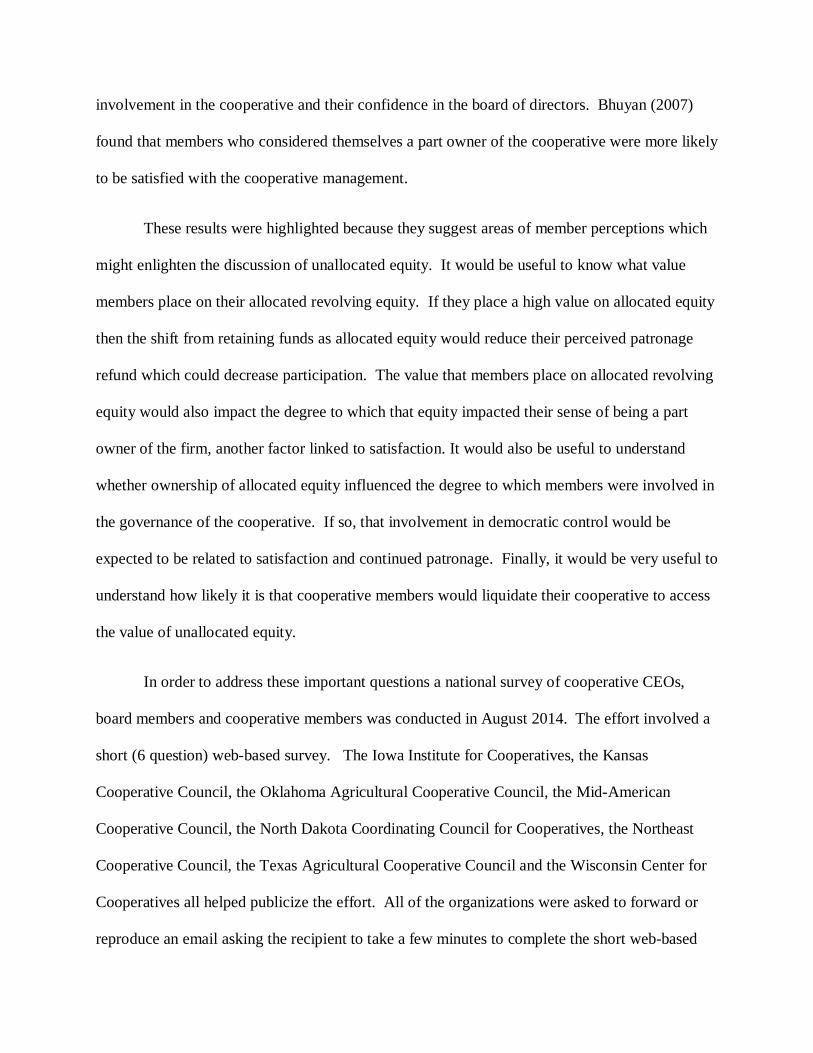
less than 50%. Almost 14% of the respondents reported that they did not know the amount of
unallocated equity in their cooperative’s structure. Of the 32 respondents that did not know the
amount of unallocated equity, 3 were CEOs, 22 were board members, 4 were members and 3
were staff members. Because of the small number of responses it is impossible to speculate
whether the lack of knowledge of unallocated equity among members is typical.
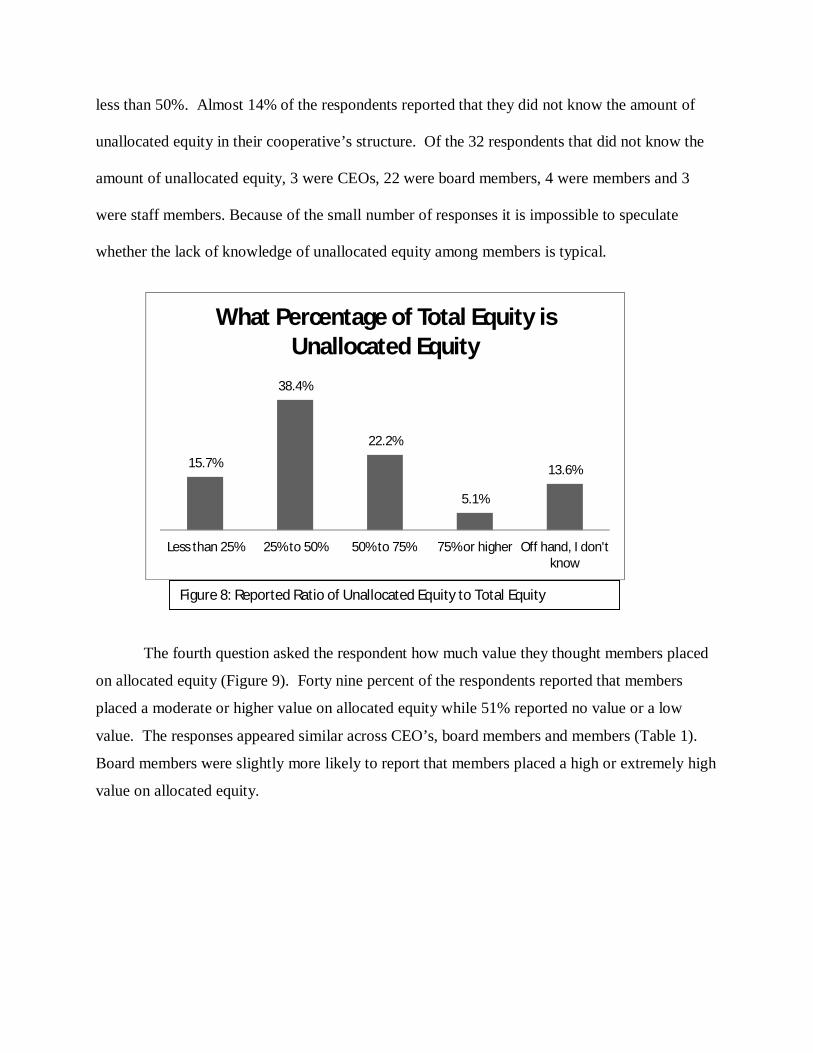
The fourth question asked the respondent how much value they thought members placed
on allocated equity (Figure 9). Forty nine percent of the respondents reported that members
placed a moderate or higher value on allocated equity while 51% reported no value or a low
value. The responses appeared similar across CEO’s, board members and members (Table 1).
Board members were slightly more likely to report that members placed a high or extremely high
value on allocated equity.
15.7%
38.4%
22.2%
5.1%
13.6%
Less than 25% 25% to 50% 50% to 75% 75% or higher Off hand, I don'tknow
What Percentage of Total Equity is Unallocated Equity
Figure 8: Reported Ratio of Unallocated Equity to Total Equity

Table 1: Value Member Place on Allocated Equity
No value
Low Moderate High Extremely High
CEO 12.12% 37.88% 43.94% 6.06% 0.00% Board 10.48% 38.10% 38.10% 11.43% 1.90% Member 12.50% 50.00% 31.25% 6.25% 0.00% Staff 0.00% 66.67% 33.33% 0.00% 0.00%
The fifth question asked to what extent the members level of allocated equity influenced
their decision to be involved in governance in the cooperative (Figure 10). Sixty two percent of
the respondents reported that it had a moderate or higher effect on involvement in governance
while only 11% reported that it had very little influence. This is an interesting result since
previous research suggests that involvement in governance is an important predictor of continued
patronage and confidence in the board of directors. The responses were again fairly similar
across the different roles in the cooperative (Table 2)
11.1%
39.9% 38.9%
8.6%
1.5%
No value low value moderate value high value extremely highvalue
How Much Value Do You Think Members Place on Allocated Equity?
Figure 9: Perceived Value of Unallocated Equity

Table 2: Impact of Allocated Equity on Involvement in
Governance
Very
little
Some Moderate Strong Very
Strong
CEO 13.64% 24.24% 43.94% 18.18% 0.00%
Board 8.57% 26.67% 40.00% 20.00% 3.81%
Member 6.25% 25.00% 31.25% 31.25% 6.25%
Staff 33.33% 0.00% 33.33% 33.33% 0.00%
The last question described a hypothetical situation where the members of the
cooperative received an offer from an outside (non-cooperative) firm to purchase the cooperative
at price where the members would receive double the face value of their allocated equity. The
question asked the respondent how likely they thought it would be for the members to sell the
cooperative (Figure 11). Over half of the respondents (54%) reported that there was a 50% or
better chance that the members would sell the cooperative in response to the described offer.
Fifteen percent indicated that it was very unlikely while 7% indicated it was very likely. The
10.6%
26.8%
38.9%
20.7%
2.5%
Very littleinfluence
Some influence Moderateinfluence
Strong influence Very stronginfluence
How Much Does a Member's Allocated Equity Effect Their Decision
to be Involved in Governance?
Figure 10: Impact of Allocated Equity on Involvement in Governance

responses were similar across roles (Table 3) although more CEOs indicated that it would be
unlikely while more board members selected the “roughly 50-50 chance” category.
Table 3: How Likely Would Members Sell the Cooperative for 200% of Allocated Equity Value
Very unlikely
Unlikely 50-50 Likely Very Likely
CEO 13.64% 40.91% 27.27% 13.64% 4.55% Board 16.19% 25.71% 35.24% 15.24% 6.67% Member 12.50% 25.00% 37.50% 12.50% 12.50% Staff 0.00% 0.00% 33.33% 33.33% 33.33%
Figure 12 summarizes the same responses for the subset of respondents who indicated
that their cooperative had 50% or more unallocated equity. For these respondents, the question
was not entirely hypothetical because an offer for the cooperative at book value would exceed
twice the value of the unallocated equity. Almost 48% of this subset of respondents indicated
that there was a 50% or better chance that their members would sell the cooperative at a price
that would in their case be a book value or less. If the shift to higher unallocated equity was an
Veryunlikely
Unlikely Roughly a50-50
chance
Somewhatlikely
Very likely
14.6%
30.8% 32.3%
14.6%7.1%
Would Members Sell the Cooperative for Twice the Value of Their Allocated
Equity?
Figure 11: Likelihood of Members Selling the Cooperative if Offered Twice the Value of Their Allocated Equity

intentional strategy, it appears that the leaders of those cooperatives are willing to accept a fairly
high risk of demutualization. Alternative explanations would be that they find it unlikely that an
outside firm would make an offer for their cooperative or that they think could influence
members with an educational effort if the need arose.
Continuing the comparison Figure 13 summarizes the survey responses subdivided by the
level of unallocated equity. The comparison was made by collapsing the very low and low
categories into a low value or low influence category with the other three categories combined
into a moderate and higher category. For the last question, the responses of “roughly 50-50
chance”, “likely” and “very likely” were combined into a single category of “likely to sell”.
10.2%
42.4%
28.8%
15.3%
3.4%
Very unlikely Unlikely Roughly a 50-50chance
Somewhat likely Very likely
Would Members Sell: Sub-set of Cooperatives with over 50%
Unallocated
Figure 12: Likelihood of Accepting an Offer to Buy the Cooperative at Twice the Value of Allocated Equity: Subset of Cooperatives with Over 50% unallocated equity
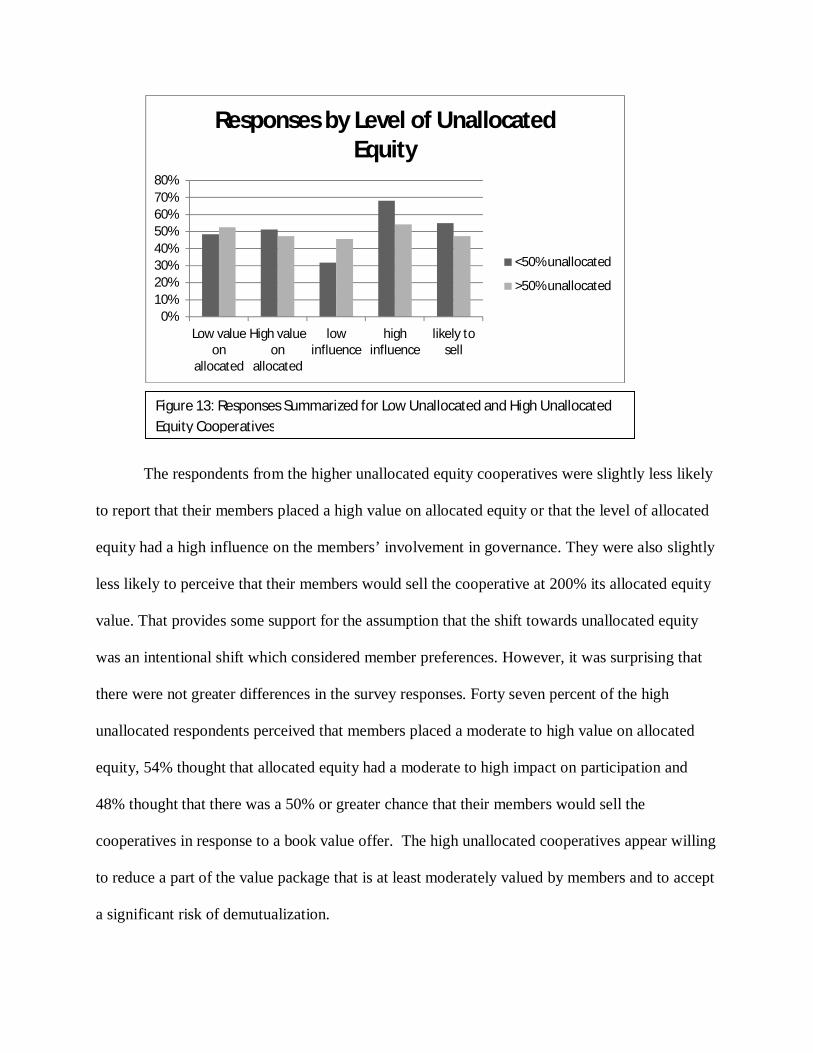
The respondents from the higher unallocated equity cooperatives were slightly less likely
to report that their members placed a high value on allocated equity or that the level of allocated
equity had a high influence on the members’ involvement in governance. They were also slightly
less likely to perceive that their members would sell the cooperative at 200% its allocated equity
value. That provides some support for the assumption that the shift towards unallocated equity
was an intentional shift which considered member preferences. However, it was surprising that
there were not greater differences in the survey responses. Forty seven percent of the high
unallocated respondents perceived that members placed a moderate to high value on allocated
equity, 54% thought that allocated equity had a moderate to high impact on participation and
48% thought that there was a 50% or greater chance that their members would sell the
cooperatives in response to a book value offer. The high unallocated cooperatives appear willing
to reduce a part of the value package that is at least moderately valued by members and to accept
a significant risk of demutualization.
0%10%20%30%40%50%60%70%80%
Low valueon
allocated
High valueon
allocated
lowinfluence
highinfluence
likely tosell
Responses by Level of Unallocated Equity
<50% unallocated
>50% unallocated
Figure 13: Responses Summarized for Low Unallocated and High Unallocated Equity Cooperatives

Summary
The portion of total equity which is held as unallocated equity has been increasing for
many years. Tax deductions offered by the DPAD appears to have encouraged many marketing
cooperatives to retain profits in the form of unallocated equity rather than distributing allocated
equity patronage.
Unallocated equity can serve as a buffer against future operating losses which eliminates
the need to charge those losses against the allocated equity accounts of patrons. Unallocated
equity is considered permanent equity and higher levels of permanent capital simplifies the
process of managing the cooperative balance sheet to meet liquidity and solvency goals.
However balance sheet management can be achieved with revolving equity provided that the
board uses discretion in profit distribution and equity management.
Shifting profit retention from allocated to unallocated equity can have impacts on cash
patronage, the taxable income for both the cooperative and the member and the equity revolving
period. Retaining profits as unallocated equity increases taxes at the cooperative level and
decreases member taxes in the current year. Unallocated equity is never redeemed which
eliminates a future return to the member. The decrease in the redemption obligation may allow
the cooperative to redeem the remaining allocate equity more quickly. Analyzing those effects on
the cooperative members would require specific case studies and/or simulations. It appears
likely that the members financial return as measured by the net present value of current and
future cash flows is reduced by retaining profits as unallocated equity. However, the after tax
portion of current year cash patronage is likely enhanced by a shift toward unallocated retention.
Other types of cooperatives, such as credit unions, operate successfully under structures
relying on unallocated equity. Ultimately the question of the best profit retention structure
revolves around whether cooperative members value their allocated revolving equity. If
members value allocated equity then retaining profits in that form would increase a member’s
perception of patronage refund, their sense of ownership and their incentive to be involved in
governance. All of those factors have been shown to be positively related to member satisfaction
and continued patronage. Results from a national survey were split with roughly half of the
respondents indicating that cooperative members place a moderate or higher value on allocated
equity, and that it has a moderate or higher impact on their decision to be involved in
governance.
The other critical issue involving higher levels of unallocated equity is whether it
increases the risk of demutualization. Fifty four percent of all respondents reported that there was
at least a 50-50 chance that their members would sell the cooperative if presented an offer of
200% of allocated equity. Forty eight percent of the respondents from high unallocated equity
cooperatives (where the offer is equal to or less than their book value) reported that a 50% or
better chance of dissolution. If the shift toward more unallocated equity has been intentional, it
appears that cooperative leaders perceive outside offers unlikely or that they are willing to accept
a fairly high risk of demutualization.
Concluding Thoughts
This paper has highlighted an important trend in the profit retention and capital structure
of U.S. cooperatives. Our survey was one of the first efforts to understand the value that
cooperative members place on revolving allocated equity and how their ownership of allocated
equity influences their involvement in the cooperative. The results were intriguing and highlight

the need for further research. While our results were similar across board members and the small
sample of member respondents, a larger sample of member responses would be beneficial.
Investigating the level at which members might liquidate a cooperative is very sensitive, which
makes it difficult to get assistance from cooperative CEOs and board members in soliciting
responses from cooperative members.
In the coming decade, an unprecedented intergenerational transfer of farm management
and farmland ownership will occur. In tandem with this transition, there will be a transition in
the active membership in agricultural cooperatives. Younger producers may have different
perspectives on the cooperative value package. It will be essential for cooperatives to educate
these younger members on the cooperative’s alternatives in profit distribution and equity
creation. It will be equally important for cooperatives to understand the importance that those
producers place on access to the cooperative infrastructure, patronage and equity. Cooperatives
should focus on financial structures that meet those needs while allowing the firm to compete
effectively.
References
Barton, David and Michael Boland (2009) “FC Stone Conversion to a Public Corporation” Journal of Cooperatives, Volume 23 116-129
Bhuyan, S. (2007), The “People” Factor in Cooperatives: An Analysis of Members' Attitudes and Behavior. Canadian Journal of Agricultural Economics, 55: 275–298.
Birchall, J. (2001) ed. “The New Mutualism in Public Policy”, Routledge, London
Boland, Michael “Cooperative Finance and Equity Management” CHS Center for Cooperative Growth http://www.chscenterforcooperativegrowth.com/images/PDF/Boland_WhitePaper.pdf accessed 9-25-2014 Boland, Michael and David Barton 2012 “Overview of Research on Cooperative Finance” Journal of Cooperatives, Volume 27, 1-14.
Boland, Michael and Gregory J. McKee “The Restructuring of Dakota Growers Pasta Company” Journal of Cooperatives, Volume 23 2009 Page 141-151
Bradley, Frank L. "A New Look at Cooperative Financing." Cooperative Accountant. Fall 1972. pp. 2-7 and 31.
Bhuyan, Sanjib (2007) “The People Factor in Cooperatives: An Analysis of Members’ Attitudes and Behavior” Canadian Journal of Agricultural Economics 55 275-298.
Chaddad, Fabio R. and Michael Cook, (2004) “The Economics of Organization Structure Changes: A U.S. Perspective on Demutualization, Annals of Public and Cooperative Economics, 75:4 p 575-94.
Collins. Robert A. (1991) “The Conversion of Cooperatives to Publicly Held Corporations: A Financial Analysis of Limited Evidence” Western Journal of Agricultural Economics. 16(2) 326-330.
Cook, Michael L. and Fabio R, Chaddad, (2006) Capital Acquisition in North American and European Cooperatives” Filene Research Institute.
Cook and Iliopoulos (2000) with M.L. Cook. In C. Menard (Ed.), Institutions, Contracts, and Organizations: Perspectives from New Institutional Economics, pp. 335-348. London, UK: Edward Elgar Publishing.
Dahlgren, Joel L. (2007) “A Question of Value Proposition and Capital Structure: The Cooperative Accountant

Dahlgren, Joel J. and Ronald D. McFall “Law of Coopeatives Conversions and Restructuring of Cooperatives” Agricultural Marketing Resource Center, http://www.agmrc.org/media/cms/Conversions_and_Restructings_9AF4C8BD177C3.pdf accessed 9-25-2014
Fulton, Joan R. and Wiktor L. Adamowicz “Factors That Influence the Commitment of Members to Their Cooperative Organization” Journal of Cooperatives, `1993 39-53.
Griffin, et al., The Changing Financial Structure of Farmer Cooperatives, U.S Department of Agriculture, Agricultural Cooperative Service, FCRR 17, March 1980.
Gray, T.W., and P. Duffey (1996). “Listen and Learn: Understanding Member Complaints can help Build Commitment”. Rural Cooperatives, May–June:8–10. Hailu, Getu and_ Ellen Goddard, (2009) “Sustainable Growth and Capital Constraints:The Demutualization of Lilydale Co-operative Ltd.” Journal of Cooperatives, Volume 23 116-129
Hardesty, S. D. (2005). The Bottom Line on the Conversion of Diamond Walnut Growers” Update: Agricultural and Resource Economics, Vol. 8 No. 6. pp. 1-4+11 Hardesty, S. D. (2009) “The Conversion of Diamond Walnut Growers” Journal of Cooperatives, Volume 23 116-129
Hogeland, A. J. (2006a). Co-op Conversions Extent of commitment to co-op values key factor in decisions to convert” Rural Cooperatives, May/June. pp. 17-20.
Kenkel, Phil, Michael Boland and David Barton “Understanding Nonqualified Distributions” Cooperative Accountant, Summer 2014,
Mooney, Patrick and Thomas W. Gray 2002“Cooperative Conversion and Restructuring in Theory and Practice” USDA Rural Business Cooperative Service, RBS Research Report 185
Murray, Gordon. (1983) “Management Strategies for Corporate Control in British Agricultural Cooperatives: Part 2.” Agricultural Administration 14 : 81-94. Nadeau, E.G. and Nilsestuen, R. (2004). Strengthening Cooperative Business Structures: Lessons Learned from Demutualization and Cooperative Conversions. Cooperative Business Journal, pp. 1-2 Österberg, P. and Nilsson, J. (2009), Members' perception of their participation in the governance of cooperatives: the key to trust and commitment in agricultural cooperatives. Agribusiness, 25: 181–197.
Reynolds, Bruce (2013) “Indivisible Reserves” “Rural Cooperatives” Volume 80, No. 3, May June 2013, 12-15.
Royer, Jeffery S. “Cooperative Principles and Equity Financing: A Critical Discussion” Journal of Agricultural Cooperation, 79 (1992)
Ryan, Robert J., Jr. "Building Equity for the 80s."Cooperative Accountant, Spring 1981, pp. 29-32.
Wadsworth, James J. (1998) “Cooperative Restructuring, 1989-1998” Rural Business-Cooperative Service, Service Report 57, Washington D.C.
Schrader, Lee F. "Equity CapItal and RestructurIng of Cooperatives as Investor-Oriented Firms." Journal of Agricultural Cooperation 4(1989a):41-53.
USDA “Cooperative Statistics 2012” USDA Rural Business Cooperative Programs Service Report 72, 2012
Top Related