


Languages
Pages
Legal

The impact of projected climate change on Monaro farms.
Doug Alcock
Livestock Officer (Sheep and Wool)
Climate Change Adaptation in Southern Australian Livestock Industries Project

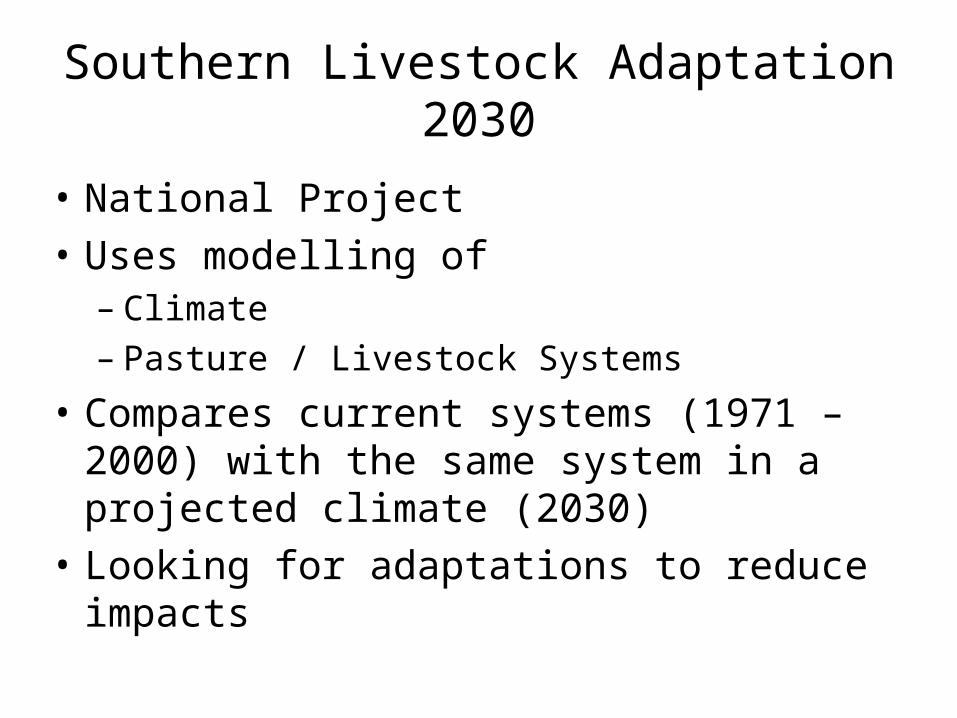
Southern Livestock Adaptation 2030
• National Project
• Uses modelling of – Climate– Pasture / Livestock Systems
• Compares current systems (1971 – 2000) with the same system in a projected climate (2030)
• Looking for adaptations to reduce impacts
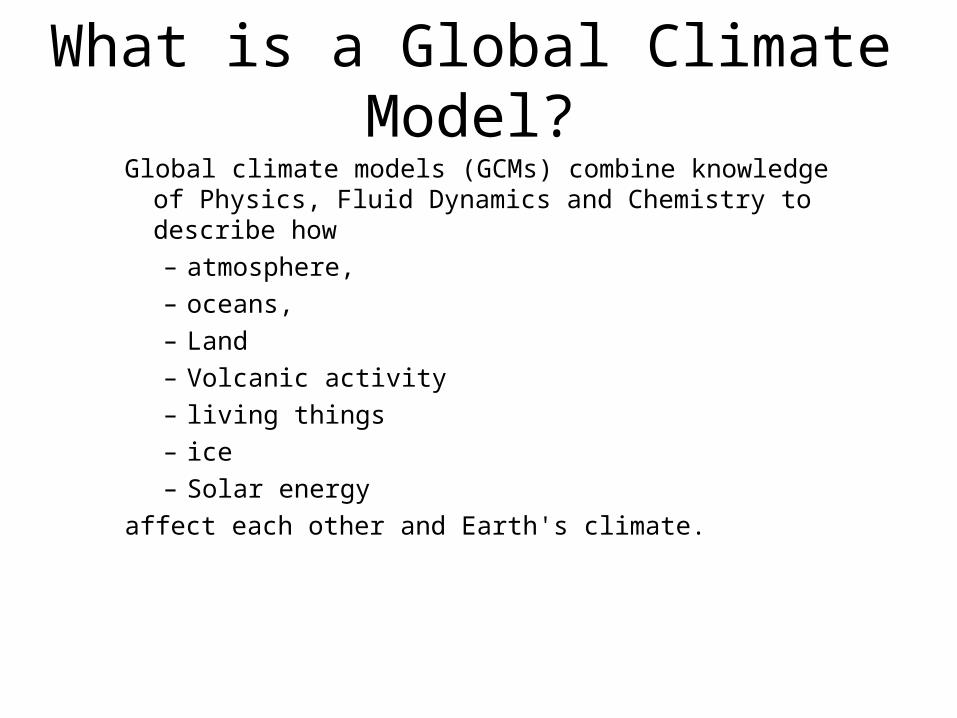
What is a Global Climate Model?Global climate models (GCMs) combine knowledge of
Physics, Fluid Dynamics and Chemistry to describe how
– atmosphere,
– oceans,
– Land
– Volcanic activity
– living things
– ice
– Solar energy
affect each other and Earth's climate.
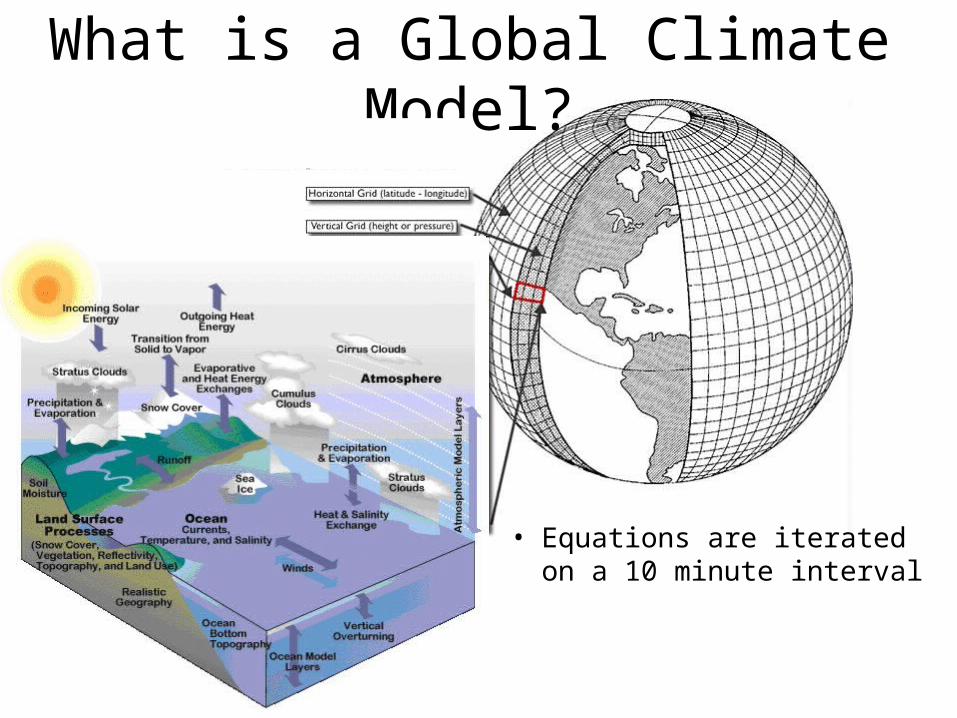
What is a Global Climate Model?
• Equations are iterated on a 10 minute interval
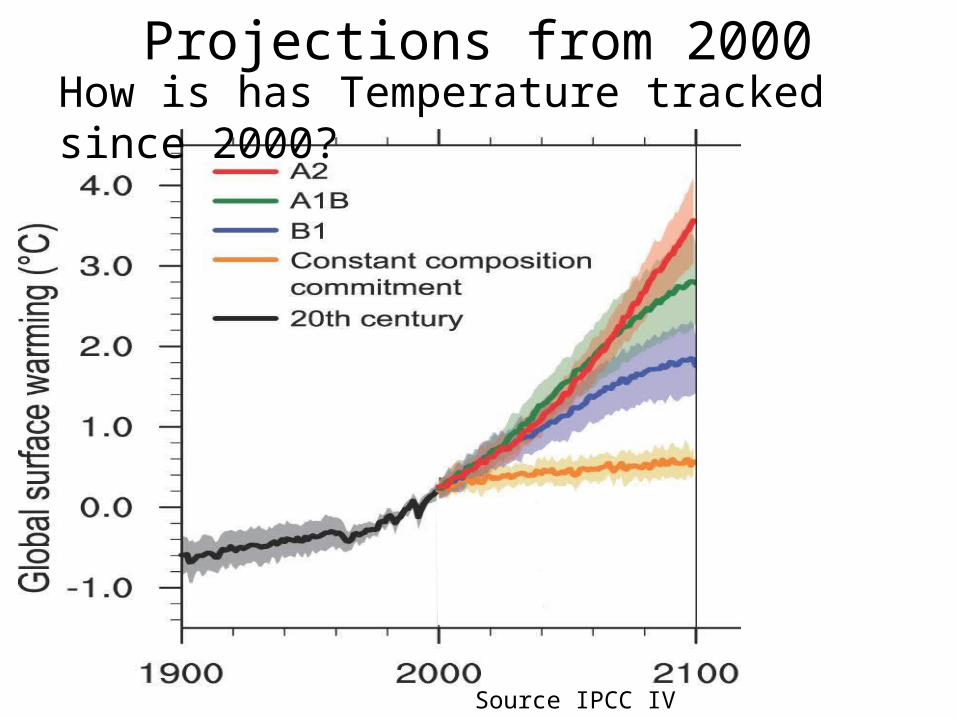
Projections from 2000
Source IPCC IV
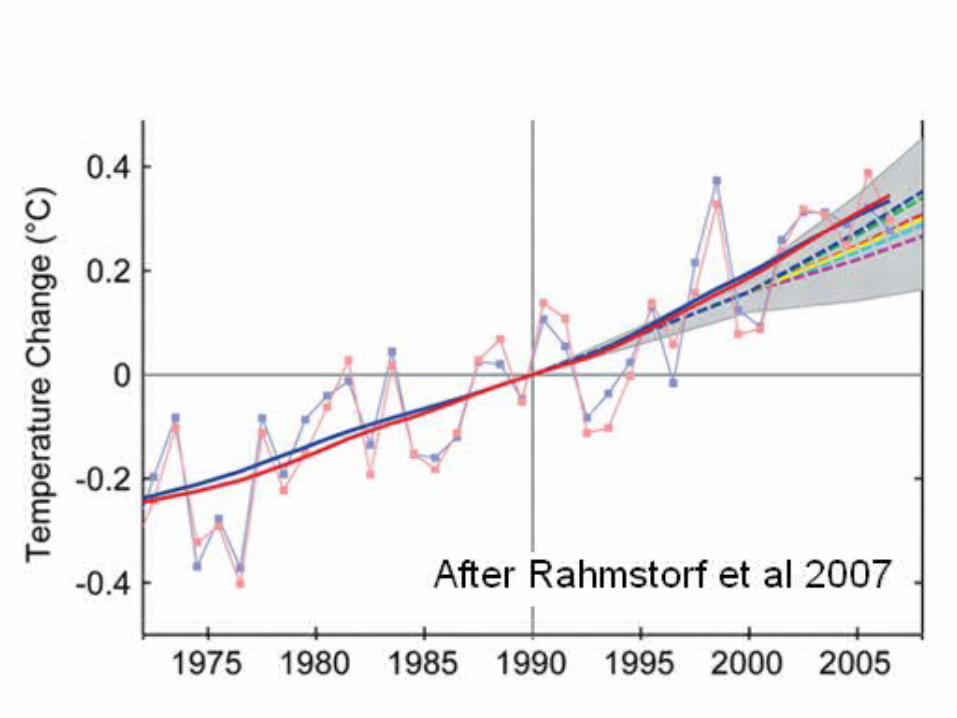
How is has Temperature tracked since 2000?
Related trends?
Turning Global Scale Modelling into local projected weather!
• GCM,s operate as a broad brush.– Around 200km resolution
• Each cell gives a regional scale projection

Converting Climate to Weather
Global C
irculation Models
Stochastic Weather Generator

Which emissions scenario? …Which GCM’s?
CCSM 3.0
ECHAM5 OMGFDL 2.1
HadGEM1
Best GCM’s
2030

How can we assess the likely impact?
• Just as with projecting climate change modelling is the only way.
• One appropriate model is GrassGro

Weather / Climate
Pasture
Soil Livestock

How will plants respond to increased CO2
Leaf Photosynthesis Leaf Water Loss
• Increased photosynthesis in C3 grasses and legumes (growth)• Reduced water use • Lower crude protein in grasses (higher CO2 availability dilutes Nitrogen)
Relative Assimilation Rate
0.90
0.95
1.00
1.05
1.10
1.15
1.20
350 400 450 500 550 600 650 700
C3 Grass, Legume
C4 Grass
Reference Stomatal Conductance (m/s)
0.0
1.0
2.0
3.0
4.0
5.0
6.0
7.0
8.0
9.0
350 400 450 500 550 600 650 700
C3 Grass
C4 Grass
Legume
Climate Change at Bungarby

Base Farm System
• Merino Ewes
• 2.5 ewes/ha
• Nov Shorn
• Unfertilised native pasture on Stony Basalt.– Poa, Stipa, legume, annual grass.
• Sell progeny at 14 months
• Feed to maintain CS 2.

Bungarby’s weather data past and 2030
Annual Rainfall Annual Max / Min temperature
1971 to 2000 544 mm 18.3 C / 4.8 C
2000 to 2009 451 mm 19.1 C / 4.8 C
CCSM (USA) 605 mm (+11%) 19.5 C / 5.9 C
HadGEM1 (UK) 561 mm (+3%) 19.1 C / 5.7 C
ECHAM5-OM (German) 439 mm (-19%) 19.7 C / 5.7 C
GFDL 2.1 (USA) 488 mm (-10%) 19.5 C / 5.9 C
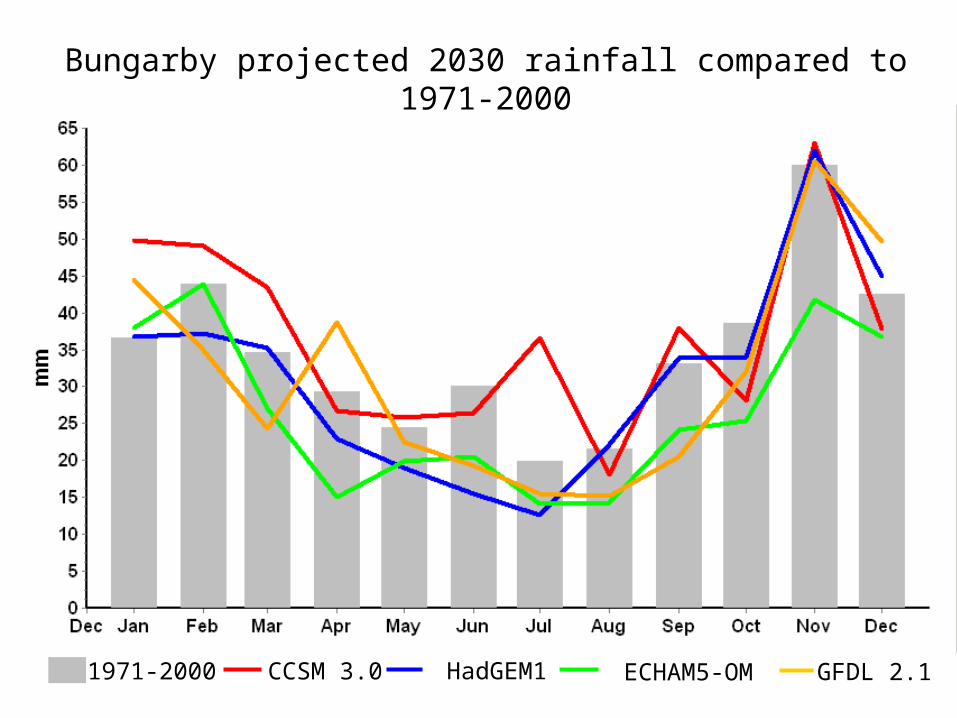
Bungarby projected 2030 rainfall compared to 1971-2000
CCSM 3.0 HadGEM1 ECHAM5-OM GFDL 2.11971-2000
CCSM 3.0 HadGEM1 ECHAM5-OM GFDL 2.1
-5
0
5
10
15
20
25
30
Jan Feb Mar Apr May Jun Jul Aug Sep Oct Nov Dec
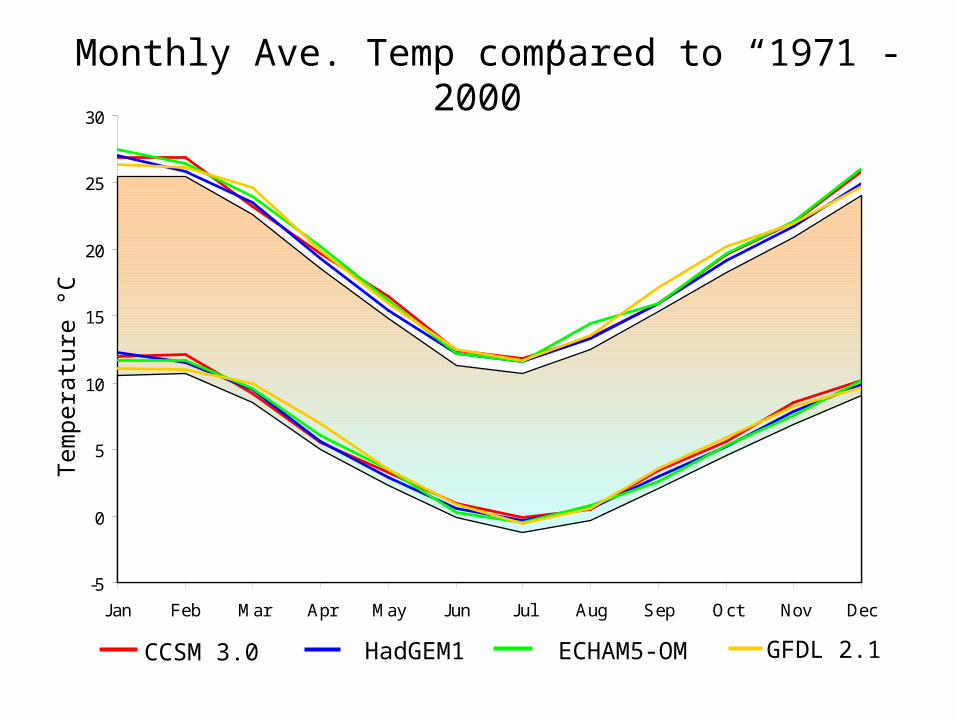
Monthly Ave. Temp compared to “1971 -2000”T
empe
ratu
re °
C

Bungarby projected pasture growth rate
CCSM 3.0 HadGEM1 ECHAM5-OM GFDL 2.11971-2000

SUSTAINABILITY - EROSION
Source: FERTILISER: A key to Profitable Livestock Production & Sustainable Pastures
• SOILLOSS software - DLWC
CCSM 3.0 HadGEM1 ECHAM5-OM GFDL 2.11970 - 2000
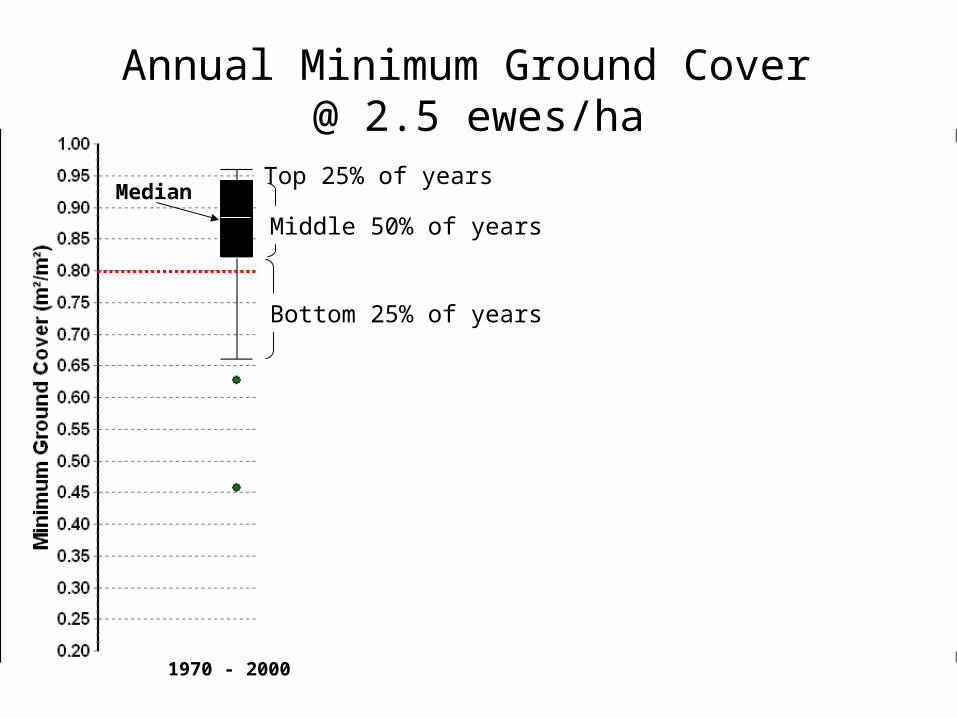
Annual Minimum Ground Cover @ 2.5 ewes/ha
Median
Bottom 25% of years
Top 25% of years
Middle 50% of years

Baseline @ 2.5 ewes/ha
13.8% of the time below 80% GC
70% of years Min GC > 80%
Echam @ 2.5 ewes/ha
30% of years Min GC > 80%
46.7% of the time below 80% GC
Echam @ 0.7 ewes/ha
63% of years Min GC > 80%
13.8% of the time below 80% GC

Merino breeding past and future
Median Annual pasture kgDM/ha
Sustainable Stocking Rate
Average Profit/ha
1970 to 2000 5833 2.5 ewes/ha $72
2000 to 2009 4717 2.5 ewes/ha(1.5 ewes/ha)
$52($8)
CCSM 3.0 6697 2.6 ewes/ha $89
HadGEM1 6720 2 ewes/ha $46
ECHAM5-OM 4258 0.7 ewes/ha -$31
GFDL 5712 1.6 ewes/ha $20

Projected profit for merino breeding at Bungarby
CCSM 3.0 HadGEM1 ECHAM5-OM GFDL 2.11970 - 2000
2000
2001 2002
2003
2004
2005
2006
2007
20082009
1.5/
ha
2.5/
ha

Annual Supplement (per ewe)
CCSM 3.0 HadGEM1 ECHAM5-OM GFDL 2.11970 - 2000
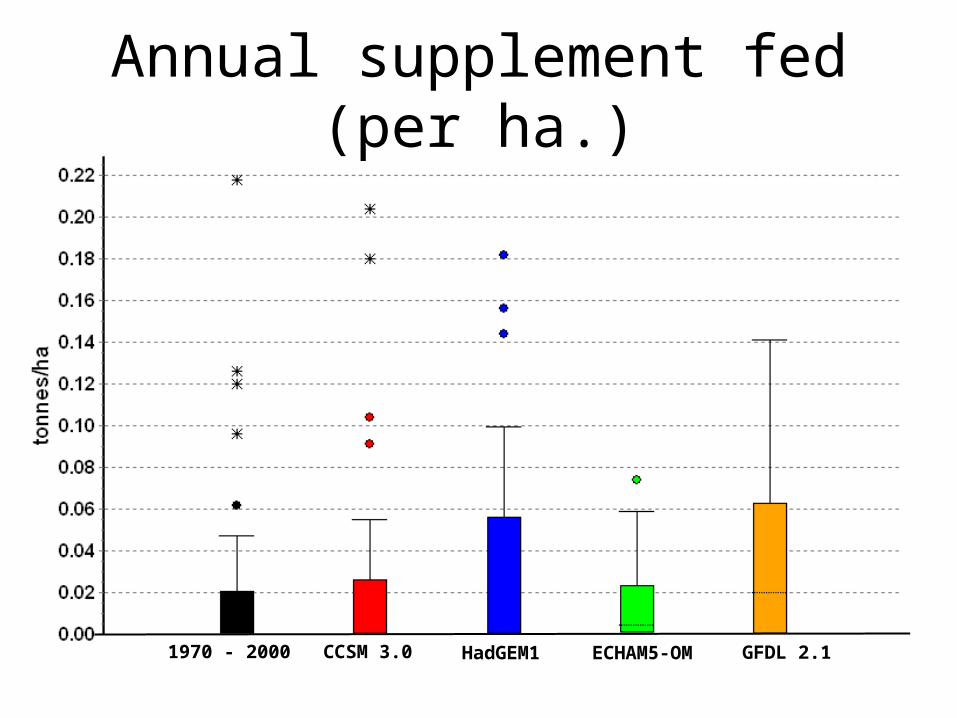
Annual supplement fed (per ha.)
CCSM 3.0 HadGEM1 ECHAM5-OM GFDL 2.11970 - 2000

Wool Cut
CCSM 3.0 HadGEM1 ECHAM5-OM GFDL 2.11970 - 2000

Condition Score at lambing
CCSM 3.0 HadGEM1 ECHAM5-OM GFDL 2.11970 - 2000
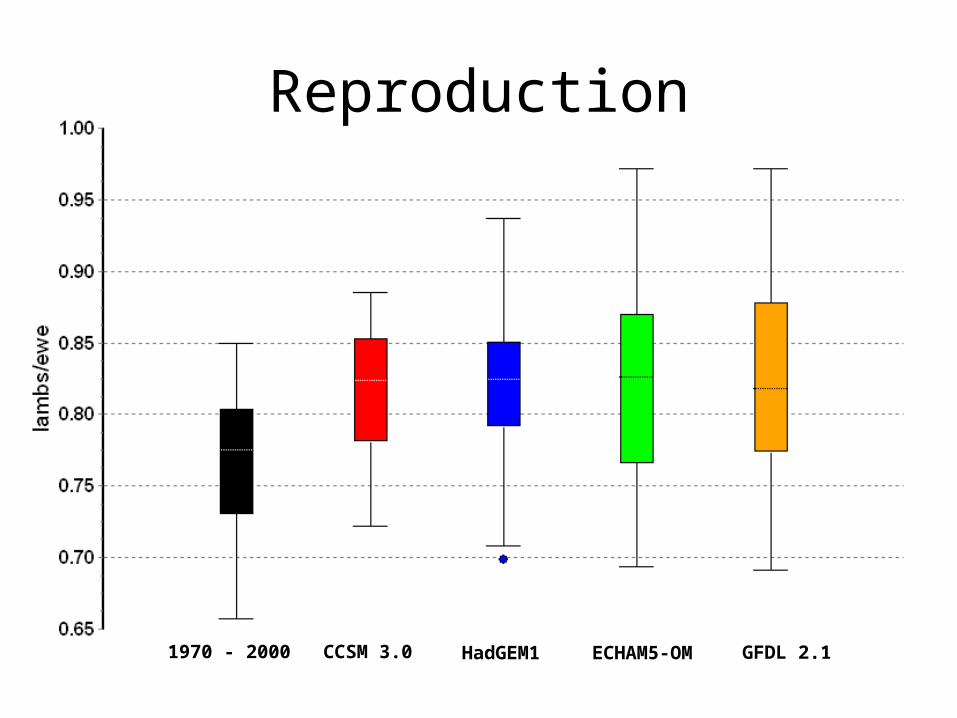
Reproduction
CCSM 3.0 HadGEM1 ECHAM5-OM GFDL 2.11970 - 2000
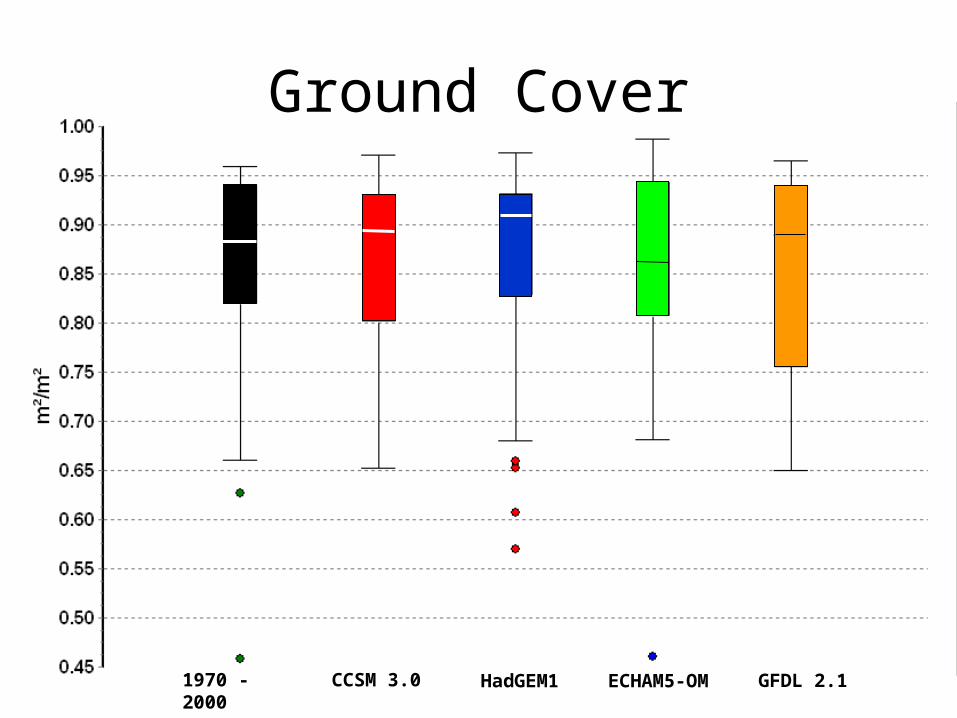
Ground Cover
CCSM 3.0 HadGEM1 ECHAM5-OM GFDL 2.11970 - 2000
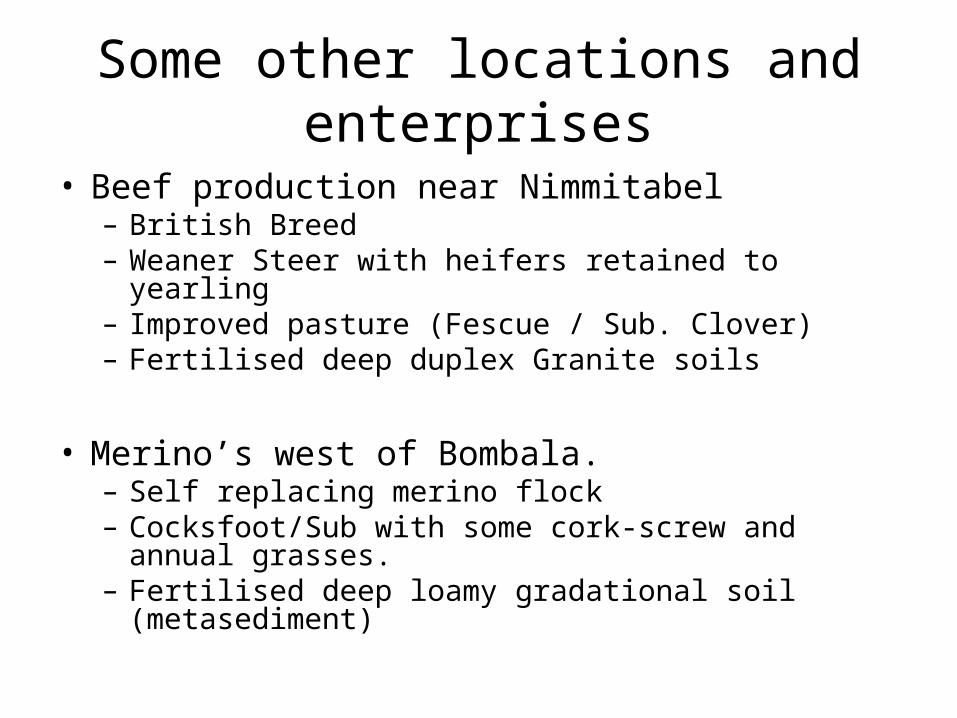
Some other locations and enterprises
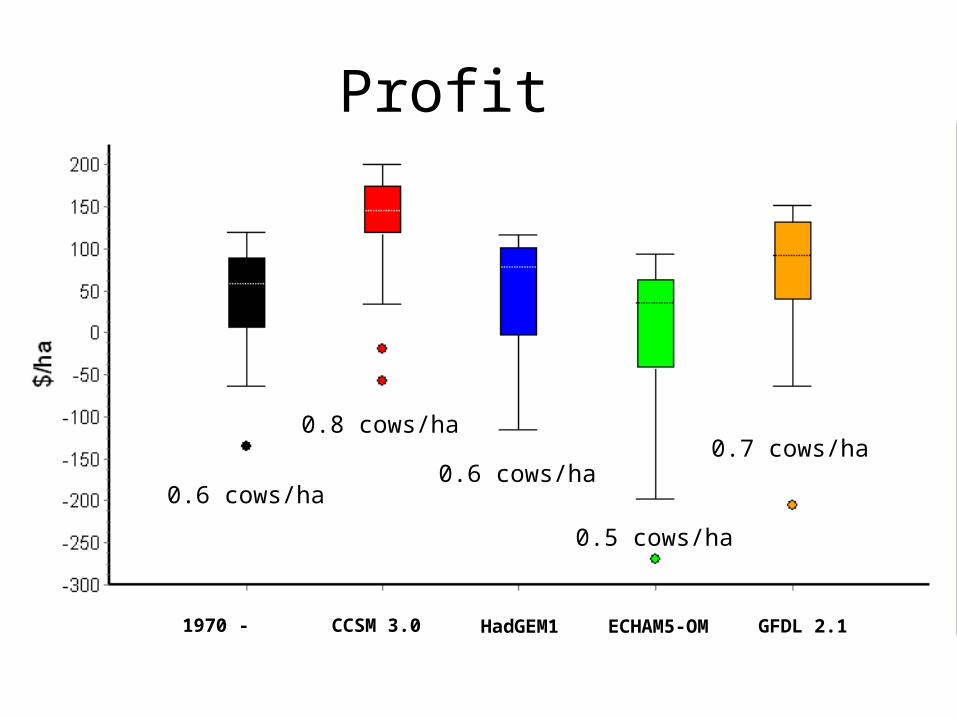
• Beef production near Nimmitabel– British Breed– Weaner Steer with heifers retained to yearling– Improved pasture (Fescue / Sub. Clover)– Fertilised deep duplex Granite soils
• Merino’s west of Bombala.– Self replacing merino flock – Cocksfoot/Sub with some cork-screw and annual
grasses.– Fertilised deep loamy gradational soil (metasediment)
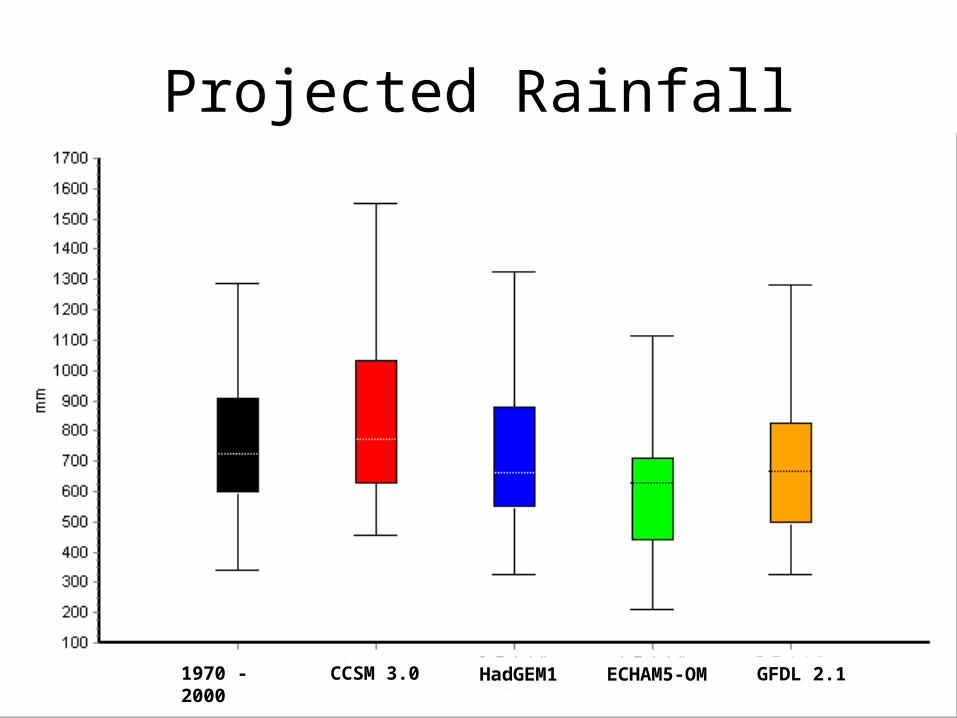
Projected Rainfall
CCSM 3.0 HadGEM1 ECHAM5-OM GFDL 2.11970 - 2000
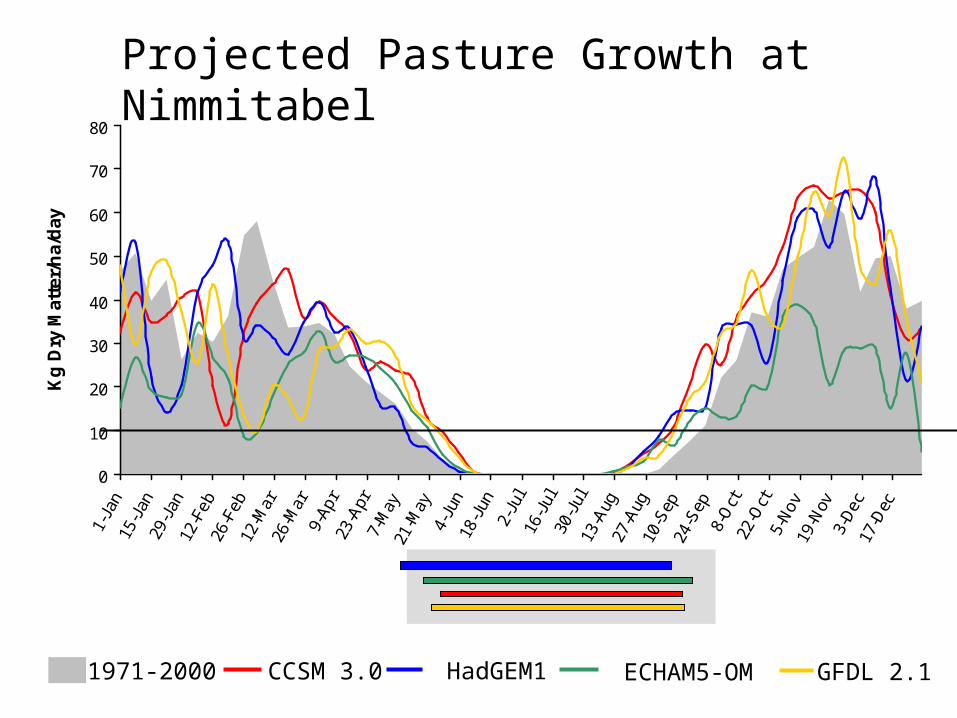
Projected Pasture Growth at Nimmitabel
0
10
20
30
40
50
60
70
80
1-Ja
n15
-Jan
29-J
an12
-Feb
26-F
eb12
-Mar
26-M
ar9-
Apr
23-A
pr7-
May
21-M
ay4-
Jun
18-J
un2-
Jul
16-J
ul30
-Jul
13-A
ug27
-Aug
10-S
ep24
-Sep
8-O
ct22
-Oct
5-N
ov19
-Nov
3-D
ec17
-Dec
Kg
Dry
Mat
ter/
ha/
day
CCSM 3.0 HadGEM1 ECHAM5-OM GFDL 2.11971-2000
Profit
CCSM 3.0 HadGEM1 ECHAM5-OM GFDL 2.11970 - 2000
0.6 cows/ha
0.8 cows/ha
0.6 cows/ha
0.5 cows/ha
0.7 cows/ha

Some other locations and enterprises
Merino’s west of Bombala.– Self replacing merino flock – Cocksfoot/Sub with some cork-screw and
annual grasses.– Fertilised deep loamy soil
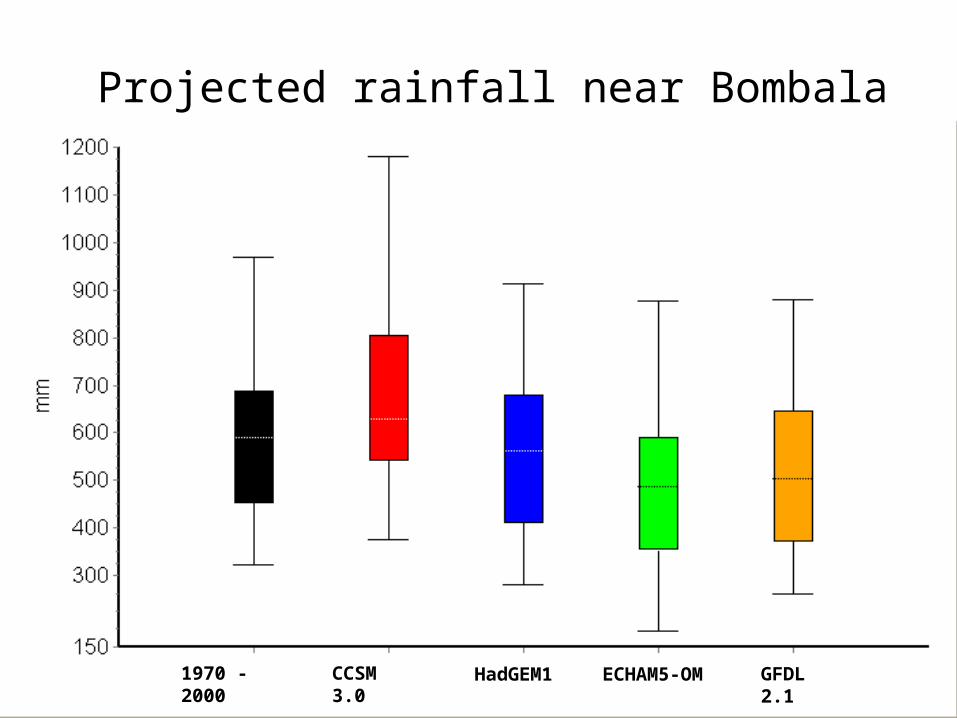
Projected rainfall near Bombala
CCSM 3.0 HadGEM1 ECHAM5-OM GFDL 2.11970 - 2000
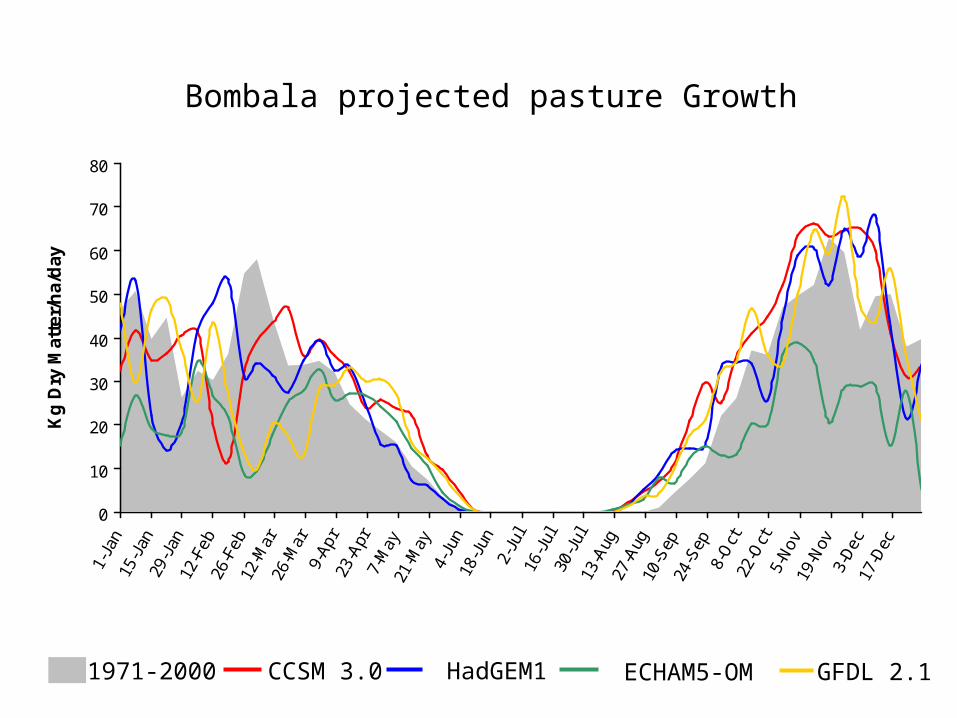
Bombala projected pasture Growth
0
10
20
30
40
50
60
70
80
1-Ja
n15
-Jan
29-J
an12
-Feb
26-F
eb12
-Mar
26-M
ar9-
Apr
23-A
pr7-
May
21-M
ay4-
Jun
18-J
un2-
Jul
16-J
ul30
-Jul
13-A
ug27
-Aug
10-S
ep24
-Sep
8-O
ct22
-Oct
5-N
ov19
-Nov
3-D
ec17
-Dec
Kg
Dry
Mat
ter/
ha/
day
CCSM 3.0 HadGEM1 ECHAM5-OM GFDL 2.11971-2000
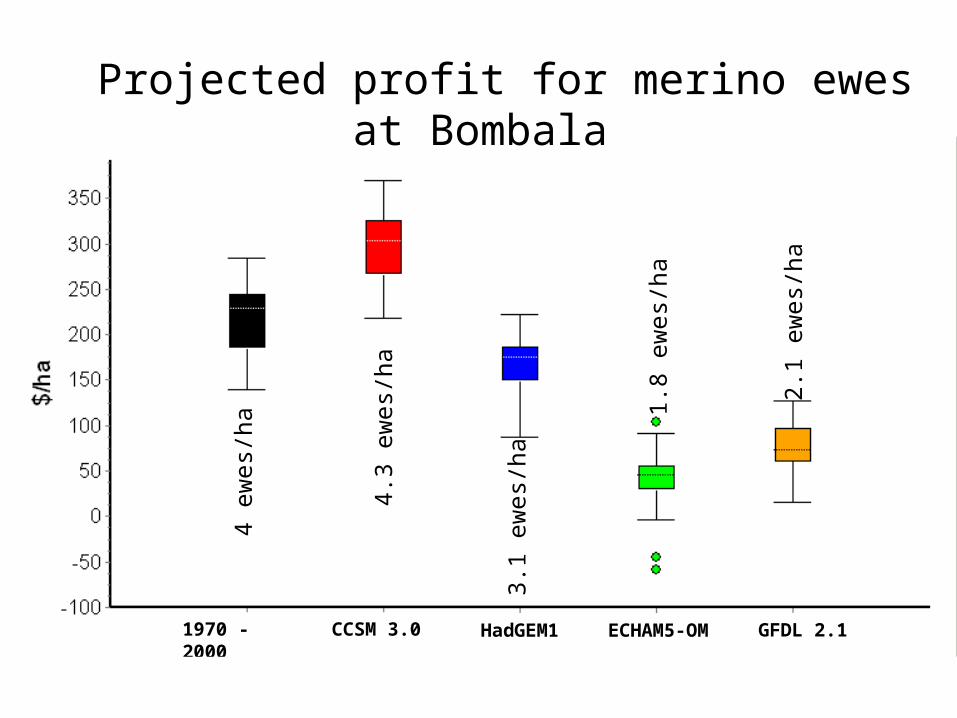
Projected profit for merino ewes at Bombala
CCSM 3.0 HadGEM1 ECHAM5-OM GFDL 2.11970 - 2000
4 ew
es/h
a
4.3
ewes
/ha
3.1
ewes
/ha
1.8
ewes
/ha
2.1
ewes
/ha

Possible impacts without adaptation
• Lower ground cover
• Lower sustainable carrying capacity
• Lower profits/ha.– BUT
• Not necessarily the case for all locations and all climate projections?
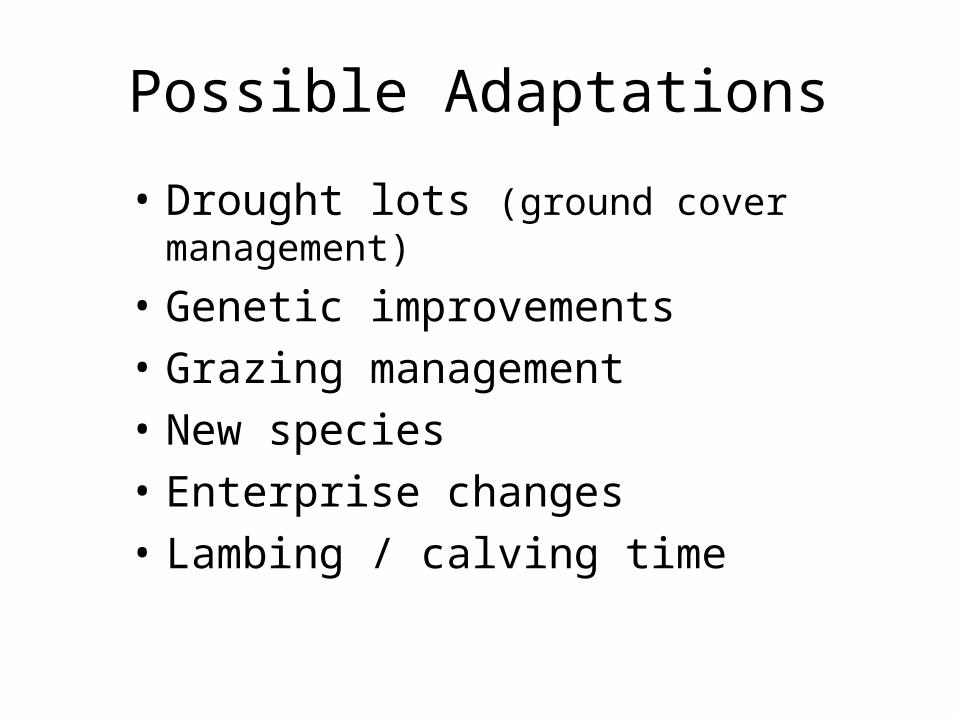
Possible Adaptations
• Drought lots (ground cover management)
• Genetic improvements
• Grazing management
• New species
• Enterprise changes
• Lambing / calving time

+ 10% Fleece weight @ -0.5 µm
CCSM 3.0 HadGEM1 ECHAM5-OM GFDL 2.11970 - 2000
4 ew
es/h
a
4.3
ewes
/ha
3.1
ewes
/ha
1.8
ewes
/ha
2.1
ewes
/ha
Climate change is truly serious !

National Southern Livestock Adaptation 2030 Partners
Local Cooperators
Top Related