


Languages
Pages
Legal


The human histamine H2-receptor couples more efficiently to Sf9
insect cell Gs-proteins than to insect cell Gq-proteins: limitations
of Sf9 cells for the analysis of receptor/Gq-protein coupling
Christine Houston,* Katharina Wenzel-Seifert,* Tilmann Burckstummer and Roland Seifert*
*Department of Pharmacology and Toxicology, The University of Kansas, Lawrence, USA
Department of Molecular Biosciences, The University of Kansas, Lawrence, USA
Abstract
The human histamine H2-receptor (hH2R) couples to
Gs-proteins to activate adenylyl cyclase and to Gq-proteins to
activate phospholipase C, but phospholipase C activation has
not consistently been observed. The aim of this study was to
compare coupling of hH2R to insect and mammalian Gs- and
Gq-proteins in Spodoptera frugiperda (Sf9) cells. Interaction of
hH2R with mammalian G proteins was assessed with coex-
pressed proteins or receptor-Ga fusion proteins that enhance
coupling efficiency. hH2R efficiently coupled to insect
Gs-proteins to activate adenylyl cyclase. However, hH2R
poorly coupled to insect Gq-proteins as assessed by the lack
of enhancement of histamine-stimulated steady-state GTP
hydrolysis by regulators of G protein signaling (RGS proteins).
In contrast, RGS-proteins efficiently enhanced GTP hydrolysis
stimulated by the human platelet-activating factor receptor
(PAFR) and the histamine H1-receptor (H1R) from man and
guinea pig. The measurement of intracellular free Ca2+
concentration was not useful for studying receptor/Gq-protein
coupling. hH2R also efficiently interacted with mammalian
Gs-proteins, specifically with fused Gsa as assessed by
guanosine 5¢-O-(3-thiotriphosphate) (GTPcS)-sensitive high-
affinity agonist binding, agonist-stimulated [35S]GTPcS bind-
ing and adenylyl cyclase activation. In contrast, coupling of
hH2R to coexpressed and fused mammalian Gqa was poor.
However, our inability to reconstitute efficient coupling of
PAFR and H1R to mammalian Gqa indicated that a large
portion of the expressed G protein was functionally inactive.
Taken together, our data show that hH2R couples more effi-
ciently to insect cell Gs-proteins than to insect cell Gq-proteins.
Unfortunately, there are significant limitations in the useful-
ness of Sf9 cells for comparing the coupling of receptors to
mammalian Gs- and Gq-proteins and assessing Gq-mediated
activation of effector systems.
Keywords: fusion protein, Gq-protein, Gs-protein, H2-recep-
tor, regulator of G proteins, Sf9 insect cells.
J. Neurochem. (2002) 80, 678–696.
The histamine H2-receptor (H2R) is a prototypical neuro-
transmitter receptor that belongs to the superfamily of
G protein-coupled receptors (GPCRs) (Leurs et al. 1995; Hill
coupled receptor; gpH1R, guinea pig histamine H1-receptor; gpH2R,
guinea pig histamine H2-receptor; Gq-proteins, family of G proteins
(comprising mammalian Gqa, G11a, G14a, G15a and G16a and insect Gq-
proteins) that mediates phospholipase C activation; Gs-proteins, family
of G proteins (comprising mammalian Gsa-short, Gsa-long, Gsa-extralong and
Gaolf and insect Gs-proteins) that mediates adenylyl cyclase activation;
GsaL, long splice variant of the Gs-protein Gsa; GsaS, short splice variant
of the Gs-protein Gsa; GTPcS, guanosine 5¢-O-(3-thiotriphosphate);hH1R, human histamine H1-receptor; hH2R, human histamine H2-re-
ceptor; hH2R-GsaL, fusion protein containing the human histamine H2-
receptor and the long splice variant of Gsa; hH2R-GsaS, fusion protein
containing the human histamine H2-receptor and the short splice variant
of Gsa; HIS, histamine; HxR, non-specified histamine receptor;
[3H]MEP, [3H]mepyramine; MP, mastoparan (INLKALAALAKKIL);
PAF, platelet-activating factor; PAFR, human receptor for platelet-acti-
vating factor; PLC, phospholipase C; RGS4, regulator of G protein
signaling 4; rH2R, rat histamine H2-receptor; SDS–PAGE, sodium
dodecyl sulfate–polyacrylamide gel electrophoresis; TG, thapsigargin;
[3H]TIO, [3H]tiotidine.
Received September 7, 2001; revised manuscript received November 27,
2001; accepted November 29, 2001.
Address correspondence and reprint requests to Roland Seifert, De-
partment of Pharmacology and Toxicology, The University of Kansas,
Malott Hall, Room 5064, 1251 Wescoe Hall Drive, Lawrence, KS
66045–7582, USA. E-mail: [email protected]
Abbreviations used: AC, adenylyl cyclase; b2AR, human b2-adreno-
ceptor; b2AR-GsaL, fusion protein containing the human b2AR and the
long splice variant of Gsa; BSA, bovine serum albumin; [Ca2+]i, intra-
cellular free Ca2+ concentration; [3H]DHA, [3H]dihydroalprenolol; Ga,
non-specified G protein a-subunit; GAIP, G-alpha interacting protein, a
regulator of G protein signaling (RGS) protein; GPCR, G protein-
Journal of Neurochemistry, 2002, 80, 678–696
678 Ó 2002 International Society for Neurochemistry, Journal of Neurochemistry, 80, 678–696

et al. 1997). The H2R is widely distributed in the brain, with
the highest densities found in the basal ganglia, hippocampus,
amygdala and cortex (Traiffort et al. 1992a). There is evidence
to support the assumption that the human H2R (hH2R) plays a
role in the development of Huntington’s chorea (Martinez-Mir
et al. 1993), autism (Linday et al. 2001), schizophrenia
(Martinez 1999) and brain tumors (Panula et al. 2000), but
overall, the function of the hH2R in the brain is still poorly
understood. In order to better understand the function of the
hH2R in brain functions it is essential to have detailed
knowledge on the signaling pathways regulated by this
GPCR. It has been consistently reported that the hH2R
activates adenylyl cyclase (AC) through the G protein Gs both
in native and recombinant systems (Bristow et al. 1982;
Gespach and Abita 1982; Mitsuhashi et al. 1989; Leurs et al.
1994; Alewijnse et al. 1998; Wang et al. 2000). In addition to
AC activation, the hH2R can also mediate phospholipase C
(PLC) activation via Gq-proteins, but PLC activation has not
consistently been observed (Mitsuhashi et al. 1989; Seifert
et al. 1992; Leurs et al. 1994; Burde and Seifert 1996; Wang
et al. 2000). Moreover, the functional importance of hH2R-
mediated PLC activation is elusive.
The uncertainty regarding Gq-coupling of the hH2R
prompted us to compare Gs- and Gq-coupling of the hH2R
under defined experimental conditions. We used Sf9 insect
cells as an expression system and studied H2R/G protein
coupling in three different settings. First, we assessed
coupling of hH2R to the endogenous insect cell G proteins.
Second, we analyzed coupling of hH2R to coexpressed
mammalian G proteins. Third, we studied coupling of hH2R
fused to mammalian Ga-subunits. GPCR-Ga fusion proteins
ensure close physical proximity between GPCR and Ga and
ensure efficient interaction (Seifert et al. 1999; Milligan
2000). While efficient coupling in GPCR-Gsa fusion proteins
is well established (Bertin et al. 1994; Seifert et al. 1998b;
Unson et al. 2000; Wenzel-Seifert and Seifert 2000; Liu et al.
2001b), efficient coupling in GPCR-Gq/11a fusion proteins has
only recently been documented (Holst et al. 2001; Stevens
et al. 2001). As read-outs for GPCR/G protein coupling, we
determined GTPcS-sensitive high-affinity agonist binding as
well as agonist-stimulated [35S]GTPcS binding, steady-state
GTP hydrolysis and effector system activation. Here, we show
that the hH2R couples more efficiently to insect cell Gs-pro-
teins than to insect cell Gq-proteins, but there are limitations in
the usefulness of Sf9 cells as a model system for comparing
the coupling of GPCRs to mammalian Gs- and Gq-proteins
and assessing Gq-mediated activation of effector systems.
Materials and methods
Materials
The cDNA for hH2R was kindly provided by Dr I. Gantz
(University of Michigan Medical School and Ann Arbor VA
Medical Center, Ann Arbor, MI, USA) (Gantz et al. 1991). The
cDNAs for hH1R and gpH1R were kindly provided by Dr H. Fukui
(Department of Pharmacology, University of Tokushima, Tokushi-
ma, Japan) (Horio et al. 1993; Fukui et al. 1994). Baculoviruses
encoding mammalian Gqa, RGS4 and GAIP were kindly donated by
Dr E. Ross (Department of Pharmacology, University of South-
western Medical Center, Dallas, TX, USA). The baculoviruses
encoding GsaS and Gia2 were kindly provided by Drs R. Sunahara
and A. G. Gilman (Department of Pharmacology, University of
Southwestern Medical Center, Dallas, TX, USA). The baculovirus
encoding G protein subunits b1c2 was a gift from Dr P. Gierschik
(Department of Pharmacology and Toxicology, University of Ulm,
Germany). The baculovirus encoding rH2R was kindly donated by
Drs C. Harteneck and G. Schultz (Department of Pharmacology,
Free University of Berlin, Germany). The construction of FLAG
epitope- and hexahistidine-tagged cDNAs for b2AR-GsaL, hH2R-
GsaS, hH2R, gpH2R and PAFR was described elsewhere (Seifert
et al. 1998a; Kelley et al. 2001; Seifert and Wenzel-Seifert 2001).
Fura-2-acetoxymethylester was from Molecular Probes (Eugene,
OR, USA). The anti-FLAG Ig (M1 monoclonal antibody), HIS, TG,
MP, GdCl3, LaCl3 and PAF were from Sigma (St. Louis, MO, USA).
Octopamine was from RBI (Natick, MA, USA). The anti-Gsa Ig
(C-terminal) and the anti-Gqa Igs 371730, 371752 and 371754 and
recombinant mammalian Gqa purified from E. coli. were from
Calbiochem (La Jolla, CA, USA). The K20 Ig, anti-RGS4 Ig
(N-terminal) and anti-GAIP Ig (N-terminal) were from Santa Cruz
(Santa Cruz, CA, USA). [a-32P]ATP (3000 Ci/mmol), [35S]GTPcS(1100 Ci/mmol), [c-32P]GTP (6000 Ci/mmol), [3H]DHA
(85–90 Ci/mmol) and [3H]TIO (90 Ci/mmol) were from Perkin
Elmer Life Sciences (Boston, MA, USA). [3H]MEP (30 Ci/mmol)
was from Amersham Pharmacia Biotech (Piscataway, NJ, USA). All
unlabeled nucleotides were of the highest purity available and were
either from Roche (Indianapolis, IN, USA) or Sigma. All restriction
enzymes and T4 DNA ligase were from New England Biolabs
(Beverly, MA, USA). Cloned Pfu DNA polymerase was from
Stratagene (La Jolla, CA, USA). The GC-RICH PCR-System was
from Roche. Unless specifically stated otherwise, PCRs were
conducted with Pfu DNA polymerase. Sf9 cells were from the
American Type Cell Culture Collection (Rockville, MD, USA). All
other reagents were of the highest purity available and were from
Fisher (Pittsburgh, PA, USA) or Sigma.
Construction of FLAG epitope- and hexahistidine-tagged
cDNA for hH2R-Gqa
In PCR 1, the C-terminal portion of hH2R was amplified using
pGEM-3Z-SF-hH2R as template, a sense primer annealing 5¢ of theengineered EcoR V site of the hH2R and an antisense primer
annealing with the hexahistidine tag. In PCR 2, the sequence of Gqa
was amplified, using pGEM-3Z-SF-b2AR-Gqa as template, a sense
primer annealing with the hexahistidine tag and an antisense primer
annealing with the 5 C-terminal amino acids of Gqa, the stop codon
and a BamH I site. In PCR 3, the products of PCRs 1 and 2 annealed
in the hexahistidine region, and the sense primer of PCR 1 and the
antisense primer of PCR 3 were used. In this way, a fragment
encoding the C-terminal portion of the hH2R, a hexahistidine tag,
Gqa, a stop codon and a BamH I site was created. This fragment was
digested with EcoR V and BamH I and cloned into pGEM-3Z-
SFhH2R digested with EcoR V and BamH I. In this way, the
G protein coupling of human H2-receptor 679
Ó 2002 International Society for Neurochemistry, Journal of Neurochemistry, 80, 678–696

full-length cDNA for hH2R-Gqa was created. pGEM-3Z-SF-hH2R-
Gqa was digested with Nco I and BamH I to recover the fusion
protein cDNA and cloned into the baculovirus transfer vector pVL
1392-SF-b2AR-Gia2 digested with Nco I and BamH I. PCR-
generated DNA sequences were confirmed by extensive restriction
enzyme analysis and enzymatic sequencing.
Construction of FLAG epitope- and hexahistidine-tagged
cDNAs for hH1R and gpH1R
A DNA sequence encoding the cleavable signal peptide from
influenza hemagglutinin (S) followed by the FLAG epitope (F),
which is recognized by the M1 monoclonal antibody, was placed 5¢of the start codon of the hH1R and gpH1R in order to enhance GPCR
expression and allow immunological detection. We also added a
hexahistidine tag to the C-terminus of hH2R to allow future
purification and to provide additional protection against proteolysis.
The GPCR modifications were generated by sequential overlap-
extension PCRs.
In PCR 1A, the DNA for the SF region was amplified with
pGEM3Z-SF-hH2R-Gsas as template by using a sense primer 5¢ ofthe Sac I site near the SF sequence and an antisense primer
encoding the last 19 bp of the SF. In PCR 1B, the DNA sequence
of the hH1R was amplified using pDKCR-hH1R as template. The
sense primer annealed with the first 17 bp of the 5¢-end of the hH1R
and included the last 15 bp of the SF in its 5¢-extension. The
antisense primer encoded the five C-terminal amino acids of the
hH1R, a hexahistidine tag, the stop codon and an Xba I site. The
PCR was conducted with the GC-RICH PCR-System using 1 mM
GC-RICH resolution solution, denaturation at 95°C for 45 s,
annealing at 50°C for 45 s and extension at 72°C for 90 s for a total
of 30 cycles. In PCR 2, the products of PCR 1A and 1B were used
as templates and annealed in the F region. Amplification was
initiated with the sense primer of PCR 1 A and the antisense primer
of PCR 1B. In this way, a fragment encoding the signal sequence,
the FLAG epitope and hH1R cDNA with a hexahistidine tag
followed by an Xba I site was obtained. This fragment was digested
with Hind III and Xba I and cloned into pGEM-3Z-SF-human
formyl peptide receptor-6His digested with Hind III and Xba I.
pGEM-3Z-SF-hH1R was digested with Hind III and Xba I to
recover the hH1R cDNA and cloned into the baculovirus transfer
vector pVL 1392-SF-b2AR-Gia2 digested with Sac I and Xba I.
Since the N-terminal restriction site of the hH1R cDNA (Hind III)
did not match the corresponding restriction site in the transfer
vector (Sac I), a blunt-end ligation was performed. PCR-generated
DNA sequences were confirmed by extensive restriction enzyme
analysis and enzymatic sequencing.
In PCR 3, the DNA sequence of the gpH1R was amplified using
pEFBOS-gpH1R as template. The sense primer annealed with the
first 17 bp of the 5¢-end of the gpH1R and included the last 15 bp of
the SF in its 5¢-extension. The antisense primer encoded the five
C-terminal amino acids of the gpH1R, a hexahistidine tag, the stop
codon and an Xba I site. The PCR was conducted using the
GC-RICH PCR-System with 1 mM GC-RICH resolution solution,
denaturation at 95°C for 45 s, annealing at 50°C for 45 s and
extension at 72°C for 90 s for a total of 30 cycles.
In PCR 4, the sense primer of PCR 1 A and the antisense
primer of PCR 3 were used. The PCR was conducted using the
GC-RICH PCR-System with 1 mM GC-RICH resolution solution,
denaturation at 95°C for 45 s, annealing at 50°C for 45 s and
extension at 72°C for 90 s for a total of 30 cycles. In this way, a
fragment encoding the signal sequence, the FLAG epitope and
gpH1R cDNA with a hexahistidine tag followed by an Xba I site
was obtained. This fragment was digested with Sac I and Xba I
and cloned into pGEM-3Z-SF-human formyl peptide receptor-
6His digested with Sac I and Xba I. In this way, the full-length
cDNA for gpH1R was created. pGEM-3Z-SF-gpH1R was digested
with Sac I and Xba I to recover the gpH1R cDNA and cloned into
the baculovirus transfer vector pVL 1392-SF-b2AR-Gia2 digested
with Sac I and Xba I. PCR-generated DNA sequences were
confirmed by extensive restriction enzyme analysis and enzymatic
sequencing.
Generation of recombinant baculoviruses, cell culture
and membrane preparation
Sf9 cells were cultured in 250 mL disposable Erlenmeyer flasks at
28°C under rotation at 125 r.p.m. in SF 900 II medium (Life
Technologies, Carlsbad, CA, USA) supplemented with 5% (v/v)
fetal calf serum (Bio Whittaker, Walkersville, MD, USA) and
0.1 mg/mL gentamicin. Cells were maintained at a density of
0.5–6.0 · 106 cells/mL. Recombinant baculoviruses were generated
in Sf9 cells using the BaculoGOLD transfection kit (Pharmingen,
San Diego, CA, USA) according to the manufacturer’s instructions.
After initial transfection, high-titer virus stocks were generated by
two sequential virus amplifications. In the first amplification, cells
were seeded at 2.0 · 106 cells/mL and infected with a 1 : 100
dilution of the supernatant from the initial transfection. Cells were
cultured for 7 days, resulting in the death of virtually the entire cell
population. The supernatant fluid of this infection was harvested and
stored under light protection at 4°C. In a second amplification, cells
were seeded at 3.0 · 106 cells/mL and infected with a 1 : 20
dilution of the supernatant from the first amplification. Cells were
cultured for 48 h, and the supernatant fluid was harvested. After the
48 h culture, the majority of cells showed signs of infections (e.g.
altered morphology, viral inclusion bodies), but most of the cells
were still intact. The supernatant fluid from the second amplification
was also stored under light protection at 4°C and was the routine
virus stock for membrane preparations and intact cell experi-
ments. For infection, cells were sedimented by centrifugation and
suspended in fresh medium at 3.0 · 106 cells/mL. For membrane
preparation, cells were infected with a 1 : 100 dilution of high-titer
baculovirus stocks encoding GPCRs, Ga, b1c2, RGS proteins and/or
GPCR-Ga fusion proteins. Cells were cultured for 48 h before
membrane preparation. Sf9 membranes were prepared as described
(Seifert et al. 1998a), using 1 mM EDTA, 0.2 mM phenyl-
methylsulfonyl fluoride, 10 lg/mL benzamidine and 10 lg/mL
leupeptin as protease inhibitors. Membranes were suspended in
binding buffer (12.5 mM MgCl2, 1 mM EDTA and 75 mM Tris/HCl,
pH 7.4) and stored at ) 80°C until use. For determination of [Ca2+]i,
cells were infected with baculoviruses for 18–48 h and virus
dilutions of 1 : 100–1 : 10 000.
Receptor ligand binding assays
Membranes were thawed and sedimented by a 15-min centrifugation
at 4°C and 15 000 · g to remove residual endogenous guanine
nucleotides as far as possible. Membranes were resuspended in
binding buffer. [3H]TIO binding was carried out as described
680 C. Houston et al.
Ó 2002 International Society for Neurochemistry, Journal of Neurochemistry, 80, 678–696

(Kelley et al. 2001; Wenzel-Seifert et al. 2001). Briefly, each tube
(total volume 250 lL) contained 200–250 lg of protein. Incuba-
tions were conducted for 90 min at 25°C and shaking at 250 r.p.m.
For H2R saturation binding experiments, tubes contained 1–20 nM
[3H]TIO plus unlabeled TIO to obtain final ligand concentrations of
up to 300 nM. Non-specific [3H]TIO binding was determined in the
presence of 100 lM unlabeled TIO and amounted to �55–65% of
total binding with high [3H]TIO concentrations (Kelley et al. 2001;
Wenzel-Seifert et al. 2001). In agonist competition binding experi-
ments, reaction mixtures contained 10 nM [3H]TIO and unlabeled
HIS at various concentrations without or with GTPcS (10 lM).
Bound [3H]TIO was separated from free [3H]TIO by filtration
through GF/C filters, followed by three washes with 2 mL of
binding buffer (4°C). Filter-bound radioactivity was determined by
liquid scintillation counting. The experimental conditions chosen
ensured that not more than 5% of the total amount of [3H]TIO added
to binding tubes bound to filters. Non-specific binding with 10 nM
[3H]TIO amounted to �10–15% of total [3H]TIO binding.
In [3H]MEP binding assays each tube (total volume 500 lL)contained 20–25 lg of protein. Incubations were conducted for
90 min at 25°C and shaking at 250 r.p.m. For H1R saturation
binding experiments, tubes contained 0.2–20 nM [3H]MEP.
Non-specific binding was determined in the presence of 10 lM
unlabeled MEP and amounted to �50% of total binding with high
[3H]MEP concentrations. In agonist competition binding experi-
ments, reaction mixtures contained 2 nM [3H]MEP and unlabeled
HIS at various concentrations without or with GTPcS (10 lM).
Bound [3H]MEP was separated from free [3H]MEP by filtration
through GF/C filters, followed by three washes with 2 mL of
binding buffer (4°C). Filter-bound radioactivity was determined by
liquid scintillation counting. The experimental conditions chosen
ensured that not more than 5–10% of the total amount of [3H]MEP
added to binding tubes bound to filters. Non-specific binding with
2 nM [3H]MEP amounted to �10% of total [3H]MEP binding.
The expression level of b2AR and b2AR-GsaL was determined
with 10 nM [3H]DHA as radioligand as described (Seifert et al.
1998a).
Steady-state GTPase activity assay
GTPase activity was determined as described (Kelley et al. 2001;
Liu et al. 2001b). Briefly, membranes were thawed, sedimented and
resuspended in 10 mM Tris/HCl, pH 7.4. Assay tubes contained Sf9
membranes (10 lg of protein/tube) expressing various GPCRs
without or with RGS proteins and/or mammalian G proteins,
1.0 mM MgCl2, 0.1 mM EDTA, 0.1 mM ATP, 100 nM GTP, 1 mM
adenylyl imidodiphosphate, 5 mM creatine phosphate, 40 lg of
creatine kinase and 0.2% (w/v) bovine serum albumin (BSA) in
50 mM Tris/HCl, pH 7.4. Reactions mixtures additionally contained
solvent (basal) or the appropriate agonists at a maximally effective
concentration. Reaction mixtures (80 lL) were incubated for 3 min
at 25°C before the addition of 20 lL of [c-32P]GTP (0.2–0.5
lCi/tube). All stock- and work dilutions of [c-32P]GTP were
prepared in 20 mM Tris/HCl, pH 7.4. Reactions were conducted for
20 min at 25°C. Reactions were terminated by the addition of
900 lL of a slurry consisting of 5% (w/v) activated charcoal and
50 mM NaH2PO4, pH 2.0. Charcoal absorbs nucleotides but not Pi.
Charcoal-quenched reaction mixtures were centrifuged for 15 min at
room temperature at 15 000 g. Supernatant fluid of the reaction
mixtures was removed (700 lL), and 32Pi was determined by liquid
scintillation counting. Enzyme activities were corrected for sponta-
neous degradation of [c-32P]GTP. Spontaneous [c-32P]GTP degra-
dation was determined in tubes containing all of the above described
components plus a very high concentration of unlabeled GTP
(1 mM) that, by competition with [c-32P]GTP, prevents [c-32P]GTPhydrolysis by enzymatic activities present in Sf9 membranes.
Spontaneous [c-32P]GTP degradation was < 1% of the total amount
of radioactivity added using 20 mM Tris/HCl, pH 7.4, as solvent for
[c-32P]GTP. The experimental conditions chosen ensured that not
more than 10% of the total amount of [c-32P]GTP added was
converted to 32Pi.
[35S]GTPcS binding assay
[35S]GTPcS binding was determined as described (Seifert et al.
1998a; Wenzel-Seifert et al. 2001). Briefly, membranes were thawed
and sedimented by a 15-min centrifugation at 4°C and 15 000 · g
to remove residual endogenous guanine nucleotides as far as
possible and resuspended in binding buffer. Reaction mixtures (total
volume 500 lL) contained Sf9 membranes (15–20 lg of protein/
tube) expressing various proteins in binding buffer supplemented
with 0.05% (w/v) BSA, 0.4 nM [35S]GTPcS and unlabeled GDP at
various concentrations. Reaction mixtures additionally contained
distilled water (basal) or HIS at a saturating concentration (100 lM).
Incubations were conducted for 60 min at 25°C and shaking at
250 r.p.m. Bound [35S]GTPcS was separated from free [35S]GTPcSby filtration through GF/C filters, followed by three washes with
2 mL of binding buffer (4°C). Filter-bound radioactivity was
determined by liquid scintillation counting. The experimental
conditions chosen ensured that no more than 10% of the total
amount of [35S]GTPcS added was bound to filters. Non-specific
binding with 0.4 nM [35S]GTPcS amounted to < 0.1% of total
[35S]GTPcS binding. Bound [35S]GTPcS was separated from free
[35S]GTPcS by filtration through GF/C filters, followed by three
washes with 2 mL of binding buffer (4°C). Filter-bound radio-
activity was determined by liquid scintillation counting.
In time course experiments, Sf9 membranes expressing various
proteins were suspended in 1500 lL of binding buffer supple-
mented with 1 nM [35S]GTPcS plus 9 nM unlabeled GTPcS, 1 lM
GDP, and distilled water (basal) or HIS (100 lM). Aliquots of
200 lL containing 25 lg of protein were withdrawn at different
time points.
AC activity assay
AC activity in Sf9 membranes was determined as described
(Alvarez and Daniels 1990; Liu et al. 2001b). Briefly, membranes
were thawed and sedimented by a 15-min centrifugation at 4°C and
15 000 g to remove residual endogenous guanine nucleotides as far
as possible and resuspended in binding buffer. Tubes contained Sf 9
membranes (30–50 lg of protein/tube) expressing various proteins,
5 mM MgCl2, 0.4 mM EDTA and 30 mM Tris/HCl, pH 7.4. Assay
tubes containing membranes and various additions in a total volume
of 30 lL were incubated for 3 min at 37°C before starting reactions
by the addition of 20 lL of reaction mixture containing (final)
[a-32P]ATP (1.0–1.5 lCi/tube) plus 40 lM unlabeled ATP, 2.7 mM
mono(cyclohexyl)ammonium phosphoenolpyruvate, 0.125 IU of
pyruvate kinase, 1 IU of myokinase and 0.1 mM cAMP. Reactions
were conducted for 20 min at 37°C. Reactions were terminated by
G protein coupling of human H2-receptor 681
Ó 2002 International Society for Neurochemistry, Journal of Neurochemistry, 80, 678–696

the addition of 20 lL of 2.2 N HCl. Denatured protein was
sedimented by a 3-min centrifugation at 25°C and 15 000 · g.
Sixty-five microliters of the supernatant fluid were applied onto
disposable columns filled with 1.3 g of neutral alumina (Sigma
A-1522, super I, WN-6). [32P]cAMP was separated from
[a-32P]ATP by elution of [32P]cAMP with 4 mL of 0.1 M
ammonium acetate, pH 7.0 (Alvarez and Daniels 1990). Recovery
of [32P]cAMP was �80%. Blank values were routinely �0.01% of
the total amount of [a-32P]ATP added. [32P]cAMP was determined
by liquid scintillation counting. The experimental conditions chosen
ensured that not more than 1–3% of the total amount of [a-32P]ATPadded was converted to [32P]cAMP.
Determination of [Ca2+]i
Sf9 cells were centrifuged for 5 min at 500 · g at 20°C. After thecentrifugation, the supernatant fluid was discarded, and cells were
suspended at 2.0 · 106 cells/mL in MBS buffer [10 mM NaCl,
60 mM KCl, 17 mM MgCl2, 4 mM D-glucose, 110 mM sucrose,
10 mM MES and 0.1% (w/v) BSA, pH 6.2] supplemented with
1 mM CaCl2 and 2 lM fura-2-acetoxymethylester. Cells were
incubated for 45 min at 25°C under light protection. After loading
with fura-2, the same volume of MBS buffer as used for dye loading
was added to cells, followed by centrifugation for 5 min at 500 g
at 20°C. The supernatant fluid was discarded, and cells were
suspended in MBS buffer at a density of 2.0 · 106 cells/mL. Cells
(2.0 · 106) were transferred into microcentrifuge tubes and centri-
fuged for 5 min at 1000 g at 20°C. The supernatant fluid was
removed, and cells were stored at 4°C under light protection until
use. Cells were kept at 4°C for up to 2 h. Immediately prior to use
each cell pellet was suspended in 1 mL of MBS buffer and
transferred into a UV cuvette. An additional 960 lL of MBS buffer
supplemented with (final concentration) 1 mM CaCl2 or 1 mM
EGTA were added to the cuvette. In some experiments, GdCl3 or
LaCl3 (10 lM each) were added to cuvettes at this point. Cuvettes
were placed into a Shimadzu RF-5000 spectrofluorometer, and
fluorescence (kex ¼ 340 nm and kem ¼ 500 nm) was continuously
recorded at 22°C under constant stirring of cells at 1000 r.p.m. After
a 1-min recording of basal [Ca2+]i, stimulus was added to cells, and
fluorescence was recorded for an additional 3–4 min Thereafter,
Fmax was determined by adding Triton X-100 (0.1%, w/v) to cells.
Fmin was determined by adding EGTA (40 mM, pH 8.0) to cells.
[Ca2+]i-values were calculated as described (Seifert et al. 1992)
using a Kd value of 278 nM for binding of Ca2+ to fura-2 (Harteneck
et al. 1995).
Sodium dodecyl sulfate–polyacrylamide gel electrophoresis
(SDS–PAGE) and immunoblot analysis
Membrane proteins were separated on SDS–polyacrylamide gels
containing 10% (w/v) acrylamide. Proteins were then transferred
onto Immobilon P transfer membranes (Millipore, Bedford, MA,
USA). Membranes were reacted with M1 antibody, anti-Ga Igs
(from 1 : 100 to 1 : 1000) or anti-RGS protein Igs (1 : 100).
Immunoreactive bands were visualized by sheep anti-mouse IgG
(M1 antibody), donkey anti-rabbit IgG (anti-Ga Igs) and donkey
anti-goat IgG (anti-RGS protein Igs), respectively, coupled to
peroxidase, using o-dianisidine and H2O2 as substrates. Secondary
antibodies were used at 1 : 500–1 : 1000 dilutions.
Miscellaneous
Protein concentrations were determined using the Bio-Rad DC
protein assay kit (Bio-Rad, Hercules, CA, USA). The analysis of
hH2R-Gqa expression by reverse transcription (RT)-PCR and
digestion with restriction enzymes was performed as described
previously for the b2AR-Gqa fusion protein (Wenzel-Seifert and
Seifert 2000). Data shown in Figs 4 and 5 and Table 1 were
analyzed by non-linear regression with the Prism III program
(GraphPad, Prism, San Diego, CA, USA).
Results and discussion
Detection of recombinant proteins in Sf9 cell membranes
by radioligand binding and immunoblotting
In membranes expressing hH2R, the antagonist radioligand
[3H]TIO bound with a Kd value of 63.0 ± 9.3 nM and a
Bmax of 0.62 ± 0.04 pmol/mg (mean ± SD, n ¼ 3). The
corresponding values for hH2R-GsaS were 32.0 ± 4.6 nM
and 0.43 ± 0.02 pmol/mg (Wenzel-Seifert et al. 2001),
and for hH2R-Gqa the values were 36.7 ± 4.9 nM and
Table 1 Non-linear regression analysis of the binding properties of HIS in Sf9 membranes expressing hH2R without or with various G protein
subunits and in membranes expressing hH2R-Ga fusion proteins
Construct Kh (lM) Kl (lM) Rh (%) KhGTPcS (lM) KlGTPcS (lM) RhGTPcS (%)
hH2R – 1.09 (0.82–1.46) – – 1.44 (1.07–1.93) –
hH2R + GsaS 0.09 (0.02–0.58) 4.60 (1.41–15.0) 38.8 (12.8–64.9) – 1.78 (1.17–2.69) –
hH2R-GsaS 0.08 (0.05–0.13) 8.26 (4.00–17.0) 62.4 (54.3–70.6) 0.04 (0.01–0.40) 5.84 (3.67–9.30) 22.2 (11.1–33.3)
hH2R + Gqa + b1c2 – 1.80 (01.00–3.24) – – 2.34 (1.03–5.28) –
hH2R-Gqa + b1c2 – 1.24 (0.89–1.71) – – 2.06 (1.51–2.81) –
Agonist competition binding was determined as described in Materials and methods. The data shown in Fig. 4 were analyzed by non-linear
regression for best fit to monophasic or biphasic competition isotherms (F-test). Data shown are the means from three to seven independent
experiments performed in duplicates. Numbers in parentheses represent the 95% confidence intervals. Kh and Kl designate the dissociation
constants for the high- and low-affinity state of hH2R constructs, respectively. %Rh indicates the percentage of high-affinity binding sites. The
corresponding values obtained in the presence of GTPcS (10 lM) are referred to as KhGTPcS, KlGTPcS and percentage RhGTPcS, respectively. If data
were best fit to monophasic competition curves, data are listed under Kl and KlGTPcS, respectively.
682 C. Houston et al.
Ó 2002 International Society for Neurochemistry, Journal of Neurochemistry, 80, 678–696

0.17 ± 0.05 pmol/mg. The expression levels of hH2R con-
structs in the [3H]TIO saturation binding assay, specifically
those of fusion proteins, were lower than the expression
levels estimated by immunoblot analysis (hH2R,�1 pmol/mg,
Fig. 1a; hH2R-GsaS, �2 pmol/mg, Fig. 1b; hH2R-Gqa,
�1 pmol/mg, Fig. 1c). Similar observations were made
before for other H2R-Ga fusion proteins (Kelley et al.
2001; Wenzel-Seifert et al. 2001). These data show that
fusion of H2R to Ga diminishes accessibility of H2R for
[3H]TIO. The molecular basis for the reduced labeling of
hH2R-Ga fusion protein molecules by [3H]TIO relative to
non-fused hH2R is unknown, but from a practical standpoint
of view, these findings render the [3H]TIO saturation binding
assay less feasible for assessing the expression hH2R
constructs than the immunoblot analysis.
In the immunoblot, the expression of hH2R constructs was
estimated using b2AR or b2AR-GsaL expressed at defined
levels (determined by [3H]DHA saturation binding) as
standard. To estimate Gqa expression levels, we used
recombinant Gqa purified from E. coli as standard because
anti-Gqa Igs are not sensitive enough to detect GPCR-Gqa
fusion proteins (Wenzel-Seifert and Seifert 2000). We
estimated the expression levels of proteins by visual
inspection of gels because the varying shapes of proteins
caused by dimerization or different glycosylation rendered
densitometric analysis ambiguous.
First, we performed immunoblots with the M1 monoclonal
antibody that recognizes the N-terminal FLAG epitope
attached to fused and non-fused GPCRs. As reported before
(Seifert et al. 1998a), the b2AR migrates as a doublet of
�52 kDa, representing differently glycosylated forms of the
GPCR (Fig. 1a). Similarly, hH2R migrated as a doublet of
�35 kDa. In membranes expressing hH2R we also detected a
doublet in the �60-kDa region. Most likely, those bands
represent hH2R dimers. Dimers that are resistant to denatur-
ation by SDS and reducing agents were also observed for the
canine H2R (Fukushima et al. 1997). The b2AR used as
standard in Fig. 1a was expressed at a level of�3.9 pmol/mg.
Using identical amounts of protein loaded, we estimated that
hH2R (monomer plus dimer) was expressed at a level of
�1 pmol/mg. This value is �40% lower than the value
obtained in the [3H]TIO saturation binding experiments (see
above). Similar expression levels of hH2R were obtained
when the GPCR was coexpressed with GsaS and Gqa (data
not shown).
The apparent molecular masses of GsaS and GsaL are
�45 kDa and 52 kDa, respectively (Graziano et al. 1989).
The molecular mass of b2AR-GsaL was �104 kDa, and the
molecular mass of hH2R-GsaS was �76 kDa (Fig. 1b). It
should be noted that no bands below the fusion proteins were
Fig. 1 Analysis of the expression of hH2R, hH2R-GsaS and hH2R-Gqa
in Sf9 membranes. Sf9 membranes expressing various proteins were
prepared, separated by SDS–PAGE on gels containing 10% (w/v)
acrylamide, transferred onto Immobilon P membranes and probed with
the anti-FLAG Ig (M1 antibody). Shown are the horseradish peroxi-
dase-reacted membranes. Numbers on the left of membranes desig-
nate masses of marker proteins in kDa. The amounts of protein loaded
onto each lane are given below membranes. In (a), b2AR expressed at
a level of 3.9 pmol/mg was used as standard. In (b), b2AR-GsaL
expressed at a level of 8.6 pmol/mg was used as standard. In (c),
b2AR expressed at 12.1 pmol/mg was used as standard.
G protein coupling of human H2-receptor 683
Ó 2002 International Society for Neurochemistry, Journal of Neurochemistry, 80, 678–696

detected, indicating that fusion proteins were not degraded.
b2AR-GsaL used as standard in Fig. 1(b) was expressed at a
level of �8.6 pmol/mg. Comparing identical amounts of
protein loaded, we estimated that hH2R-GsaS was expressed
at a level of �2 pmol/mg. The [3H]TIO saturation binding
experiments gave a �5-fold lower expression level of hH2R-
GsaS (see above).
The molecular mass of Gqa is �42 kDa (Hepler et al.
1993). As predicted, the molecular mass of hH2R-Gqa was
�77 kDa, and no degradation products were detected
(Fig. 1c). Using b2AR expressed at 12.1 pmol/mg as stan-
dard and loaded at a four times lower amount than hH2R-
Gqa, the expression level of hH2R-Gqa was estimated to be
� 1 pmol/mg. The [3H]TIO saturation binding experiments
gave a �six-fold lower expression level of hH2R-Gqa (see
above).
As expected (Graziano et al. 1989), the anti-Gsa Ig
(recognizing the C-terminal sequence RMHLRQYELL)
detected a �45-kDa antigen in membranes coexpressing
hH2R and GsaS (Fig. 2a). In a previous study we reported
that GsaL is expressed at high levels (�100–150 pmol/mg)
in Sf9 membranes (Seifert et al. 1998a). GsaS was
expressed at much lower levels in Sf9 membranes
(�1 pmol/mg) than GsaL using b2AR-GsaL expressed at
7.0 pmol/mg as standard. The reason for the low expression
level of GsaS is not known, but we also observed that the
maximum expression levels of b2AR-GsaS are lower than
the maximum expression levels of b2AR-GsaL (Seifert et al.
1998b). However, as will be described below, despite the
low expression of GsaS, coupling of hH2R to this G protein
was quite efficient.
hH2R-GsaS and hH2R-GsaL were also detected by anti-Gsa
Ig, and as expected (Graziano et al. 1989; Seifert et al.
1998b), hH2R-GsaL migrated slightly slower in SDS–PAGE
than hH2R-GsaS (Fig. 2b). Expected, too, was the finding that
hH2R-GsaL was expressed at higher levels than hH2R-GsaS.
In a recent study we reported that in contrast to the
corresponding b2AR-Gsa fusion proteins (Seifert et al.
1998b; Wenzel-Seifert and Seifert 2000), there are only
few functional differences between hH2R-GsaS and hH2R-
GsaL (Wenzel-Seifert et al. 2001). Therefore, in the present
study, we focused on the analysis of the coupling of hH2R to
GsaS and did not include additional data on hH2R-GsaL. As
reported before (Seifert et al. 1998a), the anti-Gsa Ig
(C-terminal) did not react with the endogenous Gs-protein of
the insect cells (Fig. 2c). The antibody K20, reacting with the
internalsequence85–103ofGsaS(KEAIETIVAAMSNLVPPVE)
(Krieger-Brauer et al. 1999) reacted with GsaS but failed to
recognize insect Gsa, too (Fig. 2d).
We also studied the expression of Gq-proteins in Sf9 cells.
Recombinant mammalian Gqa purified from E. coli migrated
as a �49-kDa protein in SDS–PAGE and reacted with
antibody 371730, raised against recombinant mammalian
Gqa (Fig. 3a), antibody 371752, recognizing the internal
sequence (115–133) EVDVEKVSAFENPYVDAIK (Fig. 3b)
and antibody 371754, recognizing the internal sequence
(283–300) IMYSHLVDYFPEYDGPQR (Fig. 3c). However,
Fig. 2 Analysis of the expression of GsaS and hH2R-GsaS in Sf9
membranes. Sf9 membranes expressing various proteins were pre-
pared, separated by SDS–PAGE on gels containing 10% (w/v)
acrylamide, transferred onto Immobilon P membranes and probed with
the anti-Gsa Ig (C-terminal) (a–c) or antibody K20 (d). Shown are the
horseradish peroxidase-reacted membranes. Numbers on the left of
membranes designate masses of marker proteins in kDa. In (a), the
amounts of protein loaded onto each lane are given below the mem-
brane. In (b–d), 100 lg of protein were loaded onto each lane. In (a),
b2AR-GsaL expressed at a level of 7.0 pmol/mg was used as standard.
684 C. Houston et al.
Ó 2002 International Society for Neurochemistry, Journal of Neurochemistry, 80, 678–696

all anti-Gqa Igs studied failed to detect the endogenous Gq-
protein of Sf9 cells. In contrast, all anti-Gqa Igs studied (data
only shown for antibody 371754) detected mammalian Gqa
expressed in Sf9 cells that migrated as a �43-kDa protein
(Fig. 3d). The electrophoretic mobility of mammalian Gqa in
Sf9 membranes is in accordance with previous results
(Hepler et al. 1993). The difference in migration of recom-
binant Gqa from E. coli and Gqa expressed in Sf9 membranes
is explained by the fact that bacterially expressed G proteins
do not possess covalent modifications (Graziano et al. 1987,
1989) that have an impact on electrophoretic mobility. The
intensity of the immunoreactive band with 0.2 lg of
recombinant mammalian Gqa (equivalent to �5 pmoles of
protein) is �five-fold lower than the intensity of the Gqa
band observed with 50 lg of protein from Sf9 membranes
expressing hH2R plus Gqa. Thus, we estimated that in Sf9
membranes Gqa is expressed at levels of �500 pmol/mg.
These levels clearly surpass the expression levels achieved
for GsaL and Gia2 in Sf9 membranes (Seifert et al. 1998a;
Wenzel-Seifert et al. 1999; Seifert and Wenzel-Seifert 2001).
The expression level of hH2R-Gqa was below the detection
limit of Ig 371754 (Fig. 3d). Similar difficulties in detecting
the Gqa moiety were previously reported for the b2AR-Gqa
fusion protein (Wenzel-Seifert and Seifert 2000). Although
the analysis of the hH2R-Gqa fusion protein with the M1
monoclonal antibody suggested the expression of both
coupling partners in the fusion protein (Fig. 1c), we wished
to detect the Gqa moiety as well. Therefore, we reverse-
transcribed mRNA of Sf9 cells infected with the hH2R-Gqa
baculovirus and amplified the Gqa sequence by PCR. As was
reported for the b2AR-Gqa fusion protein (Wenzel-Seifert
and Seifert 2000), a 1146-bp sequence was amplified from
hH2R-Gqa-infected Sf9 cells that contained an Eco RI site at
position 937 and a Pst I site at position 1063 (data not
shown).
Taken together, the radioligand binding and immunoblot
studies demonstrate that hH2R, hH2R-GsaS, hH2R-Gqa, GsaS
and Gqa were all expressed in Sf9 cells, although at different
levels. By analogy to data obtained for Gi-proteins (Wenzel-
Seifert et al. 1999; Seifert and Wenzel-Seifert 2001), the
large molar excess of Gqa relative to hH2R was expected to
provide excellent conditions for efficient GPCR/G protein
coupling, particularly for ternary complex formation. Our
failure to detect the endogenous Gs- and Gq-proteins of Sf9
cells with various antibodies could be due to substantial
structural differences between mammalian and insect cell
G proteins and/or low expression levels of endogenous
G proteins. We cannot discriminate between these two
possibilities, but the efficient activation of AC by b2AR,
hH2R, gpH2R and rH2R and the RGS protein-enhancement
of PAFR-, hH1R- and gpH1R-stimulated GTP hydrolysis (see
below) provided functional evidence for the presence of
endogenous Gs- and Gq-proteins in the insect cells.
Ternary complex formation
One of the earliest steps of the G protein cycle is the
formation of the ternary complex (Kent et al. 1980). The
ternary complex consists of the agonist-occupied GPCR and
the guanine nucleotide-free G protein and is characterized by
high agonist-affinity. In most systems, binding of the
hydrolysis-resistant GTP analog GTPcS disrupts the ternary
complex, thereby decreasing agonist-affinity of GPCR.
However, in several systems comprising GPCRs coupled to
various classes of G proteins including Gi/Go-proteins that
exchange guanine nucleotides rapidly (Gilman 1987),
GTPcS does not or only partially disrupt the ternary
complex, indicative of tight GPCR/G–protein interaction
even in the presence of GTPcS (Stiles 1985; Childers et al.
1993; Szele and Pritchett 1993; Gurdal et al. 1997; Seifert
et al. 1998a). Similar to the b2AR (Seifert et al. 1998a,b),
ternary complex formation with hH2R was assessed
(a) (b)
(c) (d)
Fig. 3 Analysis of the expression of Gqa and hH2R-Gqa in Sf9
membranes. Sf9 membranes expressing various proteins were
prepared, separated by SDS–PAGE on gels containing 10% (w/v)
acrylamide, transferred onto Immobilon P membranes and probed with
the anti-Gqa Igs 371730 (a), 371752 (b) or 371754 (c and d). Shown
are the horseradish peroxidase-reacted membranes. Numbers on the
left of membranes designate masses of marker proteins in kDa. In
(a–c), 100 lg of membrane protein from Sf9 cells and 0.2 lg of
purified recombinant Gqa (rec. Gqa) were loaded onto each lane. In (d),
the amounts of protein loaded onto each lane are given below the
membrane.
G protein coupling of human H2-receptor 685
Ó 2002 International Society for Neurochemistry, Journal of Neurochemistry, 80, 678–696
indirectly by analyzing the displacement of antagonist
binding by unlabeled HIS.
With respect to b2AR/Gs interaction, it has been shown
that the coexpression of mammalian bc-complexes is not
required for ternary complex formation, presumably because
endogenous insect bc-complexes can interact with the b2AR
and mammalian Gsa (Seifert et al. 1998a). In addition, the
presence of mammalian bc-complexes renders the detection
of agonist-stimulation of AC more difficult (Seifert et al.
1998a). Therefore, we did not coexpress bc-complexes in
hH2R/Gsa reconstitutions. However, mammalian bc-com-
plexes enhance GPCR/G protein coupling in terms of ternary
complex formation (Seifert et al. 1998a), and mammalian
bc-complex is required to prevent aggregation of Gqa in Sf9
cells (Hepler et al. 1993). Based on these considerations we
coexpressed mammalian b1c2-complex in the hH2R/Gqa
reconstitutions in order to provide optimal coupling condi-
tions. As reported before (Wenzel-Seifert et al. 1998),
expression of b1c2-complex was associated with decreased
expression of insect cell bc-complex as assessed by immu-
noblotting with the anti-Gb-common Ig (data not shown).
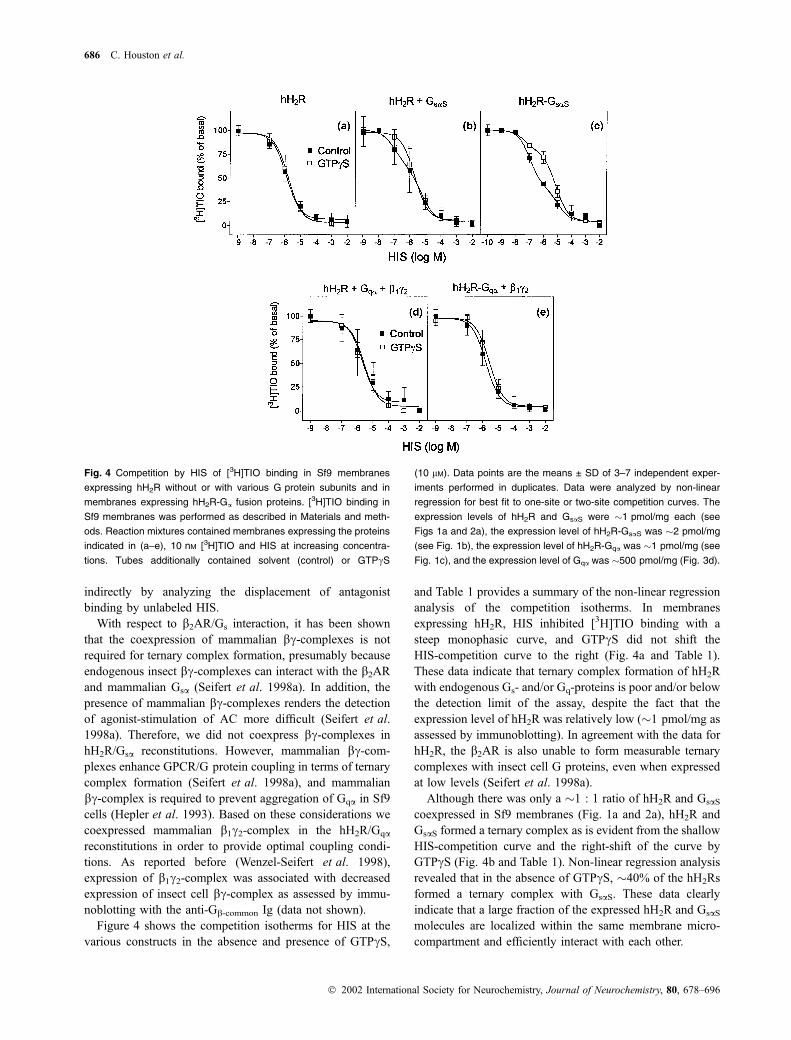
Figure 4 shows the competition isotherms for HIS at the
various constructs in the absence and presence of GTPcS,
and Table 1 provides a summary of the non-linear regression
analysis of the competition isotherms. In membranes
expressing hH2R, HIS inhibited [3H]TIO binding with a
steep monophasic curve, and GTPcS did not shift the
HIS-competition curve to the right (Fig. 4a and Table 1).
These data indicate that ternary complex formation of hH2R
with endogenous Gs- and/or Gq-proteins is poor and/or below
the detection limit of the assay, despite the fact that the
expression level of hH2R was relatively low (�1 pmol/mg as
assessed by immunoblotting). In agreement with the data for
hH2R, the b2AR is also unable to form measurable ternary
complexes with insect cell G proteins, even when expressed
at low levels (Seifert et al. 1998a).
Although there was only a �1 : 1 ratio of hH2R and GsaS
coexpressed in Sf9 membranes (Fig. 1a and 2a), hH2R and
GsaS formed a ternary complex as is evident from the shallow
HIS-competition curve and the right-shift of the curve by
GTPcS (Fig. 4b and Table 1). Non-linear regression analysis
revealed that in the absence of GTPcS, �40% of the hH2Rs
formed a ternary complex with GsaS. These data clearly
indicate that a large fraction of the expressed hH2R and GsaS
molecules are localized within the same membrane micro-
compartment and efficiently interact with each other.
Fig. 4 Competition by HIS of [3H]TIO binding in Sf9 membranes
expressing hH2R without or with various G protein subunits and in
membranes expressing hH2R-Ga fusion proteins. [3H]TIO binding in
Sf9 membranes was performed as described in Materials and meth-
ods. Reaction mixtures contained membranes expressing the proteins
indicated in (a–e), 10 nM [3H]TIO and HIS at increasing concentra-
tions. Tubes additionally contained solvent (control) or GTPcS
(10 lM). Data points are the means ± SD of 3–7 independent exper-
iments performed in duplicates. Data were analyzed by non-linear
regression for best fit to one-site or two-site competition curves. The
expression levels of hH2R and GsaS were �1 pmol/mg each (see
Figs 1a and 2a), the expression level of hH2R-GsaS was �2 pmol/mg
(see Fig. 1b), the expression level of hH2R-Gqa was �1 pmol/mg (see
Fig. 1c), and the expression level of Gqa was �500 pmol/mg (Fig. 3d).
686 C. Houston et al.
Ó 2002 International Society for Neurochemistry, Journal of Neurochemistry, 80, 678–696
For the b2AR, it has been shown that ternary complex
formation in a b2AR-Gsa fusion protein is more efficient than
in a coexpression system of b2AR plus Gsa (Seifert et al.
1998a). Similarly, in the hH2R-Gsa fusion protein, a larger
fraction of hH2Rs (�60% vs. �40% in the coexpression
system) formed a ternary complex in the absence of GTPcS(Figs 4b and c and Table 1). In the membranes expressing
hH2R-GsaS, GTPcS shifted the HIS-competition curve to the
right, but the agonist-competition curve was still shallow, i.e.
in the presence of GTPcS, �20% of the hH2Rs formed
a ternary complex. The partial GTPcS-insensitivity of high-
affinity agonist binding points to a very tight interaction of
hH2R with GsaS. GTPcS–insensitive interactions of GPCRs
with G proteins have been repeatedly observed (Citri and
Schramm 1982; Stiles 1985; Matesic et al. 1989; Childers
et al. 1993; Szele and Pritchett 1993; Gurdal et al. 1997;
Seifert et al. 1998a; Kelley et al. 2001). Given the only
incomplete labeling of hH2R constructs, specifically H2R-Ga
fusion proteins with [3H]TIO (see above), and the partially
GTPcS-insensitive high-affinity binding of HIS at hH2R-
GsaS it would have been desirable to study high-affinity
binding directly with [3H]HIS. Unfortunately, the Kh values
for HIS in membranes expressing hH2R + GsaS and hH2R-
GsaS are even higher than the Kd values for [3H]TIO
(Table 1), limiting assay sensitivity, and the interpretation of
[3H]HIS binding studies to H2R is complex, too (Steinberg
et al. 1985a,b,c).
Despite the favorable GPCR/G protein ratio in membranes
expressing hH2R plus Gqa compared to membranes exp-
ressing hH2R plus GsaS, the HIS-competition curves in the
hH2R/Gq coexpression system and hH2R-Gqa fusion protein
were steep and monophasic, and GTPcS shifted the compe-
tition curves only minimally to the right (Figs 4d and e).
These data show that Gqab1c2 is inefficient at stabilizing a
ternary complex with hH2R. It might be argued that
our inability to detect ternary complex formation in the
hH2R/Gqa systems is due to the fact that [3H]TIO labels only
a fraction of the expressed hH2R molecules and that the
molecules not labeled with [3H]TIO actually form a ternary
complex. However, with the non-fused hH2R, the [3H]TIO
saturation binding assay underestimates the actual expression
level to a much lesser extent than with hH2R-Gqa, and the
studies assessing guanine nucleotide exchange ([35S]GTPcSbinding and GTP hydrolysis) were consistent with the
agonist-competition studies (see below).
The H1R is a classic Gq-coupled GPCR (Leurs et al. 1995;
Hill et al. 1997). A typical property of Gq-coupled GPCRs
is the very long third intracellular loop (Wess 1997), a
feature that is also present in the H1R (Leurs et al. 1995;
Hill et al. 1997). Therefore, we expected to observe highly
efficient ternary complex formation in membranes expressing
hH1R or gpH1R expressed at 4.0 ± 0.4 pmol/mg and
3.5 ± 0.6 pmol/mg, respectively, as assessed by [3H]MEP
saturation binding plus �500 pmol/mg mammalian Gqa plus
b1c2-complex. However, similar to the data obtained with
membranes expressing hH2R plus Gqab1c2, the HIS compe-
tition isotherms for antagonist radioligand binding were steep
and monophasic in membranes expressing hH1R or gpH1R,
and GTPcS shifted the HIS competition curves only
minimally, if at all, to the right (data not shown). These
data indicated that Gqa, although expressed at high levels
in Sf9 membranes as assessed by immunoblotting and
expressed together with b1c2-complex to prevent aggregation
(Hepler et al. 1993), is nonetheless largely inactive and
therefore compromises the proper interpretation of data.
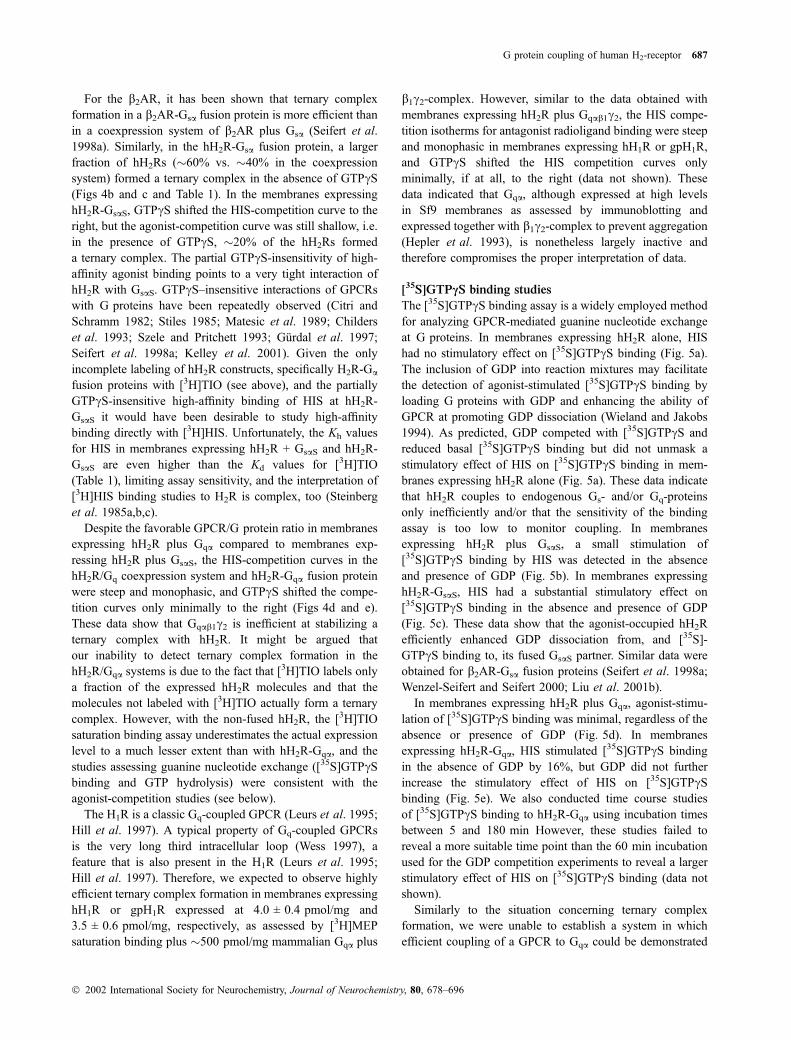
[35S]GTPcS binding studies
The [35S]GTPcS binding assay is a widely employed method
for analyzing GPCR-mediated guanine nucleotide exchange
at G proteins. In membranes expressing hH2R alone, HIS
had no stimulatory effect on [35S]GTPcS binding (Fig. 5a).
The inclusion of GDP into reaction mixtures may facilitate
the detection of agonist-stimulated [35S]GTPcS binding by
loading G proteins with GDP and enhancing the ability of
GPCR at promoting GDP dissociation (Wieland and Jakobs
1994). As predicted, GDP competed with [35S]GTPcS and
reduced basal [35S]GTPcS binding but did not unmask a
stimulatory effect of HIS on [35S]GTPcS binding in mem-
branes expressing hH2R alone (Fig. 5a). These data indicate
that hH2R couples to endogenous Gs- and/or Gq-proteins
only inefficiently and/or that the sensitivity of the binding
assay is too low to monitor coupling. In membranes
expressing hH2R plus GsaS, a small stimulation of
[35S]GTPcS binding by HIS was detected in the absence
and presence of GDP (Fig. 5b). In membranes expressing
hH2R-GsaS, HIS had a substantial stimulatory effect on
[35S]GTPcS binding in the absence and presence of GDP
(Fig. 5c). These data show that the agonist-occupied hH2R
efficiently enhanced GDP dissociation from, and [35S]-
GTPcS binding to, its fused GsaS partner. Similar data were
obtained for b2AR-Gsa fusion proteins (Seifert et al. 1998a;
Wenzel-Seifert and Seifert 2000; Liu et al. 2001b).
In membranes expressing hH2R plus Gqa, agonist-stimu-
lation of [35S]GTPcS binding was minimal, regardless of the
absence or presence of GDP (Fig. 5d). In membranes
expressing hH2R-Gqa, HIS stimulated [35S]GTPcS binding
in the absence of GDP by 16%, but GDP did not further
increase the stimulatory effect of HIS on [35S]GTPcSbinding (Fig. 5e). We also conducted time course studies
of [35S]GTPcS binding to hH2R-Gqa using incubation times
between 5 and 180 min However, these studies failed to
reveal a more suitable time point than the 60 min incubation
used for the GDP competition experiments to reveal a larger
stimulatory effect of HIS on [35S]GTPcS binding (data not
shown).
Similarly to the situation concerning ternary complex
formation, we were unable to establish a system in which
efficient coupling of a GPCR to Gqa could be demonstrated
G protein coupling of human H2-receptor 687
Ó 2002 International Society for Neurochemistry, Journal of Neurochemistry, 80, 678–696

in terms of [35S]GTPcS binding. Specifically, in membranes
expressing hH1R, gpH1R or PAFR, the latter being a dually
Gi/Gq-coupled GPCR (Shimizu et al. 1992; Seifert 2001),
plus Gqab1c2, agonist-stimulations of [35S]GTPcS binding
were not greater than in membranes expressing hH2R plus
Gqab1c2 or hH2R-Gqa plus b1c2-complex (data not shown).
Similar results as for [35S]GTPcS binding were obtained
steady-state GTPase activity in membranes expressing hH1R,
gpH1R or PAFR plus Gqab1c2 (data not shown). These
findings support the results of the agonist binding studies
suggesting that the majority of the expressed Gqa molecules
is functionally inactive.
AC studies
The assessment of AC activity is the most sensitive
parameter for studying GPCR/Gs-protein coupling because
of the signal amplification at the effector level (Gilman 1987;
Birnbaumer et al. 1990). Indeed, although we obtained no
evidence for ternary complex formation of hH2R with, and
agonist-stimulation of [35S]GTPcS binding to, endogenous
Gs-proteins (Figs 4a and 5a), AC studies revealed that the
hH2R couples to insect Gs-proteins quite efficiently. In the
presence of GTP, HIS stimulated AC activity in Sf9
membranes expressing hH2R by almost five-fold, and this
AC activation even surpassed AC activation by GTPcS(Fig. 6a). Previous studies already showed that the b2AR and
Fig. 6 Regulation of AC activity in Sf9 membranes expressing hH2R,
hH2R plus GsaS and hH2R-GsaS fusion protein. AC activity in Sf9
membranes was determined as described in Materials and methods.
Reaction mixtures contained membranes expressing the proteins
indicated in (a–c) and solvent (basal), GTP (100 lM), GTP (100 lM)
plus HIS (100 lM) or GTPcS (10 lM). Data points are the means ± SD
of 3–6 independent experiments performed in triplicates. The exp-
ression levels of hH2R and GsaS were �1 pmol/mg each (see Figs 1a
and 2a), and the expression level of hH2R-GsaS was �2 pmol/mg (see
Fig. 1b).
Fig. 5 Effect of HIS on [35S]GTPcS binding in Sf9 membranes
expressing hH2R without or with various G protein subunits and in
membranes expressing hH2R-Ga fusion proteins. [35S]GTPcS binding
in Sf9 membranes was performed as described in Materials and
methods. Reaction mixtures contained membranes expressing the
proteins indicated in (a–e), 0.4 nM [35S]GTPcS and GDP at increasing
concentrations. Tubes additionally contained solvent (basal) or HIS
(100 lM). Data points are the means ± SD of 3–5 independent
experiments performed in triplicates. Data were analyzed by non-
linear regression and were best fitted to one-site competition curves.
The expression levels of hH2R and GsaS were �1 pmol/mg each (see
Figs 1a and 2a), the expression level of hH2R-GsaS was �2 pmol/mg
(see Fig. 1b), the expression level of hH2R-Gqa was �1 pmol/mg (see
Fig. 1c), and the expression level of Gqa was �500 pmol/mg (Fig. 3d).
688 C. Houston et al.
Ó 2002 International Society for Neurochemistry, Journal of Neurochemistry, 80, 678–696

rH2R activate AC via Sf9 cell Gs-proteins (Parker et al.
1991; Chidiac et al. 1994; Kuhn et al. 1996; Beukers et al.
1997). In Sf9 membranes expressing gpH2R at 0.25 pmol/mg
as assessed by [3H]TIO saturation binding, HIS increased
AC activity from 0.95 ± 0.10 pmol/mg/min to 1.90 ± 0.15
pmol/mg/min (mean ± SD, n ¼ 3). In Sf9 membranes
expressing rH2R at 0.18 pmol/mg as assessed by
[3H]TIO saturation binding, HIS increased AC activity
from 1.03 ± 0.08 pmol/mg/min to 1.95 ± 0.22 pmol/mg/min
(mean ± SD, n ¼ 3). Collectively, these data show that the
AC assay possesses sufficiently high sensitivity to demon-
strate coupling of various mammalian GPCRs and of H2R
species isoforms to insect cell Gs-proteins.
We also wished to determine how efficient the coupling
of mammalian GPCRs to insect cell Gs-proteins is relative
to the coupling of insect cell GPCRs to Gs-proteins. To
address this question, we examined the effect of octopamine
(10 nM – 1 mM) on AC activity in membranes from
uninfected Sf9 cells. Octopamine is an important neuro-
transmitter in insect cells (Evans and Robb 1993) and was
reported to efficiently activate AC in membranes from
uninfected Sf9 cells (Orr et al. 1992). However, although
we could readily reproduce the reported AC activation by
forskolin (data not shown) and activate AC in membranes
from uninfected Sf9 cells with GTPcS (Seifert et al.
1998a), we were unable to demonstrate stimulatory effects
of octopamine on AC activity in this system (data not
shown). We do not have a satisfying explanation for these
apparent discrepancies, but differences in the cell culture
conditions may be a factor (see Materials and methods)
(Orr et al. 1992). Thus, unfortunately, we cannot assess
how efficient coupling of mammalian GPCRs to insect
Gs-proteins is relative to coupling of insect cell GPCRs to
those Gs-proteins.
In Sf9 membranes expressing hH2R plus GsaS, GTP
per se had a substantial stimulatory effect on AC activity
(Fig. 6b), presumably reflecting the constitutive, i.e. agonist-
independent, activity of the hH2R (Smit et al. 1996). HIS
increased AC activity in membranes coexpressing hH2R
and GsaS by �55%. Compared to membranes expressing
hH2R alone, the absolute AC activities in membranes
expressing hH2R plus GsaS were considerably higher, but in
terms of relative agonist-stimulation, coupling of hH2R to
insect cell Gs-proteins actually surpassed hH2R-coupling to
mammalian GsaS. Compared with membranes coexpressing
hH2R and GsaS, the absolute AC activities, particularly
basal AC activity in the absence of GTP, in membranes
expressing hH2R-GsaS were all higher (compare Figs 6b
and c). These data corroborate the data obtained for b2AR-Gsa fusion proteins showing that fusion of a GPCR to Gsa
increases the absolute AC activities (Bertin et al. 1994;
Seifert et al. 1998a). Presumably, fusion proteins and AC
molecules are targeted to the same microcompartments,
forming highly efficient AC-activating transducisomes
(Seifert et al. 1999).
Ca2+ signaling studies
For the analysis of Gq-signaling, we took advantage of the
fact that in many systems including Sf9 cells, PLC activation
results in Ca2+ mobilization from intracellular stores with
subsequent Ca2+ influx from the extracellular space through
cation channels (Hu et al. 1994; Harteneck et al. 1995; Kuhn
et al. 1996). Initially we wished to answer the question
whether there is an endogenous GPCR-regulated Ca2+
signaling pathway in Sf9 cells. We focused our attention
on octopamine and nucleotides since insects are known to
possess GPCRs for these signaling molecules (Galun et al.
1988; Evans and Robb 1993). Rises in [Ca2+]i were
monitored with the Ca2+-sensitive dye fura-2. However,
octopamine, ATP, GTP, ITP, XTP, UTP, CTP, ADP and UDP
(10 nM – 1 mM) did not exhibit stimulatory effects on [Ca2+]iin uninfected Sf9 cells. Thus, similar to the situation with
GPCR/Gs-protein coupling, we could not identify intact
GPCR/Gq-protein coupling with endogenous GPCRs in Sf9
cells.
Given this situation, we then explored whether Ca2+
signaling can be activated by stimuli that circumvent GPCRs.
We used TG, a Ca2+ ATPase inhibitor that activates Ca2+
influx from the extracellular space via depletion of intracel-
lular Ca2+ stores (Thastrup et al. 1994), and the wasp venom
MP. MP and related peptides exhibit pleiotropic effects such
as activation of Gi/Go-proteins (Higashijima et al. 1988),
nucleoside diphosphokinase (Klinker et al. 1994) and Ca2+
influx mechanisms (Suh et al. 1996; Hirata et al. 2000). In a
concentration-dependent manner, TG and MP induced large
and sustained increases in [Ca2+]i in uninfected Sf9 cells
(Figs 7a and b). These rises in [Ca2+]i were largely due to
influx from the extracellular space since in the absence of
extracellular Ca2+, the rises in [Ca2+]i were strongly dimin-
ished (Table 2). The lanthanides Gd3+ and La3+ (10 lM each)
had been shown to inhibit the endogenous cation entry
pathway in Sf9 cells (Hu et al. 1994). In agreement with
these findings, Gd3+ and La3+ (10 lM each) inhibited TG- and
MP-induced rises in [Ca2+]i in Sf9 cells (Table 2). Thus,
Ca2+ signaling in Sf9 cells can be activated at least at a
postreceptor level.
Next, we set out to study the effects of mammalian GPCRs
in Sf9 cells. Previous studies had shown that detection of
agonist-stimulated rises in [Ca2+]i in Sf9 cells is dependent
on the length of the infection period. Specifically, GPCR-
mediated rises in [Ca2+]i were only observed in the early
stages of infection (24–36 h after addition of virus) but not in
the later stages of infection (Kuhn et al. 1996; Kukkonen
et al. 1996; Leopoldt et al. 1997). In Sf9 cells that had been
infected for 24 h with baculovirus encoding hH2R at a
1 : 100 dilution, TG (10 lM) induced a long-lasting increase
G protein coupling of human H2-receptor 689
Ó 2002 International Society for Neurochemistry, Journal of Neurochemistry, 80, 678–696

in [Ca2+]i as it did in uninfected cells (compare Figs 7a and
c), but the magnitude of the rise in [Ca2+]i decreased from
354 ± 58 nM to 101 ± 18 nM (mean ± SD, n ¼ 15). These
data indicate that the expression of some distal components
of the Ca2+ signaling pathway, such as transmembrane cation
channels, are strongly reduced as the result of baculovirus
infection. We failed to detect any HIS-induced rises in
[Ca2+]i in Sf9 cells using hH2R alone, hH2R plus Gqa without
and with b1c2 and hH2R-Gqa without and with b1c2 at virustiters of 1 : 100–1: 10 000 and using infection periods
ranging from 16 h to 48 h (Fig. 7c and data not shown).
Moreover, extensive studies with rH2R, gpH2R, PAFR, hH1R
and gpH1R using different virus dilutions and infection times
failed to unmask any stimulatory effect of GPCR agonists on
[Ca2+]i in Sf9 cells, regardless of whether GPCRs were
studied alone or with mammalian Gqab1c2 (data not shown).Our inability to detect a stimulatory effect of GPCRs on
[Ca2+]i in Sf9 cells cannot be explained by an increase in
basal [Ca2+]i as a result of baculovirus infection, i.e. basal
[Ca2+]i in infected Sf9 cells ranged between �60–120 nM
(see legends to Fig. 7 and Table 2 and data not shown). We
can also rule out the possibility that baculovirus infection
resulted in a general defect of GPCR/Gq-protein coupling
since the below-described GTPase studies with RGS proteins
demonstrated intact GPCR-regulation of guanine nucleotide
exchange at insect cell Gq-proteins even after an infection
period of 48 h. Most likely, the reduced expression of distal
components of the signaling pathway that are of importance
for activation of Ca2+ entry by TG and GPCRs account for
our failure to detect GPCR-mediated rises in [Ca2+]i in Sf9
cells. Collectively, in our hands, the fura-2 assay proved to be
unsuitable to study GPCR/Gq-protein coupling, be it endog-
enous GPCRs and G proteins or mammalian GPCRs and
G proteins.
Our disappointing results regarding GPCR-regulation of
rises in [Ca2+]i in Sf9 cells contrast to reports showing
GPCR-mediated rises in [Ca2+]i in those cells (Harteneck
et al. 1995; Kuhn et al. 1996; Kukkonen et al. 1996;
Leopoldt et al. 1997). We can exclude insensitivity of
the fura-2 method for the discrepancies since basal
[Ca2+]i-values in uninfected and infected Sf9 cells were
low (legends to Fig. 7 and Table 2 and data not shown), dye
loading was efficient and dye leakage was low (data not
shown). Moreover, we can exclude the possibility that the
lack of stimulatory effect of HIS with the hH2R is a
peculiarity of this GPCR species isoform since the gpH2R
and rH2R were ineffective in the fura-2 assay as well, but
they were active in the AC assay. The same rH2R baculovirus
that was effective at reconstituting Gq- and Gs-coupling in
Fig. 7 Effects of TG, MP and HIS on [Ca2+]i in Sf9 cells. [Ca2+]i in Sf9
cells was determined as described in Materials and methods. Super-
imposed original fura-2 fluorescence recordings are shown. (a) and (b)
show recordings from uninfected Sf9 cells, and (c) shows recordings
from Sf9 cells that had been infected with hH2R baculovirus (1 : 100)
for 24 h. The arrows indicate the addition of stimuli at the concentra-
tions shown at the individual recordings. Basal [Ca2+]i in uninfected
Sf9 cells was 95 ± 13 nM (mean ± SD, n ¼ 16). Basal [Ca2+]i in hH2R
baculovirus-infected cells was 87 ± 18 nM (mean ± SD, n ¼ 6). The
Figure shows relative fluorescence changes. Absolute increases in
[Ca2+]i induced by TG and MP in uninfected and infected Sf9 cells are
reported in Table 2 and in the text.
Table 2 Effects of Gd3+, La3+ and EGTA on TG- and MP-induced
rises in [Ca2+]i in uninfected Sf9 cells
Addition
Increase in [Ca2+]i (nM)
TG (10 lM) MP (30 lM)
Solvent (control) 354 ± 58 198 ± 5
GdCl3 (10 lM) 92 ± 54 105 ± 24
LaCl3 (10 lM) 93 ± 16 104 ± 17
EGTA (1 mM) 24 ± 10 45 ± 10
Rises in [Ca2+]i in uninfected Sf9 cells were determined as described
in Materials and methods. Cuvettes contained either solvent (control)
or lanthanides in the presence of 1 mM CaCl2 or 1 mM EGTA in the
absence of CaCl2. After monitoring basal [Ca2+]i for 1 min, TG or MP
at the concentrations shown in the table were added to cuvettes. The
maximum stimulus-induced rises in [Ca2+]i after 3 min were calcu-
lated. Basal [Ca2+]i in uninfected Sf9 cells was 93 ± 13 nM. Data
shown are the means ± SD from three to seven experiments.
690 C. Houston et al.
Ó 2002 International Society for Neurochemistry, Journal of Neurochemistry, 80, 678–696

previous studies (Harteneck et al. 1995; Kuhn et al. 1996;
Leopoldt et al. 1997), in our hands reconstituted only
Gs-coupling. In addition, gpH1R expressed in Sf9 cells
reconstituted rises in [Ca2+]i in previous studies (Harteneck
et al. 1995; Kuhn et al. 1996; Leopoldt et al. 1997) but not
in our hands. Thus, it is evident that coupling of different
GPCRs to insect Gs-proteins in Sf9 cells is very reproducible
among various laboratories, whereas Gq-coupling is not
readily reproduced. Presently, we do not have a satisfactory
explanation for the different results from various laboratories
but differences in cell culture conditions could have an as yet
unappreciated impact on GPCR/Gq-protein coupling (see
Materials and methods) (Harteneck et al. 1995; Kuhn et al.
1996; Leopoldt et al. 1997).
GTPase studies
In view of the unsatisfying results regarding the expression
of functionally active mammalian Gqa and the difficulties to
study Ca2+ signaling in Sf9 cells we aimed at establishing
another sensitive method to study at least coupling of
mammalian GPCRs to insect cell Gq-proteins. We considered
five findings. First, it has been shown that RGS proteins can
dramatically enhance the agonist-stimulated steady-state
GTP hydrolysis of Gq-coupled GPCRs (Ingi et al. 1998;
Mukhopadhyay and Ross 1999). Second, the RGS proteins
identified so far do not act on Gs-proteins (Ross and Wilkie
2000). Third, although the RGS proteins studied herein
(RGS4 and GAIP) are not specific for Gq-proteins but also
act on Gi-proteins (Ross and Wilkie 2000), this does not
constitute a problem for our purposes since is has been very
well documented by various laboratories including our own
that Sf9 cells do not express Gi-proteins (Quehenberger et al.
1992; Obosi et al. 1996; Leopoldt et al. 1997; Wenzel-
Seifert et al. 1998; Kuhn and Gudermann 1999). Fourth, the
analysis of HIS-stimulated [35S]GTPcS binding and steady-
state GTP hydrolysis in Sf9 membranes expressing hH1R or
gpH1R plus Gia2b1c2 confirmed that coupling of those classic
Gq-coupled GPCRs to Gi-proteins is very poor (data not
shown). Fifth, the basal steady-state GTPase activity in Sf9
cell membranes is low, providing an excellent signal-to noise
ratio (Seifert et al. 1998a; Wenzel-Seifert et al. 1999). Based
on these considerations, we reasoned that the analysis of the
effects of RGS proteins on GTP hydrolysis catalyzed by
GPCRs coupled to insect cell G proteins could provide a
sensitive method to study GPCR/Gq-protein coupling pro-
vided that the mammalian RGS proteins would interact with
the insect cell Gq-proteins.
Before conducting the GTPase experiments, we had to
consider two other important factors. First, it has been shown
that various Gq-coupled GPCRs interact differentially with
RGS proteins (Xu et al. 1999). To address this point, we
combined RGS proteins from different families (RGS4, RGS
protein family R4; GAIP, RGS protein family RZ) (Ross and
Wilkie 2000) with GPCRs from different families (H2R and
H1R, GPCR family 1a; PAFR, GPCR family 1b) (Bockaert
and Pin 1999). It should be noted that only the H1R, but not
the H2R and PAFR possess the large third intracellular loop
that is typical for Gq-coupled GPCRs (Shimizu et al. 1992;
Leurs et al. 1995; Hill et al. 1997; Wess 1997). Second, it is
emerging that there are significant functional differences
between species isoforms of HxR subtypes including the H2R
(Ligneau et al. 2000; Lovenberg et al. 2000; Kelley et al.
2001; Liu et al. 2001a). Therefore, we compared the human
and guinea pig isoforms both of the H1R and H2R.
Figure 8a shows an immunoblot with the anti-FLAG Ig of
Sf9 membranes expressing the b2AR, PAFR and hH2R
without or with RGS4. The intensities of the GPCR bands
were similar regardless of whether RGS4 was expressed or
not. Similar data concerning expression were obtained upon
(a)
(b)
Fig. 8 Analysis of the expression of hH2R, b2AR, PAFR and RGS4 in
Sf9 membranes. Sf9 membranes expressing various proteins were
prepared, separated by SDS–PAGE on gels containing 10% (w/v)
acrylamide, transferred onto Immobilon P membranes and probed with
the anti-FLAG Ig (M1 antibody) (a) or anti-RGS4 Ig (b). Shown are the
horseradish peroxidase-reacted membranes. Numbers on the left
designate masses of marker proteins. On each lane, 50 lg of protein
were applied. The b2AR was expressed at a level of 3.5 pmol/mg.
– and + in (a) and (b) designate the absence or presence, respectively,
of RGS4 baculovirus during the Sf9 cell culture. hH2R and hH2R*
designate two different sets of membrane preparations expressing
hH2R. unif., uninfected Sf9 cells.
G protein coupling of human H2-receptor 691
Ó 2002 International Society for Neurochemistry, Journal of Neurochemistry, 80, 678–696

coexpression of GPCRs with GAIP (data not shown). These
data show that expression of RGS proteins does not interfere
with the expression of GPCRs, providing precisely defined
experimental conditions for studying the effect of RGS
proteins on GPCR/G protein coupling.
RGS4 expressed in HEK293 cells possesses a molecular
mass of �32 kDa (Huang et al. 1997). In agreement with
those data, RGS4 expressed in Sf9 cell membranes migrated
as a �32 kDa protein (Fig. 8b). In membranes from
uninfected Sf9 cells or Sf9 cells infected with GPCR
baculovirus only, the 32-kDa band was absent. In all
membrane preparations, an additional �40-kDa band was
observed. This band presumably represents a non-specific
reaction of the anti-RGS4 Ig. Upon infection with baculo-
viruses, the 40-kDa band became less intense, indicating
decreased expression of this protein in infected Sf9 cells.
For the hH1R and gpH1R, we determined expression levels
with the [3H]MEP saturation binding assay. Again, RGS
proteins did not largely change H1R expression levels. The
expression levels of hH1R ± RGS4 or GAIP ranged between
4.0 and 4.9 pmol/mg, and the expression levels of
gpH1R ± RGS proteins ranged between 3.5 and 4.5 pmol/mg.
Figure 9a shows that RGS4 could also be coexpressed with
hH1R and gpH1R. Similar to RGS4, GAIP migrates as a
�32-kDa protein when expressed in Sf9 membranes
(Fig. 9b). The molecular mass of GAIP in Sf9 membranes
corresponds with the data obtained for GAIP expressed in
HEK293 cells (Huang et al. 1997). There was no immuno-
reactivity with the anti-GAIP Ig in membranes from
uninfected Sf9 cells. Collectively, these data show that
uninfected Sf9 cells do not express mammalian-type RGS4
and GAIP, that RGS4 and GAIP can be efficiently expressed
in Sf9 membranes and that RGS protein expression has little
effect on GPCR expression levels.
In membranes expressing the hH2R, b2AR, PAFR, gpH2R,
hH1R and gpH1R alone, the agonist-stimulations of steady-
state GTP hydrolysis were small (Fig. 10a–c). RGS4
enhanced basal and agonist-stimulated GTP hydrolysis in
membranes expressing PAFR, hH1R and gpH1R (Figs 10a
and b). In the presence of RGS4, the stimulatory effects of
agonist in the membranes expressing PAFR amounted to
78%, and the stimulatory effects of agonist in membranes
expressing hH1R and gpH1R amounted to 142% and 174%,
respectively. These data suggest that RGS4 enhances H1R
agonist-stimulated GTP hydrolysis more efficiently than
(a) (b)
Fig. 9 Analysis of the expression of RGS4 and GAIP in Sf9 mem-
branes. Sf9 membranes expressing various proteins were prepared,
separated by SDS–PAGE on gels containing 10% (w/v) acrylamide,
transferred onto Immobilon P membranes and probed with the anti-
RGS4 Ig (a) or anti-GAIP Ig (b). Shown are the horseradish peroxi-
dase-reacted membranes. Numbers on the left designate masses of
marker proteins. On each lane, 50 lg of protein were applied. Cell
cultures contained either RGS4 baculovirus, GAIP baculovirus or no
virus (uninfected). Cell cultures containing RGS protein baculoviruses
also contained the HxR viruses provided below the gel.
Fig. 10 Effect of RGS4 and GAIP on basal and agonist-stimulated
GTPase activities in Sf9 membranes. GTPase activity in membranes
expressing various GPCRs without or with RGS4 (a and b) and without
or with GAIP (c) was determined as described in Materials and
methods. GTPase activity was determined under basal conditions b or
in the presence of agonist a. For membranes expressing hH1R, hH2R,
gpH1R and gpH2R ± RGS proteins, the agonist was HIS (100 lM). For
membranes expressing b2AR, the agonist was (–)-isoproterenol
(10 lM). For membranes expressing PAFR, the agonist was PAF
(10 lM). Data shown are the means ± SD of three independent ex-
periments performed in triplicates.
692 C. Houston et al.
Ó 2002 International Society for Neurochemistry, Journal of Neurochemistry, 80, 678–696

PAFR agonist-stimulated GTP hydrolysis. These data are in
accordance with the data of Xu et al. (1999), demonstrating
GPCR-specificity of the effects of RGS proteins. Our data are
also in agreement with previous findings showing that RGS4
can regulate PAFR signaling (Richardson et al. 2001) and
that RGS4 can accelerate GTP hydrolysis stimulated by
Gq-coupled GPCRs (Mukhopadhyay and Ross 1999).
In contrast to the data obtained with the PAFR and
H1Rs, RGS4 did not enhance the agonist-stimulated GTP
hydrolysis in membranes expressing the b2AR, hH2R and
gpH2R (Figs 10a and b). These data are compatible with the
notion that the b2AR and H2R are preferentially Gs-coupled
GPCRs and that RGS proteins do not enhance the GTPase
activity of Gs-proteins (Ross and Wilkie 2000). An expla-
nation of the higher basal GTPase activity in membranes
expressing hH2R than in membranes expressing b2AR could
be that the b2AR virus is more efficient than the hH2R virus at
suppressing the expression of endogenous G proteins. Thus,
the chances of detecting an enhancement of H2R-stimulated
GTP hydrolysis by RGS proteins should have been even
higher than for the b2AR.In view of the differential effects of RGS4 on agonist-
stimulated GTP hydrolysis in membranes expressing PAFR,
hH1R and gpH1R (Figs 10a and b), we also examined the
effects of GAIP, belonging to a different RGS protein family
than RGS4 (Ross and Wilkie 2000), on GTPase activity in
Sf9 membranes. Similar to the data obtained with RGS4,
GAIP strongly enhanced basal and agonist-stimulated GTP
hydrolysis in membranes expressing hH1R and gpH1R
(Fig. 10c). In the presence of GAIP, the agonist-stimulations
of GTP hydrolysis in membranes expressing hH1R and
gpH1R amounted to 126% and 140%, respectively. In
contrast, GAIP did not enhance basal and agonist-stimulated
GTP hydrolysis in membranes expressing hH2R (Fig. 10c).
Collectively, the comparison of GTPase activity without and
with RGS proteins was the only method with which we could
provide positive evidence for GPCR-coupling to endogenous
Gq-proteins. Using this approach, we did not detect efficient
coupling of the H2R to Gq-proteins.
Conclusions
In agreement with literature data on native and recombinant
systems (Bristow et al. 1982; Gespach and Abita 1982;
Mitsuhashi et al. 1989; Leurs et al. 1994; Alewijnse et al.
1998; Wang et al. 2000), our present data show that hH2R
robustly couples to insect cell and mammalian Gs-proteins.
By analogy to the b2AR (Seifert et al. 1998a), hH2R couples
to mammalian Gs-proteins more efficiently than to insect cell
Gs-proteins in terms of ternary complex formation and
[35S]GTPcS binding, and coupling of hH2R to mammalian
Gsa is more efficient in the fused than in the non-fused state.
Consistent with the literature, too, are our findings that the
H2R from other species, specifically rat and guinea pig,
couples to Gs-proteins as well (Traiffort et al. 1992b; Leurs
et al. 1995; Kuhn et al. 1996; Beukers et al. 1997; Hill et al.
1997; Leopoldt et al. 1997).
In contrast to the data on Gs-proteins, the data on
Gq-coupling of hH2R are less straightforward to interpret.
Specifically, we were unable to reconstitute efficient coupling
of classic Gq-coupled GPCRs such as hH1R and gpH1R with
mammalian Gqa in terms of ternary complex formation,
[35S]GTPcS binding and GTP hydrolysis, although Gqa is
highly expressed as assessed by immunoblotting. Thus, we
cannot rule out the possibility that the poor coupling of hH2R
to fused and coexpressed mammalian Gqa in Sf9 cells is
attributable to functional inactivity of the expressed Gqa. As
another complication, we were unable to demonstrate
GPCR/Gq-protein coupling using the fura-2 assay that is
a sensitive and widely used method to analyze
GPCR/Gq-protein coupling. In our hands, the only useful
and sensitive method to study coupling of GPCRs to
Gq-proteins was the steady-state GTPase assay that takes
advantage of the fact that Sf9 cells are devoid of Gi-proteins
and that RGS-proteins enhance agonist-stimulated steady-
state GTP hydrolysis catalyzed by Gq-coupled GPCRs.
Using this methodology, we showed that RGS proteins from
two different families enhance agonist-stimulated GTP
hydrolysis catalyzed by various Gq-coupled GPCRs includ-
ing hH1R, whereas RGS proteins did not enhance GTP
hydrolysis stimulated by the hH2R and another classic
Gs-coupled GPCR, the b2AR. Thus, despite significant
limitations regarding the analysis of mammalian Gq-proteins
and assessment of Gq-mediated activation of effector
systems, we can nonetheless make the statement that the
hH2R couples more efficiently to insect cells Gs-proteins than
to insect cell Gq-proteins.
On first glance, our present data seem to be in contrast
to previous reports demonstrating coupling of hH2R to
Gq-proteins as assessed by rises in [Ca2+]i (Mitsuhashi et al.
1989; Seifert et al. 1992; Burde and Seifert 1996). However,
in agreement with our present results, hH2R fails to couple to
Gq-proteins when expressed in Chinese hamster ovary cells
(Leurs et al. 1994). Intriguingly, even in systems in which
Gq-coupling of hH2R was observed, the stimulatory effects
of hH2R on [Ca2+]i were small compared to a prototypical
Gq-coupled GPCR, namely the P2U-receptor (Seifert et al.
1992). Thus, depending on the specific system studied,
inefficient hH2R-coupling to Gq-proteins may or may not
reach the threshold to result in rises in [Ca2+]i, whereas the
robust hH2R-coupling to Gs always reaches the threshold to
result in AC activation. Similar to hH2R, rH2R has been
consistently reported to mediate AC activation, whereas the
data concerning coupling of rH2R to Gq-proteins are
controversial (Traiffort et al. 1992a; Harteneck et al. 1995;
Kuhn et al. 1996; Beukers et al. 1997; Leopoldt et al. 1997).
G protein coupling of human H2-receptor 693
Ó 2002 International Society for Neurochemistry, Journal of Neurochemistry, 80, 678–696

Collectively, considering the literature data and our present
results it is likely that coupling of the hH2R and of the H2R
from other species to Gq-proteins is of little physiological
importance. Future studies aiming at elucidating the role of
the H2R in the regulation of brain functions should therefore
focus on Gs-mediated signaling.
Acknowledgements
The authors would like to thank M. T. Kelley for constructing the gpH2R
baculovirus and conducting some [3H]TIO saturation binding studies and
AC studies on gpH2R and the Reviewers of this paper for their most
valuable critique and suggestions. This work was supported by a New
Faculty Award of The University of Kansas, the National Institutes of
Health COBRE award 1 P20 RR15563 and matching support from the
State of Kansas and the University of Kansas and the National Institutes
of Health-Center for Research Resources grant ÔSchool of Pharmacy
Student Research ProgramÕ R25 RR10150.
References
Alewijnse A. E., Smit M. J., Hoffmann M., Verzijl D., Timmerman H.
and Leurs R. (1998) Constitutive activity and structural insta-
bility of the wild-type human H2 receptor. J. Neurochem. 71,
799–807.
Alvarez R. and Daniels D. V. (1990) A single column method for the
assay of adenylate cyclase. Anal. Biochem. 187, 98–103.
Bertin B., Freissmuth M., Jockers R., Strosberg A. D. and Marullo S.
(1994) Cellular signaling by an agonist-activated receptor/Gsafusion protein. Proc. Natl Acad. Sci. USA 91, 8827–8831.
Beukers M. W., Klaassen C. H., De Grip W. J., Verzijl D., Timmerman
H. and Leurs R. (1997) Heterologous expression of rat epitope-
tagged histamine H2 receptors in insect Sf9 cells. Br. J. Pharmacol.
122, 867–874.
Birnbaumer L., Abramowitz J. and Brown A. M. (1990) Receptor-
effector coupling by G proteins. Biochim. Biophys. Acta 1031,
163–224.
Bockaert J. and Pin J. P. (1999) Molecular tinkering of G pro-
tein-coupled receptors: an evolutionary success. EMBO J. 18,
1723–1729.
Bristow M. R., Cubicciotti R., Ginsburg R., Stinson E. B. and Johnson
C. (1982) Histamine-mediated adenylate cyclase stimulation in
human myocardium. Mol. Pharmacol. 21, 671–679.
Burde R. and Seifert R. (1996) Stimulation of histamine H2- (and H1)-
receptors activates Ca2+ influx in all-trans-retinoic acid-differen-
tiated HL-60 cells independently of phospholipase C or adenylyl
cyclase. Naunyn-Schmiedeberg’s Arch. Pharmacol. 353, 123–129.
Chidiac P., Hebert T. E., Valiquette M., Dennis M. and Bouvier M.
(1994) Inverse agonist activity of b-adrenergic antagonists. Mol.
Pharmacol. 45, 490–499.
Childers S. R., Fleming L. M., Selley D. E., McNutt R. W. and Chang K.
J. (1993) BW373U86: a nonpeptidic d-opioid agonist with novel
receptor-G protein-mediated actions in rat brain membranes and
neuroblastoma cells. Mol. Pharmacol. 44, 827–834.
Citri Y. and Schramm M. (1982) Probing of the coupling site of the
b-adrenergic receptor. Competition between different forms of the
guanyl nucleotide binding protein for interaction with the receptor.
J. Biol. Chem. 257, 13257–13262.
Evans P. D. and Robb S. (1993) Octopamine receptor subtypes and their
modes of action. Neurochem. Res. 18, 869–874.
Fukui H., Fujimoto K., Mizuguchi H., Sakamoto K., Horio Y., Takai S.,
Yamada K. and Ito S. (1994) Molecular cloning of the human
histamine H1 receptor gene. Biochem. Biophys. Res. Commun. 201,
894–901.
Fukushima Y., Asano T., Saitoh T., Anai M., Funaki M., Ogihara T.,
Katagiri H., Matsuhashi N., Yazaki Y. and Sugano K. (1997)
Oligomer formation of histamine H2 receptors expressed in Sf9 and
COS7 cells. FEBS Lett. 409, 283–286.
Galun R., Friend W. G. and Nudelman S. (1988) Purinergic reception by
culicine mosquitoes. J. Comp. Physiol. [A] 163, 665–670.
Gantz I., Munzert G., Tashiro T., Schaffer M., De Wang L. I., Valle J.
and Yamada T. (1991) Molecular cloning of the human hista-
mine H2 receptor. Biochem. Biophys. Res. Commun. 178,
1386–1392.
Gespach C. and Abita J. P. (1982) Human polymorphonuclear neutro-
phils. Pharmacological characterization of histamine receptors
mediating the elevation of cyclic AMP. Mol. Pharmacol. 21,
78–85.
Gilman A. G. (1987) G proteins: transducers of receptor-generated
signals. Annu. Rev. Biochem. 56, 615–649.
Graziano M. P., Casey P. J. and Gilman A. G. (1987) Expression of
cDNAs for G proteins in Escherichia coli. Two forms of Gsa
stimulate adenylate cyclase. J. Biol. Chem. 262, 11375–11381.
Graziano M. P., Freissmuth M. and Gilman A. G. (1989) Expression of
Gsa in Escherichia coli. Purification and properties of two forms of
the protein. J. Biol. Chem. 264, 409–418.
Gurdal H., Bond R. A., Johnson M. D., Friedman E. and Onaran H. O.
(1997) An efficacy-dependent effect of cardiac overexpression of
b2-adrenoceptor on ligand affinity in transgenic mice. Mol. Phar-
macol. 52, 187–194.
Harteneck C., Obukhov A. G., Zobel A., Kalkbrenner F. and Schultz G.
(1995) The Drosophila cation channel trpl expressed in insect Sf9
cells is stimulated by agonists of G-protein-coupled receptors.
FEBS Lett. 358, 297–300.
Hepler J. R., Kozasa T., Smrcka A. V., Simon M. I., Rhee S. G.,
Sternweis P. C. and Gilman A. G. (1993) Purification from Sf9
cells and characterization of recombinant Gqa and G11a. Activationof purified phospholipase C isozymes by Ga subunits. J. Biol.
Chem. 268, 14367–14375.
Higashijima T., Uzu S., Nakajima T. and Ross E. M. (1988) Mastoparan,
a peptide toxin from wasp venom, mimics receptors by activating
GTP-binding regulatory proteins (G proteins). J. Biol. Chem. 263,
6491–6494.
Hill S. J., Ganellin C. R., Timmerman H., Schwartz J. C., Shankley N. P.,
Young J. M., Schunack W., Levi R. and Haas H. L. (1997) Inter-
national Union of Pharmacology. XIII. Classification of histamine
receptors. Pharmacol. Rev. 49, 253–278.
Hirata Y., Nakahata N. and Ohizumi Y. (2000) Identification of a 97-kDa
mastoparan-binding protein involving in Ca2+ release from skeletal
muscle sarcoplasmic reticulum. Mol. Pharmacol. 57, 1235–1242.
Holst B., Hastrup H., Raffetseder U., Martini L. and Schwartz T. W.
(2001) Two active molecular phenotypes of the tachykinin NK1
receptor revealed by G-protein fusions and mutagenesis. J. Biol.
Chem. 276, 19793–19799.
Horio Y., Mori Y., Higuchi I., Fujimoto K., Ito S. and Fukui H. (1993)
Molecular cloning of the guinea-pig histamine H1 receptor gene.
J. Biochem. (Tokyo) 114, 408–414.
Hu Y., Vaca L., Zhu X., Birnbaumer L., Kunze D. L. and Schilling W. P.
(1994) Appearance of a novel Ca2+ influx pathway in Sf9 insect
cells following expression of the transient receptor potential-like
(trpl) protein of Drosophila. Biochem. Biophys. Res. Commun.
201, 1050–1056.
Huang C., Hepler J. R., Gilman A. G. and Mumby S. M. (1997)
Attenuation of Gi- and Gq-mediated signaling by expression of
RGS4 or GAIP in mammalian cells. Proc. Natl Acad. Sci. USA
94, 6159–6163.
694 C. Houston et al.
Ó 2002 International Society for Neurochemistry, Journal of Neurochemistry, 80, 678–696

Ingi T., Krumins A. M., Chidiac P., Brothers G. M., Chung S., Snow B.
E., Barnes C. A., Lanahan A. A., Siderovski D. P., Ross E. M.,
Gilman A. G. and Worley P. F. (1998) Dynamic regulation of
RGS2 suggests a novel mechanism in G-protein signaling and
neuronal plasticity. J. Neurosci. 18, 7178–7188.
Kelley M. T., Burckstummer T., Wenzel-Seifert K., Dove S., Buschauer
A. and Seifert R. (2001) Distinct interaction of human and guinea
pig histamine H2-receptor with guanidine-type agonists. Mol.
Pharmacol. 60, 1210–1225.
Kent R. S., De Lean A. and Lefkowitz R. J. (1980) A quantitative
analysis of beta–adrenergic receptor interactions: resolution of high
and low affinity states of the receptor by computer modeling of
ligand binding data. Mol. Pharmacol. 17, 14–23.
Klinker J. F., Hageluken A., Grunbaum L., Heilmann I., Nurnberg B.,
Harhammer R., Offermanns S., Schwaner I., Ervens J., Wenzel-
Seifert K., Muller T. and Seifert R. (1994) Mastoparan may
activate GTP hydrolysis by Gi-proteins in HL-60 membranes
indirectly through interaction with nucleoside diphosphate kinase.
Biochem. J. 304, 377–383.
Krieger-Brauer H. I., Medda P. K., Hebling U. and Kather H. (1999) An
antibody directed against residues 100–119 within the a-helicaldomain of Gas defines a novel contact site for b-adrenergicreceptors. J. Biol. Chem. 274, 28308–28313.
Kuhn B. and Gudermann T. (1999) The luteinizing hormone receptor
activates phospholipase C via preferential coupling to Gi2.
Biochemistry 38, 12490–12498.
Kuhn B., Schmid A., Harteneck C., Gudermann T. and Schultz G. (1996)
G proteins of the Gq family couple the H2 histamine receptor to
phospholipase C. Mol. Endocrinol. 10, 1697–1707.
Kukkonen J. P., Nasman J., Ojala P., Oker-Blom C. and Akerman K. E.
(1996) Functional properties of muscarinic receptor subtypes Hm1,
Hm3 and Hm5 expressed in Sf9 cells using the baculovirus
expression system. J. Pharmacol. Exp. Ther. 279, 593–601.
Leopoldt D., Harteneck C. and Nurnberg B. (1997) G proteins endog-
enously expressed in Sf 9 cells: interactions with mammalian
histamine receptors. Naunyn-Schmiedeberg’s Arch. Pharmacol.
356, 216–224.
Leurs R., Smit M. J., Menge W. M. and Timmerman H. (1994) Phar-
macological characterization of the human histamine H2 receptor
stably expressed in Chinese hamster ovary cells. Br. J. Pharmacol.
112, 847–854.
Leurs R., Smit M. J. and Timmerman H. (1995) Molecular pharmaco-
logical aspects of histamine receptors. Pharmacol. Ther. 66,
413–463.
Ligneau X., Morisset S., Tardivel-Lacombe J., Gbahou F., Ganellin C.
R., Stark H., Schunack W., Schwartz J. C. and Arrang J. M. (2000)
Distinct pharmacology of rat and human histamine H3 receptors:
role of two amino acids in the third transmembrane domain.
Br. J. Pharmacol. 131, 1247–1250.
Linday L. A., Tsiouris J. A., Cohen I. L., Shindledecker R. and DeCresce
R. (2001) Famotidine treatment of children with autistic spectrum
disorders: pilot research using single subject research design.
J. Neural Transm. 108, 593–611.
Liu C., Wilson S. J., Kuei C. and Lovenberg T. W. (2001a) Comparison
of human, mouse, rat, and guinea pig histamine H4 receptors
reveals substantial pharmacological species variation. J. Pharmacol.
Exp. Ther. 299, 121–130.
Liu H.-Y., Wenzel-Seifert K. and Seifert R. (2001b) The olfactory
G-protein Gaolf possesses a lower GDP-affinity and deactivates
more rapidly than Gsashort: consequences for receptor-coupling and
adenylyl cyclase activation. J. Neurochem. 78, 325–338.
Lovenberg T. W., Pyati J., Chang H., Wilson S. J. and Erlander M. G.
(2000) Cloning of rat histamine H3 receptor reveals distinct species
pharmacological profiles. J. Pharmacol. Exp. Ther. 293, 771–778.
Martinez M. C. (1999) Famotidine in the management of schizophrenia.
Ann. Pharmacother. 33, 742–747.
Martinez-Mir M. I., Pollard H., Moreau J., Traiffort E., Ruat M.,
Schwartz J. C. and Palacios J. M. (1993) Loss of striatal histamine
H2 receptors in Huntington’s chorea but not in Parkinson’s disease:
comparison with animal models. Synapse 15, 209–220.
Matesic D. F., Manning D. R., Wolfe B. B. and Luthin G. R. (1989)
Pharmacological and biochemical characterization of complexes of
muscarinic acetylcholine receptor and guanine nucleotide-binding
protein. J. Biol. Chem. 264, 21638–21645.
Milligan G. (2000) Insights into ligand pharmacology using receptor-
G-protein fusion proteins. Trends Pharmacol. Sci. 21, 24–28.
Mitsuhashi M., Mitsuhashi T. and Payan D. G. (1989) Multiple
signaling pathways of histamine H2 receptors. Identification of
an H2 receptor-dependent Ca2+ mobilization pathway in human
HL-60 promyelocytic leukemia cells. J. Biol. Chem. 264,
18356–18362.
Mukhopadhyay S. and Ross E. M. (1999) Rapid GTP binding and
hydrolysis by Gq promoted by receptor and GTPase-activating
proteins. Proc. Natl Acad. Sci. USA 96, 9539–9544.
Obosi L. A., Schuette D. G., Europe-Finner G. N., Beadle D. J., Hen R.,
King L. A. and Bermudez I. (1996) Functional characterisation of
the Drosophila 5-HTdro1 and 5-HTdro2B serotonin receptors in
insect cells: activation of a Gas-like protein by 5-HTdro1 but lack
of coupling to inhibitory G-proteins by 5-HTdro2B. FEBS Lett.
381, 233–236.
Orr N., Orr G. L. and Hollingworth R. M. (1992) The Sf9 cell line as a
model for studying insect octopamine-receptors. Insect Biochem.
Mol. Biol. 22, 591–597.
Panula P., Lintunen M. and Karlstedt K. (2000) Histamine in brain
development and tumors. Semin. Cancer Biol. 10, 11–14.
Parker E. M., Kameyama K., Higashijima T. and Ross E. M. (1991)
Reconstitutively active G protein-coupled receptors purified from
baculovirus-infected insect cells. J. Biol. Chem. 266, 519–527.
Quehenberger O., Prossnitz E. R., Cochrane C. G. and YeR. D. (1992)
Absence of Gi proteins in the Sf9 insect cell. Characterization of
the uncoupled recombinant N-formyl peptide receptor. J. Biol.
Chem. 267, 19757–19760.
Richardson R. M., Marjoram R. J., Barr A. J. and Snyderman R. (2001)
RGS4 inhibits platelet-activating factor receptor phosphorylation
and cellular responses. Biochemistry 40, 3583–3588.
Ross E. M. and Wilkie T. M. (2000) GTPase-activating proteins for
heterotrimeric G proteins: regulators of G protein signaling (RGS)
and RGS-like proteins. Annu. Rev. Biochem. 69, 795–827.
Seifert R. (2001) Monovalent anions differentially modulate coupling of
the b2-adrenoceptor to Gsa splice variants. J. Pharmacol. Exp.
Ther. 298, 840–847.
Seifert R. and Wenzel-Seifert K. (2001) Unmasking different constitu-
tive activity of four chemoattractant receptors using Na+ as
universal stabilizer of the inactive (R) state. Receptors Channels 7,
357–369.
Seifert R., Hoer A., Schwaner I. and Buschauer A. (1992) Histamine
increases cytosolic Ca2+ in HL-60 promyelocytes predominantly
via H2 receptors with an unique agonist/antagonist profile and
induces functional differentiation. Mol. Pharmacol. 42, 235–241.
Seifert R., Lee T. W., Lam V. T. and Kobilka B. K. (1998a) Reconsti-
tution of b2-adrenoceptor-GTP–binding–protein interaction in Sf9
cells: high coupling efficiency in a b2-adrenoceptor-Gsa fusion
protein. Eur. J. Biochem. 255, 369–382.
Seifert R., Wenzel-Seifert K., Lee T. W., Gether U., Sanders-Bush E. and
Kobilka B. K. (1998b) Different effects of Gsa splice variants on
b2-adrenoreceptor-mediated signaling. The b2-adrenoreceptorcoupled to the long splice variant of Gsa has properties of a
constitutively active receptor. J. Biol. Chem. 273, 5109–5116.
G protein coupling of human H2-receptor 695
Ó 2002 International Society for Neurochemistry, Journal of Neurochemistry, 80, 678–696

Seifert R., Wenzel-Seifert K. and Kobilka B. K. (1999) GPCR-Ga
fusion proteins: an approach for the molecular analysis of receptor/
G-protein coupling. Trends Pharmacol. Sci. 20, 383–389.
Shimizu T., Honda Z., Nakamura M., Bito H. and Izumi T. (1992)
Platelet-activating factor receptor and signal transduction.
Biochem. Pharmacol. 44, 1001–1008.
Smit M. J., Leurs R., Alewijnse A. E., Blauw J., Van Nieuw Amerongen
G. P., Van De Vrede Y., Roovers E. and Timmerman H. (1996)
Inverse agonism of histamine H2 antagonist accounts for upregu-
lation of spontaneously active histamine H2 receptors. Proc. Natl
Acad. Sci. USA 93, 6802–6807.
Steinberg G. H., Eppel J. G., Kandel M., Kandel S. I. and Wells J. W.
(1985a) H2 histaminic receptors in rat cerebral cortex. 1. Binding
of [3H]histamine. Biochemistry 24, 6095–6107.
Steinberg G. H., Kandel M., Kandel S. I. and Wells J. W. (1985b)
H2 histaminic receptors in rat cerebral cortex. 2. Inhibition
of [3H]histamine by H2 antagonists. Biochemistry 24, 6107–
6115.
Steinberg G. H., Kandel M., Kandel S. I. and Wells J. W. (1985c)
H2 histaminic receptors in rat cerebral cortex. 3. Inhibition of
[3H]histamine by H2 agonists. Biochemistry 24, 6115–6125.
Stevens P. A., Pediani J., Carrillo J. J. and Milligan G. (2001) Coordi-
nated agonist regulation of receptor and G protein palmitoylation
and functional rescue of palmitoylation-deficient mutants of the
G protein G11a following fusion to the a1b-adrenoreceptor: palm-
itoylation of G11a is not required for interaction with bc complex.
J. Biol. Chem. 276, 35883–35890.
Stiles G. L. (1985) The A1 adenosine receptor. Solubilization and
characterization of a guanine nucleotide-sensitive form of the
receptor. J. Biol. Chem. 260, 6728–6732.
Suh B. C., Song S. K., Kim Y. K. and Kim K. T. (1996) Induction of
cytosolic Ca2+ elevation mediated by Mas-7 occurs through
membrane pore formation. J. Biol. Chem. 271, 32753–32759.
Szele F. G. and Pritchett D. B. (1993) High affinity agonist binding to
cloned 5-hydroxytryptamine2 receptors is not sensitive to GTP
analogs. Mol. Pharmacol. 43, 915–920.
Thastrup O., Dawson A. P., Scharff O., Foder B., Cullen P. J., Drobak
B. K., Bjerrum P. J., Christensen S. B. and Hanley M. R. (1994)
Thapsigargin, a novel molecular probe for studying intracellular
calcium release and storage. Agents Actions 43, 187–193.
Traiffort E., Pollard H., Moreau J., Ruat M., Schwartz J. C., Martinez-
Mir M. I. and Palacios J. M. (1992a) Pharmacological character-
ization and autoradiographic localization of histamine H2 receptors
in human brain identified with [125I]iodoaminopotentidine.
J. Neurochem. 59, 290–299.
Traiffort E., Ruat M., Arrang J. M., Leurs R., Piomelli D. and Schwartz
J. C. (1992b) Expression of a cloned rat histamine H2 receptor
mediating inhibition of arachidonate release and activation of
cAMP accumulation. Proc. Natl Acad. Sci. USA 89, 2649–2653.
Unson C. G., Wu C. R., Sakmar T. P. and Merrifield R. B. (2000)
Selective stabilization of the high affinity binding conformation of
glucagon receptor by the long splice variant of Gas. J. Biol. Chem.
275, 21631–21638.
Wang L. D., Gantz I., Butler K., Hoeltzel M. and Del Valle J. (2000)
Histamine H2 receptor mediated dual signaling: mapping of
structural requirements using b2 adrenergic chimeric receptors.
Biochem. Biophys. Res. Commun. 276, 539–545.
Wenzel-Seifert K. and Seifert R. (2000) Molecular analysis of
b2-adrenoceptor coupling to Gs-, Gi-, and Gq-proteins. Mol.
Pharmacol. 58, 954–966.
Wenzel-Seifert K., Hurt C. M. and Seifert R. (1998) High constitutive
activity of the human formyl peptide receptor. J. Biol. Chem. 277,
24181–24189.
Wenzel-Seifert K., Arthur J. M., Liu H. Y. and Seifert R. (1999)
Quantitative analysis of formyl peptide receptor coupling to Gia1,Gia2, and Gia3. J. Biol. Chem. 274, 33259–33266.
Wenzel-Seifert K., Kelley M. T., Buschauer A. and Seifert R. (2001)
Similar constitutive activity of human histamine H2-receptor fused
to long and short splice variants of Gsa. J. Pharmacol. Exp. Ther.
299, 1013–1020.
Wess J. (1997) G-protein-coupled receptors: molecular mechanisms
involved in receptor activation and selectivity of G-protein
recognition. FASEB J. 11, 346–354.
Wieland T. and Jakobs K.-H. (1994) Measurement of receptor-stimulated
guanosine 5¢-O-(c-thio)triphosphate binding by G proteins. Meth-
ods Enzymol. 237, 3–13.
Xu X., Zeng W., Popov S., Berman D. M., Davignon I. Yu K., Yowe D.,
Offermanns S., Muallem S. and Wilkie T. M. (1999) RGS proteins
determine signaling specificity of Gq-coupled receptors. J. Biol.
Chem. 274, 3549–3556.
696 C. Houston et al.
Ó 2002 International Society for Neurochemistry, Journal of Neurochemistry, 80, 678–696
Top Related