


Languages
Pages
Legal


The Global Challenge
Peter Sever
The International Centre for Circulatory HealthNational Heart and Lung Institute
Imperial College London


Cuna Indians
Yanamamo Indians
Congo pygmies
Kalahari bushmen
Kenyan nomads
Pacific Atoll Polynesians
New Guinean Highlanders
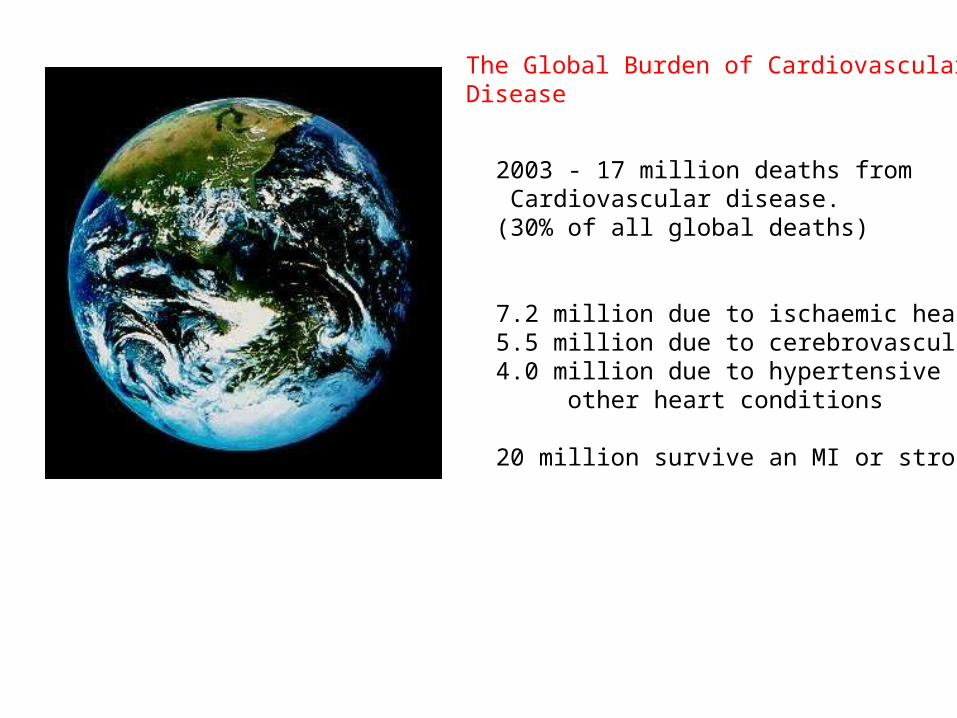
2003 - 17 million deaths from Cardiovascular disease.(30% of all global deaths)
7.2 million due to ischaemic heart disease5.5 million due to cerebrovascular disease4.0 million due to hypertensive and other heart conditions
20 million survive an MI or stroke annually
The Global Burden of Cardiovascular Disease
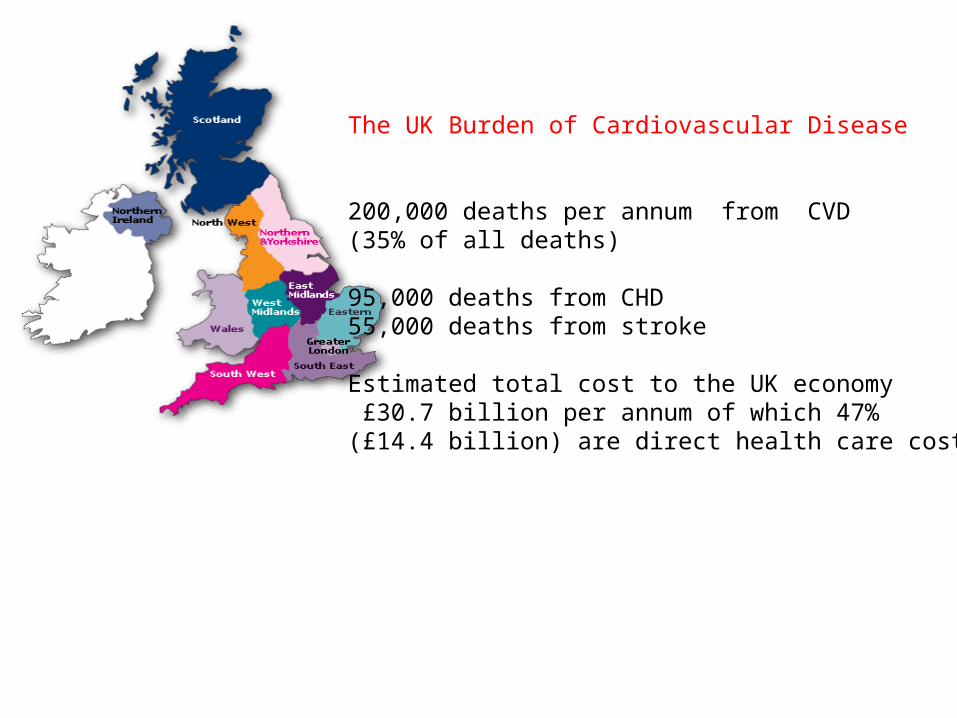
The UK Burden of Cardiovascular Disease
200,000 deaths per annum from CVD(35% of all deaths)
95,000 deaths from CHD55,000 deaths from stroke
Estimated total cost to the UK economy £30.7 billion per annum of which 47% (£14.4 billion) are direct health care costs
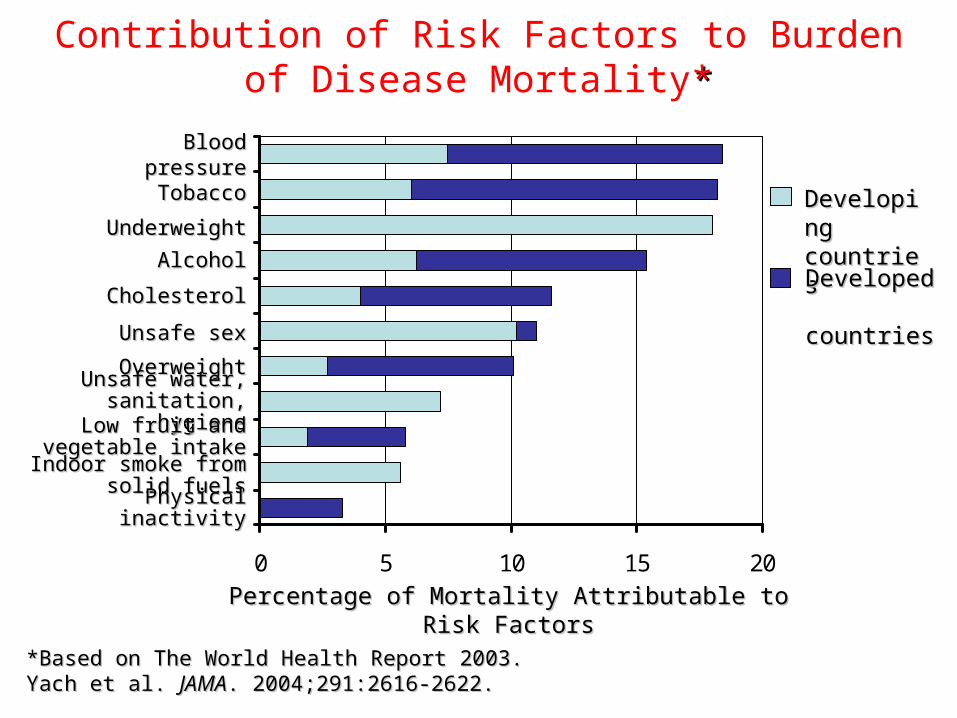
Contribution of Risk Factors to Burden of Disease Mortality**
0 5 10 15 20
Percentage of Mortality Attributable to Risk FactorsPercentage of Mortality Attributable to Risk Factors
*Based on The World Health Report 2003. *Based on The World Health Report 2003. Yach et al. Yach et al. JAMAJAMA. 2004;291:2616-2622.. 2004;291:2616-2622.
Developing Developing
countries countries Developed Developed countriescountries
Blood pressureBlood pressure
TobaccoTobacco
UnderweightUnderweight
AlcoholAlcohol
CholesterolCholesterol
Unsafe sexUnsafe sex
OverweightOverweightUnsafe water, sanitation, Unsafe water, sanitation,
hygienehygieneLow fruit and vegetable Low fruit and vegetable
intakeintakeIndoor smoke from solid fuelsIndoor smoke from solid fuels
Physical inactivityPhysical inactivity

The Global rise in Cardiovascular Disease
• Increase in energy dense, nutrient poor foods high in saturated fat, salt and refined carbohydrates.
• Decrease in physical activity
lead to
• Increases in BP and cholesterol, obesity and type 2 diabetes
• Increase in tobacco smoking


Changes in risk factors in the UK
• Reductions in population BP
( by 5-10 mmHg systolic depending on age)• Reduction in population levels of cholesterol ( by
0.5 – more than 1 mmol/L)• Tobacco consumption reduced ( by approx 50%)
but• Dramatic increase in obesity and type 2 diabetes
( increase by 74% in past 6 years)

2009
Death rates from CHD for people aged under 65: projections for England
Impact of a x4 increase in CHD events in those with diabetes ?

Impact of targeted pharmacological intervention: Blood Pressure and Cholesterol
Estimated usual BP or Cholesterol
Population wide reduction
Targeted intervention
Fre
qu
en
cy

Coronary Heart Disease
Systolic blood pressure difference between randomised groups (mmHg)
Rel
ativ
e ri
sk o
f C
HD
0.25
0.50
0.75
1.00
1.25
1.50
-10 -8 -6 -4 -2 0 2 4

Stroke
0.25
0.50
0.75
1.00
1.25
1.50
-10 -8 -6 -4 -2 0 2 4
Systolic blood pressure difference between randomised groups (mmHg)
Rel
ativ
e ri
sk o
f st
roke
Proportional benefit independent of baseline BP
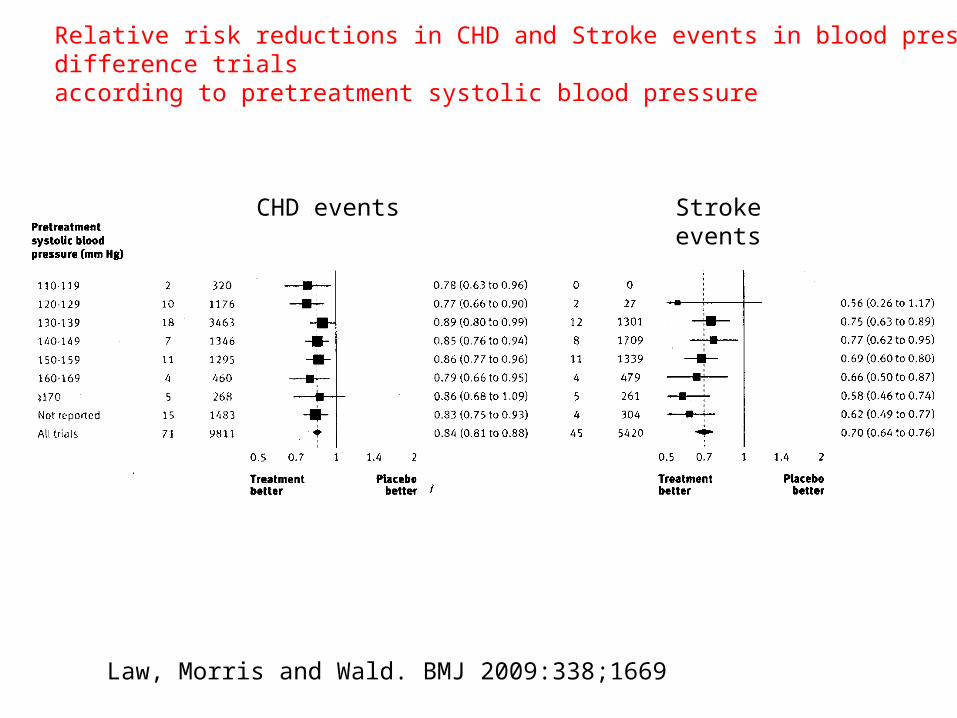
Relative risk reductions in CHD and Stroke events in blood pressure difference trialsaccording to pretreatment systolic blood pressure
CHD events Stroke events
Law, Morris and Wald. BMJ 2009:338;1669

mm
Hg
0
Time (years)
Baseline 0.5 1 1.5 2 2.5 3 3.5 4 4.5 5 5.5 Last visit
140
160
180 atenolol thiazide amlodipine perindopril
137.7
136.1
Mean difference 2.7
163.9
164.1
. Sever P, Poulter N et al. Am J Cardiol. 2005;96 [suppl]:39F-44F
18
15
12
9
6
3
CHD
Stroke
Eve
nt R
ate*
*per 1000 patient yearsnot randomised to statin
ASCOT- BPLA: Time to benefit
Systolic Blood Pressure

GroupsEvents (%)
Treatment ControlRR & CI
(Treatment : Control)
Prior disease:Post-MI 1681 (11·7) 2207 (15·4)Other CHD 568 (8·7) 744 (11·4)None 1088 (4·5) 1469 (6·1)
Age (years):≤65 1671 (6·1) 2344 (8·5)>65 1666 (9·5) 2076 (11·9)
Gender:Male 2686 (7·8) 3630 (10·6)Female 651 (6·1) 790 (7·3)
Treated hypertension:Yes 2038 (8·2) 2596 (10·4)No 1299 (6·4) 1824 (9·1)
History of diabetes:Yes 776 (8·3) 979 (10·5)No 2561 (7·2) 3441 (9·6)
Diastolic BP:≤90 mmHg 2711 (7·8) 3590 (10·3)>90 mmHg 618 (6·1) 827 (8·2)
0·5 1·0 1·5Treatment Control
better better
p < 0·00001
Heterogeneity/trendp-value
p = 0·2
p = 0·01
p = 0·1
p = 0·2
p = 0·8
p = 0·8
CTT Collaboration: Effects on major coronary events per mmol/L LDL cholesterol reduction subdivided by baseline prognostic factors
Overall 3337 (7·4) 4420 (9·8)0·77 (0·74 – 0·80)

0
1
2
3
4
0.0 0.5 1.0 1.5 2.0 2.5 3.0 3.5
Years
Cu
mu
lati
ve
Inc
ide
nc
e (
%)
36% reduction
ASCOT - LLAPrimary End Point: Nonfatal MI and Fatal CHD
HR = 0.64 (0.50-0.83)
Atorvastatin 10 mg Number of events 100
Placebo Number of events 154
p=0.0005
Sever P, Dahlof B ,Poulter N, Wedel H et al. Lancet 2003 :361;1149-58

ASCOT: Post-hoc Analysis of Benefit Across the whole Cholesterol Range
The primary endpoint:TC Range (mmol/L)
Hazard Ratio 95% CI P Value
<5.0 0.628 0.369-1.095 0.098
5.0-5.9 0.615 0.421-0.897 0.011
≥6.0 0.689 0.451-1.054 0.084
Sever PS, Dahlöf B, Poulter N, Wedel H, et al, for the ASCOT Investigators. Lancet. 2003;361:1149-58
Thus proportional benefit independent of baseline cholesterol

Censoring TimeRisk Reduction Event Rate
(%) Atorvastatin Placebo
83 2.4 14.2
67 5.5 16.6
48 7.5 14.3
45 6.6 12.0
38 5.9 9.5
36 6.0 9.4
Hazard Ratios (95% CI)
Atorvastatin better Placebo better
30 days
90 days
180 days
1 Year
2 Years
End of Study
ASCOT-LLA : CHD events
Time to benefit*
* Per 1000 patient years

Benefits of combined intervention

Most Patients Have Overlapping CV Risk Factors
Of all Hypertensives 65% have dyslipidemia16% have type 2 diabetes 45% are overweight/obese
Of all Dyslipidemics 48% have hypertension14% have type 2 diabetes35% are overweight/obese
Of all Type 2 Diabetics 60% have hypertension60% have dyslipidemia90% are overweight/obese
Hypertension
Type 2Diabetes
Dyslipidemia
Multiple comorbidities increases risk 400-700%
• 1 Based on Framingham risk

ASCOT benefits from combined blood pressure and lipid-loweringReduction in risk of non-fatal MI and fatal CHD using Framingham model for baseline estimates **
Framingham risk estimate from baseline
data ( n=10,305)
Final risk in those assigned
amlodipine/perindopril and atorvastatin
Relative risk reduction
22.8* 4.8* 79%
*per 1000 patient years
**Variables include SBP, smoking status, total and HDL-cholesterol, presence or absence of LVH, age, gender, presence or absence of diabetes. No correction for on- treatment blood pressure

A population based intervention :The rationale
• Age is the most important risk factor (95% MI and stroke deaths occur in over 55 yrs)
• Many subjects are at substantial risk with numerical values of risk factors within the so called “normal” range.
• Multiple risk factor intervention required to deliver maximum effect

Treat risk factor or Treat risk ?
Subject 1• 55 year Asian male• Smoker• BP 140/85• Total cholesterol 5.8 mmol/l• HDL cholesterol 0.8 mmol/L
• 10 yr risk of CVD 25 35 %
• Treatment none
Subject 2• 45 year Caucasian female• Non smoker• BP 165/95• Total cholesterol 5.0 mmol/L• HDL cholesterol 1.5 mmol/L
• 10 yr risk of CVD < 10%
• Treatment antihypertensive drugs
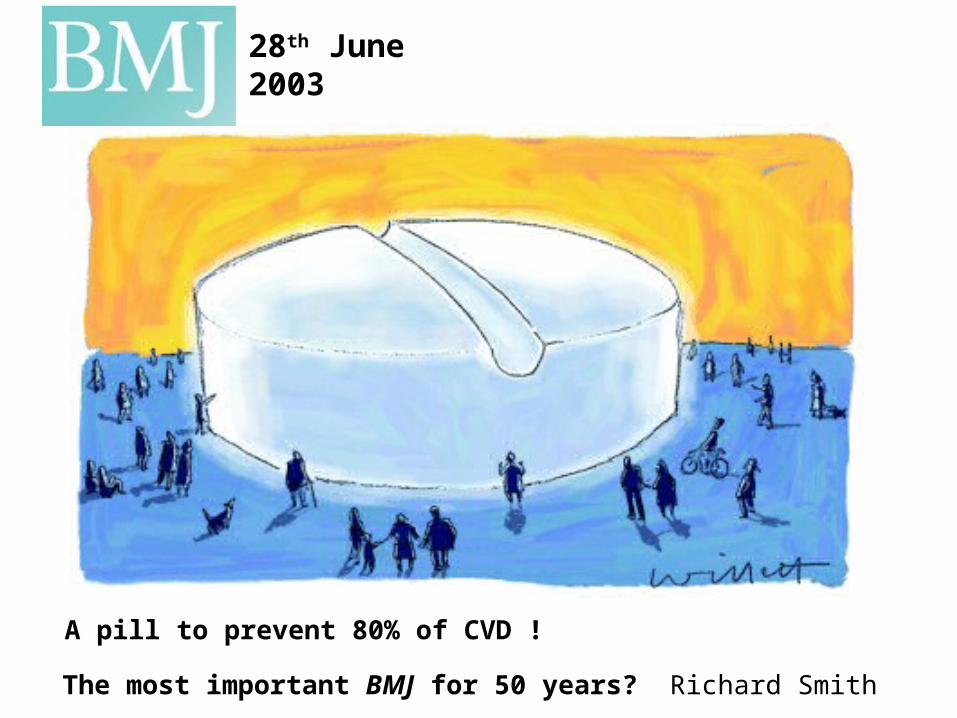
The most important BMJ for 50 years? Richard Smith
28th June 2003
A pill to prevent 80% of CVD !

5.6%
4.2%3.4%
7.5%
0.0%
1.0%
2.0%
3.0%
4.0%
5.0%
6.0%
7.0%
No Rx
Statin
Statin
+BP
Statin
+BP+A
sp
0.06% 0.07%0.60%
0.00%0.0%
1.0%
2.0%
3.0%
4.0%
5.0%
6.0%
7.0%
No Rx
Statin
Statin
+BP
Statin
+BP+A
sp
Treatments
Abs
olut
e ris
k ov
er 5
yea
rs
25%
25%
20%
Overall 55%
Cardiovascular events Major side effects
Estimated absolute risks of major clinical events over a 5 year period
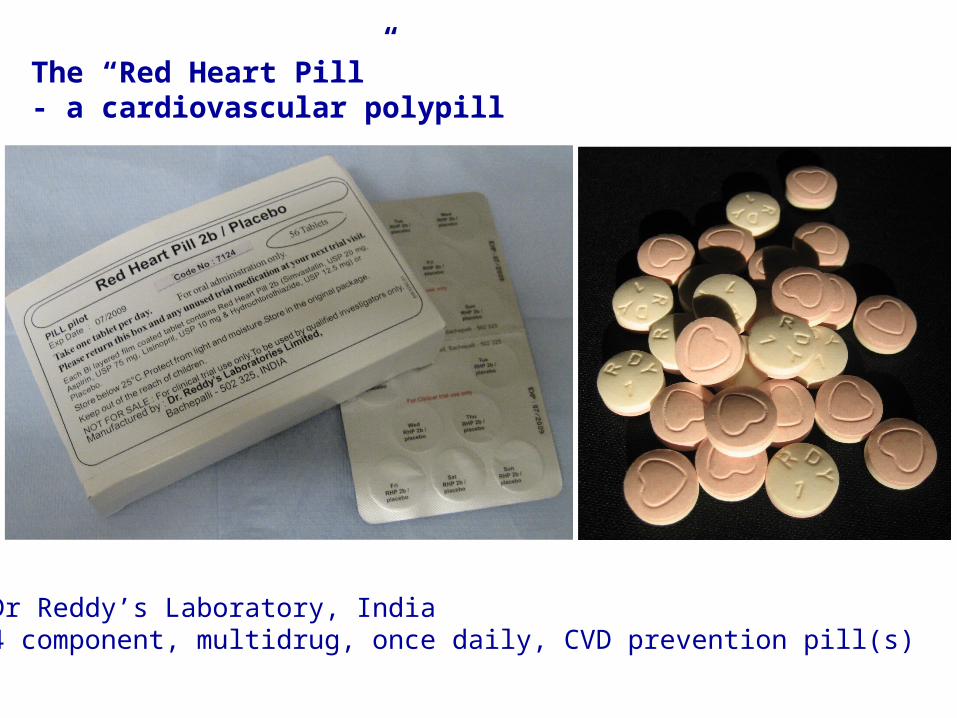
The “Red Heart Pill”- a cardiovascular polypill
Dr Reddy’s Laboratory, India4 component, multidrug, once daily, CVD prevention pill(s)

Patients ≥7.5% 5 year cardiovascular risk & no clear indication or contraindication to aspirin, simvastatin, lisinopril or h’c’thiazide (n=5,000)
Polypill: aspirin 75, simvastatin 20, lisinopril 10, h’c’thiazide 12.5
(n=2,500)
Placebo(n = 2,500)
Active 4 week run-in
Follow-up visits 3, 6 & 12 months; then six monthly until end of trial
Last follow-up visit 3 years after last patient randomised
4 week post trial assessment
Polypill – 1o prevention trial schema
Randomisation
~5000 patients, no CVD history, ≥ 7.5% 5-yr risk
3-5 years follow-up
Australia, Brazil, India,Chinathe Netherlands, New Zealand, UK, USA
1o outcome:Major CV events
90% power to demonstrate a 40% reduction in the 1 outcome
0
Rogers, Thom, Poulter et al 2009

Can we prevent diabetes and associated cardiovascular
disease ?
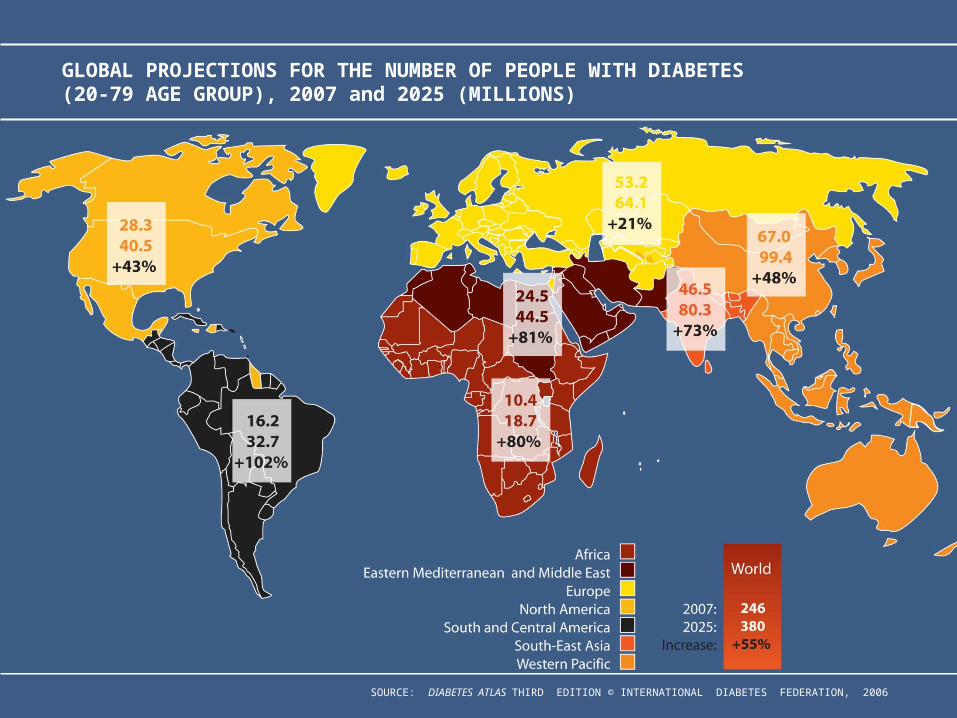
SOURCE: DIABETES ATLAS THIRD EDITION © INTERNATIONAL DIABETES FEDERATION, 2006
GLOBAL PROJECTIONS FOR THE NUMBER OF PEOPLE WITH DIABETES (20-79 AGE GROUP), 2007 and 2025 (MILLIONS)
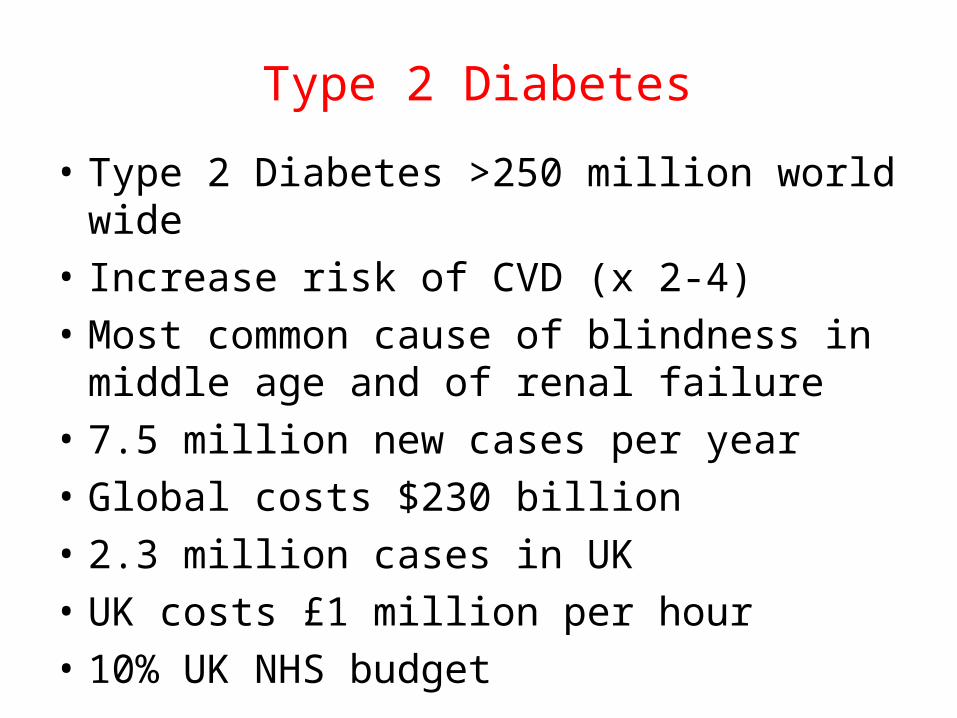
Type 2 Diabetes
• Type 2 Diabetes >250 million world wide
• Increase risk of CVD (x 2-4)
• Most common cause of blindness in middle age and of renal failure
• 7.5 million new cases per year
• Global costs $230 billion
• 2.3 million cases in UK
• UK costs £1 million per hour
• 10% UK NHS budget
GLADIATORGlobal intervention to prevent diabetes and
cardiovascular disease
RATIONALE
“Whilst lifestyle changes including inappropriate calorie intake and lack of exercise are major contributing factors which warrant the introduction of international programmes for intervention, history and reality dictate that this will only achieve limited success. From experience with other risk factors for vascular disease the only practical solution is pharmacological intervention”

GLADIATOR TRIAL
Drug treatment to prevent diabetes needs to recognize that in most cases people are at additional risk because of associated levels of blood pressure and cholesterol and that the consequent vascular disease is a result of the interaction of multiple risk factors

GLADIATOR TRIAL
• There is extensive evidence from large scale studies of effective, safe and well tolerated drugs to lower blood pressure, cholesterol and blood sugar
• No previous study has attempted to prevent diabetes and CVD in an at risk population
• We propose a multirisk intervention with a realistic chance of reducing new onset diabetes by 70% and new CVD events by 50% over a 4 year period

Prediabeticmen & women
Statin + ARBPlacebo + Placebo
Metformin + Pioglitazone
Placebo + PlaceboMetformin + Pioglitazone
Placebo + Placebo
R
R R
n=12500
n=6250 n=6250
n=3125 n=3125 n=3125 n=3125
*
Fig 3
GLADIATOR TRIALThe prevention of type 2 diabetes and cardiovascular endpoints
12,500 subjects ,UK, China, India, Middle East and Africa
Poulter, Sever, Alberti, Barakat 2009
Follow up average 4 years. 95% power to detect 50% reduction in CV endpoint99% power to detect 70% reduction in new onset diabetes

Conclusions
• Cardiovascular Disease is increasing globally mainly in the developing world and the former Eastern Bloc states.
• In the developed world in many countries there have been dramatic reductions in CHD and stroke events largely explained by reductions in known risk factors
• The emergence of the epidemic of obesity and type 2 diabetes may reverse this trend
• Whilst lifestyle measures should form the basis of prevention, pharmacotherapy with effective and safe drugs is likely to have a major impact on the prevention of diabetes and CVD