


Languages
Pages
Legal


The Future of Work is What We Make It
Jim Stanford Economist and Director, Centre for Future Work
April 2018

Five Provocations 1. There is no visible acceleration of labour-saving
technology. 2. Both the “optimists” and the “pessimists” are
wrong regarding automation and jobs. 3. The modern labour market continues to create
and recreate low-wage low-quality work. 4. There is little new about “gig” jobs. 5. The structural & institutional disempowerment
of labour (not technology or lack of skill) explains workers’ deteriorating outcomes.
• Discussion of implications for skills & training.

1. Labour-Saving Automation is not Actually Accelerating
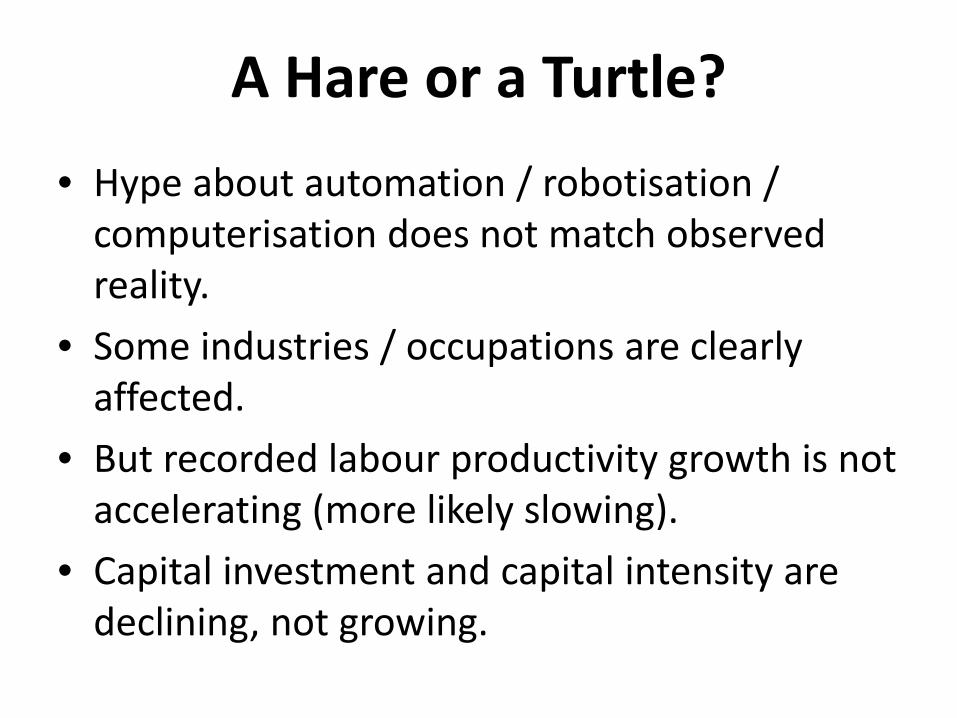
A Hare or a Turtle? • Hype about automation / robotisation /
computerisation does not match observed reality.
• Some industries / occupations are clearly affected.
• But recorded labour productivity growth is not accelerating (more likely slowing).
• Capital investment and capital intensity are declining, not growing.

Actual & Implied Productivity
50
100
150
200
250
300
2000 2002 2004 2006 2008 2010 2012 2014 2016 2018 2020
Labo
ur P
rodu
ctiv
ity (2
000=
100)
Productivity Implied by Loss of 47% of Jobs
<2% Annual Growth

Falling Capital Investment
$35
$40
$45
$50
$55
$60
$65
$70
$75
2007 2009 2011 2013 2015 2017
Real
Bus
ines
s Inv
estm
ent
($20
16/q
)

Eroding Capital Intensity
$46
$47
$48
$49
$50
$51
$52
$53
$54
2007 2008 2009 2010 2011 2012 2013 2014 2015
Net
Rea
l M&
E Ca
pita
l Per
Wrk
r ($K
2016
)

Example: Driverless Transport

Example: Driverless Transport • Technology of full automation is progressing
more rapidly than expected. • Many barriers will limit its implementation in
real-world (rather than laboratory applications): – Regulation. – Infrastructure. – Proof of safety. – Social acceptance. – Capital / management adequacy. – Lag times to phase in new equipment.

2. Both the Pessimists and Optimists are Wrong

Empty Glass
E = Q q
• There is a fixed amount of “work” (for output Q). • Amount of employment (E) depends on how much
labour is required to produce that output. • Robots boost productivity (q) less jobs. • Higher unemployment means lower wages.

Full Glass
E = Ls
• There is a given number of workers in society (Ls). • Automation will cause displacement of some workers. • But automatic market mechanisms will ensure their
redeployment in other jobs. • A helping hand from transition supports and
monetary policy may be needed. • Labour productivity grows, therefore wages grow.

A Curse on Both Houses (I)
• Quantity of output is not fixed. – It will change in response to demand. – Past waves of innovation sparked new demand
through business investment (eg. railroads, mass production, computers).
– Other sources of new demand could spur growth in output: including higher real incomes, demand for new products made feasible because of the technology.

A Curse on Both Houses (II)
• Work is created as well as displaced. – Work associated with invention / design /
manufacture / operation / maintenance of the new machinery.
– Work associated with new products made possible by virtue of the technology.
– Work that is very menial but profitable, especially in conditions of chronic excess labour supply.

A Curse on Both Houses (III) • There is no reason to expect that the jobs created
will balance the jobs displaced or destroyed. • No reason to expect a deregulated competitive
labour market to achieve full employment. • Even “guided” by monetary policy, capacity to
reallocate displaced resources is inadequate. – Specific challenges for those affected. – General failure of aggregate labour demand.
• In history, the leading engine of growth during technological disruption was business investment: but today that is weak.

Glass-Half-Full Policy Implications
• Consider both the threats and the opportunities to work from technology.
• Play an active role maximising the “upside” and managing/assisting on the “downside.”
• Top emphasis on lifting both the quantity and the quality of work will help.

3. Continued Degradation of Work

Labour Market’s Capacity to Create and Recreate Low-Quality Work
• In conditions of chronic excess supply and falling real wages (for marginal hires), firms can profitably hire people for very menial unproductive jobs. – Concentrated in non-tradeable services.
• Overlaps with shift to insecure non-standard positions (casual, contractor, sole proprietorships, “gigs”).
• Non-enforcement of minimum labour standards encourages this “low road.”
19

Jobs of the Future: Fastest-Growing Occupations, 2017-2022 Occupation New Jobs
(000) Occupation New Jobs
(000)
Personal carers & assistants
90.6 Child carers 25.8
Midwifery & nursing professions
73.7 Misc. hospitality & retail managers
24.7
School teachers 38.4 Social & welfare professionals
23.6
Sales assistants & salespersons
34.8 Construction & dist’n managers
22.4
Hospitality workers 32.8 General clerks 22.2 Info.& organisation
professionals 26.4 Education aides 21.9
Dept. of Employment forecast.

4. What is “Gig” Work? And is it Even “New”?
• 5 common key features: 1. No commitment to continuing work (“on call”). 2. Piece-work compensation. 3. Worker assumes responsibility for providing
equipment, workplace (“home work”). 4. Triangulated relationship with an intermediary. 5. Assumption of digital mediation.
– What job doesn’t have it??

What’s New About “Gig” Work? • Application of new technology in gig jobs
mostly aimed at work organization, not production process itself. – Matching, scheduling, monitoring.
• Key features of gig work (irregular on-call scheduling, working on own premises with own tools, piece work compensation, triangulated relationship) have long history.

Home Work

Piece Work

On-Call Work

Labour Hire

5. Structural & Institutional Disempowerment of Labour
• Erosion of institutions which supported higher and more equal wages explains the relative decline in labour incomes and their greater inequality.
• Because of economic conditions, regulatory openings, willingness (desperation?) of workers, and technology, employers have created a hyper-flexible system of just-in-time, precarious work.
• Technology facilitates this, but hasn’t caused it.

The Prevalence of Insecure Work (4-quarter average 2017)
Working Age Population: 19.92 million
In Labour Force: 12.99 million Not in Labour Force: 6.93 million
Working: 12.26 million Unemp’d 725.000
Run Business (w. employees):
773,000
“Self-Employed” (no employees):
1.34 million Paid Employment: 10.15 million
Full Time: 6.97 million Part Time: 3.18 million
Full-Time With Entitlements: 6.13 million
Australians in paid full-time employment with leave entitlements now account for just: * 60% of paid employment * 47% of the labour force * 31% of adult population
Source: CFW from ABS Catalogue 6291.0.55.003 Tables 24a & EQ04. Some totals do not add due to rounding. Self-employed incl. unpaid family workers.

New World for Workers 1985 Current
Union Density (%) 47% 13% Days Lost to Industrial Disputes (/1000 wrkrs)
222 12
Minimum Wage (% median)
59% 44%
Labour Share GDP (%) 51% 46% Real Unit Labour Cost
(2016=100) 111 97

Putting Technology in Its Place • Every technical application has a social /
political / regulatory context, that impacts its use as part of employers’ cost-minimising business strategies.
• Example: Uber and “gig” jobs. – Why not use the actual new technology (dispatch
system) to improve taxi service in a context that maintains standard jobs and stability of work??


Skills and the Jobs Crisis 1. Economy is not held back by a “lack of skills.”
– It’s held back by a lack of jobs. – Australians are better-educated than ever. – Millions under-utilise their skills.
2. Training alone doesn’t create skilled jobs. – It does create valuable jobs in education.
3. Individuals with more education are better off… but often for the wrong reasons: – Signaling − Queuing (credential inflation)
4. “Wrong skills” often used to blame the victim. – Gov’t uses shallow training commitments as PR.

Technology, Structural Change, and Vocational Training
• New tech: Some jobs will be lost, some created. – Without strong job-creation commitment by policy,
no guarantee those two will match. • Training and retraining can facilitate mobility.
– Again, no guarantee; protections needed for affected workers (redeployment & mobility rights).
• Integrated into a holistic labour market strategy, high-quality training can play a crucial role as labour market adapts to new technology.

Government and Higher Education:

Government: Where’s the Beef? • Token pledges for training and adjustment.
– Usually at times of crisis or restructuring announcements, and/or to help “sell” painful policies (trade agreements, budget cuts).
• Rhetoric never matched with real resources. • Treatment of vocational education especially
destructive. – Privatisation. – Funding cuts. – System at risk of collapse.

Germany’s Example

Germany’s Example • Effective integration of vocational training,
industrial policy, R&D, and job-creation. – 1000+ identified, recognised, credentialed trades. – Seamless transitions: school vocational training
work. – Emphasis on quality in both training and jobs (even
private service jobs are treated like “careers”). – Invest in skilled people; then use them to build world-
beating industries. – Unions are a partner in the system; training and skills
are negotiated at firm and industry levels. – Youth unemployment rate: 7%.

A Positive, Pragmatic Vision for Training and Skills
• Skills aren’t a “magic bullet” for the jobs crisis. – But they should be part of a bigger, integrated plan.
• Lifting the quality of work, creates economic space to provide high-quality skills. – Regulate occupations; set standards & credentials. – Example: disability services.
• Higher education needs stability & access. • Vocational skills are legitimate and valued.
– Australia’s approach needs total re-boot, with well-funded TAFEs at the core.

Thank You!
www.futurework.org.au
@jimbostanford @cntrfuturework
Top Related