


Languages
Pages
Legal

S. M. Pietruszko, PV Centre PolyCity Warsaw, 03 Sept. 2009
The future of solar electricity (Photovoltaics)
Stanislaw M. PIETRUSZKOStanislaw M. PIETRUSZKO
Centre for PhotovoltaicsCentre for Photovoltaics
Warsaw University of TechnologyWarsaw University of Technology
S. M. Pietruszko, PV Centre PolyCity Warsaw, 03 Sept. 2009
Responsible energy policy for thefuture
Renewable energy sources with an efficient and rational use of energy are capable of:
• preserving resources,
• ensuring security and diversity of energy supply,
• providing energy services, virtually without anyenvironmental impact.
RES are well distributed and decentralised.
S. M. Pietruszko, PV Centre PolyCity Warsaw, 03 Sept. 2009
Why Photovoltaics?
• Direct conversion of sunlight to electricity
• No pollution
• No noise
• Wide range of applications (off- and on grid, BIPV)
• Modularity
• Helpful in disasters
S. M. Pietruszko, PV Centre PolyCity Warsaw, 03 Sept. 2009
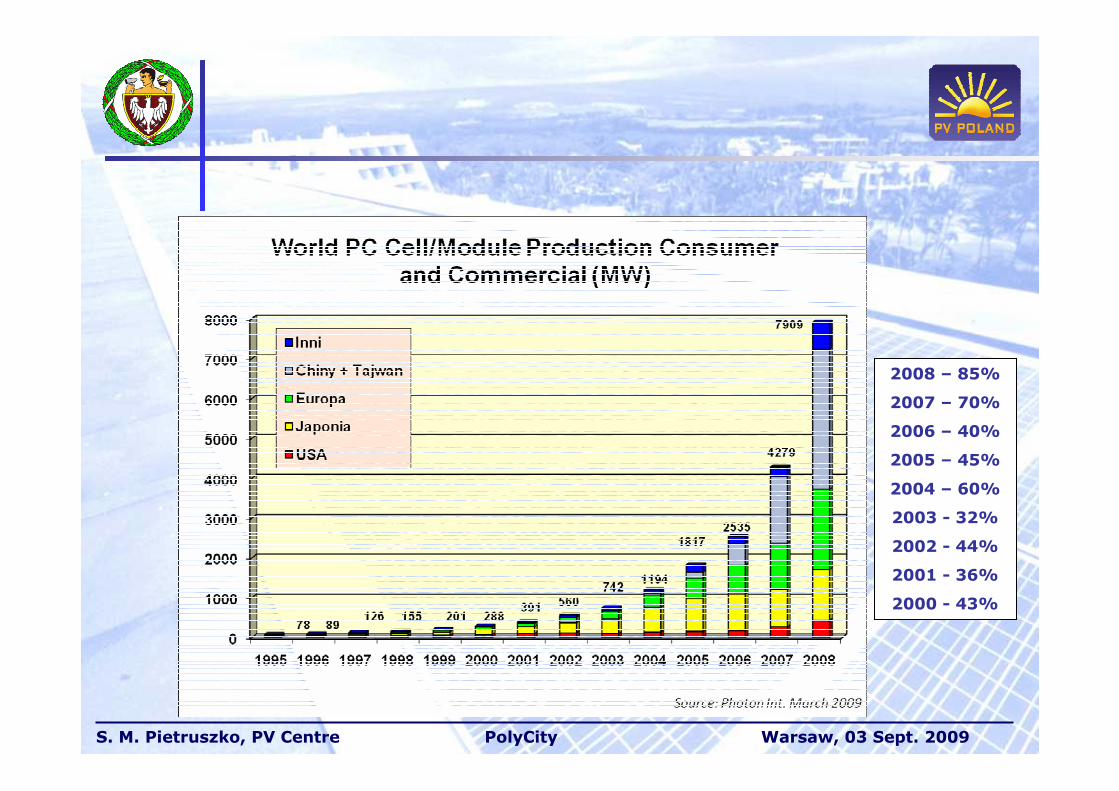
S. M. Pietruszko, PV Centre PolyCity Warsaw, 03 Sept. 2009
2008 – 85%
2007 – 70%
2006 – 40%
2005 – 45%
2004 – 60%
2003 - 32%
2002 - 44%
2001 - 36%
2000 - 43%
S. M. Pietruszko, PV Centre PolyCity Warsaw, 03 Sept. 2009
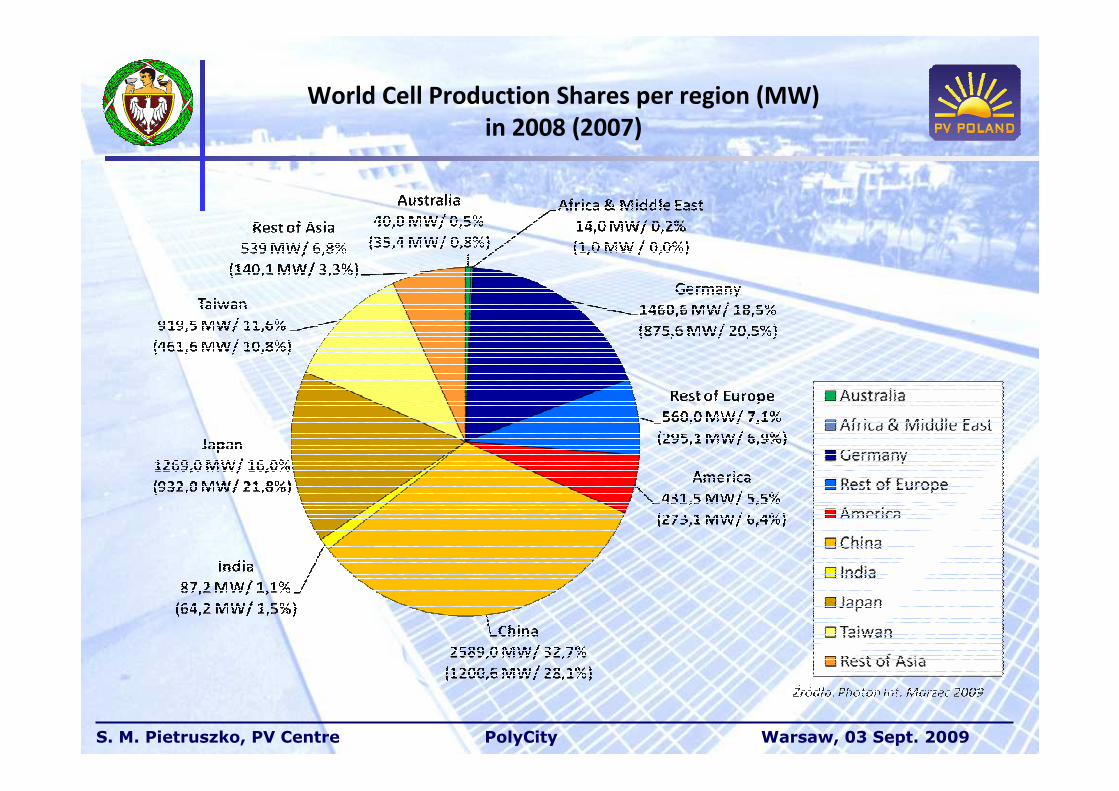
World Cell Production Shares per region (MW)
in 2008 (2007)
S. M. Pietruszko, PV Centre PolyCity Warsaw, 03 Sept. 2009
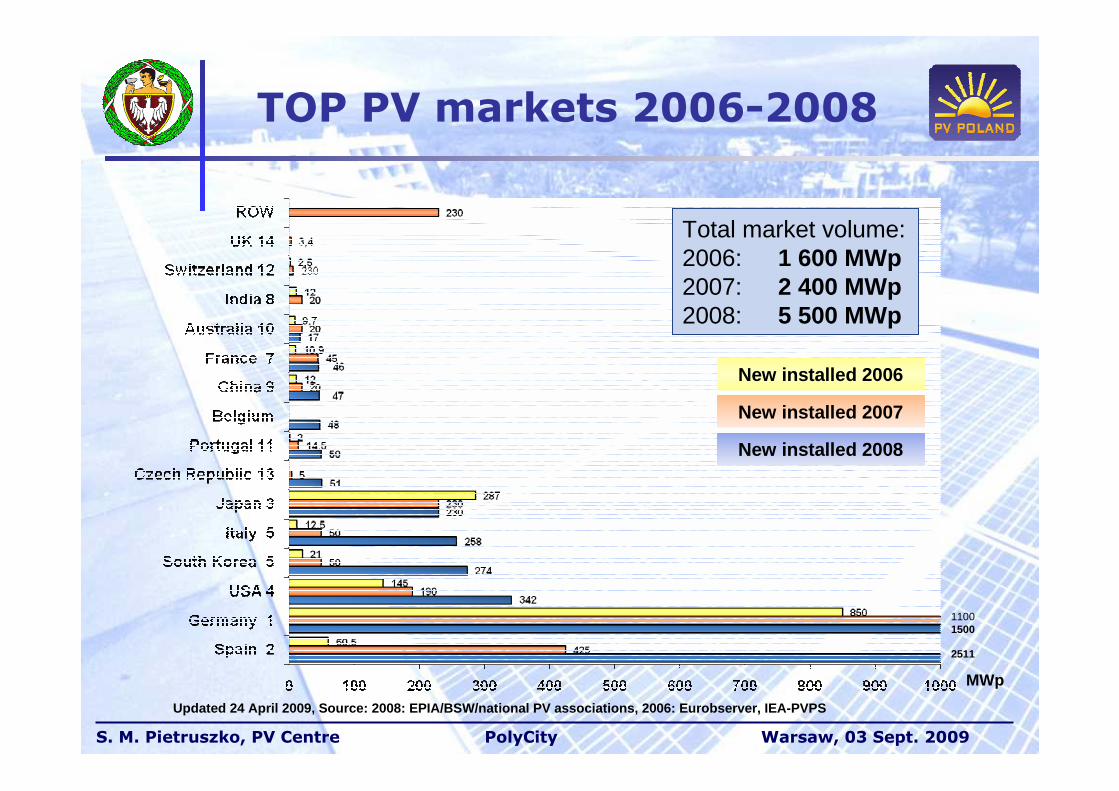
TOP PV markets 2006-2008
Updated 24 April 2009, Source: 2008: EPIA/BSW/national PV associations, 2006: Eurobserver, IEA-PVPS
Total market volume:2006: 1 600 MWp2007: 2 400 MWp2008: 5 500 MWp
11001500
MWp
New installed 2006
New installed 2007
New installed 2008
2511
S. M. Pietruszko, PV Centre PolyCity Warsaw, 03 Sept. 2009
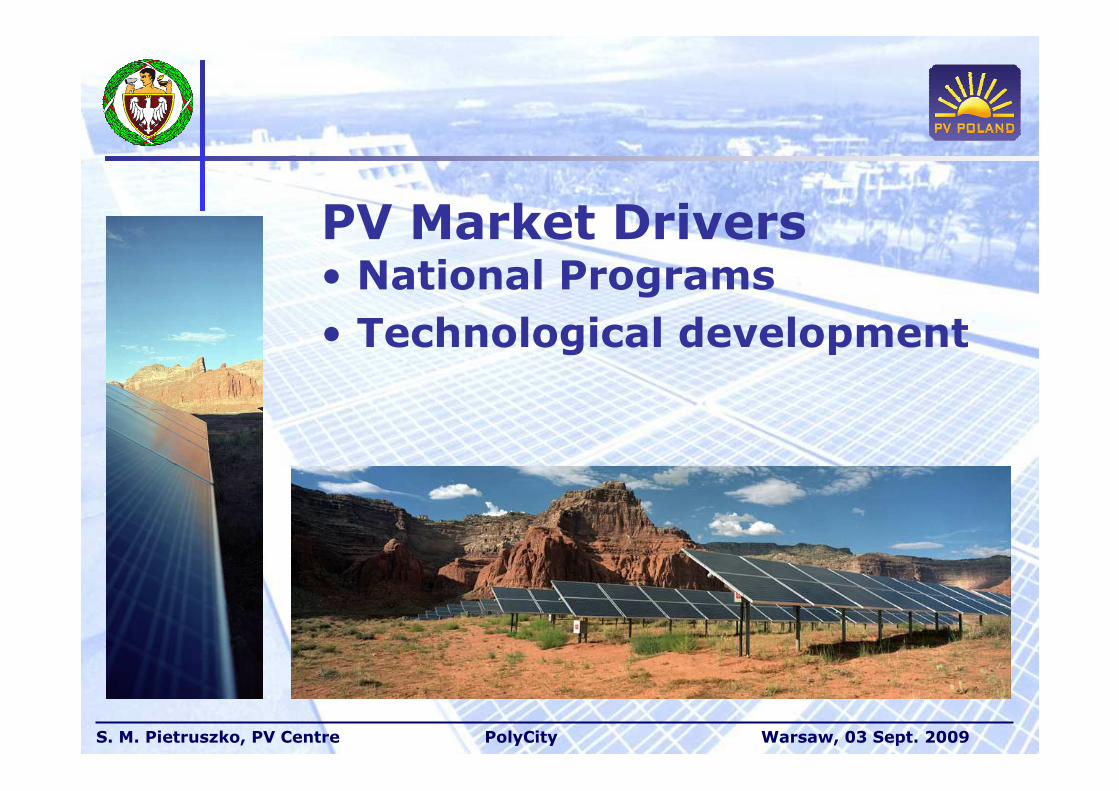
PV Market Drivers• National Programs
• Technological development
S. M. Pietruszko, PV Centre PolyCity Warsaw, 03 Sept. 2009
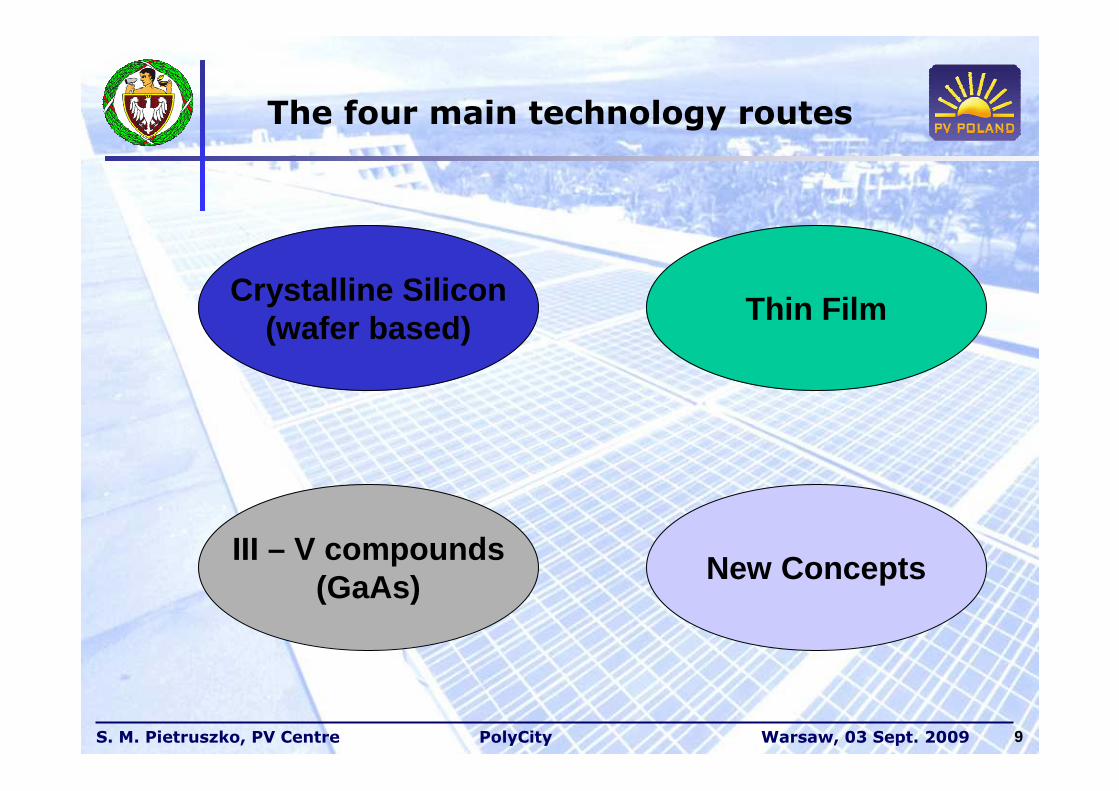
The four main technology routes
9
Crystalline Silicon(wafer based)
New ConceptsIII – V compounds
(GaAs)
Thin Film
S. M. Pietruszko, PV Centre PolyCity Warsaw, 03 Sept. 2009
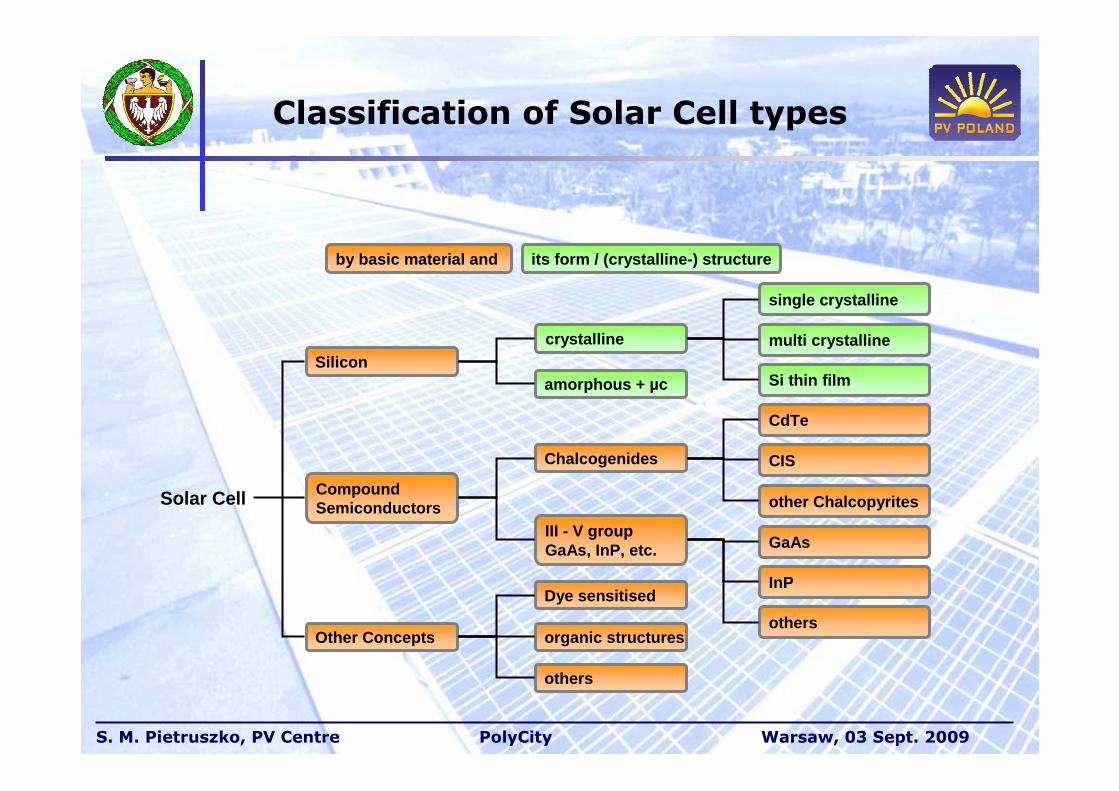
Classification of Solar Cell types
Silicon
Compound Semiconductors
Other Concepts
Solar Cell
others
organic structures
Dye sensitised
III - V groupGaAs, InP, etc.
Chalcogenides
GaAs
InP
others
crystalline
amorphous + µc
other Chalcopyrites
single crystalline
multi crystalline
Si thin film
CIS
CdTe
its form / (crystalline-) structureby basic material and
S. M. Pietruszko, PV Centre PolyCity Warsaw, 03 Sept. 2009
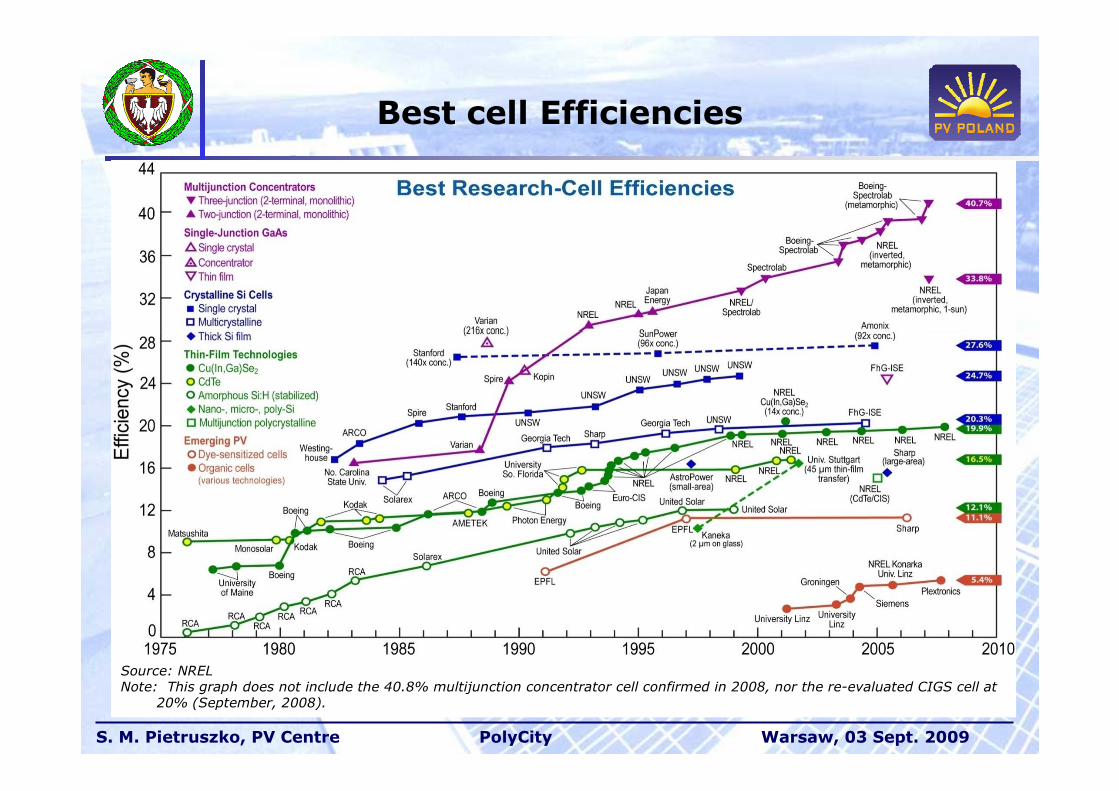
Best cell Efficiencies
Source: NREL Note: This graph does not include the 40.8% multijunction concentrator cell confirmed in 2008, nor the re-evaluated CIGS cell at
20% (September, 2008).
S. M. Pietruszko, PV Centre PolyCity Warsaw, 03 Sept. 2009
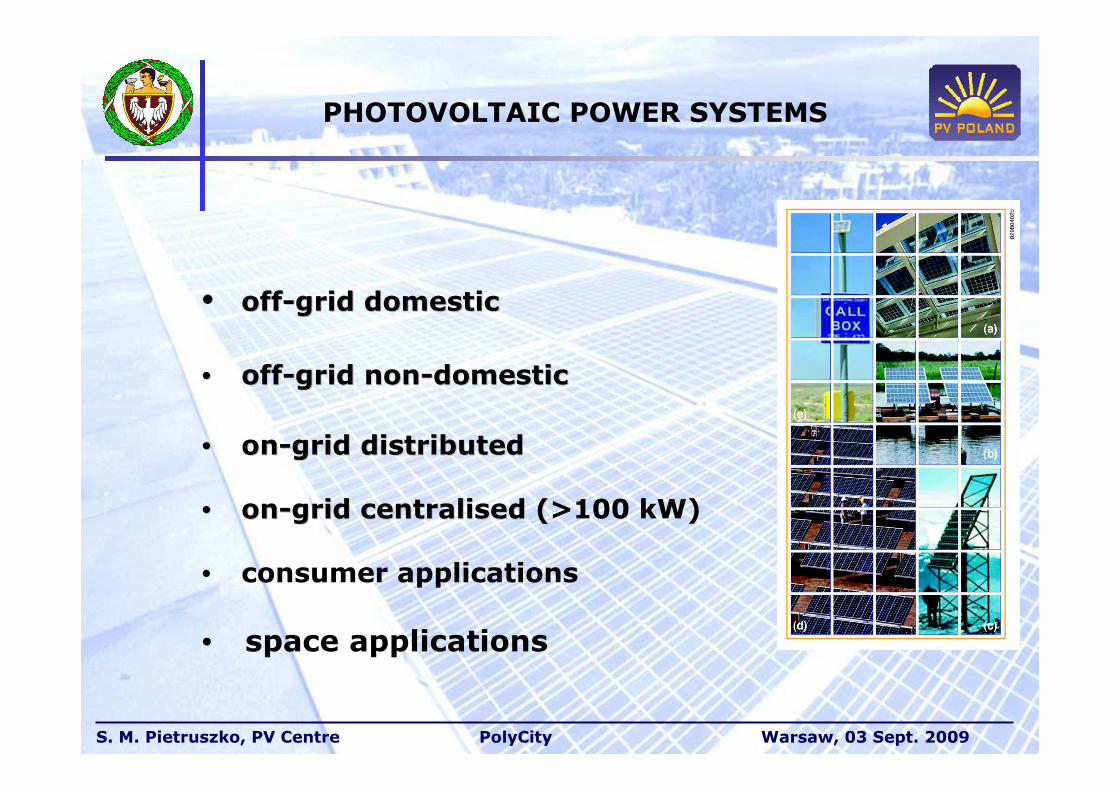
PHOTOVOLTAIC POWER SYSTEMS
• offoff--grid domesticgrid domestic
•• offoff--grid nongrid non--domesticdomestic
•• onon--grid distributedgrid distributed
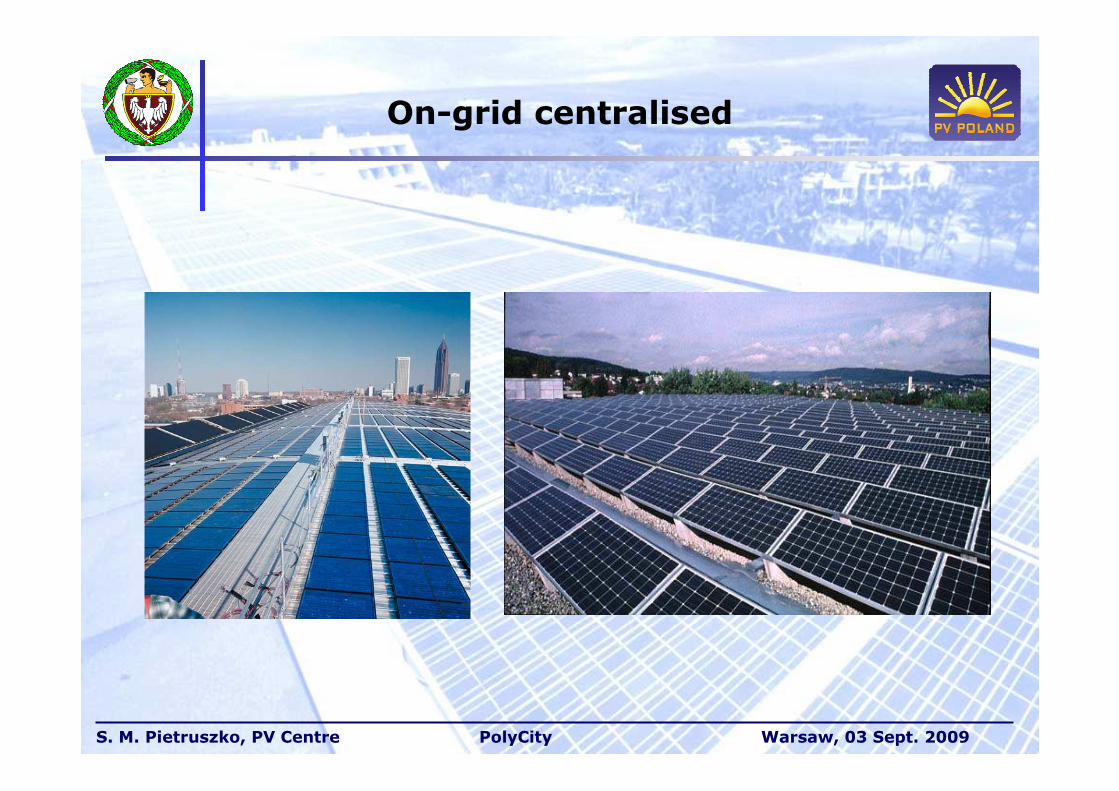
•• onon--grid centralised (grid centralised (>100 kW)
• consumer applications
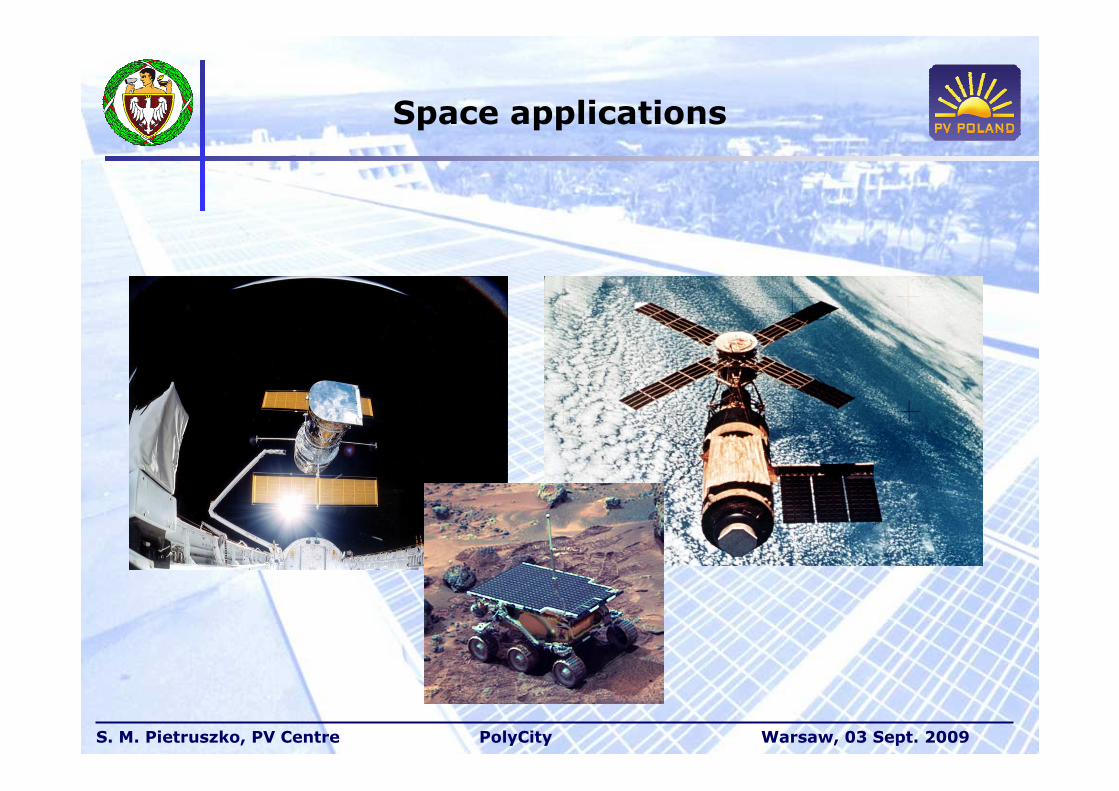
• space applications
S. M. Pietruszko, PV Centre PolyCity Warsaw, 03 Sept. 2009
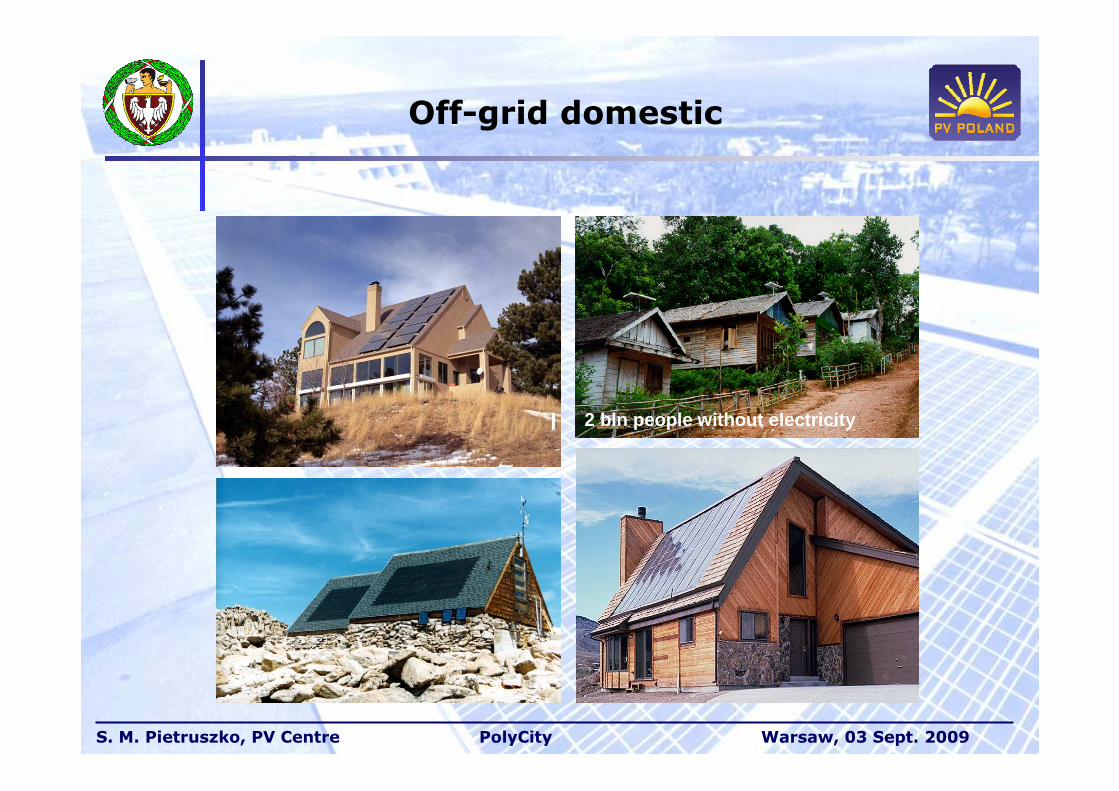
Off-grid domestic
2 bln people without electricity
S. M. Pietruszko, PV Centre PolyCity Warsaw, 03 Sept. 2009
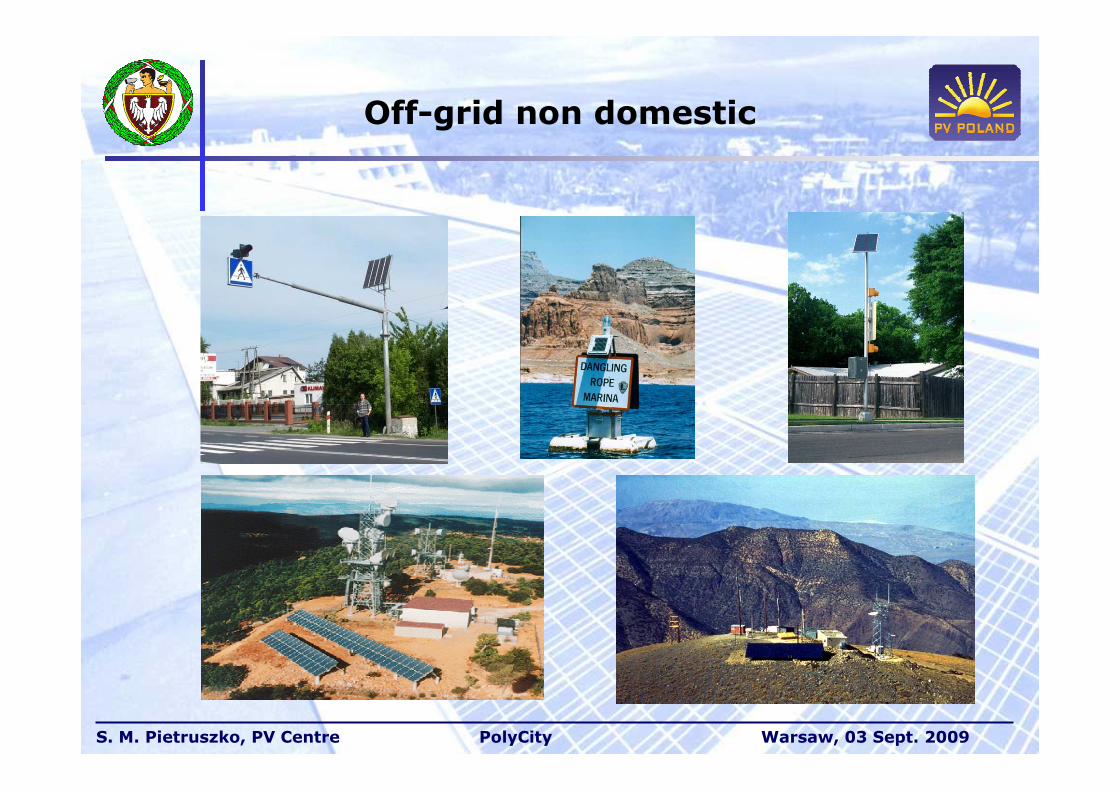
Off-grid non domestic
S. M. Pietruszko, PV Centre PolyCity Warsaw, 03 Sept. 2009
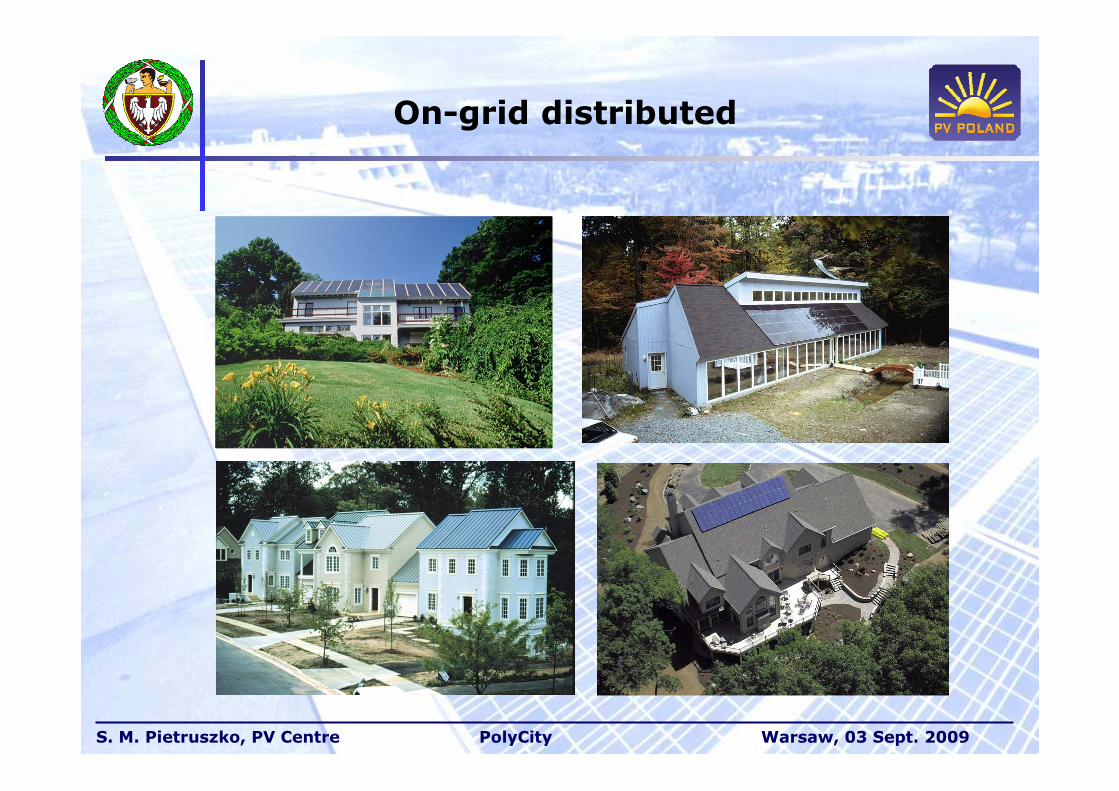
On-grid distributed
S. M. Pietruszko, PV Centre PolyCity Warsaw, 03 Sept. 2009
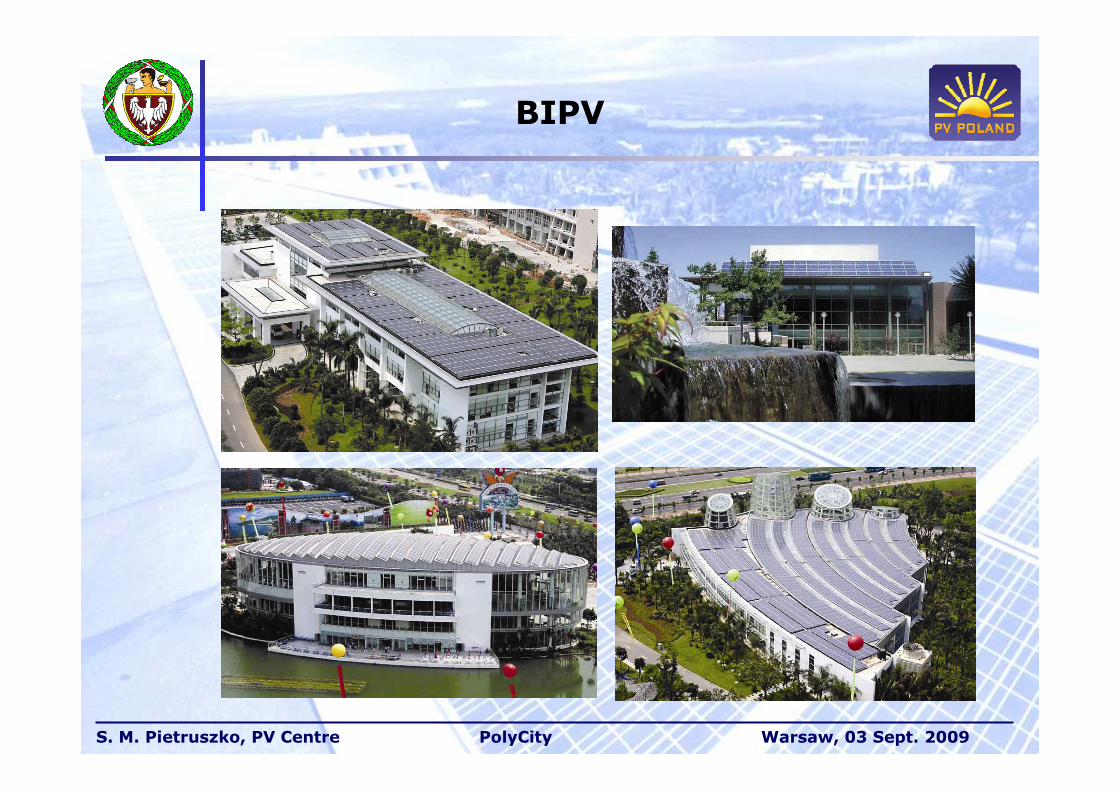
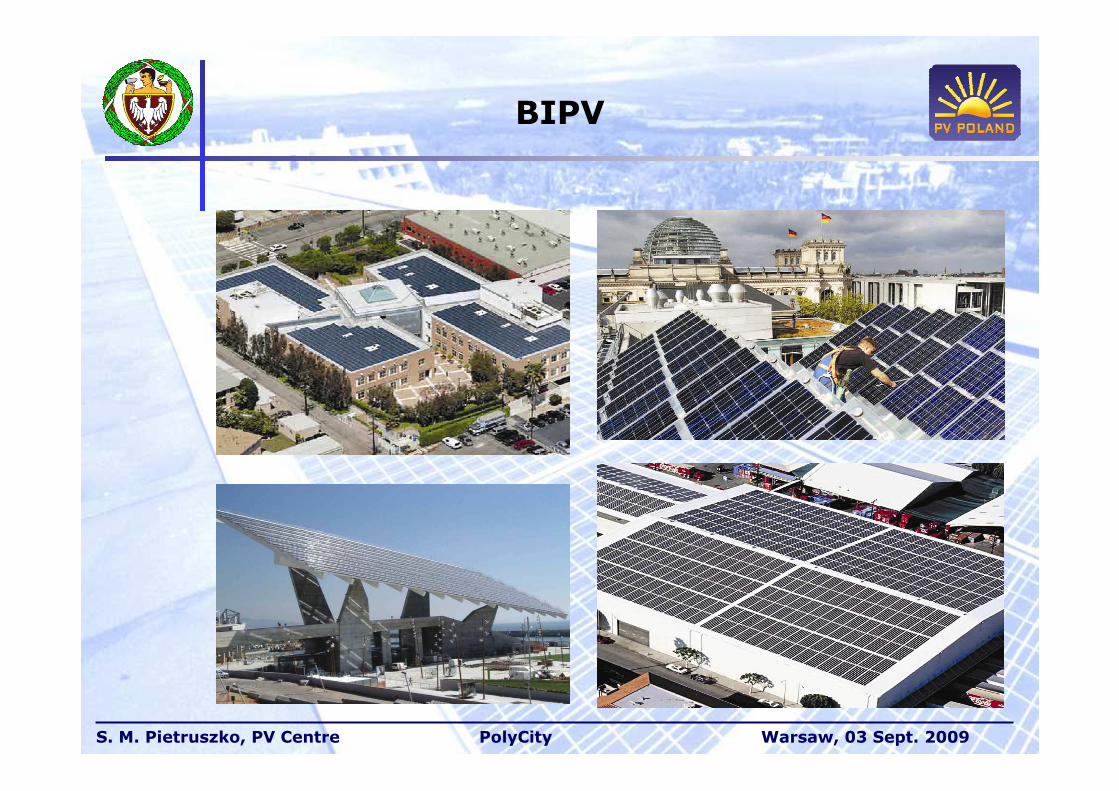
BIPV
S. M. Pietruszko, PV Centre PolyCity Warsaw, 03 Sept. 2009
BIPV
S. M. Pietruszko, PV Centre PolyCity Warsaw, 03 Sept. 2009
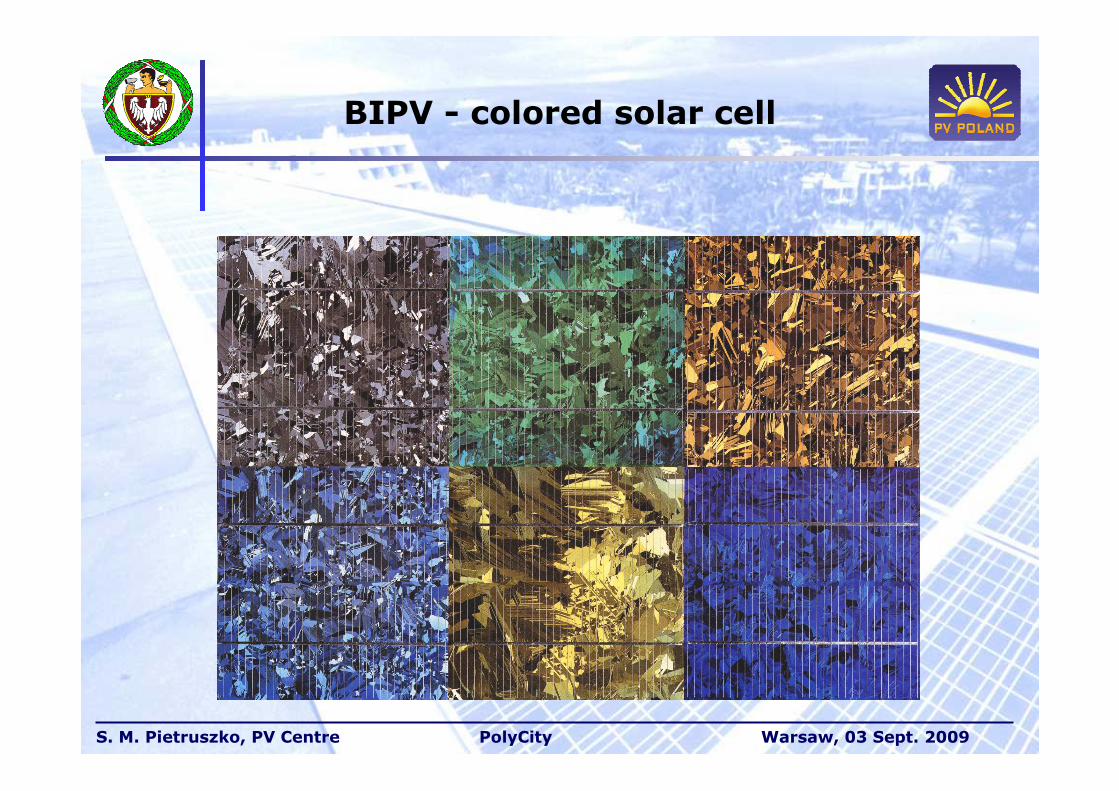
BIPV - colored solar cell
S. M. Pietruszko, PV Centre PolyCity Warsaw, 03 Sept. 2009
On-grid centralised
S. M. Pietruszko, PV Centre PolyCity Warsaw, 03 Sept. 2009
Space applications
S. M. Pietruszko, PV Centre PolyCity Warsaw, 03 Sept. 2009
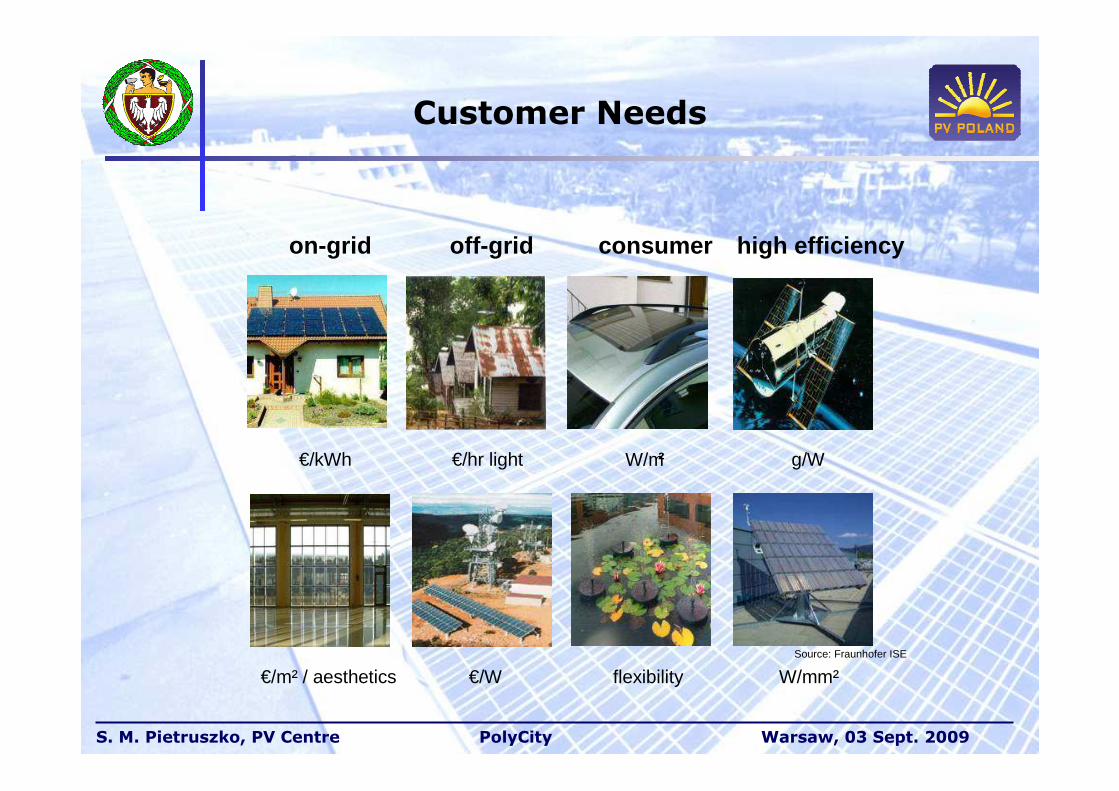
Customer Needs
on-grid off-grid consumer high efficiency
€/kWh €/hr light W/m² g/W
Source: Fraunhofer ISE
€/m² / aesthetics €/W flexibility W/mm²
S. M. Pietruszko, PV Centre PolyCity Warsaw, 03 Sept. 2009
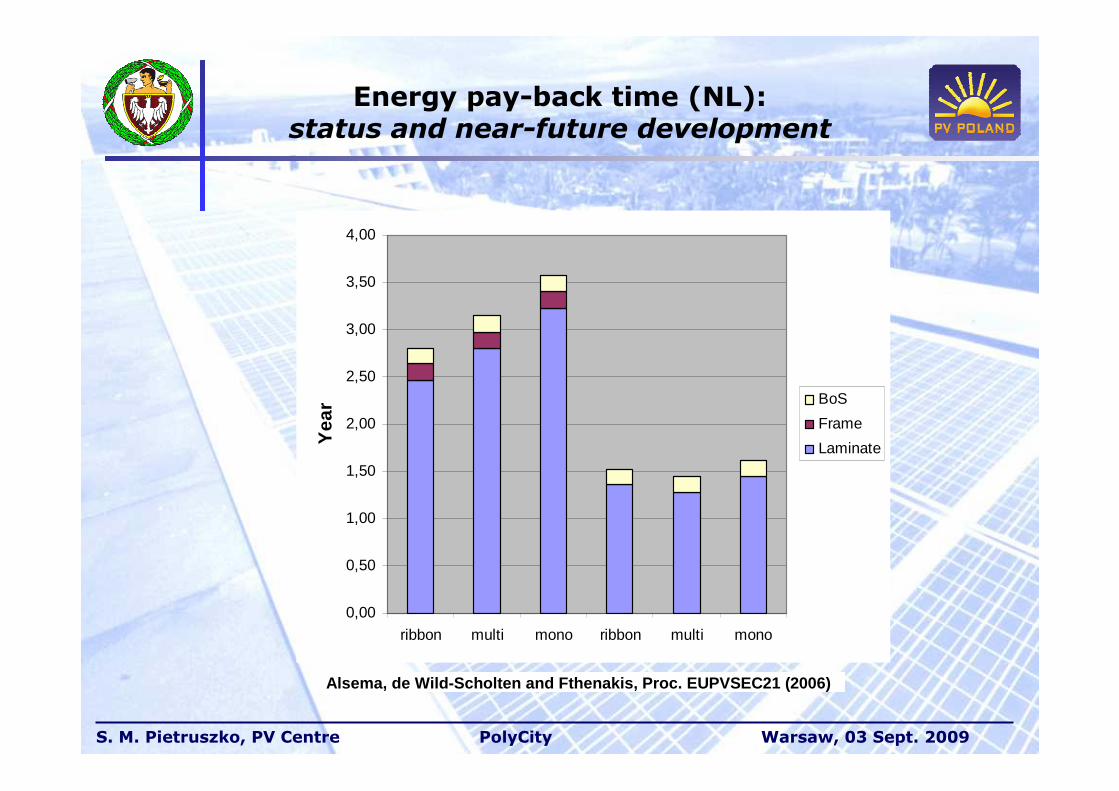
Energy pay-back time (NL):status and near-future development
Alsema, de Wild-Scholten and Fthenakis, Proc. EUPVS EC21 (2006)
0,00
0,50
1,00
1,50
2,00
2,50
3,00
3,50
4,00
ribbon multi mono ribbon multi mono
Yea
r BoS
Frame
Laminate
S. M. Pietruszko, PV Centre PolyCity Warsaw, 03 Sept. 2009
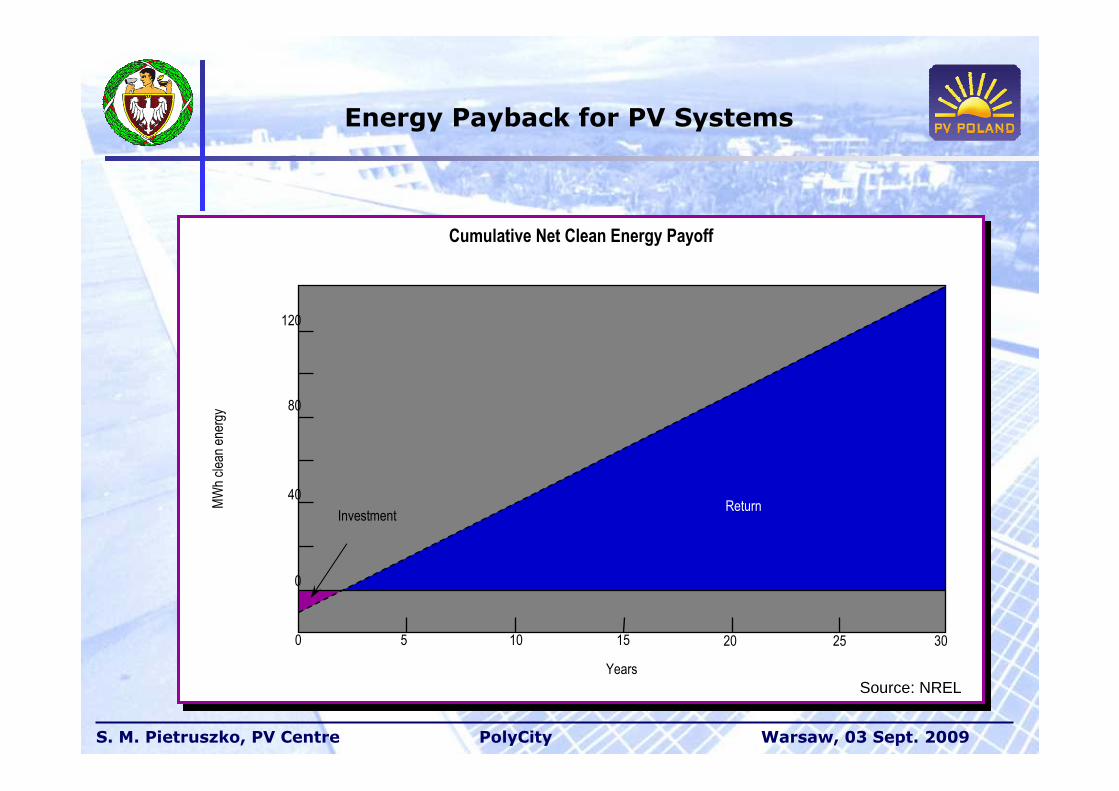
Energy Payback for PV Systems
Cumulative Net Clean Energy Payoff
120
80
40
0
MW
h cl
ean
ener
gy
0 5 10 15 20 25 30
Investment
Years
Return
Source: NREL
S. M. Pietruszko, PV Centre PolyCity Warsaw, 03 Sept. 2009
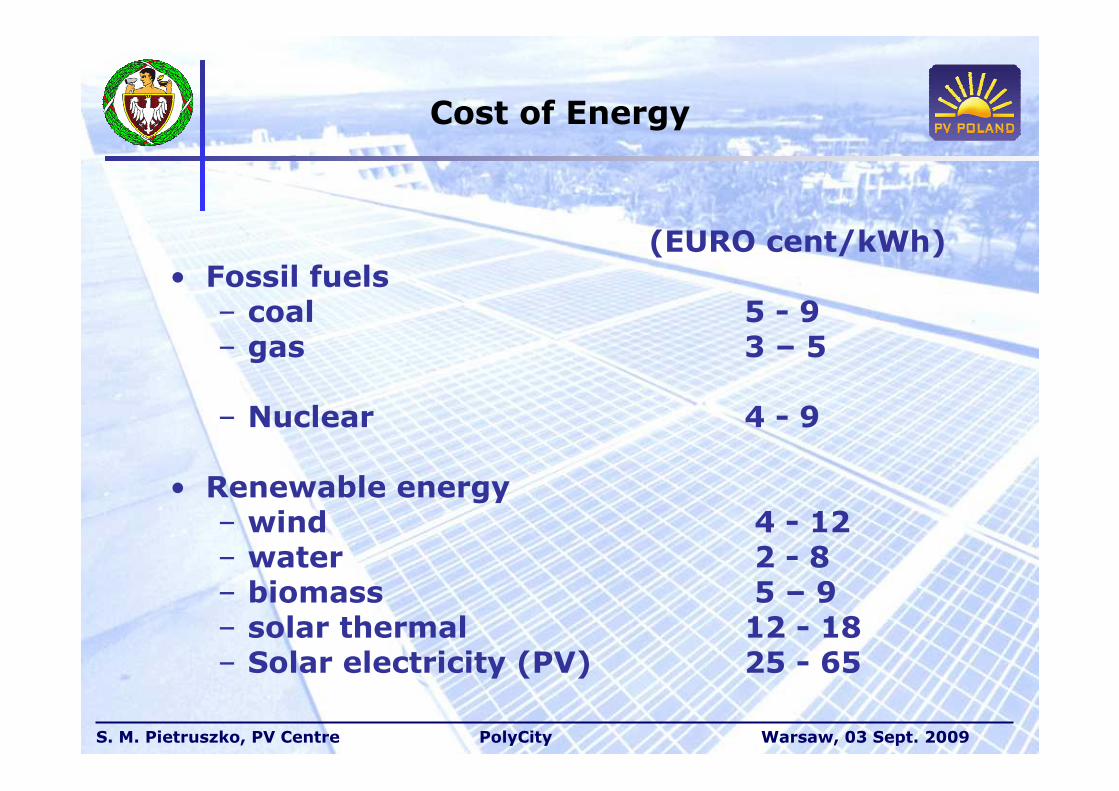
Cost of Energy
(EURO cent/kWh)• Fossil fuels– coal 5 - 9 – gas 3 – 5
– Nuclear 4 - 9
• Renewable energy– wind 4 - 12– water 2 - 8– biomass 5 – 9– solar thermal 12 - 18– Solar electricity (PV) 25 - 65
S. M. Pietruszko, PV Centre PolyCity Warsaw, 03 Sept. 2009
SOLAR ELECTRICITY
• PV is positioned to meet the critical energy-sector demands world-wide in the coming decades.
• The cost of photovoltaic (PV) electricity:
– too high for bulk power production in utility grids
– cost-effective for peak power applications and local grid support
• Important natural market in the world-wide off-grid applications
S. M. Pietruszko, PV Centre PolyCity Warsaw, 03 Sept. 2009
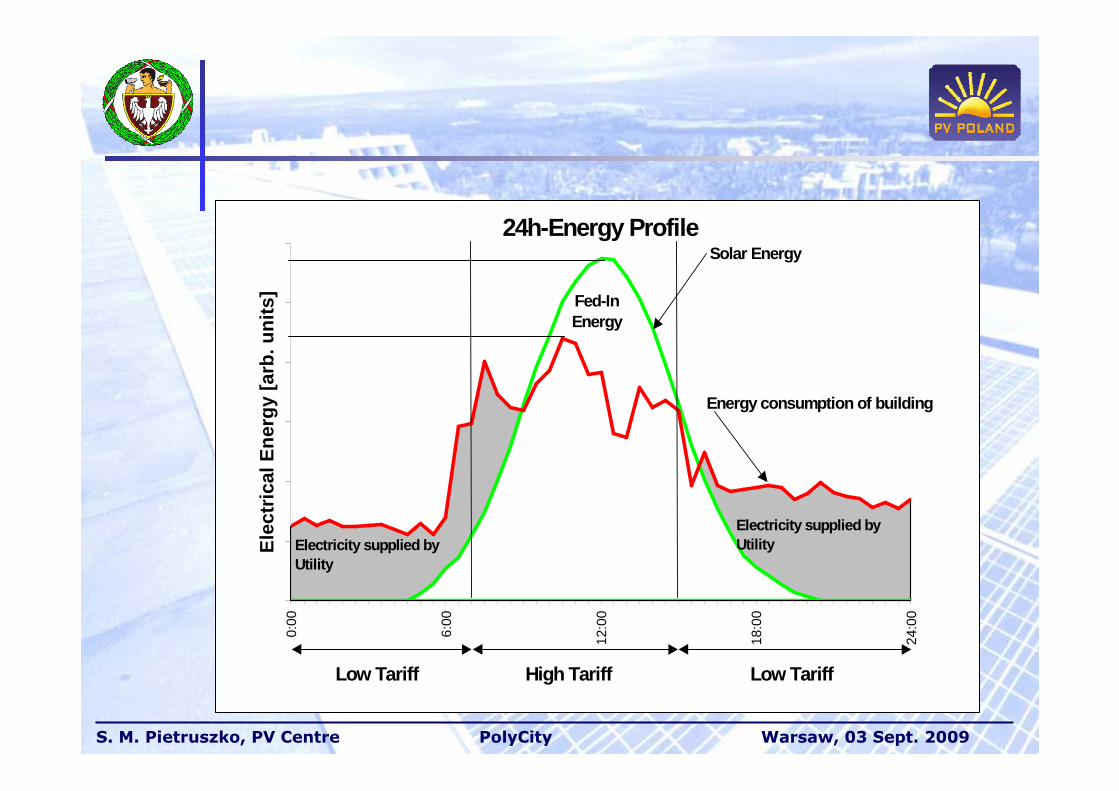
24h-Energy Profile
0:00
6:00
12:0
0
18:0
0
24:0
0
Ele
ctric
al E
nerg
y [a
rb. u
nits
]
Low Tariff Low TariffHigh Tariff
Electricity supplied by Utility
Fed-InEnergy
Solar Energy
Energy consumption of building
Electricity supplied by Utility
S. M. Pietruszko, PV Centre PolyCity Warsaw, 03 Sept. 2009
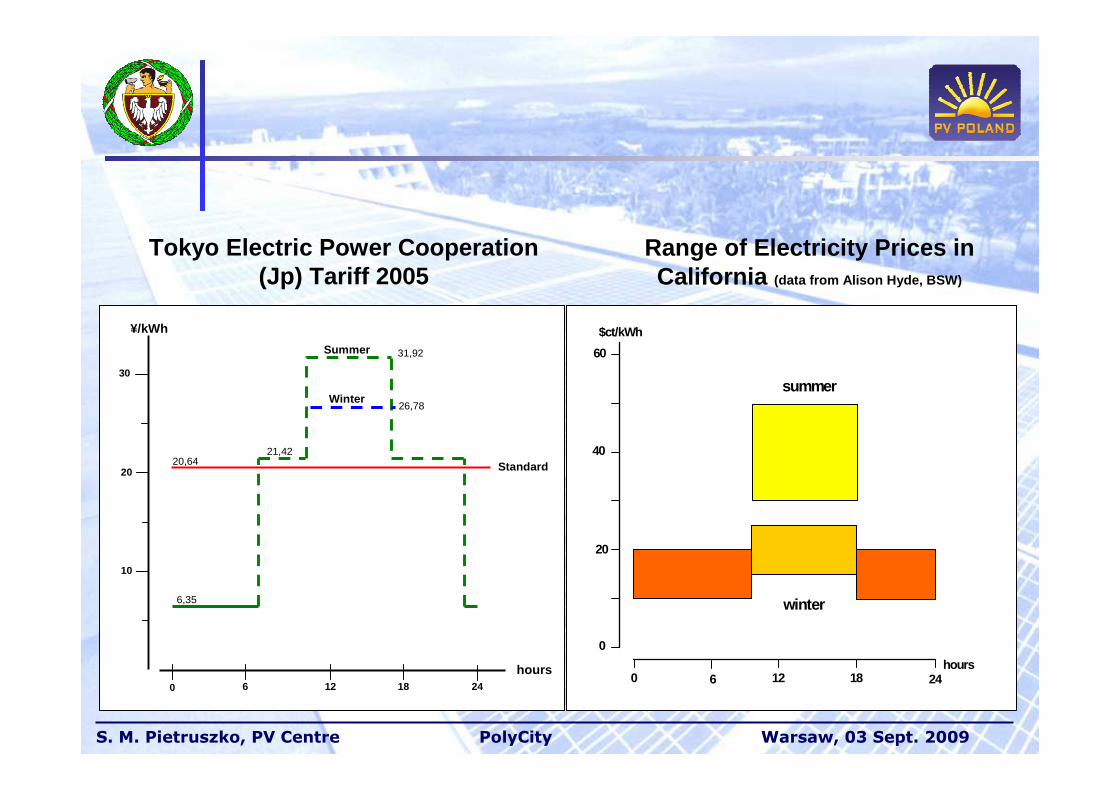
Summer
Winter
Standard20,64
6,35
26,78
21,42
31,92
30
10
20
¥/kWh
hours1260 2418
Tokyo Electric Power Cooperation (Jp) Tariff 2005
winter
summer
$ct/kWh
hours
60
20
0
40
0 6 12 18 24
Range of Electricity Prices in California (data from Alison Hyde, BSW)
S. M. Pietruszko, PV Centre PolyCity Warsaw, 03 Sept. 2009
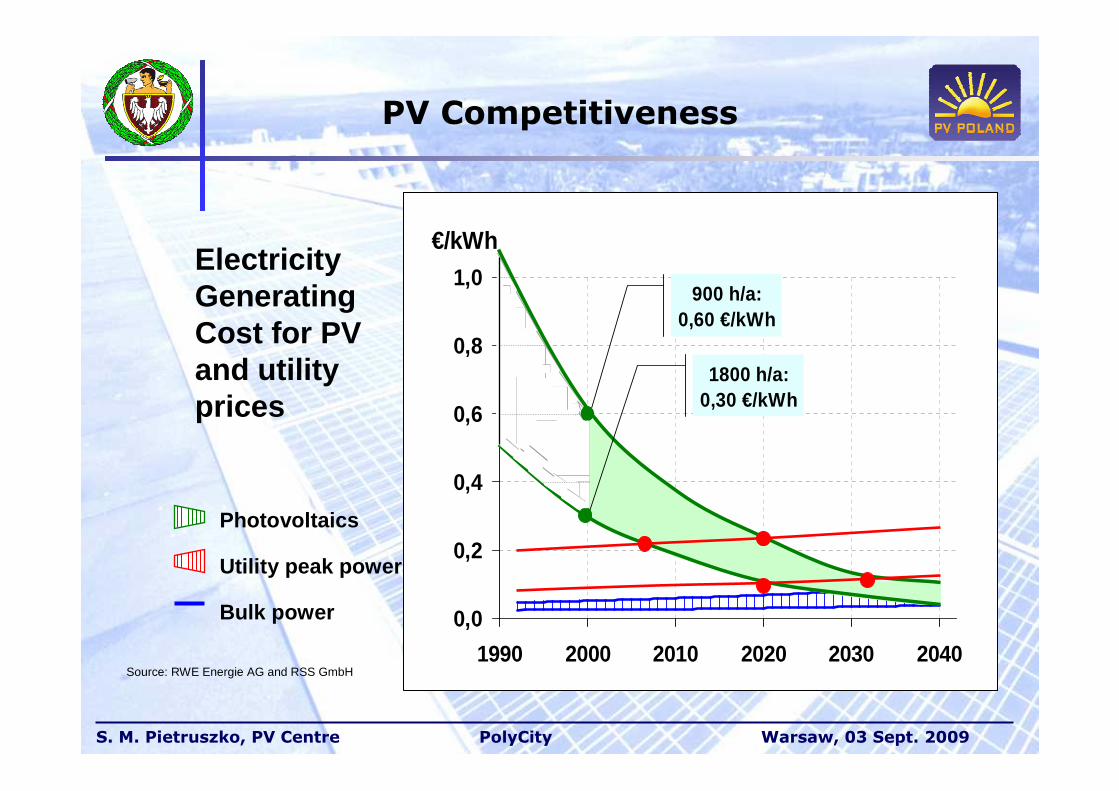
PV Competitiveness
Source: RWE Energie AG and RSS GmbH
Photovoltaics
Utility peak power
Bulk power
ElectricityGeneratingCost for PVand utilityprices
0,0
0,2
0,4
0,6
0,8
1,0
1990 2000 2010 2020 2030 2040
€/kWh
900 h/a: 0,60 €/kWh
1800 h/a: 0,30 €/kWh
S. M. Pietruszko, PV Centre PolyCity Warsaw, 03 Sept. 2009
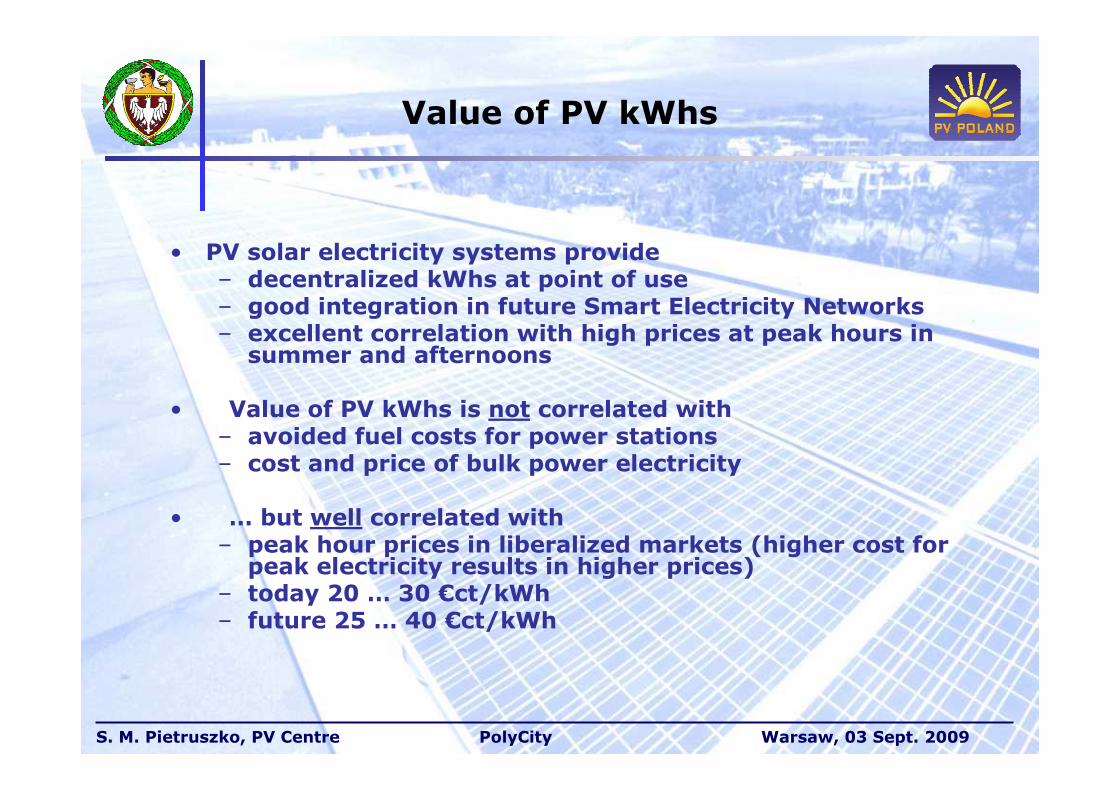
Value of PV kWhs
• PV solar electricity systems provide– decentralized kWhs at point of use– good integration in future Smart Electricity Networks– excellent correlation with high prices at peak hours in
summer and afternoons
• Value of PV kWhs is not correlated with– avoided fuel costs for power stations– cost and price of bulk power electricity
• … but well correlated with – peak hour prices in liberalized markets (higher cost for
peak electricity results in higher prices)– today 20 … 30 €ct/kWh– future 25 … 40 €ct/kWh
S. M. Pietruszko, PV Centre PolyCity Warsaw, 03 Sept. 2009
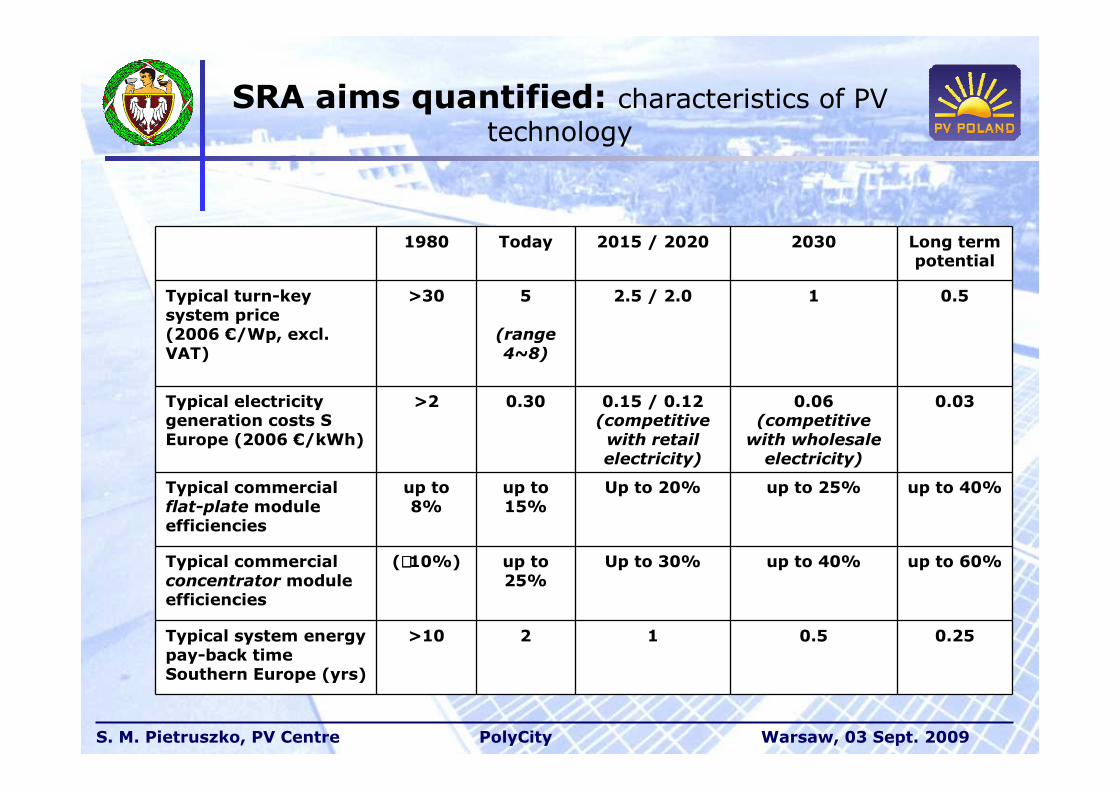
SRA aims quantified: characteristics of PV technology
1980 Today 2015 / 2020 2030 Long term potential
Typical turn-key system price(2006 €/Wp, excl. VAT)
>30 5
(range 4~8)
2.5 / 2.0 1 0.5
Typical electricity generation costs S Europe (2006 €/kWh)
>2 0.30 0.15 / 0.12(competitive with retail electricity)
0.06(competitive with wholesale electricity)
0.03
Typical commercial flat-plate module efficiencies
up to 8%
up to 15%
Up to 20% up to 25% up to 40%
Typical commercial concentrator module efficiencies
(∼∼∼∼10%) up to 25%
Up to 30% up to 40% up to 60%
Typical system energy pay-back time Southern Europe (yrs)
>10 2 1 0.5 0.25
S. M. Pietruszko, PV Centre PolyCity Warsaw, 03 Sept. 2009
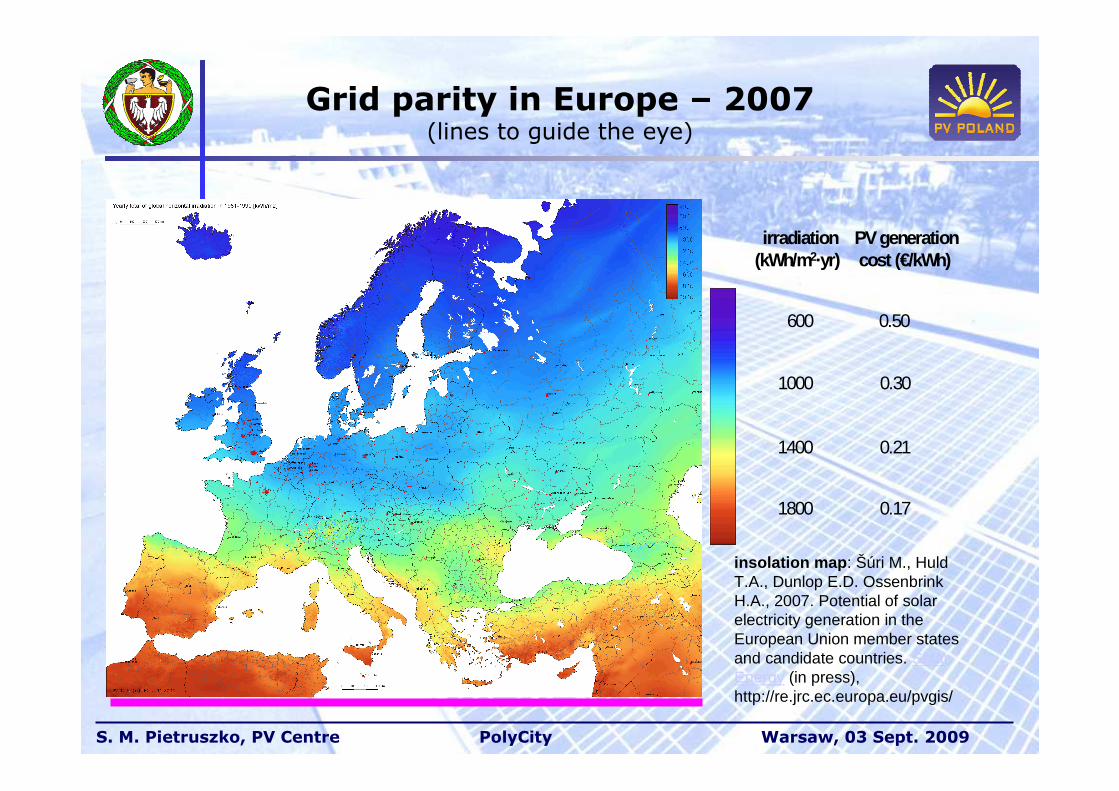
Grid parity in Europe – 2007(lines to guide the eye)
insolation map : Šúri M., Huld T.A., Dunlop E.D. Ossenbrink H.A., 2007. Potential of solar electricity generation in the European Union member states and candidate countries. Solar Energy (in press), http://re.jrc.ec.europa.eu/pvgis/
irradiation PV generation(kWh/m2·yr) cost (€/kWh)
600 0.50
1000 0.30
1400 0.21
1800 0.17
S. M. Pietruszko, PV Centre PolyCity Warsaw, 03 Sept. 2009
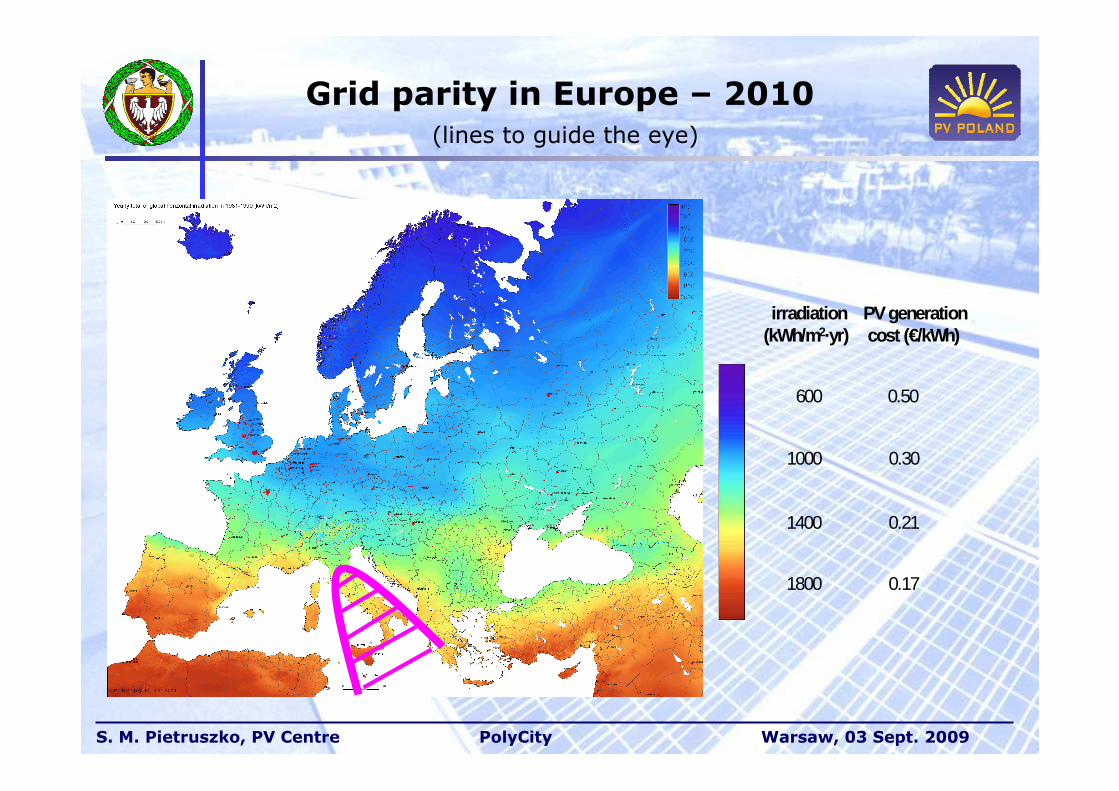
irradiation PV generation(kWh/m2·yr) cost (€/kWh)
600 0.50
1000 0.30
1400 0.21
1800 0.17
Grid parity in Europe – 2010(lines to guide the eye)
S. M. Pietruszko, PV Centre PolyCity Warsaw, 03 Sept. 2009
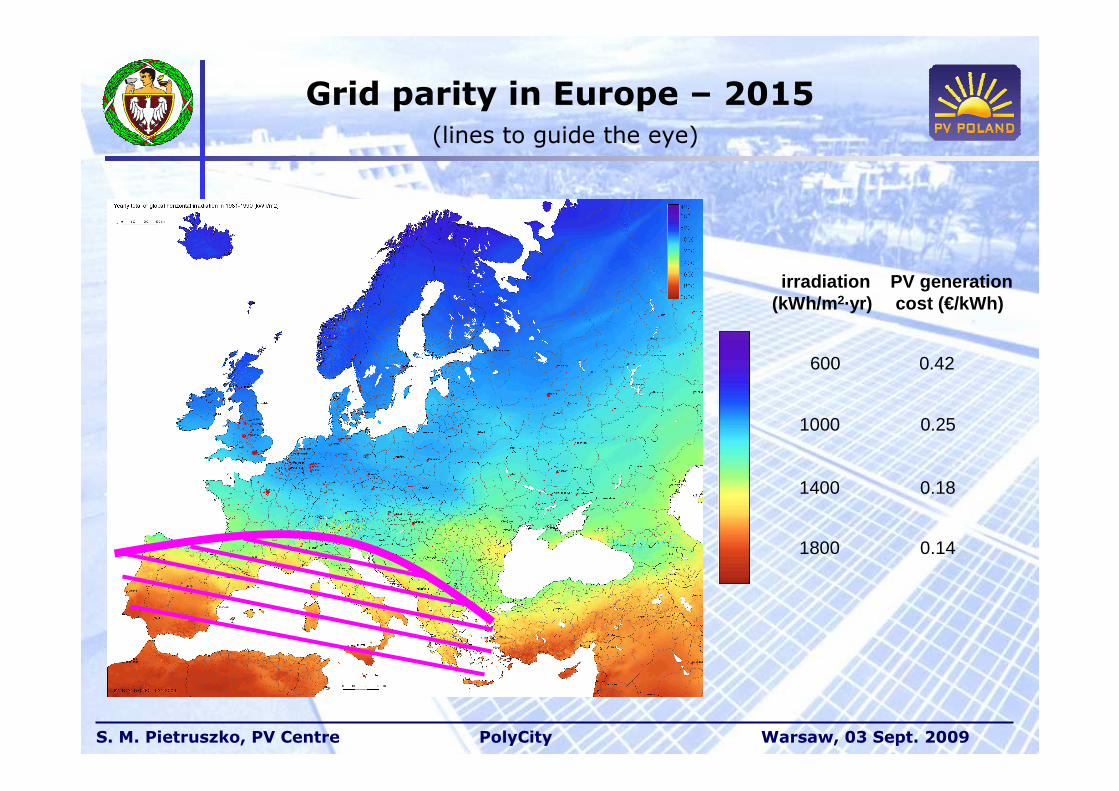
irradiation PV generation(kWh/m 2·yr) cost (€/kWh)
600 0.42
1000 0.25
1400 0.18
1800 0.14
Grid parity in Europe – 2015(lines to guide the eye)
S. M. Pietruszko, PV Centre PolyCity Warsaw, 03 Sept. 2009
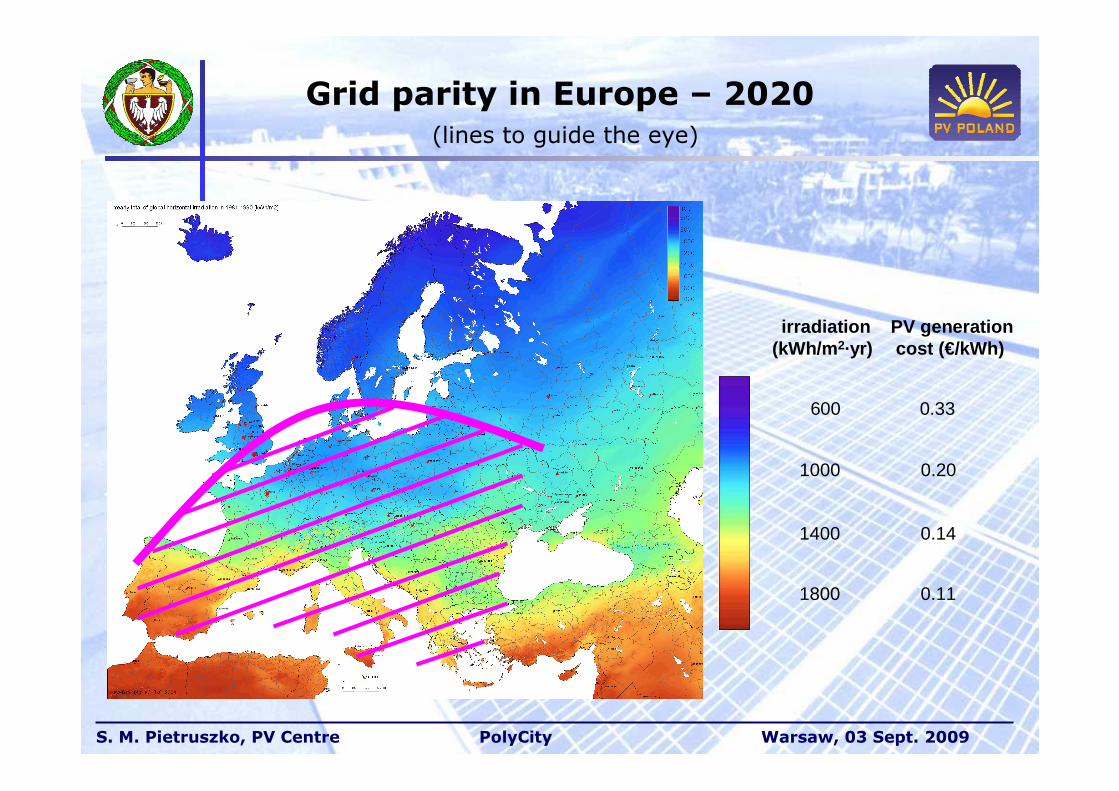
irradiation PV generation(kWh/m 2·yr) cost (€/kWh)
600 0.33
1000 0.20
1400 0.14
1800 0.11
Grid parity in Europe – 2020(lines to guide the eye)
S. M. Pietruszko, PV Centre PolyCity Warsaw, 03 Sept. 2009
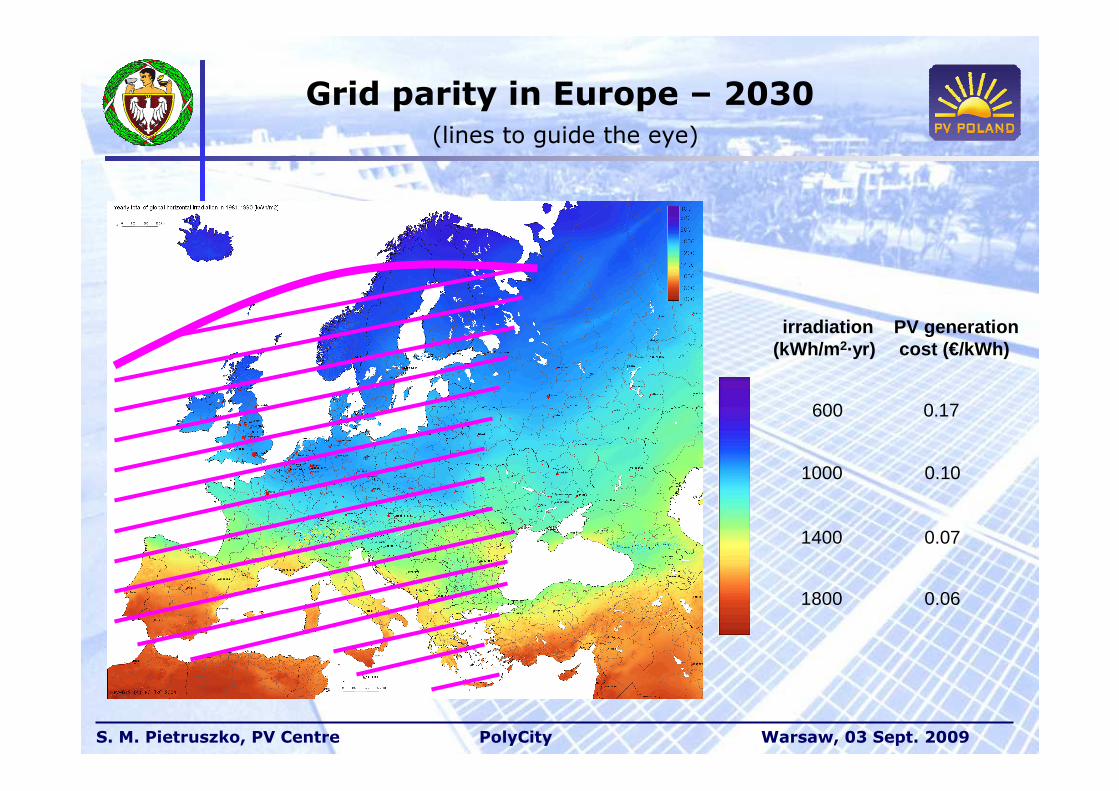
irradiation PV generation(kWh/m 2·yr) cost (€/kWh)
600 0.17
1000 0.10
1400 0.07
1800 0.06
Grid parity in Europe – 2030(lines to guide the eye)
S. M. Pietruszko, PV Centre PolyCity Warsaw, 03 Sept. 2009
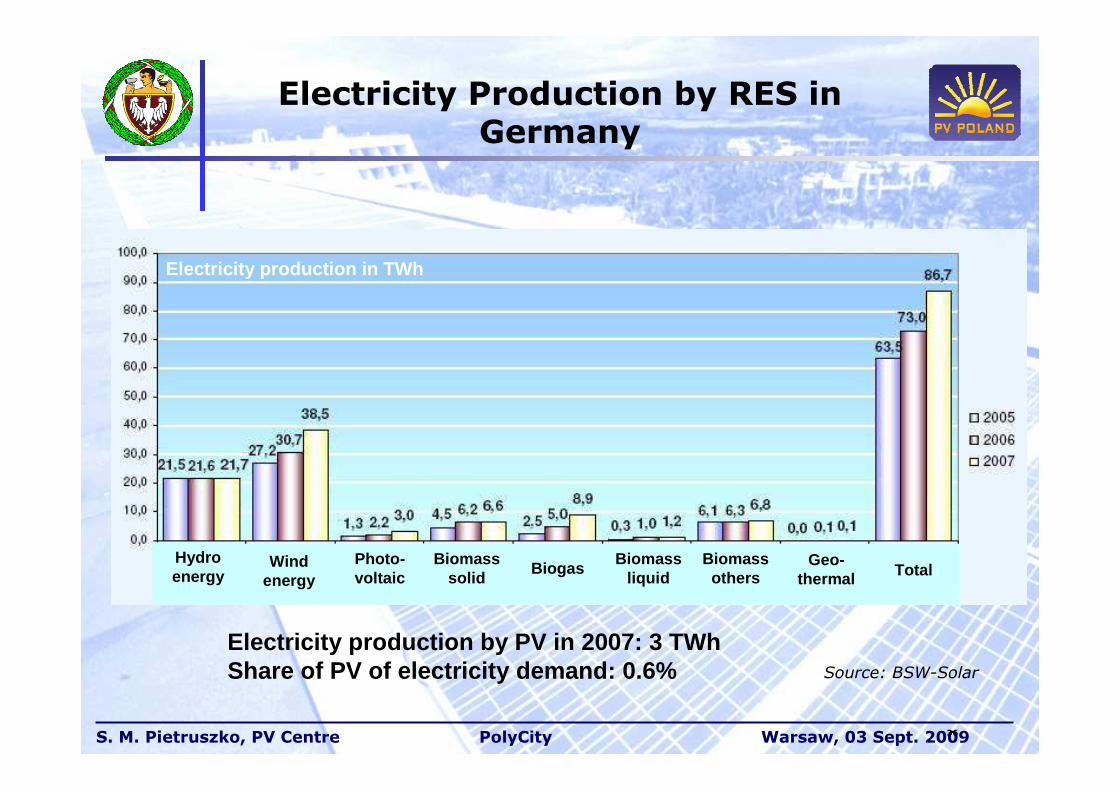
Electricity Production by RES in Germany
© BSW-Solar 2008
36
Electricity production in TWh
Wind energy
Hydro energy
Photo-voltaic
Biomasssolid
BiogasBiomass
liquidBiomass
othersGeo-
thermal Total
Electricity production by PV in 2007: 3 TWhShare of PV of electricity demand: 0.6% Source: BSW-Solar
S. M. Pietruszko, PV Centre PolyCity Warsaw, 03 Sept. 2009
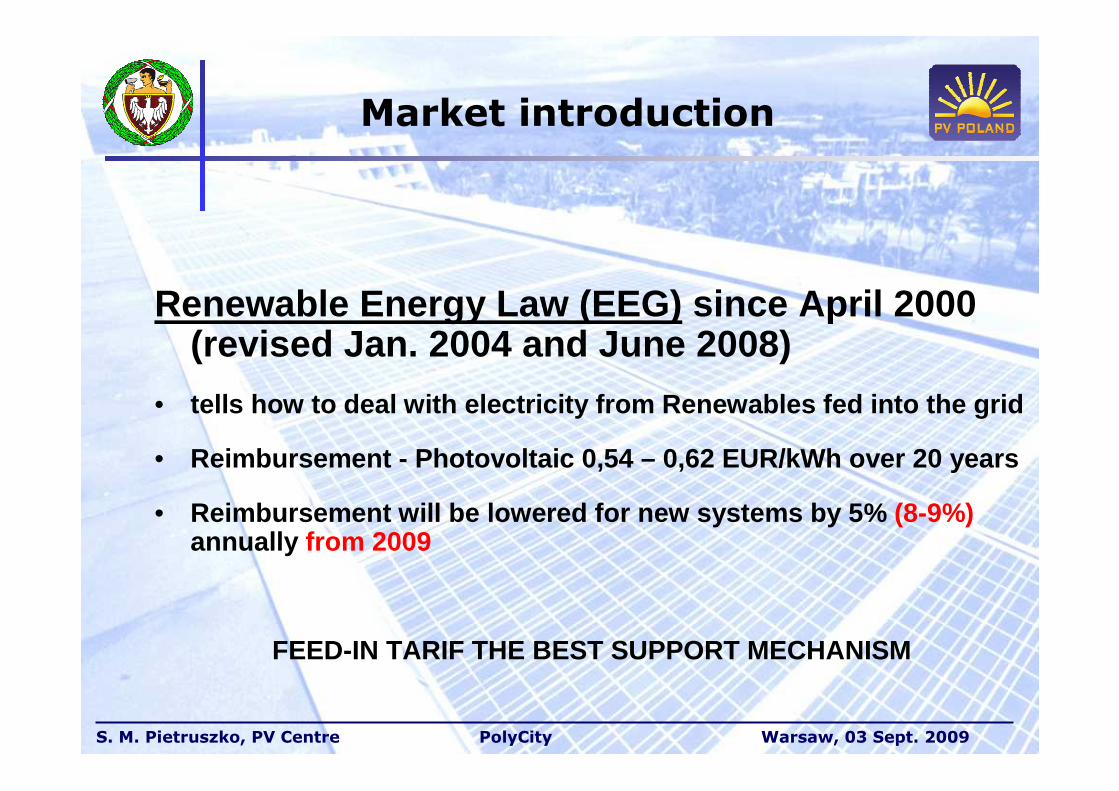
Market introduction
Renewable Energy Law (EEG) since April 2000 (revised Jan. 2004 and June 2008)
• tells how to deal with electricity from Renewables fe d into the grid
• Reimbursement - Photovoltaic 0,54 – 0,62 EUR/kWh over 2 0 years
• Reimbursement will be lowered for new systems by 5% (8-9%) annually from 2009
FEED-IN TARIF THE BEST SUPPORT MECHANISM
S. M. Pietruszko, PV Centre PolyCity Warsaw, 03 Sept. 2009
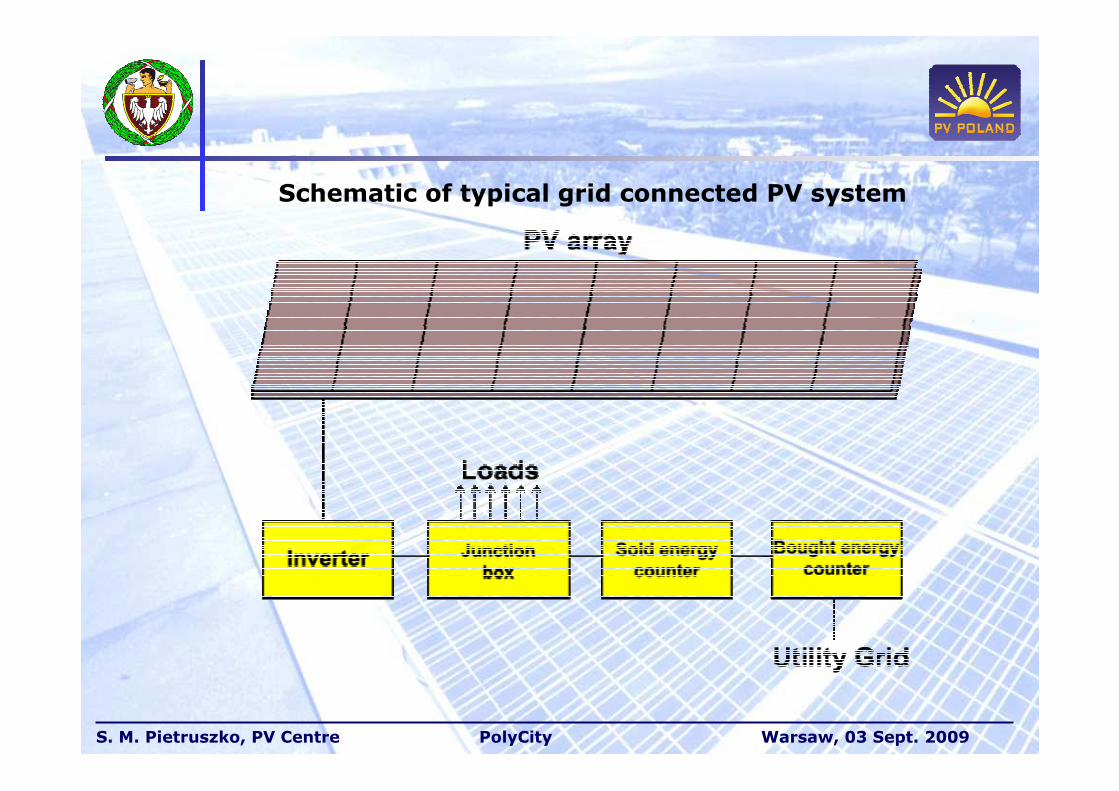
Schematic of typical grid connected PV system
S. M. Pietruszko, PV Centre PolyCity Warsaw, 03 Sept. 2009
1100
850850
600
3 3 3 3
150
807840
12101274
1991 1992 1993 1994 1995 1996 1997 1998 1999 2000 2001 2002 2003 2004 2005 2006 20070
500
1000
1500
2000
2500
3000
3500
4000
annually installed PV power in MWp total installed PV power in MWp
39
© BSW-Solar 2008
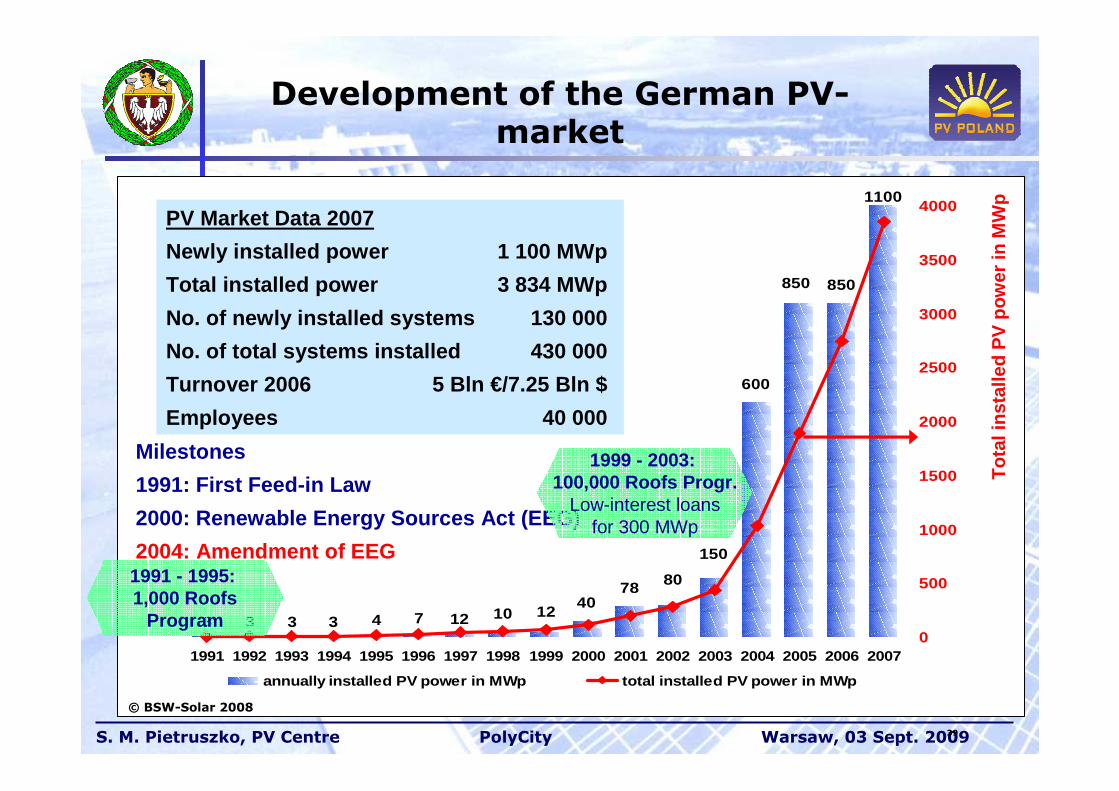
Milestones
1991: First Feed-in Law
2000: Renewable Energy Sources Act (EEG)
2004: Amendment of EEG
PV Market Data 2007
Newly installed power 1 100 MWp
Total installed power 3 834 MWp
No. of newly installed systems 130 000
No. of total systems installed 430 000
Turnover 2006 5 Bln €/7.25 Bln $
Employees 40 000
Tot
al in
stal
led
PV
pow
er in
MW
p
1991 - 1995: 1,000 Roofs
Program
1999 - 2003: 100,000 Roofs Progr.
Low-interest loansfor 300 MWp
Development of the German PV-market
S. M. Pietruszko, PV Centre PolyCity Warsaw, 03 Sept. 2009
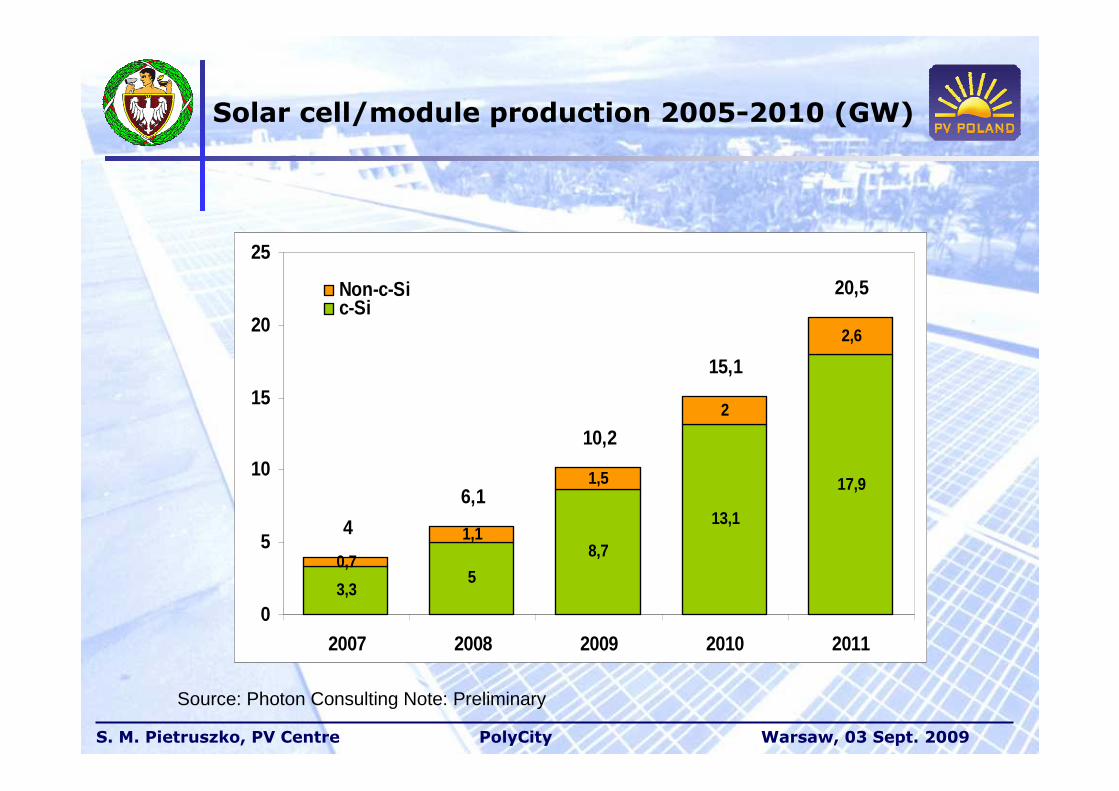
Solar cell/module production 2005-2010 (GW)
3,35
8,7
13,1
17,9
0,7
1,1
1,5
2
2,6
4
6,1
10,2
15,1
20,5
0
5
10
15
20
25
2007 2008 2009 2010 2011
Non-c-Sic-SiSerie3
Source: Photon Consulting Note: Preliminary
S. M. Pietruszko, PV Centre PolyCity Warsaw, 03 Sept. 2009
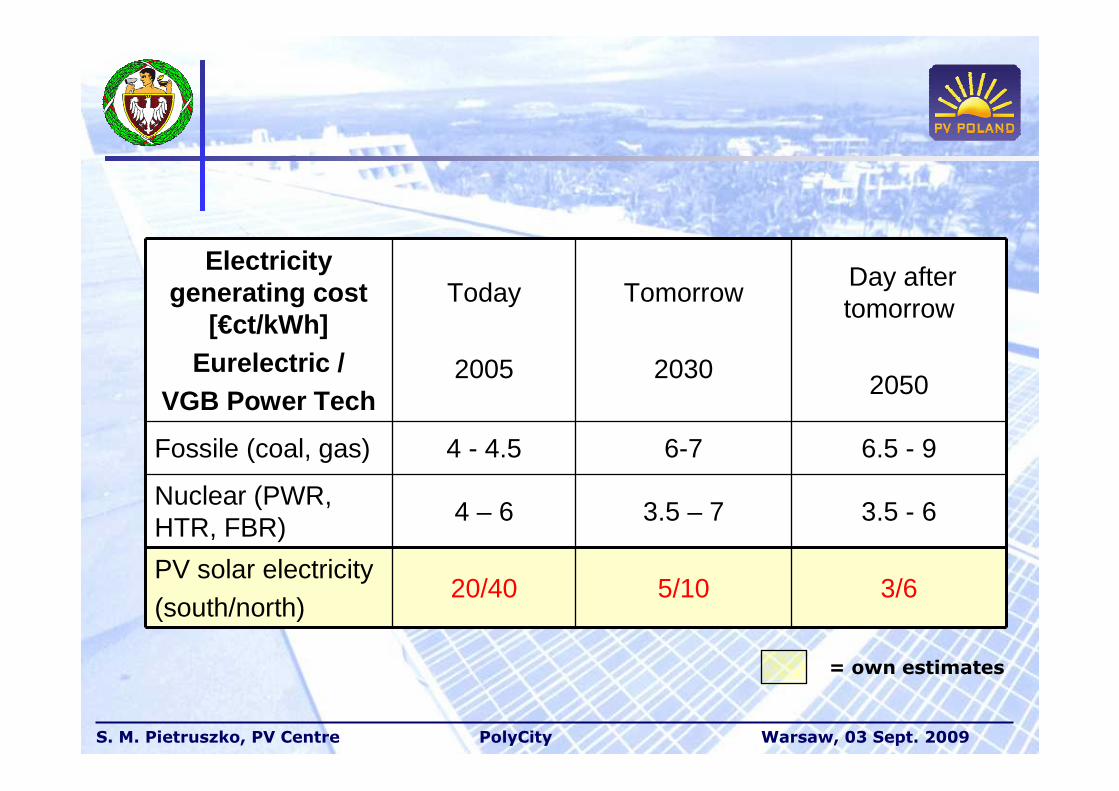
Electricity generating cost
[€ct/kWh]Eurelectric /
VGB Power Tech
Today
2005
Tomorrow
2030
Day after tomorrow
2050
Fossile (coal, gas) 4 - 4.5 6-7 6.5 - 9
Nuclear (PWR, HTR, FBR)
4 – 6 3.5 – 7 3.5 - 6
PV solar electricity(south/north)
20/40 5/10 3/6
= own estimates
S. M. Pietruszko, PV Centre PolyCity Warsaw, 03 Sept. 2009
Warsaw University of Technology
CENTRE FOR PHOTOVOLTAICS
Stanislaw M. Pietruszko
Koszykowa 75, 00-662 Warsaw, Polandtel.: +48-22-234 7782, 7530; fax: +48-22-234 7782
http://www.pv.plVersion: Polish and English
Top Related