


Languages
Pages
Legal


The Export Competitiveness of the EU Dairy Industry
Mandy Hörl1, Sebastian Hess2
12 Christian-Albrechts-University Kiel, Germany; Institute of Agricultural Economics; Dairy and
Food Industry Economics
Contribution presented at the XV EAAE Congress, “Towards Sustainable Agri-food Systems:
Balancing Between Markets and Society”
August 29th – September 1st, 2017
Parma, Italy
Copyright 2017 by [Author1] and [Author2]. All rights reserved. Readers may make verbatim copies
of this document for non-commercial purposes by any means, provided that this copyright notice
appears on all such copies.

1
The Export Competitiveness of the EU Dairy
Industry
Abstract
The European Union’s dairy industry has become increasingly export oriented and
consequently the income of EU dairy farmers depends partly on their dairy processing firms’ ability to successfully market dairy products in extra-EU markets. The export competitiveness
of the EU dairy industry was examined on the basis of various indicators in order to identify
structural determinants of export market success for a panel of EU country exports. Dynamic
GMM panel results highlight the importance of innovation and investment for export
competitiveness in world markets. The number of dairy products with protected geographical
indication per country had no statistically significant effect.
Keywords: export competitiveness, dairy trade, dynamic panel data model
1 Importance of export competitiveness for the EU milk industry
The milk sector is the largest sector in European agriculture, contributing about 14.1 % of the
total production value (in 2015). The total amount of milk produced in the European Union
(EU) was around 165 million tonnes in 2014. Furthermore, the EU is an important exporter of
milk products, especially cheese. The main exporters in this context are Germany, France, the
Netherlands, Poland, Italy and the United Kingdom (UK), which produce about 70 % of the
EU’s milk (European Commission, 2016a). Past reforms of the Common Agricultural Policy
have exposed EU producers to a lower intervention price level. The abolition of the milk quota
on 30 March 2015 has been introduced gradually through quota increases. Politically this was
possible because global dairy prices since 2007 have risen higher than EU prices and farmers
wanted to benefit from export opportunities.
However, in 2009, 2012 and 2015/16, Europe (and most other countries) experienced periods
of relatively low milk prices that were mirrored by relatively low world market prices for
processed dairy products. At the same time, aggregate milk demand has been tending to stagnate
in industrial countries, but is rising in developing and emerging countries (European
Commission, 2017).
Therefore, the aim of this study was to model the export competitiveness of EU countries in the
milk sector and identify structural factors that could be related to this. Several indices on export
competitiveness were used and evaluated for a panel of EU member countries.
This paper is organised as follows: the following section defines the concept of competitiveness
based on a literature review, section 2 introduces the indicators of export competitiveness, the
set of covariates and the modelling approach, section 3 presents the data, section 4 gives the
descriptive and estimated results of this study and finally section 5 presents the conclusions.
2 Measuring export competitiveness
Theoretical background
Generally, the term “competitiveness” has no clear definition in economic theory (Sharples,
1990; Ahearn et al., 1990). However, one constant feature across the literature seems to be that

2
competitiveness should be interpreted as a relative measure and therefore needs to be measured
in comparison to other firms, products, sectors or countries. For instance, the Organization for
Economic Cooperation and Development (OECD) defines competitiveness as the “ability of companies, industries, regions, nations and supranational regions to generate, while being and
remaining exposed to international competition, relatively high factor income and factor
employment levels on a sustainable basis” (Hatzichronoglou, 1996). In contrast, the European
Commission defines competitiveness as “a sustained rise in the standards of living of a nation or region and as low a level of involuntary unemployment as possible” (European Commission, 2009).
Conceptually, there are two ways of measuring competitiveness: the neoclassical way, which
uses indices such as comparative advantage or import and export indices to compare a nation’s competitiveness, or the approach taken in the literature on strategic management, investigating
company structure and strategy in order to compare different companies (Porter, 2014).
To portray a robust and reliable picture of EU dairy export competitiveness, five trade indicators
were considered, namely export market share (XMS), export market penetration (XMP),
residuals of constant market share (CMSResid), normalised revealed comparative advantage
(NRCA) and trade balance index (TBI). Each of these indices focuses on different aspects of
competitiveness. Multiple similarities among several measures allow significant conclusions to
be drawn.
As a result of Melitz (2003), it is now widely anticipated that only the most productive
companies engage in export activities while the least productive firms will exit the market.
Consequently, high productivity and a high level of export competitiveness should be related
and it should be possible to assess the competitiveness of the European milk sector based on
trade values, as was done here.
Drescher and Maurer (1999) studied the German dairy sector and its competitiveness in
different product categories between 1983 and 1993. They also used XMS and revealed
comparative advantage (RCA) and explored Germany’s loss in market shares in butter, cheese
and milk products over the respective period. They compared export shares in terms of value
and quality and concluded that export shares stagnated in terms of value, but also mentioned a
decrease in terms of quantity.
Carraresi and Banterle (2008) used XMS and RCA index as well to investigate the EU’s agri-
food and agricultural sector. In 2015 they used the same indices to assess the effects of the EU
accession of Central and Eastern European countries and the effects of the financial crisis in
2008. They found that Germany and the Netherlands profited most from enlargement of the
EU, France and Belgium’s competitiveness declined, and Spain and Italy were more or less
stable.
This study follows up these ideas and extends the estimation of determinants that explain the
differences in export success between EU member countries. To our knowledge this is the first
study investigating the competitiveness of the dairy sector over a period of time in all EU
countries. Furthermore, analysing sector specific determinants which influence the
competitiveness is another essential contribution of this study.
Measurement concept
Table 1 below presents the export competitiveness indices that were used in this study and
explains each of them briefly.
[Table 1]
Initially the export market power of all EU countries was considered by observing their market
shares in exports and market penetration. Export market share is calculated as follows:

3
� = ���� (2.1)
where � denotes the value of exports in 1000 USD for product group � of country and the
respectively. The value is 1 if one country is the only exporter in the world for that
product.
In contrast to XMS, export market penetration (XMP) is described by: � = ��� (2.2)
where � indicates the number of export countries to which country exports product �. is
related to the number of all countries that import product �. If, for example, 200 countries in the
world import milk products and Germany exports to 100 of them, then Germany’s � = .5.
The trade balance index (TBI) is the next index that was computed: � = ��− ����+ �� (2.3)
where � denotes the TBI of country for product �. � and indicate exports from and
imports into country of product �. The range of this index is [-1; +1], where values <0 indicate
net importers of the respective product (Lafay, 1992). If the value is >0 the country exports
more than it imports. It should be noted that not only growing exports, but also shrinking
imports increase the TBI.
Furthermore the normalised revealed comparative advantage (NRCA) index was calculated for
each country (Yu et al., 2009). Since it is normalised, it is a preferred measure of
competitiveness across countries and time periods. The NRCA is computed as follows: = ���� − �∗ ��� �� (2.4)
where indicates the normalized revealed comparative advantage of country for
product �. However � denotes all exports of country of all product groups and � stands for
all world exports of product �. � � contains all exports of agricultural products in the world.
This index has a range from [-1/4; +1/4]. Values <0 (>0) indicate a comparative disadvantage
(advantage) for the respective product (Yu et al., 2009). Intuitively, the index expresses a
country’s observed export specialisation for a certain product category relative to the export
specialisation for that product, as would be expected given the country’s overall trade volume and specialisation in other industries. For instance, an index value of zero implies that the
country would export just as much of a product as would be expected given i) the country’s share of total world trade, and ii) for all countries together the share of that the specific product
category’s total world exports. Thus an NRCA of 0 represents for any country or sector the
comparative neutral point of no relative specialisation.
This study distinguished between worldwide and extra-EU comparative advantages. Therefore,
the NRCA indices were calculated in two ways: first trade with all countries in the world, intra
and extra-EU countries (NRCAworld) was included, whereas the second index included only
the trade of the respective EU member with non-EU members (NRCAexclEU). This made it
possible to compare overall competitiveness (with EU trade) and extra-EU competitiveness in
the dairy sector. If, for example, a country has a comparative advantage for dairy products in
terms of NRCAworld, but a comparative disadvantage (or lower values) in terms of
NRCAexclEU, it can be concluded that this country is more specialised in exporting to EU
members than in exporting to non-EU members.

4
An alternative and well-established concept for measuring export competitiveness is the
concept of constant market shares (CMS). The so-called CMS residual measures how much a
country’s exports have grown during a year and for a certain product compared to world exports
of this product. The CMS was derived according to Leamer and Stern (1970):
, + = − = �,�+1��,�� − �,�+1�
�,�� (2.5)
The residuals of the CMS analysis ( ) are given by the difference between export
growth rates, , for a country’s exports ( ) and world exports ( � for product �, where denotes the respective country and stands for the world. For example, if exports of global
dairy products grew by 2 % from 2015 to 2016 and a country’s growth rate was 3 % in the same
period, this country would have a computed CMS residual of +1 %. This can be interpreted as
the net competitive advantage after taking changes in the global import demand for dairy
products into account.
Econometric estimation strategy
Referring to Blundell and Bond (1998), a dynamic panel data (DPD) model was used which
has been developed for datasets with many panels but few time periods. The underlying
assumption is that there is no autocorrelation in idiosyncratic errors. Furthermore, it is assumed
that panel-level effects are uncorrelated with the first difference of the first observation of the
dependent variable. To estimate and evaluate the estimators, an AR(1) model was used with
fixed effect decomposition of the error term to control for individual-specific effects. The
estimation results generally refer to the one-step estimator with robust standard errors because
convergence on the computation of Windmeijer (2005) was not achieved with robust standard
errors for the two-step estimator. The overall form of the model was as follows: = , − + ′ , + ′ , − + (2.6)
For � = 1, 2, … , N and = 2, 3, … , T, N is large, T is fixed and | | < , while ≡ � + �
describes the decomposition of the error term. The individual effects � are treated
stochastically. Therefore, these effects are necessarily correlated with the lagged dependent
variable , − . Furthermore, the disturbances � are assumed to be serially uncorrelated. Due
to the correlation of the ’s the ordinary least square (OLS) estimator of α would be
inconsistent. Since the lag of is an explanatory variable, it is endogenous and therefore
correlated with the error term. This correlation does not disappear if the number of observations
increases (Bond, 2002). To remedy this, the model was first-differenced to get rid of � .
Afterwards , − was used as an instrument for ∆ , − = , − − , − . These instruments
were not correlated with ∆� , as long as � is not serially correlated itself (Baltagi, 2013).
Further explanatory variables were also potentially endogenous and were treated as such within
the estimations. However, due to the absence of suitable external instruments, the GMM
instrumentation strategy proposed by Blundell and Bond (1998) was extended to include these
variables as well. Only the explanatory variables on EU/euro membership were treated as
exogenous.
The model
Given these alternative measures for export competitiveness from above, it was of interest to
identify structural factors that can be related to the strategies of the processing firms in the
average EU country. Table 2 presents a set of such structural factors that were identified based
on the literature review of recent reports assessing individual aspects of dairy chain
performance in the European Union (Tacken et al., 2009; Jansik et al., 2014) and provides our
hypotheses we will test in the estimation:
[Table 2]
5
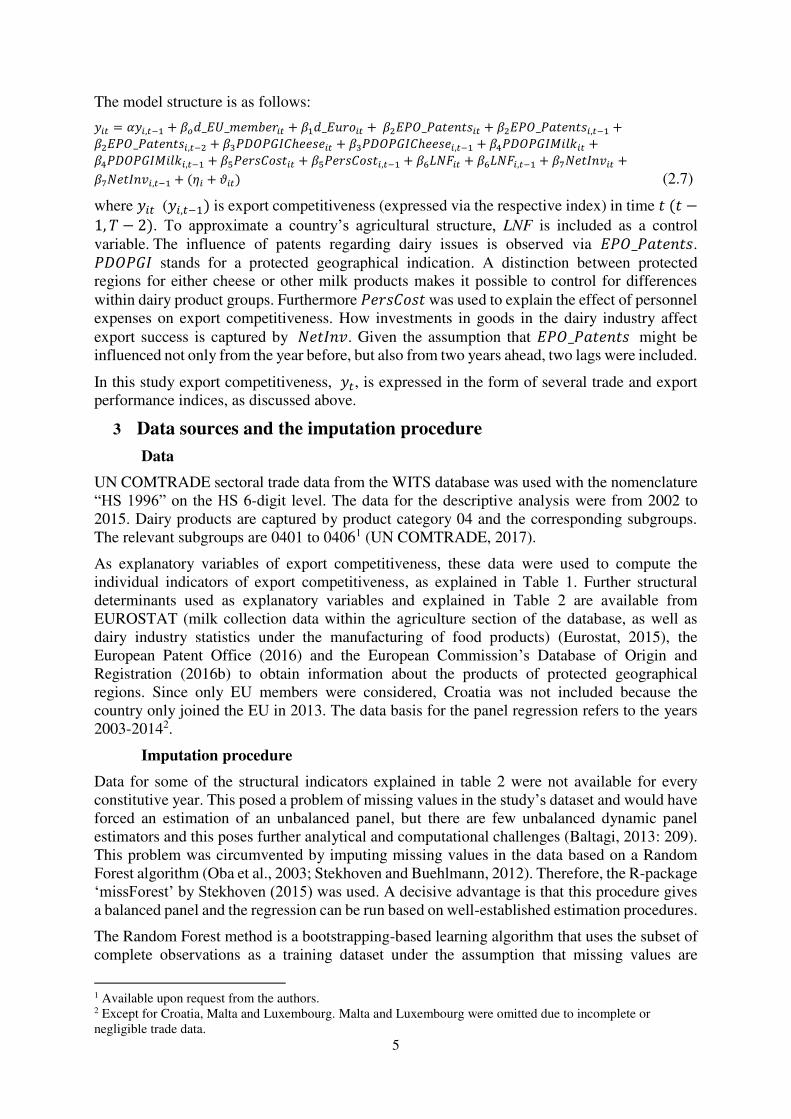
The model structure is as follows: = , − + _ _ + _ + _ + _ , − +_ , − + � ℎ + � ℎ , − + � � +� � , − + + , − + + , − + � +� , − + � + � (2.7)
where ( , − is export competitiveness (expressed via the respective index) in time −, − . To approximate a country’s agricultural structure, LNF is included as a control
variable. The influence of patents regarding dairy issues is observed via _ . � stands for a protected geographical indication. A distinction between protected
regions for either cheese or other milk products makes it possible to control for differences
within dairy product groups. Furthermore was used to explain the effect of personnel
expenses on export competitiveness. How investments in goods in the dairy industry affect
export success is captured by � . Given the assumption that _ might be
influenced not only from the year before, but also from two years ahead, two lags were included.
In this study export competitiveness, , is expressed in the form of several trade and export
performance indices, as discussed above.
3 Data sources and the imputation procedure
Data
UN COMTRADE sectoral trade data from the WITS database was used with the nomenclature
“HS 1996” on the HS 6-digit level. The data for the descriptive analysis were from 2002 to
2015. Dairy products are captured by product category 04 and the corresponding subgroups.
The relevant subgroups are 0401 to 04061 (UN COMTRADE, 2017).
As explanatory variables of export competitiveness, these data were used to compute the
individual indicators of export competitiveness, as explained in Table 1. Further structural
determinants used as explanatory variables and explained in Table 2 are available from
EUROSTAT (milk collection data within the agriculture section of the database, as well as
dairy industry statistics under the manufacturing of food products) (Eurostat, 2015), the
European Patent Office (2016) and the European Commission’s Database of Origin and
Registration (2016b) to obtain information about the products of protected geographical
regions. Since only EU members were considered, Croatia was not included because the
country only joined the EU in 2013. The data basis for the panel regression refers to the years
2003-20142.
Imputation procedure
Data for some of the structural indicators explained in table 2 were not available for every
constitutive year. This posed a problem of missing values in the study’s dataset and would have
forced an estimation of an unbalanced panel, but there are few unbalanced dynamic panel
estimators and this poses further analytical and computational challenges (Baltagi, 2013: 209).
This problem was circumvented by imputing missing values in the data based on a Random
Forest algorithm (Oba et al., 2003; Stekhoven and Buehlmann, 2012). Therefore, the R-package
‘missForest’ by Stekhoven (2015) was used. A decisive advantage is that this procedure gives
a balanced panel and the regression can be run based on well-established estimation procedures.
The Random Forest method is a bootstrapping-based learning algorithm that uses the subset of
complete observations as a training dataset under the assumption that missing values are
1 Available upon request from the authors. 2 Except for Croatia, Malta and Luxembourg. Malta and Luxembourg were omitted due to incomplete or
negligible trade data.

6
missing at random. The imputation procedure trains the learning algorithm by randomly
excluding values from the existing data and trying to predict them until no further improvement
in production quality can be attained. In the case of this study’s dataset, a classification error of
29 % was achieved. This means that roughly one in every four imputed values might be
predicted inaccurately.
However, all the structural indicators in Table 2 referred to variables that are subject to long-
term trends and are unlikely to exhibit high volatility for the unobserved years. Therefore
changes between the observed periods were assumed to be consistent with long-term trends,
such as net investments, the number of dairy farms or personnel costs.
4 Results
Descriptive results
Table 3 presents an overview of all the export competitiveness indicators computed for each
EU country in the dairy sector. Values are sorted according to the average export trade values
in the milk sector. As can be seen, Germany has the highest export values of dairy products,
followed by France and the Netherlands. Most individual countries in the EU do not show
significant global export market shares (XMS) in the milk sector at all. Significant values were
only observed for the Netherlands, France and Germany observed (more than 10 % each). Most
of these exports are intra-EU exports, which is why Germany performs worse if NRCAworld
with NRCAexclEU are compared.
The highest export market penetration (XMP) was achieved by France, the Netherlands and
Germany. These countries are engaged with most other countries in the trade of milk products.
This shows that dairy exports of the EU countries are shipped to more and more trading partners
all over the world. One exception to this is Bulgaria, which has reduced its number of trading
partners since 2009. Estonia, Romania and Slovenia come last on average. This finding is in
line with the slight downwards trend in XMS for the major export nations3 of the Netherlands,
France and Germany. If more countries engage in trade, there is less market share available for
each of them. The TBI should be higher for countries which are more engaged in international
trade or for countries which have a low home consumption. The highest TBI values were for
Poland, Estonia and Finland, whereas Germany came ninth. Showing that even if Germany is
an export oriented country, due to high own consumption they do not appear on the top of this
rank.
Looking at CMSResid, a completely different picture emerges. Latvia, Romania and Poland were
the top three. This finding implies that these countries had the highest growth on average rates
in the dairy export sector in 2002-2015 (only in the panel after EU accession). This shows a
picture of more of a competitive edge being achieved after EU accession. Furthermore, it is not
surprising that typical dairy exporting countries such as France, Germany, Denmark or the
Netherlands appear to have very low or even negative CMSResid values since they operate
already at the competitive edge of the EU dairy sector.
[Table 3]
[Figure 1]
Figure 1 includes all the indices from table 3 and re-expresses them as ranks in order to facilitate
a comparison of the different indices. The index ranks displayed on the vertical axis of figure
1 are calculated as follows:
3 Not shown in the tables due to space restrictions, but can be obtained upon request from the authors

7
≤ ≤ ⋯ ≤ ⇔ = � ≤ = � ≤ ⋯ ≤ = � | = . (4.1)
While denotes the real index value of index in country , � denotes the rank of the
respective index among all EU countries when sorted from low to high. For example Germany
has the largest share of total exports and therefore comes 25th since there are 25 countries in the
sample (n=25).
The sum of rank numbers were calculated as follows:
, = ∑ �, + ��� , + ��� , + �, + , (4.2)
For both formulas denotes the particular country. The black line refers to the secondary axis
and displays the average trade values for milk products in 1000 USD for each country. This
allowed a comparison of the measures of export competitiveness with the actual trade values.
According to Figure 1, France, Germany and the Netherlands are ranked one to three, even if
they do not have the highest values in trade. Germany trades most. It might be assumed that
Germany would therefore be the most competitive country, however according to these indices
it is only ranked third.
Relatively high values were also found for CMSResid in Eastern European countries (such as
Poland, Latvia and Romania). Countries that are known as common milk countries, such as
France and Denmark, are at the bottom of this list, with Germany ranked 16th (9th best).
Panel regression results
The model in equation (2.7) was estimated for both aggregate dairy product exports and
individual categories. For this purpose, the indices were also computed for all subgroups and
the corresponding models estimated in order to assess the overall robustness of the results.
Table 4 presents selected results from the dynamic panel data model for the most relevant and
meaningful subgroups.
[Table 4]
The results in table 4 reveal significant lags of the dependent variable throughout. This indicates
strong dynamics in export competitiveness, implying that if the dairy industry in a country
performed well in exporting in the previous period, it was more likely than not to do well in
present and future periods. This variable captures the unobserved effects from export contacts
and the specific skills accumulated within the exporting firms. Export competitiveness would
appear not to be something that can be bought or switched on or off on demand. It requires
continuous effort and the build-up of competencies that are otherwise not captured by these
explanatory variables. This finding, however, was not confirmed for most specifications of the
CMSResid. Apparently, this competitiveness indicator about short-term gains in exports does not
depend as crucially on similar factors as the other indicators do. In general, this set of
explanatory variables exhibited only poor explanatory power on the CMS residuals. It was
concluded that CMS-type relative competitiveness for dairy product exports from EU countries
overall is not related to any of the structural factors that were included in this study’s model.
The estimations were made with robust standard errors and were further tested for first-order
and second-order autocorrelation. Not rejecting the null-hypothesis of first-order auto-
correlated parameters does not violate the maintained statistical assumptions and is therefore
not a sign of an invalid model (Baltagi, 2013: 159). Most important in this regard were the
results for second-order autocorrelation. In general, p-values were found to be in line with the
assumptions implied by this dynamic GMM estimator, which means that the null-hypothesis
can be rejected and it can be concluded that there is no second-order autocorrelation in the
model specifications, while the first-order autocorrelation should be expected and can be
tolerated.

8
To assess the hypotheses from table 2, hypotheses (3), (6) and (7) were confirmed, hypotheses
(2), (4) and (5) were not confirmed and hypothesis (1) was rejected. Hypothesis (3) related to
the influence of dairy patents on export success. Positive significant relationships of patents
were found on XMS, TBI and NRCAexclEU. In contrast to this study’s hypothesis that patents
affect export success earlies after a lag of one or two years, it was found that they actually
already influence export competitiveness in the year of application. This indicates that the
patent itself may not stimulate exports, but that countries of innovative dairy industries are more
export competitive. It was therefore concluded that the role of patents should perhaps be viewed
rather as a proxy for innovativeness than as a direct determinant of export performance. New
and more innovative products can be assumed be more export competitive than established
products. Furthermore, process-related innovations may save costs and can stimulate exports
immediately. Hypothesis (6) concerned average net investments per milk processor and here it
was found that investments influence export success with a lag of one year, which is in line
with the hypothesis. Hypothesis (7) was also confirmed: high personnel costs in a country’s
dairy sector negatively influence the competitiveness of its dairy exports, and this effect occurs
mostly in the same time period rather than in the lagged variables, which is an indication of the
direct cost effects on exports.
Regarding hypotheses (2), (4) and (5) it was concluded that there is neither a positive nor a
negative significant influence on export competitiveness for countries that have the euro as their
currency. Furthermore, estimated coefficients for the number of products with a protected
geographical status in an EU country appear to be insignificant overall and therefore on
aggregate do not seem to have a beneficial effect on the country’s dairy export performance. Finally, the hypothesis that becoming an EU member would positively affect dairy export
competitiveness has been rejected, with the caveat that significant coefficients were only found
for the TBI of product group 0401, while others turned out to be insignificant. This implies that
becoming an EU member reduces the TBI significantly in the case of fresh milk products, which
is plausible because this indicator measures the ratio between exports and imports. Clearly, EU
membership will increase consumers’ access to fresh dairy product varieties, which may
produce welfare gains even though the trade balance declines. However this may not affect
exports in the same way.
5 Conclusions and discussion
The ability of European dairy processors to export competitively has become increasingly
important in the last few years and is expected to continue to be an important source of revenue
for EU dairy farmers as well. Following the standard paradigm in the new-new trade theory
(Melitz, 2003), according to which only the most productive companies would engage in export
activities, a dynamic panel of dairy product export performance of EU countries was estimated
in order to test how selected structural indicators from each country’s dairy industry may relate
to export competitiveness. The ranking of competitiveness measures found that competitiveness
was not necessarily proportional to the total dairy trade volume of any specific EU country.
Germany was found to have the highest export values of all EU member states, but overall did
not show the highest relative export performance in terms of the competitiveness indices.
Considering Germany’s large share of cooperative dairy processors, which are estimated to take in between 60 % and 70 % of Germany’s raw milk production, in the near future export
competitiveness may become the subject of internal discussions about the efficiency of dairy
cooperative governance. The results highlighted the strong significance of net investments by
dairy companies and the role of patents as an approximation for innovativeness. In contrast, the
role of protected geographical origins was less important overall for global export performance.
9
This could be due to the method of simply counting the number of regions per country, but it
could also reveal that these products tend to be bound more for the domestic EU market.
Policymakers and upcoming reforms of the common agricultural policy should therefore focus
on promoting an innovative environment for the dairy sector, in which private firms and public
research work hand in hand on innovations that will lead to product or process improvements
in European dairy value chains. In turn, based on the results of the present study, dairy
processing firms in cooperatives will have to see the efficient deployment of personnel as an
effective measure for reducing costs and improving export competitiveness.
6 References
Ahearn, M., Culver, D. and Schoney, R. (1990). Usefulness and limitations of COP estimates for
evaluating international competitiveness: a comparison of Canadian and U.S. wheat. American
Journal of Agricultural Economics, 72 (5): 1283-1291.
Baltagi, B. H. (2013). Econometric analysis of panel data. John Wiley & Sons, UK: Chichester.
Blundell, R. and Bond S. (1998). Initial conditions and moment restrictions in dynamic panel data
models. Journal of Econometrics, 87: 115-143.
Bond, R. (2002). Dynamic panel data models: A guide to micro data methods and practice. Working
Paper No. CWP09/02, Leibnitz Information Centre for Economics.
Carraresi, L. and Banterle, A. (2008). Measuring competitiveness in the EU market: a comparison
between food industry and agriculture. Proceedings of the 12th EAAE Congress.
Drescher, K. and Maurer, O. (1999). Competitiveness in the European dairy industries. Agribusiness:
15 (2): 163-177.
European Commission (2009). European Competitiveness Report 2008. European Commission,
Brussels.
European Commission (accessed 16.12.2016a). Milk and milk products.
https://ec.europa.eu/agriculture/milk_de
European Commission (accessed 19.05.2016b). Database of Origin and Registration (DOOR).
1946486245?recordSelection=all&recordStart=0&filter.dossierNumber=&filter.comboName=&filt
erMin.milestone__mask=&filterMin.milestone=&filterMax.milestone__mask=&filterMax.milesto
ne=&filter.country=PT&filter.category=PDOPGI_CLASS_13&filter.type=&filter.status=
European Commission (2017). EU Milk Market Observatory. https://ec.europa.eu/agriculture/market-
observatory/milk_en
European Patent Office (downloaded on 04.04.2016). Dairy patents in the EU.
https://worldwide.espacenet.com/searchResults?search=dairy%20&DB=EPODOC&submitted=tru
e&locale=en_EP&ST=singleline&compact=false&DB=EPODOC&query=dairy%20
Eurostat (downloaded on 17.05.2015). Statistisches Amt der Europäischen Union. Luxemburg,
http://ec.europa.eu/eurostat/de/data/database
Hatzichronoglou, T. (1996). Globalization and Competitiveness: Relevant Indicators. OECD Science,
Technology and Industry Working Papers, No. 1996/05, OECD Publishing, Paris.
Jansik, C., Irz, X. and Kuosmanen, N. (2014). Competitiveness of Northern European dairy chains.
MTT Agrifood Research Finland, Agrifood Research Finland, Publication No. 116.
Lafay, G. (1992). The measurement of revealed comparative advantages. In: Dagenais, M. G. & Muet,
P.-A. (eds.) International Trade Modelling. London: Chapman & Hall, 209-234.
Leamer, E. E. and Stern, R. M. (1970). Quantitative International Economics. Aldine Publishing Co.,
USA: Chicago.

10
Melitz, M. (2003). The Impact of Trade on intra-industry Reallocations and Aggregate Industry
Productivity. Econometrica, 71(6): 1695-1725.
Oba, S., Sato, M. A., Takemasa, I., Monden, M., Matsubara, K. I. and Ishii, S. (2003). A Bayesian
missing value estimation method for gene expression profile data; Bioinformatics; 19 (16): 2088-
2096.
Porter, M. E. (2014): Wettbewerbsvorteile: Spitzenleistungen erreichen und behaupten. Campus Verlag,
Germany: Frankfurt.
Sharples, J. (1990). Cost of production and productivity in analysing trade and competitiveness.
American Journal of Agricultural Economics, 72 (5): 1278-1282.
Stekhoven, D. J. (2015). MissForest - Nonparametric Missing Value Imputation using Random Forest.
R package version 1.4 software.
Stekhoven, D. J. and Buehlmann, P. (2012). MissForest - nonparametric Missing Value Imputation for
Mixed-type Data. Bioinformatics, 28: 112-118.
Tacken, G. M. L. Banse, M. A. H., Batowska and A., Gardebroek (2009). Competitiveness of the EU
dairy industry. LEI Wageningen UR.
Windmeijer, F. (2005). A finite sample correction for the variance of linear efficient two-step GMM
estimators. Journal of Econometrics; 126 (1): 25-51.
UN COMTRADE (accessed 10.01.2017). HS 1996 Product Description. WITS Database,
http://wits.worldbank.org/WITS/WITS/Support%20Materials/CMTNomenclatureandConcordances
List.aspx?Page=ProductNomenclatureandConcordances
Yu, R.; Cai, J. and Leung, P. (2009). The Normalized Revealed Comparative Advantage Index. The
Annals of Regional Science, 43: 267-282.
7 Tables
Table 1. Competitiveness indices and measures
Index Abbr. Formula Definition Reference
Export
market share
XMS � = �� Share of product i’s exports from country r of world export for
product i
Export
market
penetration
XMP � = �
Number of countries to which
country r exports product i divided
by all countries that import product
i
Trade
balance
index
TBI � = � − � + States whether a country is a net-
importer (TBI<0) or net-exporter
(TBI>0) of product i
Lafay
(1992)
Normalised
revealed
comparative
advantage
NRCA = �� � − � ∗ �� � ∗ � � Agricultural export share of country
r for product i minus the
comparative neutral point for the
respective product group and
country
Yu et al.
(2009)
Residuals of
constant
market share
CMSResid , += − = , +, − , +,
Growth rates of product i from
country r minus world’s growth
rate for product i; gives residual
growth rate of product i in country r
Leamer and
Stern
(1970)

11
Table 2. Dependent variables and hypotheses
Variable Description Hypothesis
(1) d_EU_me
mber
Dummy for EU membership;
0= no member, 1=member
Positive relationship regarding export
competitiveness due to decrease of transaction
costs and a common market
(2) d_Euro Dummy for member of the
Eurozone; 0= no member, 1=
member
Negative relationship regarding extra EU
export competitiveness due to a strong euro in
the observed period, but positive relationship
for intra EU exports due to lower transaction
costs which go along with a common currency
(3) EPO_Pate
nts
Number of dairy patents Positive relationship regarding export
competitiveness since the number of patents is
taken as proxy for innovation
(4) PDOPGI
Cheese
Number of cheese products
with a protected geographical
status
Positive relationship regarding export
competitiveness the more products in the
country that have this label
(5) PDOPGI
Milk
Number of milk products
(excluding butter) with a
protected geographical status
Positive relationship regarding export
competitiveness the more products in the
country that have this label
(6) NetInv Net investments in material
goods per milk processor (in €
million)
Positive relationship regarding export
competitiveness
(7) PersCost Personnel costs in production
as share of output value (%)
Negative relationship regarding export
competitiveness
Cont
-rol
LNF Agricultural area of the country Control variable for a country’s agricultural specification
Table 3. Average values of competitiveness measures (average of 2002-2015) sorted by average trade
value of dairy exports
Country AvgTradeValues in 1000 USD
Market
Share
Market
Penetration
CMS
Residuals
NRCAinkl
EU
NRCAexk
lEU
TBI
DEU 8453687 0.14 0.78 0.00 0.004583 0.000725 0.75
FRA 6509181 0.11 0.80 -0.03 0.002810 0.001115 0.80
NLD 6388176 0.11 0.79 -0.01 0.002344 0.002068 0.77
BEL 3109836 0.05 0.69 -0.02 0.000994 0.000428 0.66
ITA 2281537 0.04 0.69 0.00 0.000184 0.000311 0.52
DNK 2254968 0.04 0.65 -0.05 0.001573 0.000860 0.67
IRL 1840057 0.03 0.55 -0.01 0.001435 0.000513 0.46
GBR 1480991 0.03 0.67 -0.01 -0.000037 -0.000109 0.54
POL 1436034 0.02 0.52 0.12 0.000573 0.000372 0.68
AUT 1180743 0.02 0.46 -0.02 0.000565 0.000001 0.47
ESP 911814 0.02 0.62 -0.03 -0.001084 -0.000225 0.34
CZE 650093 0.01 0.35 0.07 0.000331 0.000126 0.27
LTU 503386 0.01 0.33 0.06 0.000286 0.000168 0.52
FIN 500888 0.01 0.29 -0.03 0.000369 0.000384 0.21
GRC 364982 0.01 0.33 0.05 0.000067 -0.000019 -0.10
SWE 358791 0.01 0.35 0.05 0.000035 0.000046 0.16
PRT 304424 0.01 0.35 0.00 0.000050 0.000001 0.34
SVK 277547 0.00 0.23 0.09 0.000146 0.000019 0.03
HUN 209984 0.01 0.24 0.03 -0.000144 0.000004 -0.04
EST 168206 0.00 0.19 0.03 0.000140 0.000056 0.21

12
LVA 164675 0.00 0.20 0.19 0.000118 0.000022 0.21
SVN 132380 0.00 0.15 0.04 0.000081 0.000027 -0.29
BGR 91989 0.00 0.32 0.08 0.000029 0.000020 0.14
CYP 62486 0.00 0.22 0.06 0.000060 0.000041 -0.41
ROM 46900 0.00 0.16 0.15 -0.000034 -0.000018 -0.35
Table 4. Dynamic panel estimation results4
Export
competitiveness XMS_04025 TBI_0401 TBI_0402
NRCA_0402_inc
lEU
NRCA_0402_exc
lEU
L1. (First lag of
dependent variable) 0.896*** 0.771*** 0.737*** 0.9064*** 0.79757*** (0.030) (0.054) (0.057) (0.040) (0.057)
EPO_Patents related
to milk production 0.001** 0.016*** 0.02** 0.00001 0.00001*
(0.001) (0.007) (0.011) (0.000) (0.000)
L1. 0.000 -0.002 -0.001 -0.00001 0.00000
(0.000) (0.010) (0.010) (0.000) (0.000)
L2. 0.008 0.021 0.00001 0.00001 (0.014) (0.015) (0.000) (0.000)
PDOPGICheese -0.00001 -0.00001 (0.000) (0.000)
L1. 0.00001 0.00001 (0.000) (0.000)
PDOPGIMilk 0.001 0.027 -0.009 0.00000 -0.00001 (0.001) (0.020) (0.026) (0.000) (0.000)
L1. -0.001 -0.017 0.024 0.00000 0.00002 (0.001) (0.017) (0.022) (0.000) (0.000)
Net investments per
dairy company -0.001 0.085 0.006 0.00003 0.00001
(0.001) (0.057) (0.051) (0.000) (0.000)
L1. 0.002* -0.099 0.013 0.00005** 0.00004*** (0.001) (0.074) (0.044) (0.000) (0.000)
Personnel costs
relative to revenue -0.031 -0.585 -2.378** -0.0022* -0.00165*
(0.027) (1.011) (1.144) (0.001) (0.001)
L1. -0.005 -1.574* -0.64 0.00149 0.00094 (0.032) (0.926) (1.109) (0.001) (0.001)
Total agricultural
area 0.000 0.000 0.000 0.00000 0.00000
(0.000) (0.000) (0.000) (0.000) (0.000)
L1. 0.000* 0.000 0.000 0.00000 0.00000 (0.000) (0.000) (0.000) (0.000) (0.000)
d_EU_member -0.001 -0.302*** -0.049 -0.00001 0.00000 (0.001) (0.081) (0.141) (0.000) (0.000)
d_Euro 0.001 -0.002 -0.03 -0.00002 0.00000 (0.001) (0.059) (0.028) (0.000) (0.000)
P>|z| P>|z| P>|z| P>|z| P>|z| AR(1) 0.044 0.002 0.001 0.044 0.014 AR(2) 0.675 0.454 0.883 0.806 0.691 Robust estimation, standard errors given in parentheses, constants not reported. ***, ** and * indicate significance at the 1, 5 and 10 % level respectively.
4 Estimation results for further aggregations and subgroups of dairy products are not displayed here due to space
restrictions, but can be obtained upon request from the authors. 5 0401: milk and cream, not concentrated; 0402: milk and cream, concentrated.

13
8 Figures
Figure 1. Export competitiveness ranks in contrast to average dairy export volume (average of 2002-
2015). Own presentation
Top Related