


Languages
Pages
Legal


eGRID2016
Technical Support
Document
Contract # EP-BPA-17-H-0012
Task Order 0-04
FINAL
February 2018
Prepared for:
Clean Air Markets Division
Office of Atmospheric Programs
U.S. Environmental Protection Agency
Washington, DC 20460
Prepared by:
Abt Associates
4550 Montgomery Avenue
Suite 800 North
Bethesda, MD 20814

NOTICES
TSD for eGRID2016 ▌pg. i
Notices
This document has been reviewed by the Clean Air Markets Division (CAMD), Office of
Atmospheric Programs (OAP), U.S. Environmental Protection Agency (EPA), and approved for
distribution.

ACKNOWLEDGMENTS
TSD for eGRID2016 ▌pg. ii
Acknowledgments
This edition of eGRID was developed under the leadership of Mr. Travis Johnson and Dr. Jeremy
Schreifels of EPA’s Clean Air Markets Division (CAMD) and Dr. Jonathan Dorn, Ms. Marissa Hoer,
Mr. David Cooley, and Ms. Kait Siegel of Abt Associates, Inc. The eGRID concept was originated by
Mr. Rick Morgan, former EPA Senior Energy Analyst in EPA’s Office of Atmospheric Programs,
and historical development was led by Mr. Art Diem of EPA’s Office of Air Quality Planning and
Standards.

CONTENTS
Technical Support Document for eGRID2016 ▌pg. iii
Contents
Notices..................................................................................................................................................... i
Acknowledgments ................................................................................................................................. ii
Contents ................................................................................................................................................ iii
Abbreviations and Acronyms .............................................................................................................. v
1. Introduction ................................................................................................................................. 9
2. Summary of eGRID2016 Data ................................................................................................. 10 2.1 eGRID Files ....................................................................................................................... 10 2.2 What’s New in eGRID ...................................................................................................... 11 2.3 Uses and Users of eGRID ................................................................................................. 11 2.4 eGRID Data Sources ......................................................................................................... 14
3. eGRID Methodology ................................................................................................................. 15 3.1 Estimation of Emissions .................................................................................................... 15
3.1.1 Unit Level and Plant Level Unadjusted Emission Estimates ............................... 16
3.1.1.1 Annual Emission Estimates for CO2, NOx, and SO2 ......................... 16
3.1.1.2 Annual Emission Estimates for CH4, N2O, and CO2 equivalent ....... 18
3.1.1.3 Annual Emission Estimates for Mercury ........................................... 19
3.1.2 Plant Level Adjusted Emission Estimates ............................................................ 19
3.1.2.1 Adjustments for Biomass .................................................................. 20
3.1.2.2 Adjustments for CHP ........................................................................ 21
3.1.3 Emission Rate Estimates ...................................................................................... 22
3.1.3.1 Generation ......................................................................................... 22
3.1.3.2 Heat Input .......................................................................................... 23
3.1.3.3 Emission Rates .................................................................................. 23
3.2 Determination of Plant Primary Fuel ................................................................................ 26 3.3 Estimation of Resource Mix .............................................................................................. 26 3.4 Aggregating Plant-Level Data ........................................................................................... 26
3.4.1 Balancing Authority ............................................................................................. 27 3.4.2 eGRID Subregion ................................................................................................. 27 3.4.3 NERC Region ....................................................................................................... 29
3.5 Grid Gross Loss ................................................................................................................. 30
4. Specific eGRID Identifier Codes, Name Changes, and Associations .................................... 32 4.1 Plant Level ......................................................................................................................... 32
5. Description of Data Elements ................................................................................................... 33 5.1 The UNIT (Unit) File ........................................................................................................ 33 5.2 The GEN (Generator) File ................................................................................................. 39 5.3 The PLNT (Plant) File ....................................................................................................... 43 5.4 The ST (State) File ............................................................................................................ 56 5.5 The BA (Balancing Authority) File ................................................................................... 61 5.6 The SRL (eGRID Subregion) File ..................................................................................... 61 5.7 The NRL (NERC Region) File .......................................................................................... 61 5.8 The US (U.S.) File ............................................................................................................. 62
CONTENTS
Technical Support Document for eGRID2016 ▌pg. iv
5.9 The Regional Grid Gross Loss File ................................................................................... 62
6. References .................................................................................................................................. 64
Appendix A. eGRID File Structure - Variable Descriptions for eGRID2016 ............................... 67
Appendix B. eGRID Subregion and NERC Region Representational Maps ................................ 88
Appendix C. Crosswalks and Additional Data Tables .................................................................... 90 Emission Factors – NOx, CO2, SO2, CH4, and N2O .................................................................... 90 Biomass fuels used in the Plant file biomass emission adjustments ......................................... 101 Plant ORISPL ID Changes ........................................................................................................ 102 Geothermal Geotype ................................................................................................................. 103 English to Metric Conversion Factors ....................................................................................... 103
Appendix D. Information on Prior Editions of eGRID ................................................................. 104
Tables
Table 3-1. Comparison of 100-Year GWPs ......................................................................................... 19 Table 3-2. Fuel-based Emission Rates – Primary Fuel Category ......................................................... 24 Table 3-3. eGRID Subregion Acronym and Names for eGRID ........................................................... 28 Table 3-4. NERC Region Acronym and Names for eGRID ................................................................ 30 Table 3-5. eGRID2016 Grid Gross Loss (%) ....................................................................................... 31
Table A-1. eGRID File Structure, eGRID2016 UNIT Unit File .......................................................... 67 Table A-2. eGRID File Structure, eGRID2016 GEN Generator File ................................................... 68 Table A-3. eGRID File Structure, eGRID2016 PLNT Plant File......................................................... 69 Table A-4. eGRID File Structure, eGRID2016 ST State File .............................................................. 72 Table A-5. eGRID File Structure, eGRID2016 BA File, Balancing Authority (BA) File ................... 75 Table A-6. eGRID File Structure, eGRID2016 SRL File, eGRID Subregion File .............................. 78 Table A-7. eGRID File Structure, eGRID2016 NRL File, NERC Region File ................................... 81 Table A-8. eGRID File Structure, eGRID2016 U.S. File, United States File ...................................... 84 Table A-9. eGRID File Structure, eGRID2016 GGL File, Grid Gross Loss (%) File ......................... 87 Table C-1. eGRID Emission Factors (CO2, CH4, and N2O) ................................................................. 90 Table C-2. Nitrogen oxides (NOx) emission factors ............................................................................. 91 Table C-3. Sulfur dioxide (SO2) emission factors ................................................................................ 96 Table C-4. Fuel types included in the Plant file biomass emission adjustments ................................ 101 Table C-5. Crosswalk of EIA ORISPL ID changes to EPA/CAMD ORISPL IDs ............................ 102 Table C-6. Geothermal Emission Factors by Geotype and Pollutant ................................................. 103 Table C-7. Conversion Factors ........................................................................................................... 103
Figures
Figure B-1. eGRID Subregion Representational Map .......................................................................... 88 Figure B-2. NERC Region Representational Map ............................................................................... 89

ABBREVIATIONS AND ACRONYMS
Technical Support Document for eGRID2016 ▌pg. v
Abbreviations and Acronyms
40 CFR Part 75 Code of Federal Regulations Title 40 Part 75, which specifies the air
emissions monitoring and reporting requirements delineated in EPA
regulations
AB 32 Assembly Bill 32 - California Global Warming Solutions Act
AR4 Fourth Assessment Report of the Intergovernmental Panel on Climate
Change
AR5 Fifth Assessment Report of the Intergovernmental Panel on Climate Change
BA Balancing authority
BBtu Billion Btu
Btu British thermal unit
CAMD Clean Air Markets Division
CARMA Carbon Monitoring for Action
CHP Combined heat and power (cogeneration)
CH4 Methane
CO2 Carbon dioxide
CO2e Carbon dioxide equivalent
DOE U.S. Department of Energy
DVRPC Delaware Valley Regional Planning Commission
EF Emission factor
eGRID Emissions & Generation Resource Integrated Database
eGRID1996 First edition of Emissions & Generation Resource Integrated Database with
year 1996 data
eGRID1997 Second edition of the Emissions & Generation Resource Integrated Database
with year 1997 data
eGRID1998 Third edition of the Emissions & Generation Resource Integrated Database
with year 1998 data
eGRID2000 Fourth edition of the Emissions & Generation Resource Integrated Database
with years 1999 and 2000 data (1996-1998 data were also reissued without
change)
eGRID2004 Fifth edition of the Emissions & Generation Resource Integrated Database
with year 2004 data
eGRID2005 Sixth edition of the Emissions & Generation Resource Integrated Database
with year 2005 data (2004 data were also reissued without change)
eGRID2007 Seventh edition of the Emissions & Generation Resource Integrated Database
with year 2007 data (2005 and 2004 data were also reissued without change)
ABBREVIATIONS AND ACRONYMS
Technical Support Document for eGRID2016 ▌pg. vi
eGRID2009 Eighth edition of the Emissions & Generation Resource Integrated Database
with year 2009 data (2007, 2005, and 2004 data were also reissued without
change)
eGRID2010 Ninth edition of the Emissions & Generation Resource Integrated Database
with year 2010 data
eGRID2012 Tenth edition of the Emissions & Generation Resource Integrated Database
with year 2012 data
eGRID2014 Eleventh edition of the Emissions & Generation Resource Integrated
Database with year 2014 data
eGRID2016 Twelfth edition of the Emissions & Generation Resource Integrated Database
with year 2016 data
EGC Electric generating company
EIA Energy Information Administration
ELCALLOC Electric allocation factor
EPA U.S. Environmental Protection Agency
FERC Federal Energy Regulatory Commission
FIPS Federal Information Processing Standards
GGL Grid gross loss
GHG Greenhouse gas
GWh Gigawatt-hour
GWP Global warming potential
Hg Mercury
ICR Information collection request
ID Identifier
IPCC Intergovernmental Panel on Climate Change
IPM Integrated Planning Model
ISO Independent System Operator
kg Kilogram
kWh Kilowatt-hour
lb Pound
MISO Midcontinent Independent System Operator
GJ Gigajoule
MMBtu Million Btu
MMcf Million cubic feet
MSB Municipal solid waste – biomass component
MSN Municipal solid waste – non-biomass component

ABBREVIATIONS AND ACRONYMS
Technical Support Document for eGRID2016 ▌pg. vii
MSW Municipal solid waste
MW Megawatt
MWh Megawatt-hour
NATCARB National Carbon Sequestration Database and Geographic Information System
NEMS National Energy Modeling System
NERC North American Electric Reliability Corporation
NESCAUM Northeast States for Coordinated Air Use Management
NETL National Energy Technology Laboratory
NGO Nongovernmental Organization
NOx Nitrogen oxides
NREL National Renewable Energy Laboratory
N2O Nitrous oxide
OAP Office of Atmospheric Programs
ORIS Office of Regulatory Information Systems
ORISPL Office of Regulatory Information Systems Plant code
ORNL Oak Ridge National Laboratory
OTC Ozone Transport Commission
PM Particulate matter
RECs Renewable Energy Credits
RTO Regional Transmission Organization
SAR Second Assessment Report of the Intergovernmental Panel on Climate
Change
SO2 Sulfur dioxide
TAR Third Assessment Report of the Intergovernmental Panel on Climate Change
TJ Terajoule
VRSA Voluntary Renewable Set-Aside Account

ABBREVIATIONS AND ACRONYMS
Technical Support Document for eGRID2016 ▌pg. viii
[This page intentionally left blank.]

SUMMARY OF eGRID YEAR 2016 DATA
Technical Support Document for eGRID2016 ▌pg. 9
1. Introduction
The Emissions & Generation Resource Integrated Database (eGRID) is a comprehensive source of
data on the environmental characteristics of almost all electric power generated in the United States.
The preeminent source of emissions data for the electric power sector, eGRID is based on available
plant-specific data for all U.S. electricity generating plants that provide power to the electric grid and
report data to the U.S. government. Data reported include, but are not limited to, net electric
generation; resource mix (for renewable and nonrenewable generation); mass emissions of carbon
dioxide (CO2), nitrogen oxides (NOx), sulfur dioxide (SO2), methane (CH4), and nitrous oxide (N2O);
emission rates for CO2, NOx, SO2, CH4, and N2O; heat input; and nameplate capacity. eGRID reports
this information on an annual basis (as well as by ozone season for NOx) at different levels of
aggregation.
eGRID2016, released in February 2018, is the twelfth edition of eGRID. eGRID2016 includes two
Excel workbooks, one with English units and one with metric units, that contain generator and unit
spreadsheets as well as spreadsheets by aggregation level for data year 2016: plant, state, balancing
authority, eGRID subregion, NERC region, and United States. The workbooks also include a
spreadsheet that displays the grid gross loss and the variables that are used in its estimation for year
2016.
This document provides a description of eGRID2016, including the methodology for developing the
Excel spreadsheets for each level of aggregation and the grid gross loss calculation. Section 2
provides a summary of the database; Section 3 presents the methodology for emissions estimations,
including adjustments for biomass and combined heat and power (CHP); Section 4 discusses eGRID
specific identification codes, name changes and associations; Section 5 describes the data elements in
detail; and Section 6 provides a list of references. There is also a set of four Appendices – Appendix
A includes the file structure; Appendix B includes the eGRID subregion and NERC region
representational maps; Appendix C includes crosswalks between different datasets and relevant data
tables; and Appendix D contains information on previous releases of eGRID.

SUMMARY OF eGRID YEAR 2016 DATA
Technical Support Document for eGRID2016 ▌pg. 10
2. Summary of eGRID2016 Data
2.1 eGRID Files
eGRID2016 contains electric power data at different levels of aggregation. The eGRID2016 data are
displayed in two workbooks, one with English units of measure and the other with metric units of
measure. As the database name implies, the focus of the data spreadsheets is on two areas: generation
and emissions. In the English unit workbook, generation is expressed in both MWh and as a
percentage (called “resource mix” – generation of a certain fuel or resource type divided by total
generation). Carbon dioxide, NOx, and SO2 emissions are expressed in short tons; CH4, and N2O
emissions are expressed in pounds; emission rates for CO2, NOx, SO2, CH4, and N2O are expressed in
lb/MWh and lb/MMBtu. In the Metric unit workbook, generation is expressed in MWh, Gigajoules
(GJ), and as a percentage. Carbon dioxide, NOx, and SO2 emissions are expressed in metric tons; CH4,
and N2O emissions are expressed in kilograms; emission rates for CO2, NOx, SO2, CH4, and N2O are
expressed in both kg/MWh and kg/GJ. See Table C-7 for a list of English to Metric conversion
factors.
The eGRID2016 workbooks can be downloaded from the EPA eGRID website,
https://www.epa.gov/energy/egrid, along with Summary Tables and this document. The workbooks
contain eight levels of data aggregation:
UNIT (unit), with 25,031 records;
GEN (generator), with 26,183 records;
PLNT (plant), with 9,709 records;
ST (state), with 51 records;
BA (balancing authority), with 72 records;
SRL (eGRID subregion), with 26 records;
NRL (NERC region), with 11 records; and
US, with 1 record.
The unit spreadsheet is sorted by state abbreviation, plant name, plant code, and boiler ID. The
generator spreadsheet is sorted by state abbreviation, plant name, plant code, and generator ID. The
plant spreadsheet is sorted by state abbreviation, plant name, and plant code. The state spreadsheet is
sorted by state abbreviation, the balancing authority spreadsheet is sorted by balancing authority
name, the eGRID subregion spreadsheet is sorted by eGRID subregion name, and the NERC region
spreadsheet is sorted by NERC region acronym. The year 2016 grid gross loss spreadsheet is also
included in the workbook.
The spreadsheet structure for each of the spreadsheets is included in Appendix A. The spreadsheet
structure also includes a description of the variables and the original data sources.
Users should take note that eGRID’s emissions and emission rates are calculated at the sources of
generation and do not account for losses from transmission and distribution infrastructures. Please
refer to Section 3.5 for information on how to account for line losses when assigning emission rates to
SUMMARY OF eGRID YEAR 2016 DATA
Technical Support Document for eGRID2016 ▌pg. 11
estimate indirect emissions associated with electricity purchases. Aggregated eGRID data only
account for U.S. generation that takes place within the aggregated area and do not account for any
electricity that is imported from or exported to other areas. The grid gross loss calculation, however,
does account for U.S. regional interchanges with other U.S. regions as well as Canada and Mexico.
In addition, although eGRID is based on existing Federal data sources, its development requires
substantial attention to quality control. Accurate matching of entities from different databases requires
great care, even where identification codes are available. Inconsistencies between data sources,
missing data, and ambiguous data necessitate adjustments to values of individual data elements,
especially identification data. In general, however, questionable data are not altered in order to
maintain consistency with the original data sources.
Please note that only certain eGRID spreadsheets can be linked from year 2016 to years 2014, 2012,
2010, 2009, 2007, 2005, or 2004. The spreadsheets that can be linked include the NERC region (by
NERC acronym), eGRID subregion (by eGRID subregion acronym), state (by state abbreviation),
plant (by Office of Regulatory Information Systems Plant [ORISPL] code), and the US.
2.2 What’s New in eGRID
There is one major methodological change to eGRID2016. In an effort to keep the eGRID subregion
assignments consistent with previous versions of eGRID, an updated methodology was created for
assigning plants to eGRID subregions. Detailed discussion on these methodology changes can be
found in Section 3.4.2. In addition to this methodological change, there is a small change to output
emission rate units in eGRID2016. Output emission rates for CH4 and N2O are reported in lb/MWh in
eGRID2016 while previous editions of eGRID reported output emission rates for CH4 and N2O in
lb/GWh.
2.3 Uses and Users of eGRID
eGRID data support a wide variety of users globally through a wide variety of uses. eGRID is
valuable to those in the Federal Government, state and local governments, non-governmental
organizations, academia, and companies who are generally seeking environmental information from
the electric power sector in the United States. eGRID is most often used for the estimation of indirect
emissions from electricity purchases, in greenhouse gas (GHG) inventories, for carbon footprinting,
and for estimating avoided emissions from programs and projects that would reduce the consumption
for grid supplied electricity. eGRID data are cited by emission inventory and registry protocols,
various emission calculation tools and applications, many academic papers, and many consultants,
and it is used for many research applications and efforts.
Within EPA, eGRID data are used in the following applications and programs: Power Profiler web
application, Climate Leaders protocols, ENERGYSTAR’s Portfolio Manager and Target Finder,
Waste Wise Office Carbon Footprint Tool, the Personal Greenhouse Gas Emissions Calculator, the
Greenhouse Gas Equivalencies Calculator, and the Green Power Equivalency Calculator.
When the EPA announced its “Apps for the Environment” challenge using EPA data, developers
across the U.S. responded. EPA announced the winners on November 8, 2011 and the two top
winning apps -- Light Bulb Finder (http://www.lightbulbfinder.net/) and Hootroot use eGRID data for
a mobile app and/or a web app, as did several other entries (EPA, 2011). Another of the winning

SUMMARY OF eGRID YEAR 2016 DATA
Technical Support Document for eGRID2016 ▌pg. 12
entries, Joulebug (http://joulebug.com/), uses eGRID data and developed a game to save energy as
both a web and free iPhone app.
In 2015, Executive Order 13693 was issued, requiring Federal agencies to reduce their greenhouse
gas emissions from direct and indirect activities. The order requires that Federal agencies report their
building information in EPA’s Portfolio Manager which uses eGRID to estimate emission reductions.
One of the most popular uses of eGRID is to determine the indirect GHG emissions from electricity
purchases and avoided GHG emissions from projects and programs that reduce the demand for grid
supplied electricity. For example, The Climate Registry, California’s Mandatory GHG emissions
reporting program (AB 32), and the Greenhouse Gas Protocol Initiative cite eGRID for use in
estimating scope 2 (indirect) GHG emissions from electricity purchases in the United States (TCR,
2016; CARB, 2007; Greenhouse Gas Protocol, 2016). Most carbon footprint calculators that are
applicable to the United States use eGRID data.
The website, www.fueleconomy.gov, resulting from an EPA-U.S. Department of Energy (DOE)
partnership, provides fuel economy information that consumers can use to make knowledgeable
decisions when buying a car. The information can also help consumers achieve the best fuel economy
from currently owned cars. This website showcases its Greenhouse Gas Emissions for Electric and
Plug-in Hybrid Electric Vehicles calculator, http://www.fueleconomy.gov/feg/label/calculator.jsp,
which uses eGRID data to estimate the total GHG emissions from electric and plug-in hybrid
vehicles, including emissions from electricity used to charge the vehicle. eGRID is cited as a data
source at http://www.fueleconomy.gov/feg/label/calculations-information.shtml. In a similar vein, the
Union of Concerned Scientists published a 2012 report using eGRID data to support its study results
that it is advantageous to switch to a battery-powered vehicle, although there are wide differences in
both real electricity costs and GHG emissions, depending on the region in which you live (UCS,
2012).
EIA’s National Energy Modeling System (NEMS)’s electricity market module supply regions are the
eGRID subregions; the map used in their 2016 documentation (Figure 3) uses the eGRID subregion
map and subregion colors, changing a few names (EIA, 2016).
eGRID is also used by other Federal Government agencies such as Oak Ridge National Laboratory
(ORNL) for their Combined Heat and Power Calculator, the National Energy Technology Laboratory
(NETL) for their sponsored distributed National Carbon Sequestration Database and Geographic
Information System (NATCARB), and the National Renewable Energy Laboratory (NREL) for their
micropower distributed generation optimization model named HOMER.
States and local governments rely on eGRID data for electricity labeling (environmental disclosure
programs), emissions inventories, and registries as well as for efforts to analyze air emissions from
the electric power sector. Several states have published state specific emissions information from
eGRID or have used eGRID to inform policy decisions. The Maryland Department of the
Environment determined eligibility for participation in the Voluntary Renewable Set-Aside Account
(VRSA) using eGRID factors (Maryland, 2010); and in 2009, the Delaware Valley Regional Planning
Commission (DVRPC) -- a nine county region in Pennsylvania and New Jersey -- completed a 2005
GHG inventory in support of regional efforts to quantify and reduce emissions associated with
climate change, using eGRID factors (DVRPC, 2010).

SUMMARY OF eGRID YEAR 2016 DATA
Technical Support Document for eGRID2016 ▌pg. 13
Tracking systems for renewable energy credits (RECs), such as ISO-New England’s Generation
Information System and PJM Environmental Information Services’ Generation Attribute Tracking
System utilize eGRID data.
ISO New England uses eGRID rates in developing the 2016 New England Electric Generator Air
Emissions Report (http://www.iso-ne.com/system-planning/system-plans-studies/emissions).
eGRID is additionally used for nongovernmental organizations’ (NGOs) tools and analysis. The
following is a list of some known users and applications of eGRID data: Northeast States for
Coordinated Air Use Management (NESCAUM) analysis; Powerscorecard.org; Ozone Transport
Commission (OTC)’s Emission Workbook; GHG Protocol Initiative; Rocky Mountain Institute’s
Community Energy Finder; Leonardo Academy’s Cleaner and Greener Environmental Program;
National Resource Defense Council’s Benchmarking Air Emissions; Berkeley Institute of the
Environment; Cool Climate Carbon Footprint Calculator; Climate and Air Pollution Planning
Assistant; Emission Solution’s Carbon Footprint Calculator; International Council for Local
Environmental Initiatives’ Clean Air software, United States Department of Transportation Federal
Transit Administration, Google PowerMeter; National Public Radio’s Visualizing the U.S. Electric
Grid; International Code Council; American Society of Heating, Refrigerating, and Air-Conditioning
Engineers; American Council for an Energy-Efficient Economy’s Local Energy Efficiency Policy
Calculator; and World Resource Institute’s Carbon Value Analysis Tool.
The Center for Global Developments’ Carbon Monitoring for Action Database (CARMA) at
http://carma.org, which contains information about carbon emissions for power plant and companies
in the U.S. as well as other countries, used eGRID year 2005 data as a base, according to the Center’s
David Wheeler (Wheeler, 2007). eGRID data also underlie the Global Energy Observatory U.S.
power plant database.
Carbon Visuals, which illustrate accurate volumetric images to visualize the carbon footprint of all
U.S. power stations, used eGRID subregion GHG emission factors
(http://www.carbonvisuals.com/projects/2015/6/23/visualising-the-carbon-footprint-of-all-us-power-
stations?rq=egrid; Carbon Visuals, 2014).
The University of California, Berkeley’s CoolClimate Carbon Footprint Maps use eGRID data (Jones
and Kammen, 2013).
Several papers have been written to clarify issues and respond to questions about the uses of eGRID.
The following provides details on some of the most recent papers.
In May 2016, “How Part 75 Data is Used in GHG Reporting and EE/RE Quantification,”
(Johnson, 2016a) was presented at the EPRI Continuous Emissions Monitoring User Group
Conference.
In February 2016, “Emissions & Generation Resource integrated Database (eGRID),”
(Johnson, 2016b) was presented at the Energy, Utility, and Environment Conference.
In October 2015, “EPA's Emissions & Generation Resource Integrated Database (eGRID):
Improvements and Applications: (Dorn et al., 2015) was presented at the Community
Modeling and Analysis System Conference.

SUMMARY OF eGRID YEAR 2016 DATA
Technical Support Document for eGRID2016 ▌pg. 14
In February 2015, “eGRID Updates,” (Johnson, Schreifels, and Quiroz, 2015) was presented
at the Energy, Utility, and Environment Conference.
The paper “Using EPA’s eGRID to Estimate GHG Emissions Reductions from Energy
Efficiency” (Diem, Salhotra, and Quiroz, 2013) was presented at the International Energy
Program Evaluation Conference, in August 2013.
In January 2013, “Using eGRID Data for Carbon Footprinting Electricity Purchases,” (Diem
and Quiroz, 2013) was presented at the Energy, Utility, and Environment Conference.
The paper “How to use eGRID for Carbon Footprinting Electricity Purchases in Greenhouse
Gas Emission Inventories” (Diem and Quiroz, 2012) was presented at the EPA 2012
International Emission Inventory Conference in August 2012.
2.4 eGRID Data Sources
eGRID is developed using the following key data sources:
EPA/CAMD: this includes data reported to EPA by electric generating units to comply with
the regulations in 40 CFR Part 75. Data include annual emissions of CO2, NOx, and SO2;
ozone season emissions of NOx; and annual and ozone season generation and heat input. The
data are available at https://www.epa.gov/airmarkets.
EIA-860: this includes data reported to EIA on electric generators. Data include nameplate
capacity, prime mover, primary fuel type, and indication of whether the generator is a
combined-heat-and-power unit (EIA, 2017a).
EIA-923: this includes data reported to EIA on fuel consumption and generation. Data
include monthly generation and heat input at the unit or generator level for a subset of units
and generators, and at the prime mover level for all plants. As discussed in more detail below,
eGRID2016 uses unit- or generator-level data where available, and prime mover-level data
for all other units and generators (EIA, 2017b).
The key identifier of plants in the EPA/CAMD and EIA datasets is the ORISPL code. While the
ORISPL code generally matches well for plants in the different datasets, there are some plants that
have different ORISPL codes between the EPA/CAMD and EIA datasets. These plants are listed in
Appendix C.
SPECIFIC eGRID IDENTIFIER CODES, NAME CHANGES AND ASSOCIATIONS
Technical Support Document for eGRID2016 ▌pg. 15
3. eGRID Methodology
This section describes the methodologies utilized to develop eGRID2016. Some methods used for
eGRID2016 are modified or refined from previous editions of eGRID, and are so noted in this
section. Also see Section 2.2 for a list of changes to eGRID2016.
3.1 Estimation of Emissions
The Unit file and Plant file in eGRID2016 include emissions data for CO2, NOx, SO2, CH4, and N2O.1
Carbon dioxide (CO2) is a product of combusting fossil fuels, as well as biogenic and other materials,
and is the primary greenhouse gas (GHG) emitted by human activities that is driving global climate
change; nitrogen oxides (NOx) are also emitted by electric generating units and are precursors to the
formation of ozone, or smog, and fine particulates (PM2.5), and also contributes to acid rain and other
environmental and human health impacts; sulfur dioxide (SO2) is emitted by electric generating units,
especially with coal combustion, and is a precursor to acid rain and PM2.5 and is associated with other
environmental and human health impacts. Methane (CH4) and nitrous oxide (N2O), two other GHGs
emitted by electric generating units, have been included in eGRID since data year 2005 at the plant
level. The eGRID emissions data for the three GHGs are used as default factors in a variety of climate
protocols (including The Climate Registry, California’s Mandatory GHG emissions reporting
program (AB 32), and EPA’s Climate Leaders) for indirect emissions estimation calculations (TCR,
2016; CARB, 2007; EPA, 2016a).
Emissions estimates are included at the unit level, in the Unit file, as well as summed to the plant
level, in the Plant file. The sum of unit level emissions from the Unit file will equal the unadjusted
plant level emissions in the Plant file.
Plant level emissions in eGRID reflect a combination of monitored and estimated data. Emissions and
emission rates in eGRID represent emissions and rates at the point(s) of generation. While they do
account for losses within the generating plants (net generation), they do not take into account any
power purchases, imports, or exports of electricity into a specific state or any other grouping of
plants, and they do not account for any transmission and distribution losses between the points of
generation and the points of consumption. Also, eGRID does not account for any pre-combustion
emissions associated with the extraction, processing, and transportation of fuels and other materials
used at the plants or any emissions associated with the construction of the plants.
eGRID emissions and heat input that are displayed in the Unit file are unadjusted, while the Plant file
contains emissions and heat input that are adjusted for biomass and/or CHP units, where applicable.
The Plant file also contains unadjusted emissions. The subsequent aggregation files are based on
adjusted emissions. All emission rates in the Plant file and all aggregation files are based on adjusted
emissions, net generation, and adjusted heat input. Both the source(s) of emissions data and
adjustment flags are provided in the Plant file.
1 These files also contain fields for emissions of mercury. However, while electric generating units started to
report mercury data to EPA/CAMD in 2015, the data are incomplete. Therefore, we have retained these
fields in anticipation of being able to report mercury emissions in a future edition of eGRID.

SPECIFIC eGRID IDENTIFIER CODES, NAME CHANGES AND ASSOCIATIONS
Technical Support Document for eGRID2016 ▌pg. 16
3.1.1 Unit Level and Plant Level Unadjusted Emission Estimates
3.1.1.1 Annual Emission Estimates for CO2, NOx, and SO2
Unit File
Unit level emissions in the eGRID Unit file are estimated in a three-step process:
1. We include unit-level emissions and heat input data from EPA/CAMD;
2. For units that report to EIA at the unit level but not to EPA/CAMD, we include the reported
unit-level heat input from EIA; and
3. For all other units that report EIA at the plant level, we distribute prime mover-level heat
input to each unit based on that unit’s proportion of nameplate capacity.
For units that report to EIA but not to EPA/CAMD (steps 2 and 3), we estimate emissions by
multiplying the heat input by the fuel-specific emission factors shown in Appendix C.
Generally, emission sources that report to EPA/CAMD are fossil fuel-fired boilers and turbines
serving an electric generator with a nameplate capacity greater than 25 MW and producing electricity
for sale. Additionally, some sources not serving a generator or serving a generator less than 25 MW
also report to EPA/CAMD.
For units that report to EPA/CAMD only during the ozone season, the non-ozone season heat input is
taken from the EIA-923. The non-ozone season heat input for each included unit was distributed from
the prime-mover level based on the nameplate capacity of that unit (step 3 above). The EIA-923
distributed non-ozone season heat input is added to the ozone season heat input from EPA/CAMD.
Non-ozone season emissions for NOx are calculated and added to the reported EPA/CAMD ozone
season NOx emissions. The emissions for CO2 and SO2 for these units are calculated using the
methodology discussed below, using the updated heat input. The heat input and emission adjustment
only applies to 208 units out of the total 295 units in EPA/CAMD that reported only during the ozone
season. There are 87 units that cannot be updated to reflect annual data values due to differences for
these units in the EPA/CAMD and EIA data.
CO2
As discussed above, the majority of CO2 emissions reported in eGRID2016 are monitored data from
EPA/CAMD. For units that report to EIA but not to EPA/CAMD, or for units from EPA/CAMD
where there are gaps in CO2 emissions data, the CO2 emissions are estimated based on heat input and
an emission factor.
The emission factors are primarily from the default CO2 emission factors from the EPA Mandatory
Reporting of Greenhouse Gases Final Rule (EPA, 2009, Table C-1). For fuel types that are included
in eGRID2016 but are not in the EPA Mandatory Reporting of Greenhouse Gases Final Rule,
additional emission factors are used from the 2006 Intergovernmental Panel on Climate Change
(IPCC) Guidelines for National Greenhouse Gas Inventories and the EPA Inventory of U.S.
Greenhouse Gas Emissions and Sinks: 1990-2015 (IPCC, 2007; EPA, 2017).
Several fuel types do not have direct reported emission factors, so emission factors from similar fuel
types are used:

SPECIFIC eGRID IDENTIFIER CODES, NAME CHANGES AND ASSOCIATIONS
Technical Support Document for eGRID2016 ▌pg. 17
The emission factor for natural gas is used to estimate emissions from process gas and other
gas;
The emission factor for “Electric Power Coal” from the EPA U.S. Greenhouse Gas Inventory
Report: 1990-2014 is used to estimate emissions from refined coal and waste coal; and
The emission factor for other biomass liquids is used to estimate emissions from sludge waste
and liquid wood waste.
The CO2 emissions from hydrogen, nuclear, purchased steam, solar, waste heat, water, wind, and
energy storage are considered to be zero. The CO2 emissions for units with a fuel cell prime mover
are also assumed to be zero.
A list of the CO2 emission factors used in eGRID2016 can be found in Table C-1 in Appendix C.
NOx
Similar to CO2, the emissions from NOx come from monitored data from EPA/CAMD where
available.
For all other units, the NOx emissions are based on heat input multiplied by an emission factor. For
some units, EIA reports unit-level NOx emission rates (lb/MMBtu) for both annual and ozone season
emissions, from EIA Form 923, Schedule 8C. These unit-level emissions rates are multiplied by the
unit-level heat input used to estimate annual and ozone season NOx emissions. For all other units that
report to EIA but do not report to EPA/CAMD, the unit-level heat input is multiplied by a prime
mover- and fuel-specific emission factor from EPA’s AP-42 Compilation of Air Pollutant Emission
Factors (EPA, 1995).
Ozone season NOx emissions include emissions from May through September. For units where the
NOx emissions are estimated with an emission factor, the NOx ozone season emissions are based on
the emission factor multiplied by the heat input for May through September.
See Table C-2 in Appendix C for the NOx emission factors used in eGRID2016.
SO2
As with the other pollutants, emissions of SO2 are taken from monitored data from EPA/CAMD
where available.
For all other units, SO2 emissions are based on heat input multiplied by an emission factor. Unlike for
NOx, EIA does not report unit-level emissions rates for SO2. Therefore, the SO2 emissions for all non-
EPA/CAMD units are estimated using emission factors from EPA’s AP-42, which are specific to fuel,
prime mover, and in the case of boilers, boiler type (EPA 1995).
For some fuels, such as coal and oil, the emission factor from AP-42 depends on the sulfur content of
the fuel. For many units, EIA reports monthly unit-level data on the sulfur content of the fuel
consumed, and these data are used with the AP-42 emission factors to estimate SO2 emissions. For
units without unit-level data on the sulfur content of fuels, the sulfur content is based on an average of
the reported sulfur contents for units that have the same prime mover and fuel type.
For some units for which we calculated SO2 emissions with an emission factor, EIA reports SO2
control efficiencies. For these units the estimated SO2 emissions are multiplied by (1 – control

SPECIFIC eGRID IDENTIFIER CODES, NAME CHANGES AND ASSOCIATIONS
Technical Support Document for eGRID2016 ▌pg. 18
efficiency) to estimate the controlled emissions. Units that do not have unit-level control efficiency
data are assumed to be uncontrolled. The control efficiencies are not used for units where the
emissions data are from EPA/CAMD, because these emissions already take controls into account.
See Table C-3 in Appendix C for the SO2 emission factors used in eGRID2016.
Geothermal
Geothermal emissions are estimated for CO2, SO2, and NOx. While CO2 is a gas in the geothermal
reservoir, SO2 and NOx result from hydrogen sulfide combustion. The three pollutants’ emission
factors, obtained from a 2007 Geothermal Energy Association environmental guide (GEA, 2007), are
applied to plant net generation, and differ depending on the type of geothermal plant as identified in
various reports from the Geothermal Energy Association (GEA, 2016). For a binary or flash/binary
geothermal plant, there are no CO2, SO2, or NOx emissions since the plant operates a closed system;
for a flash geothermal plant, there are no NOx emissions and minimal CO2 and SO2 emissions; and for
a dry steam geothermal plant, there are minimal CO2, SO2, and NOx emissions.
See Table C-6 in Appendix C for the geothermal emission factors used in eGRID2016.
Plant File
The emissions of CO2, NOx, and SO2 in the Plant file are the sum of all unit-level emissions at a plant
from the Unit file.
3.1.1.2 Annual Emission Estimates for CH4, N2O, and CO2 equivalent
Emissions for CH4, N2O, and CO2-equivalent (CO2e) are included in eGRID2016 at the plant level.2
The emissions for CH4 and N2O are calculated using heat input data and emission factors from the
EPA or the IPCC. The emission factors are primarily from the EPA Mandatory Reporting of
Greenhouse Gases Final Rule (EPA, 2009, Table C-1). For fuel types that are included in eGRID2016
but not in Table C-1 of the EPA Mandatory Reporting of Greenhouse Gases Final Rule, additional
emission factors are used from the 2006 IPCC Guidelines for National Greenhouse Gas Inventories
and the EPA Inventory of U.S. Greenhouse Gas Emissions and Sinks: 1990-2015 (IPCC, 2007; EPA,
2017).
Several fuel types do not have direct reported emission factors, so emission factors from similar fuel
types are used:
The emission factor for natural gas is used to estimate emissions from process gas and other
gas;
The emission factor for “Electric Power Coal” from the EPA Inventory of U.S. Greenhouse
Gas Emissions and Sinks: 1990-2015 is used to estimate emissions from refined coal and
waste coal; and
2 Nitrous oxide is an oxide of nitrogen that is not part of the NOx subset of oxides of nitrogen. N2O is a
greenhouse gas, the emissions of which are contributing to global climate change. N2O should not be
confused with NOX.

SPECIFIC eGRID IDENTIFIER CODES, NAME CHANGES AND ASSOCIATIONS
Technical Support Document for eGRID2016 ▌pg. 19
The emission factor for other biomass liquids is used to estimate emissions from sludge waste
and liquid wood waste.
The CH4 and N2O emissions for electricity used from energy storage (megawatt-hours), hydrogen,
nuclear, purchased steam, solar, waste heat, water, and wind are considered to be zero. The CH4 and
N2O emissions from units with a fuel cell prime mover are also considered to be zero.
A list of the CH4 and N2O emission factors used in eGRID2016 can be found in Table C-1in
Appendix C.
The CO2 equivalent (CO2e) emissions, in tons, and total output emission rate (lb/MWh) are included
in the Plant file and subsequent aggregation files. The CO2e non-baseload output emission rate (in
lb/MWh) is included at the aggregated eGRID subregion level in the eGRID Subregion file. CO2e
emissions are calculated based on the global warming potential of CO2, CH4, and N2O.
Global warming potential (GWP) is a value assigned to a GHG so that the emissions of different
gases can be assessed on an equivalent basis to the emissions of the reference gas, CO2. Traditionally,
the 100-year GWPs are used when calculating overall CO2 equivalent emissions, which is the sum of
the products of each GHG emission value and their GWP. Based on the second IPCC assessment
(1996) (SAR), the GWP of CO2 is 1, CH4 is 21 and N2O is 310. When calculating the CO2
equivalent, it is important to ensure that each of the GHG emission values has the same measurement
units (i.e. either all in short tons or all in pounds), as CO2 emissions are expressed in short tons while
both CH4 and N2O emissions are expressed in pounds in eGRID. In order to compare emissions
across previous data years, the GWP for the IPCC SAR is used, although there have been subsequent
third (2001) (TAR), fourth (2006) (AR4), and fifth (2014) (AR5) assessments. A comparison of the
GWPs for CO2, CH4, and N2O is shown in Table 3-1 (EPA, 2017, Table 1-3; IPCC, 2001, Table 3).
Table 3-1. Comparison of 100-Year GWPs
Gas SAR TAR AR4 AR5*
CO2 1 1 1 1
CH4 21 23 25 34
N2O 310 296 298 298
*Note that the AR5 values include climate-carbon feedbacks
3.1.1.3 Annual Emission Estimates for Mercury
No mercury (Hg) emissions are included in eGRID2016. While electric generating units started to
report mercury data to EPA/CAMD in 2015 under the Mercury and Air Toxics Standards (MATS),
the data are incomplete. However, the fields for Hg emissions and emissions rates have been retained
so that these data may be included in future editions of eGRID.
3.1.2 Plant Level Adjusted Emission Estimates
Emissions reported in eGRID represent emissions from fuel utilized only for electricity generation.
For certain plants, there are two possible cases for which we adjust the emission estimates: (1) if the
plant is a CHP facility; and (2) if one or more units at the plant burn biomass, including biogas (such
as landfill, methane, and digester gas). The Plant file reports both adjusted and unadjusted emissions,
while the Unit file reports only unadjusted emissions. Due to these adjustments, the adjusted
emissions reported in eGRID may be different from emissions reported in other EPA sources.

SPECIFIC eGRID IDENTIFIER CODES, NAME CHANGES AND ASSOCIATIONS
Technical Support Document for eGRID2016 ▌pg. 20
3.1.2.1 Adjustments for Biomass
Prior editions of eGRID applied a biomass adjustment to the annual emission values based on an
assumption of zero emissions from biomass combustion. This assumes that the amount of carbon
sequestered during biomass growth equals the amount released during combustion, without
consideration of other factors. For reasons of consistency, the same approach is applied in
eGRID2016.
eGRID makes adjustments for biogas emissions, for biomass emissions other than biogas, and for
solid waste emissions for specified pollutants. Solid waste typically consists of a mixture of biogenic
materials—such as wood, paper, and food waste—and fossil-based materials—such as plastics and
tires. EIA-923 reports fuel consumption at plants that combust municipal solid waste (MSW) as the
biomass component (MSB) and the non-biomass component (MSN). Emissions from the biomass
component of solid waste are adjusted, while emissions from the non-biomass component of solid
waste are not adjusted. In eGRID2016, the fuel type for these plants is listed as MSW.3
The Plant file includes a biomass adjustment flag to indicate whether a biomass adjustment is made to
the annual emission values for CO2, NOx, SO2, CH4, and N2O. The possible biomass adjustments to
emissions are explained below. See Table C-1 in Appendix C for a table of biomass fuel types used in
the biomass adjustments to emissions in the Plant file.
CO2
The emissions from biomass combustion at a plant are subtracted from the plant’s overall unadjusted
CO2 emissions. The CO2 emissions from biomass can be determined at the plant level by comparing
the adjusted emissions and the unadjusted emissions at plants that have a biomass adjustment flag of
1. To determine the biomass emissions if the CHP adjustment flag is also 1, the adjusted emissions
value from CHP plants must first be calculated (since the CHP plant adjustment is applied last; see
Section 3.1.2.2 below).
For EPA/CAMD units with a prime mover that matches EIA-923 prime movers that burn one or more
biomass fuels, the CO2 emissions are adjusted by subtracting the biomass CO2 emissions calculated
using the corresponding EIA-923 data (EIA, 2017b). In previous editions of eGRID, there were
different flags for the biomass adjustment to represent different biomass fuels or differences in the
emissions data source.
NOx, SO2, CH4, and N2O
Emissions adjustments for NOx, SO2, CH4, and N2O emissions are only conducted for landfill gas in
eGRID. This adjustment is based on the assumption that in many cases landfills would flare the gas if
they did not combust it for electricity generation. Therefore, we assume that, at a minimum, the gas
would have been combusted in a flare and would have produced some emissions of NOx, SO2, CH4,
and N2O anyway. Similar to the CO2 adjustments, biogas adjustments are made by deducting the
emissions from landfill gas for NOx, SO2, CH4, and N2O from the overall plant total emissions. For
NOx emissions from landfill gas, an emission factor for flaring of landfill gas, 0.000283 tons per
3 Previous editions of eGRID estimated the split between the biomass and non-biomass components of MSW.
Because the EIA-923 reports these components separately, this estimation is no longer necessary.

SPECIFIC eGRID IDENTIFIER CODES, NAME CHANGES AND ASSOCIATIONS
Technical Support Document for eGRID2016 ▌pg. 21
MMBtu, is used (EPA, 2016b).4 See Table C-1 in Appendix C for a list of CH4, and N2O emission
factors and the landfill gas (LFG) values from Table C-3 for a list of SO2 emission factors. Note that
CO2 is also adjusted for landfill gas, as described above.
3.1.2.2 Adjustments for CHP
A CHP facility is a type of generating facility that produces electricity and another form of useful
thermal energy (such as heat or steam) used for industrial, commercial, heating, or cooling purposes.
CHP, also known as cogeneration, can convert energy more efficiently than facilities that separately
produce heat and electricity. Plants in eGRID are designated as CHP facilities based on information
from the EIA-860, EIA-923, and Department of Energy Combined Heat and Power Database datasets
(EIA, 2017b; DOE, 2016). A flag indicating whether or not a plant is a CHP facility is included in the
eGRID Plant file. Since emissions reported in eGRID represent electricity generation only, emissions
associated with useful thermal output—the amount of heat produced in a CHP facility that is used for
purposes other than making electricity—are excluded from the adjusted emissions.
eGRID’s CHP adjustment methodology is designed to allocate emissions for CHP plants between
electricity and thermal output. If a plant is a CHP facility, the adjustment is applied to the emissions
and heat input for the entire plant after any biomass adjustment has been made.
The methodology is based on multiplying emissions and heat input by an electric allocation factor,
which is calculated as follows:
1. Calculate the useful thermal output. EIA-923 reports both total fuel consumption and fuel
consumption for electricity generation.5 The useful thermal output value for eGRID2016 data
is calculated from EIA-923 data as 0.8 multiplied by the difference in total heat input and
electricity heat input in MMBtu. The value of 0.8 is an assumed efficiency factor from the
combustion of the consumed fuel (EIA, 2017b).
2. The electric allocation factor is calculated as the ratio of the electricity heat output to the sum
of the electricity and steam heat outputs, where electricity heat output is the net generation in
MWh multiplied by 3.413 to convert it to MMBtu, and steam heat output is 0.75 multiplied
by the useful thermal output, in MMBtu. The 0.75 factor is another assumed efficiency factor,
which accounts for the fact that once fuel is combusted for electricity generation,
approximately 75 percent of the useful thermal output can be utilized for other purposes, such
as space heating or industrial processes.6
4 Note that this factor was converted from units of lb/standard cubic foot (scf) to tons/MMBtu based on a value
of 500 Btu/scf (EPA, 2016c).
5 CHP facilities do not report these values to EIA separately. They only report total fuel consumption, and EIA
estimates the fuel consumption for electricity generation.
6 This assumes that the CHP units generate electricity first and use the waste heat for other purposes, also
known as “topping.” While there are some units that generate and use heat first and then use the waste heat

SPECIFIC eGRID IDENTIFIER CODES, NAME CHANGES AND ASSOCIATIONS
Technical Support Document for eGRID2016 ▌pg. 22
If the useful thermal output is zero, then the electric allocation factor is set to one. The electric
allocation factor should be between zero and one. If the electric allocation factor is calculated to be
greater than one, it is set to one, and if the electric allocation factor is calculated to be less than zero,
it is set to zero.
In previous editions of eGRID, the CHP adjustment methodology involved a process for estimating
the electric allocation factor in cases where a unit is listed as a CHP unit, but the total heat input and
electric heat input reported by EIA were reported as equal. In discussions with EIA, we have
determined that in these cases, there should be no CHP adjustment made. Therefore, for units listed as
CHP units, but with a total heat input equal to the electric heat input, the useful thermal output is
calculated to be 0, and the electric allocation factor is set to 1. This assumes that all of the heat input
for these units is used for electricity generation and that useful thermal output is not produced.
3.1.3 Emission Rate Estimates
Input and output emission rates are calculated for eGRID at the plant level in the Plant file, and the
subsequent aggregated files. Annual and ozone season net generation and heat input values (adjusted
for CHP plants) are required to calculate the emission rates.
3.1.3.1 Generation
Net generation, in MWh, is the amount of electricity produced by the generator and transmitted to the
electric grid. Net generation does not include any generation consumed by the plant. If generation
consumed by the plant exceeds the gross generation of that plant, negative net generation will result.
In these cases, the output emissions rates are set to 0, rather than report a negative emissions rate.
Generator-level net generation as well as prime mover-level net generation is obtained from the EIA-
923. Ozone season generation is calculated by summing up the generation for the months of the ozone
season, May through September (EIA, 2017b).
The methodologies employed for obtaining year 2016 net generation data are described below.
Generator-Level Net Generation
The EIA-923 dataset reports generator-level generation for a subset of generators. This generator-
level generation is reported in the Generator File in eGRID2016. For all other generators, which do
not have data on generator-level generation, prime mover-level net generation is distributed to the
generators in the Generator file based on the proportion of nameplate capacity of generators with that
prime mover at a given plant. Ozone season net generation uses the same methodology, but only
includes generation data for May to September. Annual and ozone season generation is distributed to
generators with a status of operating, standby/backup, out of service but was operating for part of the
to generate electricity, also known as “bottoming,” data from the EIA shows that the vast majority of CHP
facilities are topping facilities.

SPECIFIC eGRID IDENTIFIER CODES, NAME CHANGES AND ASSOCIATIONS
Technical Support Document for eGRID2016 ▌pg. 23
data year, or retired if the retirement year is 2016. Generation is not distributed to generators if the
generator is not yet in operation or retired before 2016.
In some cases the sum of the generator-level generation does not equal the plant-level generation,
even if all generator-level generation is available for all generators. In order to ensure that the
generation in eGRID matches the plant-level generation data from EIA, distributed prime mover-level
data are used in some cases in place of generator-level generation data.
As explained above, some generator-level net generation data are missing or not reported for various
generators in the 2016 EIA-923. EIA aggregates these missing data to the state level by fuel type, but
it is not possible to distribute them back to the generator level accurately (EIA, 2017b).
Plant-Level Net Generation
The annual generation data in the Plant file are the sum of all generator-level generation at the plant
from the Generator file. The ozone season generation data in the Plant file are a sum of all ozone
season (May-September) generator-level generation at the plant from the Generator file.
Combustion net generation is also developed (as is non-combustion generation) based on the fuel type
generation of each plant. For plants that are only composed of combustion generating units, the plant
combustion net generation is the same as the total plant net generation. For plants that have both
combustion and non-combustion generating units, the combustion net generation will be less than the
total net generation for that plant.
3.1.3.2 Heat Input
Heat input, in MMBtu, is the amount of heat energy consumed by a generating unit that combusts
fuel. The method for assigning unit-level heat input follows the same process as the method for
assigning unit-level CO2 emissions (see section 3.1.1.1). Annual and ozone season unit-level heat
input for eGRID is initially obtained from the reported EPA/CAMD emissions data. EPA/CAMD
heat input is based either on stack flow and CO2/O2 monitoring or fuel flow and the heat content of
fuel.
If EPA/CAMD unit level heat input data are not reported or the overall plant is not included in the
EPA/CAMD data, annual and ozone heat input data are obtained at the unit level or prime mover
level from the EIA-923 monthly data (EIA, 2017b). For units that only report ozone season heat input
to EPA/CAMD, a methodology is used to add the additional heat input for non-ozone season months
from the EIA-923 (see discussion in Section 3.1.1.1).
The Unit file unit level heat input is summed to the plant level and reported in the Plant file.
3.1.3.3 Emission Rates
Output, input, and combustion emission rates are reported in the Plant, State, Balancing Authority,
eGRID Subregion, NERC Region, and US eGRID files. The fuel-based and non-baseload emission
rates are reported in the State, Balancing Authority, eGRID Subregion, NERC Region, and US
eGRID files.

SPECIFIC eGRID IDENTIFIER CODES, NAME CHANGES AND ASSOCIATIONS
Technical Support Document for eGRID2016 ▌pg. 24
Output and Input Emission Rates
Output emission rates for SO2, NOx, CO2, CO2e, CH4, and N2O in lb/MWh, are reported in the Plant
file. The output emission rates are calculated as total annual adjusted emissions divided by annual net
generation.
Input emission rates for SO2, NOx, and CO2, in lb/MMBtu, are calculated as the total annual
emissions divided by the annual heat input.
Fuel-based Emission Rates
For the State, Balancing Authority, eGRID Subregion, NERC Region, and US eGRID files, coal, oil,
gas, and fossil fuel output and input emission rates are calculated based on a plant’s primary fuel (see
Section 3.2). If a plant’s primary fuel is coal, oil, gas, or another fossil fuel, then all of its adjusted
emissions, adjusted heat input, and net generation from combustion are included in the respective
aggregation level for that fuel category. For example, all plants in Alabama with coal as primary fuel
will have their emissions, heat input, and combustion net generation summed to the state level and
then the appropriate calculations will be applied to determine the coal-based output and input
emission rates for Alabama. See Table 3-2 for a list of primary fuels and fuel categories used for fuel-
based emission rates in the State, Balancing Authority, eGRID Subregion, NERC Region, and US
eGRID files.
Table 3-2. Fuel-based Emission Rates – Primary Fuel Category
Fuel Code Description Fuel Category
BIT Bituminous coal Coal
LIG Lignite coal Coal
SUB Subbituminous coal Coal
RC Refined coal Coal
WC Waste coal Coal
SGC Coal-derived synthetic gas Coal
COG Coke oven gas Coal
NG Natural gas Gas
BU Butane gas Gas
DFO Distillate fuel oil Oil
JF Jet fuel Oil
KER Kerosene Oil
PC Petroleum coke Oil
RG Refinery gas Oil
RFO Residual fuel oil Oil
WO Waste oil Oil
BFG Blast furnace gas Other fossil
OG Other gas Other fossil

SPECIFIC eGRID IDENTIFIER CODES, NAME CHANGES AND ASSOCIATIONS
Technical Support Document for eGRID2016 ▌pg. 25
Fuel Code Description Fuel Category
TDF Tire-derived fuel Other fossil
Non-baseload Emission Rates
In addition to emission rates for all plants, eGRID also reports emission rates for nonbaseload plants
in the State, Balancing Authority, eGRID Subregion, NERC Region, and US eGRID files. The
nonbaseload emission rates are sometimes used as an estimate to determine the emissions that could
be avoided through projects that displace marginal fossil fuel generation, such as energy efficiency
and/or renewable energy.
Capacity factor is used as a surrogate for determining the amount of nonbaseload generation and
emissions that occur at each plant. While there are other factors that can influence a particular unit’s
capacity factor besides dispatch or load order (e.g. maintenance and repairs), capacity factor is used
as a surrogate for dispatch-order for this calculation. The nonbaseload information is published in
eGRID at the aggregate level (state, balancing authority, eGRID subregion, NERC region, and the
US), but not for individual plants.
The nonbaseload emission rates are determined based on the plant-level capacity factor. All
generation and emissions at plants with a low capacity factor (less than 0.2) are considered
nonbaseload and are assigned a non-baseload factor of 1. Plants with a capacity factor greater than 0.8
are considered baseload and are assigned a non-baseload factor of 0. For plants with a capacity factor
between 0.2 and 0.8, we use a linear relationship to determine the percent of generation and emissions
that is nonbaseload:
To aggregate the nonbaseload generation and emissions, the plant-level generation and emissions are
multiplied by the nonbaseload factor and summed to the state, balancing authority, eGRID subregion,
NERC region, and US levels. The aggregated nonbaseload emissions and generation are used to
calculate the nonbaseload output emission rates.
While nonbaseload rates can be used to estimate the emissions reductions associated with projects
that displace electricity generation, such as energy efficiency and/or renewable energy, these rates
should not be used for assigning an emission value for electricity use in carbon-footprinting exercises
or GHG emissions inventory efforts. Rather, eGRID subregion-level total output emission rates are
recommended for estimating emissions associated with electricity use (scope 2 emissions).
Combustion Emission Rates
Combustion output emission rates for all pollutants are estimated at the plant level and higher levels
of aggregation. Combustion fuel-based output emissions rates are calculated by dividing total plant
emissions by the combustion net generation for that plant. Generation from non-combustion sources,
such as nuclear, hydro, geothermal, solar, and wind will not be included in the calculation of this rate.
SPECIFIC eGRID IDENTIFIER CODES, NAME CHANGES AND ASSOCIATIONS
Technical Support Document for eGRID2016 ▌pg. 26
3.2 Determination of Plant Primary Fuel
The primary fuel of a plant is determined solely by the fuel that has the maximum heat input in the
Unit file.
For plants that do not consume any combustible fuel, the primary “fuel” is determined by the
nameplate capacity of the units at the plant. The fuel from the unit with the highest nameplate
capacity is used as the primary fuel.
See Section 5 for a description of all possible unit and plant primary fuel codes.
The EIA-923 includes solid waste plants as two fuel codes: municipal solid waste – biomass (MSB)
and municipal solid waste – non-biomass (MSN). The EIA-860 only lists municipal solid waste under
one code (MSW). In eGRID2016 the MSW fuel code is the only fuel code used for municipal solid
waste in the Unit, Generator, and Plant files. While the MSB/MSN EIA-923 fuel information is used
to calculate biomass adjusted emissions, these fuel codes are not listed in eGRID2016. See Section
3.1.2.1 for a discussion of the biomass adjustment methodology (EIA, 2017b).
3.3 Estimation of Resource Mix
The resource mix is the collection of nonrenewable and renewable resources that are used to generate
electricity for a plant. Nonrenewable resources include fossil fuels (e.g., coal, oil, gas, and other
fossil) and nuclear energy sources; renewable energy resources include biomass, solar, wind,
geothermal, and hydro. The resource mix is determined by calculating the percentage of the total
generation that a given nonrenewable or renewable resource generated. In eGRID, the resource mix is
represented as generation, in MWh, for each nonrenewable or renewable resource category, as well as
a percentage of the total. Each category for nonrenewable and renewable resources should sum to be
100 percent. eGRID plant resource mix and net generation are derived from the EIA-923 prime
mover level data.
For cases in which there is only one fuel and its generation is negative, that fuel’s generation percent
is assigned 100%. For cases in which there are fuels with both negative and positive net generation,
the generation percentages only include the positive generation in both the denominator and
numerator.
For the three grouped aggregate categories—total net generation from nonrenewables, total net
generation from all renewables, and total net generation from renewables minus hydro—the sum of
the total net generation from nonrenewables and from all renewables equals the total net generation.
It should be noted that there are cases where the sum of the generation by fuel type does not equal the
value reported for total annual generation in eGRID. This is because the total annual generation is
calculated using a mix of generator- and prime mover-level data from the EIA-923. The calculation of
generation by fuel type uses only prime mover-level data (EIA, 2017b).
3.4 Aggregating Plant-Level Data
eGRID includes five aggregated files based on the Plant file: State, Balancing Authority (BA),
eGRID Subregion, NERC Region, and the US. The State file data are developed by summing up the
Plant file data (adjusted heat input, adjusted emissions, adjusted fuel-based emissions, net generation,

SPECIFIC eGRID IDENTIFIER CODES, NAME CHANGES AND ASSOCIATIONS
Technical Support Document for eGRID2016 ▌pg. 27
fuel-based net generation, nameplate capacity, and the plant data values needed to calculate non-
baseload emission rates), based on the state in which the plant is located. The Balancing Authority,
eGRID Subregion, and NERC Region files are developed by summing up the plant data for each of
the values for each aggregation level. However, the Balancing Authority file in eGRID2016 only
includes balancing authorities with positive generation and/or emissions. The balancing authorities
with zero generation and/or emission data have not been included in the Balancing Authority file. The
US file is developed by taking the sum of all fields for all plants from the Plant file.
Emission rates are recalculated at the state, balancing authority, eGRID subregion, NERC region, and
US levels. Non-baseload emission rates have also been included at the aggregated level. For a list of
all variables included in the aggregated files, see Sections 5.4 through 5.8.
The totals from the Plant, State, Balancing Authority, eGRID Subregion, NERC Region, and US
files’ adjusted heat input, adjusted emissions, adjusted fuel-based emissions, net generation, fuel-
based net generation, and nameplate capacity data are equal, accounting for minor differences due to
rounding.
The following sections describe three of the levels of aggregation used to summarize the data from
the Plant file, including the balancing authority, eGRID subregion, and NERC region levels.
3.4.1 Balancing Authority
A balancing authority is a portion of an integrated power grid for which a single dispatcher has
operational control of all electric generators. A balancing authority is the responsible entity that
integrates resource plans ahead of time, maintains demand and resource balance within a BA area,
and supports interconnection frequency in real time. The balancing authority dispatches generators in
order to meet an area’s needs and can also control load to maintain the load-generation balance.
Balancing authority ID codes are assigned to a plant based on the EIA-860 plant-level data and the
balancing authority names are assigned to the corresponding balancing authority ID codes based on
the EIA-861(EIA, 2017a; EIA, 2017c). In Alaska, Hawaii, and Rhode Island, isolated electric utility
systems, which are not part of an integrated power grid, have been grouped into nominal balancing
authorities titled Alaska Miscellaneous, Hawaii Miscellaneous, and Rhode Island Miscellaneous,
respectively. These three balancing authorities have an ID code of “NA” since there are no ID codes
available from EIA for these regions. Other plants with no listed balancing authority ID in the EIA-
860 plant-level data have a code of “NA” and name of “No Balancing Authority” in eGRID2016.
The balancing authority associated with a plant is reported to the EIA-860 plant-level data and used in
eGRID2016.
Since BAs are not strictly geographically based, shapefiles for mapping them are not available with
eGRID2016.
3.4.2 eGRID Subregion
eGRID subregions are identified and defined by EPA and were developed as a compromise between
NERC regions (which EPA felt were too big) and balancing authorities (which EPA felt were
generally too small). Using NERC regions and balancing authorities as a guide, the subregions were
defined to limit the import and export of electricity in order to establish an aggregated area where the

SPECIFIC eGRID IDENTIFIER CODES, NAME CHANGES AND ASSOCIATIONS
Technical Support Document for eGRID2016 ▌pg. 28
determined emission rates most accurately matched the generation and emissions from the plants
within that subregion.
A map of the eGRID subregions used for eGRID2016 is included in Appendix B. This map is
representational and shows approximate boundaries that are based on electrical grid attributes, not on
strict geographical boundaries.7
The 26 eGRID subregions are subsets of the NERC regions as configured in December 2010. The
eGRID subregions themselves have not changed substantially since eGRID2000. Note, however, that
some plants operating in each eGRID subregion can change from year to year. An eGRID subregion
is often, but not always, equivalent to an Integrated Planning Model (IPM) subregion.
Plants are assigned to eGRID subregions in a multi-step process using NERC regions, balancing
authorities (BAs), Transmission IDs, utility IDs, and NERC assessment data as a guide. First, there
are two NERC regions that are located entirely within an eGRID subregion. Plants in NERC regions
TRE (within eGRID subregion ERCT) and FRCC (within eGRID subregion FRCC) are directly
assigned the corresponding eGRID subregion. About 10% of the plants are assigned using only the
NERC region as a guide. Second, plants in BAs where the entire BA is located within the boundaries
of an eGRID subregion are assigned accordingly (e.g., BA CISO is entirely within the boundaries of
eGRID subregion CAMX). There are 59 BAs that have a one-to-one match with eGRID subregions.
After the second step, about half of the plants are assigned to an eGRID subregion. The third step
uses the Transmission ID for each plant, reported in the EIA-860, in combination with their BA, to
identify eGRID subregions for the remaining nine BAs that do not have a one-to-one match with an
eGRID subregion. About 99% of the plants are assigned an eGRID subregion after step three. There
are some plants that do not report Transmission ID or where the Transmission ID and BA span
multiple eGRID subregions so an additional step using Utility ID, reported in the EIA-860, is used to
identify additional eGRID subregion matches. After this fourth step, all but about 0.5% of the plants
have been assigned. The last step in the process uses Long Term Reliability Assessment data,
received from NERC, to assign additional plants to eGRID subregions based on the NERC
assessment area. After completing these five steps, in eGRID2016 there was only one plant, the New
Melones plant in CA (ORIS 6158), that was not assigned to an eGRID subregion. The historical
assignment (CAMX) was retained for this plant.
The 26 eGRID subregion names and their acronyms for eGRID are displayed in Table 3-3.
Table 3-3. eGRID Subregion Acronym and Names for eGRID
eGRID Subregion eGRID Subregion Name
FRCC FRCC All
MROE MRO East
MROW MRO West
7 Note that some areas may fall into multiple eGRID subregions due to the fact that they are supplied by
multiple electricity providers. Visit Power Profiler (https://www.epa.gov/energy/power-profiler) for more
information on determining the eGRID subregion for a given area.

SPECIFIC eGRID IDENTIFIER CODES, NAME CHANGES AND ASSOCIATIONS
Technical Support Document for eGRID2016 ▌pg. 29
eGRID Subregion eGRID Subregion Name
NEWE NPCC New England
NYCW NPCC NYC/Westchester
NYLI NPCC Long Island
NYUP NPCC Upstate NY
RFCE RFC East
RFCM RFC Michigan
RFCW RFC West
SRMW SERC Midwest
SRMV SERC Mississippi Valley
SRSO SERC South
SRTV SERC Tennessee Valley
SRVC SERC Virginia/Carolina
SPNO SPP North
SPSO SPP South
CAMX WECC California
NWPP WECC Northwest
RMPA WECC Rockies
AZNM WECC Southwest
ERCT ERCOT All
AKGD ASCC Alaska Grid
AKMS ASCC Miscellaneous
HIOA HICC Oahu
HIMS HICC Miscellaneous
3.4.3 NERC Region
NERC region refers to a region designated by the North American Electric Reliability Corporation
(NERC). Each NERC region listed in eGRID represents one of ten regional portions of the North
American electricity transmission grid: eight in the contiguous United States, plus Alaska and Hawaii
(which are not part of the formal NERC regions, but are considered so in eGRID). Note that some
plants can change NERC region from year to year. The ten NERC region names and their acronyms
for eGRID are displayed in Table 3-4.
Although some NERC regions include portions of Canada and/or Mexico that are integrated with
U.S. grids, eGRID aggregation data are limited to generation within the U.S.
A representation of the NERC region map used for eGRID is included in Figure B-2 in Appendix B.
This map is representational and shows approximate boundaries that are not based on strict
geographical boundaries.
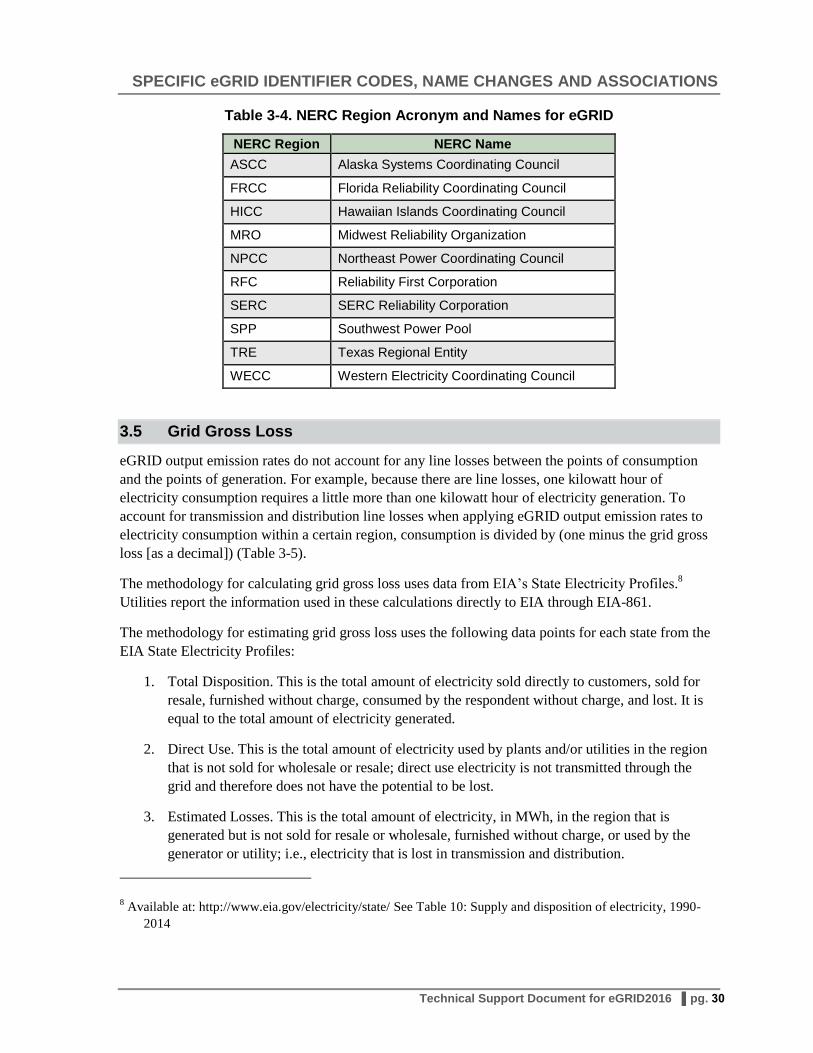
SPECIFIC eGRID IDENTIFIER CODES, NAME CHANGES AND ASSOCIATIONS
Technical Support Document for eGRID2016 ▌pg. 30
Table 3-4. NERC Region Acronym and Names for eGRID
NERC Region NERC Name
ASCC Alaska Systems Coordinating Council
FRCC Florida Reliability Coordinating Council
HICC Hawaiian Islands Coordinating Council
MRO Midwest Reliability Organization
NPCC Northeast Power Coordinating Council
RFC Reliability First Corporation
SERC SERC Reliability Corporation
SPP Southwest Power Pool
TRE Texas Regional Entity
WECC Western Electricity Coordinating Council
3.5 Grid Gross Loss
eGRID output emission rates do not account for any line losses between the points of consumption
and the points of generation. For example, because there are line losses, one kilowatt hour of
electricity consumption requires a little more than one kilowatt hour of electricity generation. To
account for transmission and distribution line losses when applying eGRID output emission rates to
electricity consumption within a certain region, consumption is divided by (one minus the grid gross
loss [as a decimal]) (Table 3-5).
The methodology for calculating grid gross loss uses data from EIA’s State Electricity Profiles.8
Utilities report the information used in these calculations directly to EIA through EIA-861.
The methodology for estimating grid gross loss uses the following data points for each state from the
EIA State Electricity Profiles:
1. Total Disposition. This is the total amount of electricity sold directly to customers, sold for
resale, furnished without charge, consumed by the respondent without charge, and lost. It is
equal to the total amount of electricity generated.
2. Direct Use. This is the total amount of electricity used by plants and/or utilities in the region
that is not sold for wholesale or resale; direct use electricity is not transmitted through the
grid and therefore does not have the potential to be lost.
3. Estimated Losses. This is the total amount of electricity, in MWh, in the region that is
generated but is not sold for resale or wholesale, furnished without charge, or used by the
generator or utility; i.e., electricity that is lost in transmission and distribution.
8 Available at: http://www.eia.gov/electricity/state/ See Table 10: Supply and disposition of electricity, 1990-
2014

SPECIFIC eGRID IDENTIFIER CODES, NAME CHANGES AND ASSOCIATIONS
Technical Support Document for eGRID2016 ▌pg. 31
These data are reported at the state level by EIA. We aggregate them to the NERC Interconnect level
(Eastern, Western, ERCOT (Texas), as well as the states of Alaska and Hawaii, and the entire U.S.).
State boundaries, however, do not perfectly correspond to Interconnect boundaries. Four states
(Montana, Nebraska, New Mexico, and South Dakota) have generation in two Interconnects, and one
state (Texas) has generation in three Interconnects. For these states, we distributed the data from the
State Electricity Profiles based on the proportion of generation from these states in each Interconnect
from the EIA-923 (EIA, 2017b).
The aggregated data are then used to calculate grid gross loss as follows:
The eGRID2016 estimated grid gross loss percentages for each U.S. interconnect power grid are
included in the file called “GGL14” in the eGRID workbook and are also displayed in Table 3-5.
Table 3-5. eGRID2016 Grid Gross Loss (%)
Power Grid Grid Gross Loss (%)
Eastern 4.49%
Western 4.23%
ERCOT 4.89%
Alaska 5.25%
Hawaii 5.35%
U.S. 4.48%

SPECIFIC eGRID IDENTIFIER CODES, NAME CHANGES AND ASSOCIATIONS
Technical Support Document for eGRID2016 ▌pg. 32
4. Specific eGRID Identifier Codes, Name Changes, and
Associations
4.1 Plant Level
Some changes to EIA ORISPL ID codes are made in eGRID2016 to better reflect the EPA/CAMD
data. Also, some EIA plants are combined into single plants to reflect EPA/CAMD data.
The plants ArcelorMittal Indiana Harbor West and Indiana Harbor E 5 AC Station (ORISPL
10397 and 54995, respectively) are combined and the ORISPL changed to 10474 to match
with the EPA/CAMD plant ArcelorMittal USA – Indiana Harbor East.
The plants Sundevil Power Holdings – Gila River and Gila River Power Block 3 (ORISPL
59338 and 59784, respectively) are combined and the ORISPL changed to 55306 to match
with the EPA/CAMD plant Gila River Power Station.
A table of ORISPL ID code changes can be found in Table C-5 in Appendix C.

DESCRIPTION OF DATA ELEMENTS
Technical Support Document for eGRID2016 ▌pg. 33
5. Description of Data Elements
eGRID2016 has 8 aggregation files: UNIT (unit), GEN (generator), PLNT (plant), ST (state), BA
(Balancing Authority), SRL (eGRID subregion), NRL (NERC region), and the US (United States
total). eGRID2016 also includes the regional grid gross loss factor data. Appendix A provides the file
structure for eGRID2016, which includes variable descriptions and original data sources. Note that
definitions for similar variables are not repeated after the description in the Plant file. For example, in
the Plant file, the net generation in MWh is defined at the plant level for the data element
PLNGENAN. For each subsequent file, the net generation, XXNGENAN (where XX is ST, BA, SR,
NR, or the US) is not defined; it is simply the sum of PLNGENAN attributed to the aggregation
entity.
Note that values reported as 0 in eGRID are reported as 0 in the original data files. Values reported as
blank in eGRID are either reported as blank in the original data files or are not included in the original
data files. The following data element descriptions apply to fields in both the English unit and metric
unit workbooks, but the descriptions below only are only represented in English units.
5.1 The UNIT (Unit) File
There are 28 variables in the Unit file, which contains unit-level data.
1. eGRID2016 Unit File Sequence Number (SEQUNT16) – Unit-level records in the 2014 2016 data file are sorted by state abbreviation, plant
name, plant code, and unit ID, and are assigned a unique sequential number
beginning with 1. This sequence number is unlikely to be the same as the sequence
number in the eGRID2012 eGRID2014 file for the same entity.
2. Plant State Abbreviation (PSTATABB) – The state abbreviation of the state in which the plant is located.
Source: EIA-860
3. Plant Name (PNAME) – The name associated with each plant.
Source: EPA/CAMD; EIA-860
4. DOE/EIA ORIS Plant or Facility Code (ORISPL) – This plant code corresponds to PNAME and was originally developed for power
plants by the Office of Regulatory Information Systems (ORIS), which was a part of
the Federal Power Commission. It is now assigned by EIA and is used as a unique
plant identification code for many EPA electric power databases. Note that some
EIA ORISPL ID codes were changed to reflect EPA/CAMD ORISPL ID codes. See
Section 4.1 for a discussion of ORISPL ID changes made to eGRID2016. See
Appendix C for a table of all ORISPL changes made between EIA and EPA/CAMD.
Source: EPA/CAMD; EIA-860
5. Unit ID (UNITID) – The unit ID for the unit that produces the emissions.
Source: EPA/CAMD, EIA-923

DESCRIPTION OF DATA ELEMENTS
Technical Support Document for eGRID2016 ▌pg. 34
6. Prime Mover (PRMVR) – The unit’s electric prime mover type.
Possible values are:
BA = Battery energy storage
BT = Binary cycle turbine
CA = Combined cycle steam turbine
CC = Combined cycle - total unit
CE = Compressed air energy storage
CP = Concentrated solar power energy storage
CS = Combined cycle - single shaft
CT = Combined cycle combustion turbine
FC = Fuel cell
FW = Flywheel energy storage
GT = Combustion (gas) turbine
HA = Hydrokinetic turbine - axial flow
HY = Hydroelectric turbine
IC = Internal combustion engine (diesel)
OT = Other turbine
PS = Hydraulic turbine - reversible (pumped storage)
PV = Photovoltaic
ST = Steam turbine (boiler, nuclear, geothermal, and solar steam)
WS = Wind turbine - offshore
WT = Wind turbine - onshore
Source: EIA-860
7. Unit Operational Status (UNTOPST) –
The unit’s operational status in 2016. Possible values are:
IP = Planned new generator canceled, indefinitely postponed, or no longer in
resource plan
L = Regulatory approvals pending (not under construction)
OA = Out of service (returned or will be returned to service)
OP = Operating – in service
OS = Out of service (not expected to be returned to service)
OT = Other
P = Planned for installation but regulatory approvals not initiated (not under
construction)
RE = Retired – no longer in service
SB = Stand-by (long-term storage)
T = Regulatory approvals received (not under construction)
TS = Testing, construction complete, but not yet in commercial operation

DESCRIPTION OF DATA ELEMENTS
Technical Support Document for eGRID2016 ▌pg. 35
U = Under construction, less than 50% constructed
V = Under construction, more than 50% constructed
Source: EPA/CAMD, EIA-860
8. Clean Air Markets Division (CAMD) Program Flag (CAMDFLAG) – Indicates if the unit reported 2016 EPA/CAMD emissions and operation data to
comply with either the Cross-State Air Pollution Rule or the Acid Rain Program. See
https://www.epa.gov/airmarkets/clean-air-markets-programs for additional
information.
Source: EPA/CAMD
9. Program Codes (PRGCODE) – The programs, as reported to EPA/CAMD, that the unit was subject to in 2016.
Values may be combined and separated by commas. The individual values are:
ARP = Acid Rain Program
CSNOX = Cross-State Air Pollution Rule for NOx (annual)
CSNOXOS = Cross State Air Pollution Rule for NOx (ozone season)
CSSO2G1, CSSO2G2 = Cross-State Air Pollution Rule for SO2 (Group 1, Group 2)
MATS = Mercury and Air Toxics Standards
NHNOX = New Hampshire’s special NOx program
RGGI = Regional Greenhouse Gas Initiative
SIPNOX = NOx SIP Call
See https://www.epa.gov/airmarkets/clean-air-markets-programs for additional
information.
Source: EPA/CAMD
10. Unit Bottom and Firing Type (BOTFIRTY) – The unit firing type
Possible values are:
= Blank
ARCH = Arch firing
CC = Combined cycle
CELL = Cell
CT = Combustion turbine
CYCLONE = Cyclone firing
DUCTBURNER = Ductburner
FLUIDIZED = Fluidized bed firing
IGC = Integrated gasification combined cycle
OTHER BOILER = Other boiler
OTHER TURBINE = Other turbine
PROCESS = Refinery process heater
STOKER = Stoker, spreader, vibrating grate, or slinger boiler
TANGENTIAL = Tangential, concentric, or corner-fired boiler
TURBO = Turbo

DESCRIPTION OF DATA ELEMENTS
Technical Support Document for eGRID2016 ▌pg. 36
VERTICAL = Vertically-fired boiler
VERTICAL/ARCH = Vertical or arch firing
WALL = Wall-fired boiler
Source: EPA/CAMD, EIA-860
11. Number of Associated Generators (NUMGEN) – The number of generators associated with each EIA-860 boiler in the file.
Source: EIA-860
12. Unit Primary Fuel (FUELU1) – The primary fuel determined from EIA-923 boiler or generator reported data or the
primary fuel reported to EPA/CAMD.
Possible values are:
AB = Agricultural byproduct
BFG = Blast furnace gas
BIT = Bituminous coal
BLQ = Black liquor
COG = Coke oven gas
DFO = Distillate fuel oil, light fuel oil, diesel oil
GEO = Geothermal
H = Hydrogen
JF = Jet fuel
KER = Kerosene
LFG = Landfill gas
LIG = Lignite coal
MSW = Municipal solid waste
MWH = Electricity used for energy storage (megawatt hour)
NG = Natural gas
NUC = Nuclear
OBG = Other biomass gas (digester gas, methane, and other biomass gases)
OBL = Other biomass liquids
OBS = Other biomass solid
OG = Other gas
OO = Other oil
OTH = Other
PC = Petroleum coke
PG = Gaseous propane
PRG = Process gas
PUR = Purchased steam
RC = Refined coal
RFO = Residual fuel oil, heavy fuel oil, petroleum
RG = Refinery gas
SGC = Coal-derived synthetic gas
SLW = Sludge waste
SUB = Subbituminous coal
SUN = Solar
TDF = Tire-derived fuel
WAT = Water

DESCRIPTION OF DATA ELEMENTS
Technical Support Document for eGRID2016 ▌pg. 37
WC = Waste coal
WDL = Wood, wood waste liquid
WDS = Wood, wood waste solid
WH = Waste heat
WND = Wind
WO = Waste oil
Source: EPA/CAMD, EIA-923, EIA-860
13. Unit Operating Hours (HRSOP) – The number of hours that an EPA/CAMD unit reported operating during the year.
Source: EPA/CAMD
14. Unit Unadjusted Annual Heat Input (HTIEAN) – The unit’s unadjusted annual total heat input, in MMBtu, based on the values
reported to EPA/CAMD or calculated using EIA-923 unit data.
Source: EPA/CAMD; EIA-923
15. Unit Unadjusted Ozone Season Heat Input (HTIEOZ) – The unit’s unadjusted ozone season (May through September) heat input, in MMBtu,
based on the values reported to EPA/CAMD or calculated using EIA-923 unit data.
Source: EPA/CAMD; EIA-923
16. Unit Unadjusted Annual NOx Emissions (NOXEAN) – The unit’s unadjusted NOx emissions, in short tons, based on the values reported to
EPA/CAMD or calculated using EIA-923 unit data and unit-specific emissions rates
or the emission factors listed in Appendix C.
Source: EPA/CAMD; EIA-923
17. Unit Unadjusted Ozone Season NOx Emissions (NOXEOZ) – The unit’s unadjusted ozone season (May through September) NOx emissions, in
short tons, based on values reported to EPA/CAMD or calculated using EIA-923 unit
data and unit-specific ozone-season emissions rates or the emission factors listed in
Appendix C.
Source: EPA/CAMD; EIA-923
18. Unit Unadjusted Annual SO2 Emissions (SO2EAN) – The unit’s unadjusted annual SO2 emissions, in short tons, based on the values
reported to EPA/CAMD or calculated using EIA-923 unit data and the emission
factors listed in Appendix C. When not available, it is zero.
Source: EPA/CAMD; EIA-923
19. Unit Unadjusted Annual CO2 Emissions (CO2EAN) – The unit’s unadjusted annual CO2 emissions, in short tons, based on the values
reported to EPA/CAMD or calculated using EIA-923 unit data and emission factors
listed in Appendix C.
Source: EPA/CAMD; EIA-923

DESCRIPTION OF DATA ELEMENTS
Technical Support Document for eGRID2016 ▌pg. 38
20. Source of Annual Heat Input Data
Identifies the annual heat input data source.
Source: EPA/CAMD; EIA-923
21. Source of Ozone Season Heat Input Data
Identifies the ozone season heat input data source.
Source: EPA/CAMD; EIA-923
22. Source of Annual NOx Emissions Data
Identifies the annual NOx emissions data source.
Source: EPA/CAMD; EIA-923
23. Source of Ozone Season NOx Emissions Data
Identifies the ozone-season NOx emissions data source.
Source: EPA/CAMD; EIA-923
24. Source of Annual SO2 Emissions Data
Identifies the annual SO2 emissions data source.
Source: EPA/CAMD; EIA-923
25. Source of Annual CO2 Emissions Data
Identifies the annual CO2 emissions data source.
Source: EPA/CAMD; EIA-923
26. Unit SO2 (Scrubber) First Control Device (SO2CTLDV) – The first reported SO2 control device. Values may be combined and separated by
commas.
Possible values are:
= blank
ACI = Activated carbon injection system
CD = Circulating dry scrubber
DA = Dual alkali
DL = Dry lime flue gas desulfurization unit
DSI = Dry sorbent (powder) injection type
FBL = Fluidized bed
JB = Jet bubbling reactor (wet) scrubber
LIJ = Lime injection
MA = Mechanically aided type (wet) scrubber
MO = Magnesium oxide
O = Other (EPA/CAMD)
OT = Other equipment (EIA-860)
PA = Packed type (wet) scrubber
SB = Sodium based
SD = Spray dryer type/dry FGD/semi-dry FGD
SP = Spray type (wet) scrubber
TR = Tray type (wet) scrubber
VE = Venturi type (wet) scrubber
WL = Wet lime flue gas desulfurization unit
WLS = Wet limestone

DESCRIPTION OF DATA ELEMENTS
Technical Support Document for eGRID2016 ▌pg. 39
Source: EPA/CAMD, EIA-860
27. Unit NOx First Control Device (NOXCTLDV) – The first reported NOx control device. Values may be combined and separated by
commas.
Possible values are:
= Blank
CM = Combustion modification/fuel reburning
DLNB = Dry low NOx premixed technology
H2O = Water injection
LNB = Low NOx burner
LNBO = Low NOx burner with overfire air
LNC1 = Low NOx burner technology with close-coupled overfire air
LNC2 = Low NOx burner technology with separated OFA
LNC3 = Low NOx burner technology with close-coupled and separated
overfire air
LNCB = Low NOx burner technology for cell burners
NH3 = Ammonia injection
O = Other
OFA = Overfire air
SCR = Selective catalytic reduction (EPA/CAMD)
SNCR = Selective noncatalytic reduction
SR = Selective catalytic reduction (EIA-860)
STM = Steam injection
Source: EPA/CAMD
28. Unit Hg Activated Carbon Injected System Flag (HGCTLDV) – The activated carbon injection mercury control flag.
Source: EIA-860
29. Unit Year On-Line (UNTYRONL) – The four-digit year the unit came on-line.
Source: EPA/CAMD, EIA-860
5.2 The GEN (Generator) File
There are 16 variables in the second file, GEN, which contains generator level data. This file includes
generation from steam boilers and nuclear units in the EIA-923, plant prime movers in the EIA-923
that have only one generator in the EIA-860, and the EIA-923 plant prime movers where generation is
distributed to the generator level based on nameplate capacity.
1. eGRID2016 File Generator Sequence Number (SEQGEN16) – The generator records in the 2016 generator data file are sorted by state abbreviation,
plant name, plant code, and generator ID, and are assigned a unique sequential
number beginning with 1. This sequence number is unlikely to be the same as the
sequence number in the eGRID2014 file for the same entity.

DESCRIPTION OF DATA ELEMENTS
Technical Support Document for eGRID2016 ▌pg. 40
2. Plant State Abbreviation (PSTATABB) – The state abbreviation in which the plant is located.
Source: EIA-860
3. Plant Name (PNAME) – The name associated with each plant.
Source: EPA/CAMD; EIA-860
4. DOE/EIA ORIS Plant or Facility Code (ORISPL) – This plant code was developed for power plants by the Office of Regulatory
Information Systems (ORIS), which was a part of the Federal Power Commission. It
is now assigned by EIA and is used as a unique plant identification code for many
EPA electric power databases. Note that some EIA ORISPL ID codes were changed
to reflect EPA/CAMD ORISPL ID codes. See Section 4.1 for a discussion of
ORISPL ID changes made to eGRID2016. See Table C-5 in Appendix C for a table
of all ORISPL changes made between EIA and EPA/CAMD.
Source: EPA/CAMD; EIA-860
5. Generator ID (GENID) – The electrical generation unit (generator) at a plant. In the majority of cases, there is a
one-to-one correspondence with the boiler ID if it is a steam generator.
Sources: EIA-860
6. Number of Associated Boilers (NUMBLR) – The number of EIA-860 boilers associated with each generator in the file.
Sources: EIA-860
7. Generator Status (GENSTAT) – The reported generator status at the end of 2016.
Possible values are:
CN = Cancelled (previously reported as “planned”)
IP = Planned new generator canceled, indefinitely postponed, or no longer in
resource plan
L = Regulatory approvals pending (not under construction)
OA = Out of service (returned or will be returned to service)
OP = Operating – in service
OS = Out of service (not expected to be returned to service)
OT = Other
P = Planned for installation but regulatory approvals not initiated (not under
construction)
RE = Retired – no longer in service
SB = Stand-by (long-term storage)
T = Regulatory approvals received (not under construction)
TS = Testing, construction complete, but not yet in commercial operation
U = Under construction, less than 50% constructed
V = Under construction, more than 50% constructed
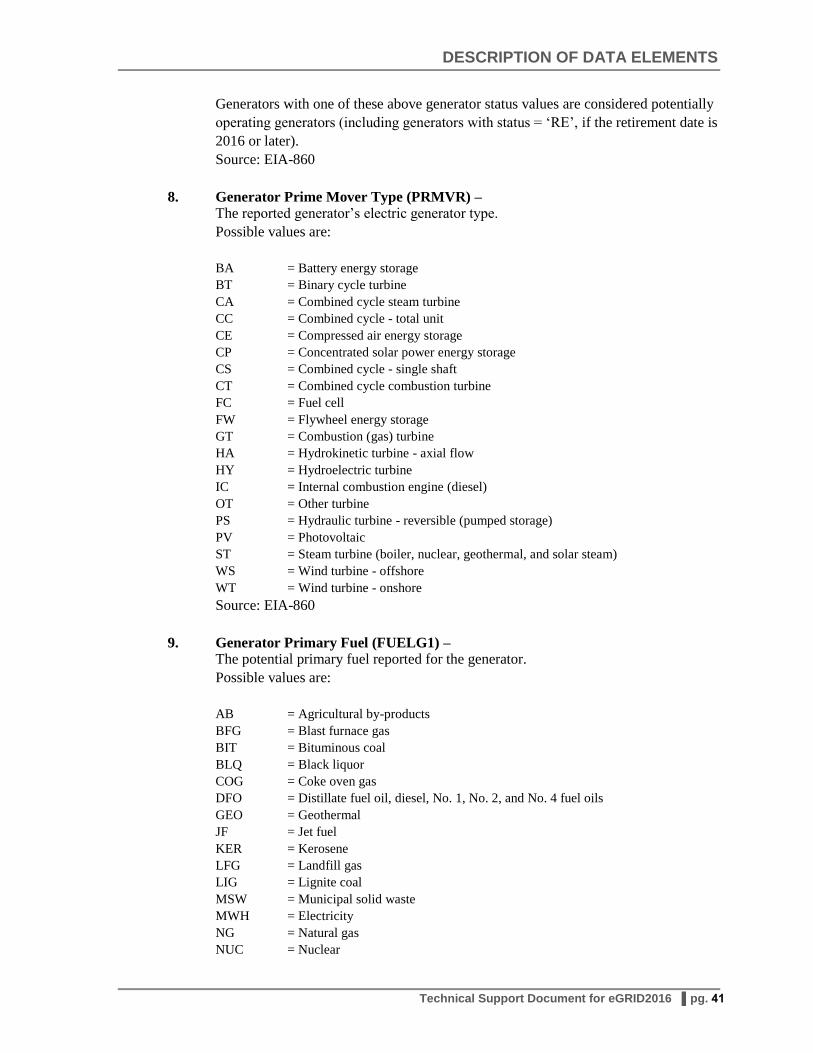
DESCRIPTION OF DATA ELEMENTS
Technical Support Document for eGRID2016 ▌pg. 41
Generators with one of these above generator status values are considered potentially
operating generators (including generators with status = ‘RE’, if the retirement date is
2016 or later).
Source: EIA-860
8. Generator Prime Mover Type (PRMVR) – The reported generator’s electric generator type.
Possible values are:
BA = Battery energy storage
BT = Binary cycle turbine
CA = Combined cycle steam turbine
CC = Combined cycle - total unit
CE = Compressed air energy storage
CP = Concentrated solar power energy storage
CS = Combined cycle - single shaft
CT = Combined cycle combustion turbine
FC = Fuel cell
FW = Flywheel energy storage
GT = Combustion (gas) turbine
HA = Hydrokinetic turbine - axial flow
HY = Hydroelectric turbine
IC = Internal combustion engine (diesel)
OT = Other turbine
PS = Hydraulic turbine - reversible (pumped storage)
PV = Photovoltaic
ST = Steam turbine (boiler, nuclear, geothermal, and solar steam)
WS = Wind turbine - offshore
WT = Wind turbine - onshore
Source: EIA-860
9. Generator Primary Fuel (FUELG1) – The potential primary fuel reported for the generator.
Possible values are:
AB = Agricultural by-products
BFG = Blast furnace gas
BIT = Bituminous coal
BLQ = Black liquor
COG = Coke oven gas
DFO = Distillate fuel oil, diesel, No. 1, No. 2, and No. 4 fuel oils
GEO = Geothermal
JF = Jet fuel
KER = Kerosene
LFG = Landfill gas
LIG = Lignite coal
MSW = Municipal solid waste
MWH = Electricity
NG = Natural gas
NUC = Nuclear
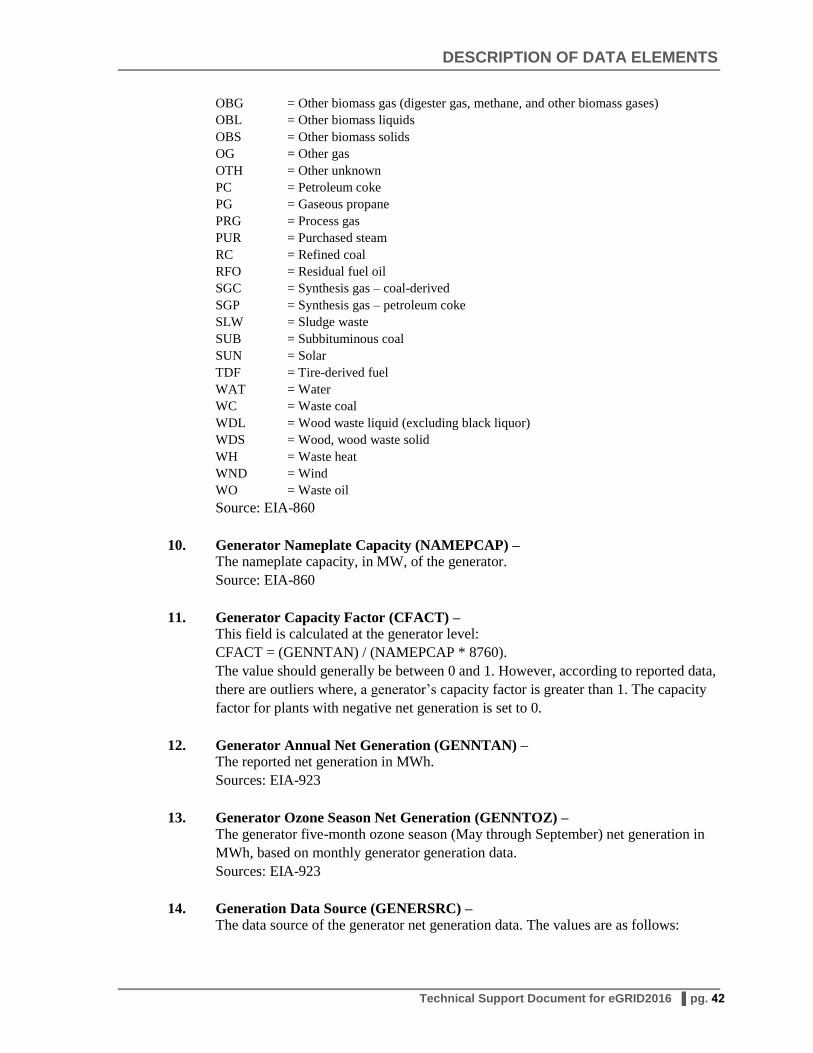
DESCRIPTION OF DATA ELEMENTS
Technical Support Document for eGRID2016 ▌pg. 42
OBG = Other biomass gas (digester gas, methane, and other biomass gases)
OBL = Other biomass liquids
OBS = Other biomass solids
OG = Other gas
OTH = Other unknown
PC = Petroleum coke
PG = Gaseous propane
PRG = Process gas
PUR = Purchased steam
RC = Refined coal
RFO = Residual fuel oil
SGC = Synthesis gas – coal-derived
SGP = Synthesis gas – petroleum coke
SLW = Sludge waste
SUB = Subbituminous coal
SUN = Solar
TDF = Tire-derived fuel
WAT = Water
WC = Waste coal
WDL = Wood waste liquid (excluding black liquor)
WDS = Wood, wood waste solid
WH = Waste heat
WND = Wind
WO = Waste oil
Source: EIA-860
10. Generator Nameplate Capacity (NAMEPCAP) – The nameplate capacity, in MW, of the generator.
Source: EIA-860
11. Generator Capacity Factor (CFACT) – This field is calculated at the generator level:
CFACT = (GENNTAN) / (NAMEPCAP * 8760).
The value should generally be between 0 and 1. However, according to reported data,
there are outliers where, a generator’s capacity factor is greater than 1. The capacity
factor for plants with negative net generation is set to 0.
12. Generator Annual Net Generation (GENNTAN) – The reported net generation in MWh.
Sources: EIA-923
13. Generator Ozone Season Net Generation (GENNTOZ) – The generator five-month ozone season (May through September) net generation in
MWh, based on monthly generator generation data.
Sources: EIA-923
14. Generation Data Source (GENERSRC) – The data source of the generator net generation data. The values are as follows:

DESCRIPTION OF DATA ELEMENTS
Technical Support Document for eGRID2016 ▌pg. 43
Blank (no generator level data)
Distributed from EIA-923 Generation and Fuel
EIA-923 Generator File
Data from EIA-923 Generator File overwritten with distributed data from EIA-923
Generation and Fuel
15. Generator Year On-Line (GENYRONL) – The four-digit year the generator came on-line.
Source: EIA-860
16. Generator Retirement Year (GENYRRET) – The four-digit year the generator retired or is planned to retire.
Source: EIA-860
5.3 The PLNT (Plant) File
There are 120 variables in the Plant file (PLNT).
1. eGRID2016 File Plant Sequence Number (SEQPLT16) – The plant records in the 2016 plant data file are sorted by state abbreviation and plant
name, and are assigned a unique sequential number beginning with 1. This sequence
number is unlikely to be the same as the sequence number in the eGRID2014 file for
the same entity.
2. Plant State Abbreviation (PSTATABB) – The state abbreviation in which the plant is located.
Source: EIA-860
3. Plant Name (PNAME) –
The name associated with each plant.
Source: EPA/CAMD; EIA-860
4. DOE/EIA ORIS Plant or Facility Code (ORISPL) – This plant code corresponds to PNAME and was originally developed for power
plants by the Office of Regulatory Information Systems (ORIS), which was a part of
the Federal Power Commission. It is now assigned by EIA and is used as a unique
plant identification code for many EPA electric power databases, too. Note that some
EIA ORISPL ID codes were changed to reflect EPA/CAMD ORISPL ID codes. See
Section 4.1 for a discussion of ORISPL ID changes made to eGRID2016. See Table
C-5 in Appendix C for a table of all ORISPL changes made between EIA and
EPA/CAMD.
Source: EPA/CAMD; EIA-860
5. Plant Operator Name (OPRNAME) – The name associated with each operating company (EGC).
Source: EIA-860
6. Plant Operator ID (OPRCODE) –
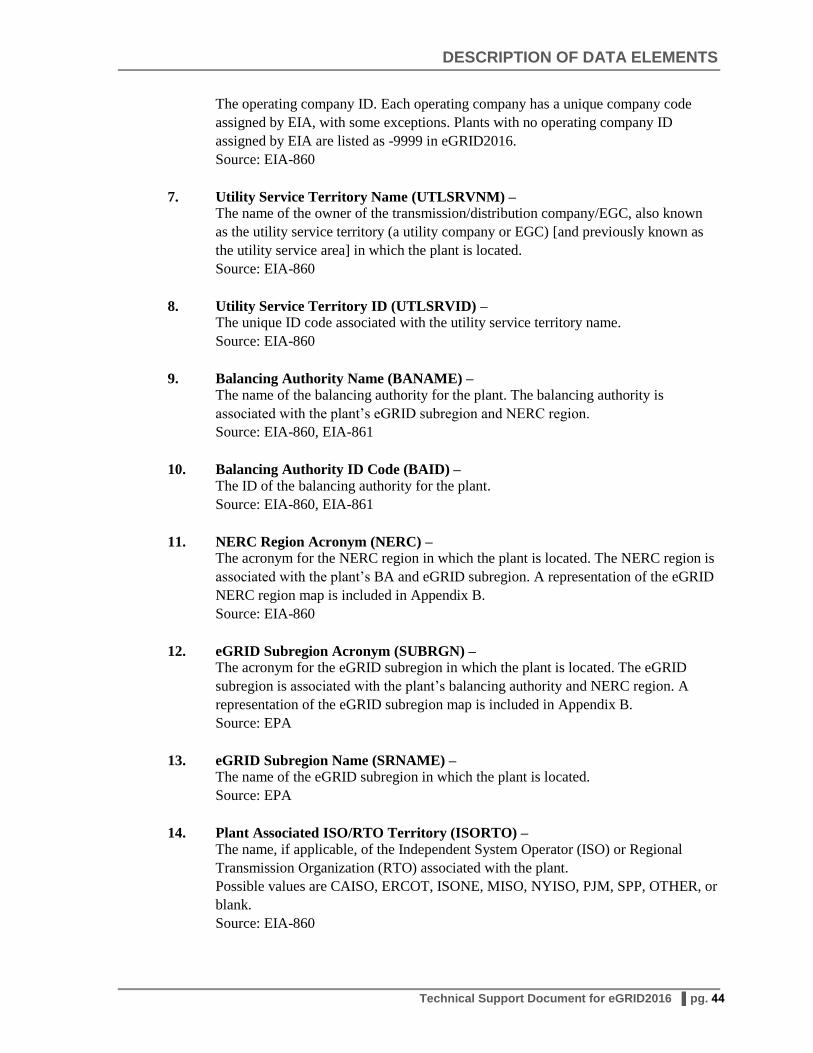
DESCRIPTION OF DATA ELEMENTS
Technical Support Document for eGRID2016 ▌pg. 44
The operating company ID. Each operating company has a unique company code
assigned by EIA, with some exceptions. Plants with no operating company ID
assigned by EIA are listed as -9999 in eGRID2016.
Source: EIA-860
7. Utility Service Territory Name (UTLSRVNM) – The name of the owner of the transmission/distribution company/EGC, also known
as the utility service territory (a utility company or EGC) [and previously known as
the utility service area] in which the plant is located.
Source: EIA-860
8. Utility Service Territory ID (UTLSRVID) – The unique ID code associated with the utility service territory name.
Source: EIA-860
9. Balancing Authority Name (BANAME) – The name of the balancing authority for the plant. The balancing authority is
associated with the plant’s eGRID subregion and NERC region.
Source: EIA-860, EIA-861
10. Balancing Authority ID Code (BAID) – The ID of the balancing authority for the plant.
Source: EIA-860, EIA-861
11. NERC Region Acronym (NERC) – The acronym for the NERC region in which the plant is located. The NERC region is
associated with the plant’s BA and eGRID subregion. A representation of the eGRID
NERC region map is included in Appendix B.
Source: EIA-860
12. eGRID Subregion Acronym (SUBRGN) – The acronym for the eGRID subregion in which the plant is located. The eGRID
subregion is associated with the plant’s balancing authority and NERC region. A
representation of the eGRID subregion map is included in Appendix B.
Source: EPA
13. eGRID Subregion Name (SRNAME) – The name of the eGRID subregion in which the plant is located.
Source: EPA
14. Plant Associated ISO/RTO Territory (ISORTO) – The name, if applicable, of the Independent System Operator (ISO) or Regional
Transmission Organization (RTO) associated with the plant.
Possible values are CAISO, ERCOT, ISONE, MISO, NYISO, PJM, SPP, OTHER, or
blank.
Source: EIA-860

DESCRIPTION OF DATA ELEMENTS
Technical Support Document for eGRID2016 ▌pg. 45
15. Plant FIPS State Code (FIPSST) – The two-digit Federal Information Processing Standards (FIPS) state character code
of the state in which the plant is located. The codes are from the National Institute of
Standards and Technology (US Census, 2016).
Source: US Census
16. Plant FIPS County Code (FIPSCNTY) – The three digit FIPS county character code of the county in which the plant is
located. The codes are from the National Institute of Standards and Technology (US
Census, 2016).
Source: US Census
17. Plant County Name (CNTYNAME) – The name of the county in which the plant is located.
Source: EIA-860
18. Plant Latitude (LAT) – The latitude, in degrees to four decimal places, associated with the plant.
Source: EIA-860
19. Plant Longitude (LON) – The longitude, in degrees to four decimal places, associated with the plant.
Source: EIA-860
20. Number of Boilers (NUMBLR) – The number of operating boilers or turbines within a plant.
Source: EIA-860
21. Number of Generators (NUMGEN) – The number of potentially operating generators within a plant.
Source: EIA-860
22. Plant Primary Fuel (PLPRMFL) – The plant’s primary fuel based on maximum heat input of fuel consumed by the
plant. If the plant does not consume fuel, it is based on the maximum nameplate
capacity. Possible values are:
AB = Agricultural byproduct
BFG = Blast furnace gas
BIT = Bituminous coal
BLQ = Black liquor
COG = Coke oven gas
DFO = Distillate fuel oil, light fuel oil, diesel oil
GEO = Geothermal steam
H = Hydrogen
JF = Jet fuel
KER = Kerosene
LFG = Landfill gas

DESCRIPTION OF DATA ELEMENTS
Technical Support Document for eGRID2016 ▌pg. 46
LIG = Lignite coal
MSW = Municipal solid waste
MWH = Electricity used for energy storage (megawatt hour)
NG = Natural gas
NUC = Nuclear material
OBG = Other biomass gas
OBL = Other biomass liquid
OBS = Other biomass solid
OG = Other gas
OTH = Other (unknown)
PC = Petroleum coke
PRG = Process gas
PUR = Purchased fuel (unknown)
RC = Refined coal
RFO = Residual fuel oil, heavy fuel oil, petroleum
SGC = Coal-derived synthetic gas
SLW = Sludge waste
SUB = Subbituminous coal
SUN = Sun
TDF = Tire-derived fuel
WAT = Water
WC = Waste coal
WDL = Wood, wood waste liquid
WDS = Wood, wood waste solid
WH = Waste heat
WND = Wind
WO = Waste oil
Source: EPA/CAMD; EIA-860
23. Plant Primary Fuel Category (PLFUELCT) – The fuel category for the primary fuel of the plant. This field is “COAL” if the
plant’s primary fuel is derived from coal (fuel type = BIT, COG, LIG, RC, SGC,
SUB, WC), “OIL” if it is derived from oil (DFO, JF, KER, PC, RFO, WO), “GAS” if
it is derived from gas (BU, NG, PG), “OFSL” if it is another fossil fuel (BFG, OG,
TDF), “NUCLEAR” if it is derived from nuclear (NUC), “HYDRO” if it is derived
from hydro power (WAT), “SOLAR” if it is derived from solar power, (SUN),
“WIND” if it is derived from wind power (WND), “GEOTHERMAL” if it is derived
from geothermal power (GEO), “OTHF” if it is derived from waste
heat/unknown/purchased (MWH, OTH, PRG, PUR, WH), and “BIOMASS” if it is
derived from biomass sources (AB, BLQ, LFG, MSW, OBG, OBL, OBS, SLW,
WDL, WDS).
24. Flag indicating if the plant burned or generated any amount of coal
(COALFLAG) –
A flag to indicate if the plant burned coal or if it has positive heat input and generated
electricity from coal. The plant will not be flagged if the plant has negative coal
generation and no coal heat input for 2016.
25. Plant Capacity Factor (CAPFAC) –

DESCRIPTION OF DATA ELEMENTS
Technical Support Document for eGRID2016 ▌pg. 47
The plant capacity factor, expressed with four decimal places. It is calculated as
follows:
CAPFAC = (PLNGENAN / (NAMEPCAP * 8760))
Although the value should be between 0 and 1, there are outliers.
26. Plant Nameplate Capacity (NAMEPCAP) – The nameplate capacity of the plant, in MW.
Source: EIA-860
27. Nonbaseload Factor (NBFACTOR) –
The proportion of generation that is considered nonbaseload generation. A value of 0
means that all of the generation is baseload generation. See Section 3 for more
information.
Source: Calculated
28. Biogas/Biomass Plant Adjustment Flag (RMBMFLAG) – A biogas (landfill gas, digester gas)/biomass adjustment flag used to indicate where
emissions are adjusted for plants using biogas or biomass fuels. A facility’s emissions
reported in eGRID may be different from that reported in other EPA sources, such as
EPA/CAMD’s emissions data, due to this adjustment.
29. Combined Heat and Power (CHP) Plant Adjustment Flag (CHPFLAG) – A flag to indicate if the plant is a CHP facility. A CHP facility’s emissions and heat
input reported in eGRID may be different from that reported in other EPA sources,
such as EPA/CAMD’s emissions data, due to this adjustment.
Source: EPA/CAMD; EIA-860
30. CHP Plant Useful Thermal Output (USETHRMO) – The useful thermal output, in MMBtu, estimated for a CHP facility.
Source: EIA-923 calculated
31. CHP Plant Power to Heat Ratio (PWRTOHT) – The power to heat ratio for a CHP facility, which is the ratio of the heat value of
electricity generated (3413 * kWh output) to the facility’s useful thermal output.
32. CHP Plant Electric Allocation Factor (ELCALLOC) – The CHP plant’s decimal fraction of the emissions that are attributed to electricity. It
is derived as the ratio of the electric heat output to the sum of the electric and steam
heat outputs, where the steam output is 75% of the useful thermal output. The electric
allocation factor is used to allocate emissions from a CHP facility to both electricity
generation and useful thermal output. For non-CHP plants, eGRID uses an electric
allocation factor of 1.0.
33. Plant Pumped Storage Flag (PSFLAG) – Indicates if the plant has at least one pumped storage generator.
Source: EIA-860

DESCRIPTION OF DATA ELEMENTS
Technical Support Document for eGRID2016 ▌pg. 48
34. Plant Annual Heat Input from Combustion (PLHTIAN) – The total annual heat input from combustion, in MMBtu, for the plant. For CHP
plants, the value is adjusted by the electric allocation factor.
35. Plant Ozone Season Heat Input from Combustion (PLHTIOZ) – The five-month ozone season (May through September) heat input from combustion,
in MWh, for the plant. For CHP plants, the value is adjusted by the electric allocation
factor.
36. Plant Total Annual Heat Input (PLHTIANT) –
The total annual heat input from combustion and noncombustion units, in MMBtu,
for the plant. For CHP plants, the value is adjusted by the electric allocation factor.
37. Plant Total Ozone Season Heat Input (PLHTIOZT) – The five-month ozone season (May through September) heat input from combustion
and noncombustion units, in MWh, for the plant. For CHP plants, the value is
adjusted by the electric allocation factor.
38. Plant Annual Net Generation (PLNGENAN) – The total reported annual net generation, in MWh, for the plant, summed from the
Unit file.
Source: EIA-923
39. Plant Ozone Season Net Generation (PLNGENOZ) – The five-month ozone season (May through September) net generation for the plant.
Source: EIA-923
40. Plant Annual NOx Emissions (PLNOXAN) – The total annual NOx emissions, in short tons, for the plant. Biogas components are
adjusted. For CHP plants, the value is adjusted by the electric allocation factor. This
adjusted emissions field is estimated by first making the biogas adjustment (if it
exists) and then applying the electric allocation factor (if the plant is a CHP).
41. Plant Ozone Season NOx Emissions (PLNOXOZ) – The five-month ozone season (May through September) NOx emissions, in short tons,
for the plant. Biogas components are adjusted. For CHP plants, the value is adjusted
by the electric allocation factor. This adjusted emissions field is estimated by first
making the biogas adjustment (if it exists) and then applying the electric allocation
factor (if the plant is a CHP).
42. Plant Annual SO2 Emissions (PLSO2AN) – The total annual SO2 emissions, in short tons, for the plant. Landfill gas components
are adjusted. For CHP plants, the value is adjusted by the electric allocation factor.
This adjusted emissions field is estimated by first making the landfill gas adjustment
(if it exists) and then applying the electric allocation factor (if the plant is a CHP).

DESCRIPTION OF DATA ELEMENTS
Technical Support Document for eGRID2016 ▌pg. 49
43. Plant Annual CO2 Emissions (PLCO2AN) – The total annual CO2 emissions, in short tons, for the plant. All CO2 emissions from
biomass fuels are adjusted to zero. For CHP plants, the value is adjusted by the
electric allocation factor. This adjusted emissions field is estimated by first making
the biomass adjustment (if it exists) and then applying the electric allocation factor (if
the plant is a CHP).
44. Plant Annual CH4 Emissions (PLCH4AN) – The total annual CH4 emissions, in pounds, for the plant. Biogas biomass components
are adjusted. For CHP plants, the value is adjusted by the electric allocation factor.
This adjusted emissions field is estimated by first making the biomass adjustment (if
it exists) and then applying the electric allocation factor (if the plant is a CHP).
45. Plant Annual N2O Emissions (PLN2OAN) –
The total annual N2O emissions, in pounds for the plant. Biogas biomass components
are adjusted. For CHP plants, the value is adjusted by the electric allocation factor.
This adjusted emissions field is estimated by first making the biomass adjustment (if
it exists) and then applying the electric allocation factor (if the plant is a CHP).
46. Plant Annual CO2 Equivalent Emissions (PLCO2EQA) –
The annual CO2 equivalent emissions, in short tons, for the plant. This value is a
universal standard of measurement. The GWPs from the second IPCC assessment are
used for the calculation; the formula is as follows:
PLCO2EQA = ((1* PLCO2AN) + (21* PLCH4AN / 2000) + (310 * PLN2OAN /
2000)).
47. Plant Annual Hg Emissions (PLHGAN) – Not calculated for eGRID2016.
48. Plant Annual NOx Total Output Emission Rate (PLNOXRTA) – This field, in lb/MWh, is calculated as follows:
PLNOXRTA = 2000 * (PLNOXAN / PLNGENAN).
49. Plant Ozone Season NOx Total Output Emission Rate (PLNOXRTO) – This field, in lb/MWh, is calculated as follows:
PLNOXRTO = 2000 * (PLNOXOZ / PLNGENOZ).
50. Plant Annual SO2 Total Output Emission Rate (PLSO2RTA) – This field, in lb/MWh, is calculated as follows:
PLSO2RTA = 2000 * (PLSO2AN / PLNGENAN).
51. Plant Annual CO2 Total Output Emission Rate (PLCO2RTA) – This field, in lb/MWh, is calculated as follows:
PLCO2RTA = 2000 * (PLCO2AN / PLNGENAN).

DESCRIPTION OF DATA ELEMENTS
Technical Support Document for eGRID2016 ▌pg. 50
52. Plant Annual CH4 Total Output Emission Rate (PLCH4RTA) – This field, in lb/MWh, is calculated as follows:
62. Plant Ozone Season NOx Combustion Output Emission Rate
(PLNOXCRO) –
PLCH4RTA = PLCH4AN / PLNGENAN.
53. Plant Annual N2O Total Output Emission Rate (PLN2ORTA) – This field, in lb/MWh, is calculated as follows:
PLN2ORTA = PLN2OAN / PLNGENAN
54. Plant Annual CO2 Equivalent Total Output Emission Rate (PLC2ERTA) – This field, in lb/MWh, is calculated as follows:
PLC2ERTA = 2000 * (PLCO2EQA / PLNGENAN).
55. Plant Annual Hg Total Output Emission Rate (PLHGRTA) – Not calculated for eGRID2016.
56. Plant Annual NOx Input Emission Rate (PLNOXRA) – This field, in lb/MMBtu, is calculated as follows:
PLNOXRA = 2000 * (PLNOXAN / PLHTIAN).
57. Plant Ozone Season NOx Input Emission Rate (PLNOXRO) – This field, in lb/MMBtu, is calculated as follows:
PLNOXRO = 2000 * (PLNOXOZ / PLHTIOZ).
58. Plant Annual SO2 Input Emission Rate (PLSO2RA) – This field, in lb/MMBtu, is calculated as follows:
PLSO2RA = 2000 * (PLSO2AN / PLHTIAN).
59. Plant Annual CO2 Input Emission Rate (PLCO2RA) – This field, in lb/MMBtu, is calculated as follows:
PLCO2RA = 2000 * (PLCO2AN / PLHTIAN).
60. Plant Annual Hg Input Emission Rate (PLHGRA) – Not calculated for eGRID2016.
61. Plant Annual NOx Combustion Output Emission Rate (PLNOXCRT) – This field, in lb/MWh, is calculated as follows:
PLNOXCRT = 2000 * (PLNOXAN / PLGENACY).
This field, in lb/MWh, is calculated as follows:
PLNOXCRO = 2000 * (PLNOXOZ / ((PLGENACY * PLNGENOZ) /
PLNGENAN)).
63. Plant Annual SO2 Combustion Output Emission Rate (PLSO2CRT) – This field, in lb/MWh, is calculated as follows:
PLSO2CRT = 2000 * (PLSO2AN / PLGENACY).

DESCRIPTION OF DATA ELEMENTS
Technical Support Document for eGRID2016 ▌pg. 51
64. Plant Annual CO2 Combustion Output Emission Rate (PLCO2CRT) – This field, in lb/MWh, is calculated as follows:
PLCO2CRT = 2000 * (PLCO2AN / PLGENACY).
65. Plant Annual CH4 Combustion Output Emission Rate (PLCH4CRT) – This field, in lb/MWh, is calculated as follows:
PLCH4CRT = PLCH4AN / PLGENACY.
66. Plant Annual N2O Combustion Output Emission Rate (PLN2OCRT) – This field, in lb/MWh, is calculated as follows:
PLN2OCRT = PLN2OAN / PLGENACY.
67. Plant Annual Hg Combustion Output Emission Rate (PLHGCRT) – Not calculated for eGRID2016.
68. Plant Unadjusted Annual NOx Emissions (UNNOX) – The total plant-level unadjusted annual NOx emissions, in short tons.
69. Plant Unadjusted Ozone Season NOx Emissions (UNNOXOZ) – The unadjusted five-month ozone season (May through September) NOx emissions,
in short tons, for the plant.
70. Plant Unadjusted Annual SO2 Emissions (UNSO2) – The total plant-level unadjusted annual SO2 emissions, in short tons.
71. Plant Unadjusted Annual CO2 Emissions (UNCO2) – The total plant-level unadjusted annual CO2 emissions, in short tons.
72. Plant Unadjusted Annual CH4 Emissions (UNCH4) – The total plant-level unadjusted annual CH4 emissions, in pounds.
73. Plant Unadjusted Annual N2O Emissions (UNN2O) – The total plant-level unadjusted annual N2O emissions, in pounds.
74. Plant Unadjusted Annual Hg Emissions (UNHG) – Not calculated for eGRID2016.
75. Plant Unadjusted Annual Heat Input from Combustion (UNHTI) – The total plant-level unadjusted annual heat input from combustion, in MMBtu.
Sources: EPA/CAMD, EIA-923
76. Plant Unadjusted Ozone Season Heat Input from Combustion (UNHTIOZ) – The five-month ozone season (May through September) heat input from combustion,
in MMBtu for the plant.
Sources: EPA/CAMD, EIA-923

DESCRIPTION OF DATA ELEMENTS
Technical Support Document for eGRID2016 ▌pg. 52
77. Plant Total Unadjusted Annual Heat Input (UNHTIT) – The total plant-level unadjusted annual heat input from combustion and
noncombustion units, in MMBtu.
Sources: EPA/CAMD, EIA-923
78. Plant Total Unadjusted Ozone Season Heat Input (UNHTIOZT) – The five-month ozone season (May through September) heat input from combustion
and noncombustion units, in MMBtu for the plant.
Sources: EPA/CAMD, EIA-923
79. Plant Unadjusted Annual NOx Emissions Source (UNNOXSRC ) – The source of plant-level unadjusted annual NOx emissions.
80. Plant Unadjusted Ozone Season NOx Emissions Source (UNNOZSRC) – The source of plant-level unadjusted ozone NOx emissions.
81. Plant Unadjusted Annual SO2 Emissions Source (UNSO2SRC) – The source of plant-level unadjusted annual SO2 emissions.
82. Plant Unadjusted Annual CO2 Emissions Source (UNCO2SRC) – The source of plant-level unadjusted annual CO2 emissions.
83. Plant Unadjusted Annual CH4 Emissions Source (UNCH4SRC) – The source of plant-level unadjusted annual CH4 emissions.
84. Plant Unadjusted Annual N2O Emissions Source (UNN2OSRC) – The source of plant-level unadjusted annual N2O emissions.
85. Plant Unadjusted Annual Hg Emissions Source (UNHGSRC) – Not calculated for eGRID2016.
86. Plant Unadjusted Annual Heat Input Source (UNHTISRC) – The source of plant-level unadjusted annual heat input.
87. Plant Unadjusted Ozone Season Heat Input Source (UNHOZSRC) – The source of plant-level unadjusted ozone season heat input.
88. Plant Nominal Heat Rate (PLHTRT) – The plant nominal heat rate, in Btu/kWh, for partial combustion plants. It is
calculated as follows:
PLHTRT = 1000 * (PLHTIAN / PLGENACY)
For CHP plants, the value is, in effect, adjusted by the electric allocation factor, since
the heat input has been adjusted.
89. Plant Annual Coal Net Generation (PLGENACL) –

DESCRIPTION OF DATA ELEMENTS
Technical Support Document for eGRID2016 ▌pg. 53
The plant annual net generation, in MWh, for coal. Fuel codes that are included in
coal are BIT, COG, SUB, LIG, WC, and SC.
90. Plant Annual Oil Net Generation (PLGENAOL) – The plant annual net generation, in MWh, for oil. Fuel codes included in oil are DFO,
JF, KER, OO, PC, RFO, RG, and WO.
91. Plant Annual Gas Net Generation (PLGENAGS) – The plant annual net generation, in MWh, for natural gas. Fuel codes included in gas
are NG and PG.
92. Plant Annual Nuclear Net Generation (PLGENANC) – The plant annual net generation, in MWh, for nuclear. The fuel code is NUC.
93. Plant Annual Hydro Net Generation (PLGENAHY) – The plant annual net generation, in MWh, for hydro. The fuel code is WAT.
94. Plant Annual Biomass Net Generation (PLGENABM) – The annual net generation, in MWh, for biomass. Biomass is a fuel derived from
organic matter such as wood and paper products, agricultural waste, or methane (e.g.,
from landfills). The renewable portion of solid waste, fuel code MSB, is included as
biomass, as are AB, BLQ, DG, LFG, ME, OBL, OBS, PP, SLW, WDL, and WDS.
95. Plant Annual Wind Net Generation (PLGENAWI) – The plant annual net generation, in MWh, for wind. The fuel code is WND.
96. Plant Annual Solar Net Generation (PLGENASO) – The plant annual net generation, in MWh, for solar. The fuel code is SUN.
97. Plant Annual Geothermal Net Generation (PLGENAGT) – The plant annual net generation, in MWh, for geothermal. The fuel code is GEO.
98. Plant Annual Other Fossil Net Generation (PLGENAOF) – The plant annual net generation, in MWh, for other fossil fuel that cannot be
categorized as coal, oil, or gas. Other fossil fuel codes include BFG, COG, HY, LB,
MH, MSF, OG, PRG, and TDF.
99. Plant Annual Other Unknown/ Purchased Fuel Net Generation (PLGENAOP) – The plant annual net generation, in MWh, for other unknown/purchased. Fuel codes
include OTH, PUR, or WH.
100. Plant Annual Total Nonrenewables Net Generation (PLGENATN) – The annual total nonrenewables net generation, in MWh, for the plant.
Nonrenewables are exhaustible energy resources such as coal, oil, gas, other fossil,
nuclear power, and other unknown/purchased fuel. This field is the sum of
PLGENACL, PLGENAOL, PLGENAGS, PLGENAOF, PLGENANC, and
PLGENAOP.

DESCRIPTION OF DATA ELEMENTS
Technical Support Document for eGRID2016 ▌pg. 54
101. Plant Annual Total Renewables Net Generation (PLGENATR) – The annual total renewables net generation, in MWh, for the plant. Renewables are
inexhaustible energy resources such as biomass, wind, solar, geothermal, and hydro.
This field is the sum of PLGENABM, PLGENAWI, PLGENASO, PLGENAGT, and
PLGENAHY.
102. Plant Annual Total Nonhydro Renewables Net Generation (PLGENATH) – The annual total nonhydro renewables net generation, in MWh, for the plant. This
field is the sum of PLGENABM, PLGENAWI, PLGENASO, and PLGENAGT.
103. Plant Annual Total Combustion Net Generation (PLGENACY) – The annual total combustion net generation, in MWh, for the plant. This field is the
sum of PLGENACL, PLGENAOL, PLGENAGS, PLGENAOF, PLGENABM, and
PLGENAOP.
104. Plant Annual Total Noncombustion Net Generation (PLGENACN) – The annual total noncombustion net generation, in MWh, for the plant. This field is
the sum of PLGENANC, PLGENAHY, PLGENAWI, PLGENASO, and
PLGENAGT.
105. Plant Coal Generation Percent (PLCLPR) – The coal resource mix expressed as a percent of plant annual net generation.
PLCLPR = 100 * (PLGENACL / PLNGENAN).
106. Plant Oil Generation Percent (PLOLPR) – The oil resource mix expressed as a percent of plant annual net generation.
PLOLPR = 100 * (PLGENAOL / PLNGENAN).
107. Plant Gas Generation Percent (PLGSPR) –
The gas resource mix expressed as a percent of plant annual net generation.
PLGSPR = 100 * (PLGENAGS / PLNGENAN).
108. Plant Nuclear Generation Percent (PLNCPR) – The nuclear resource mix expressed as a percent of plant annual net generation.
PLNCPR = 100 * (PLGENANC / PLNGENAN).
109. Plant Hydro Generation Percent (PLHYPR) – The hydro resource mix expressed as a percent of plant annual net generation.
PLHYPR = 100 * (PLGENAHY / PLNGENAN).
110. Plant Biomass Generation Percent (PLBMPR) – The biomass resource mix expressed as a percent of plant annual net generation.
PLBMPR = 100 * (PLGENABM / PLNGENAN).

DESCRIPTION OF DATA ELEMENTS
Technical Support Document for eGRID2016 ▌pg. 55
111. Plant Wind Generation Percent (PLWIPR) – The wind resource mix expressed as a percent of plant annual net generation.
PLWIPR = 100 * (PLGENAWI / PLNGENAN).
112. Plant Solar Generation Percent (PLSOPR) –
The solar resource mix expressed as a percent of plant annual net generation.
PLSOPR = 100 * (PLGENASO / PLNGENAN).
113. Plant Geothermal Generation Percent (PLGTPR) – The geothermal resource mix expressed as a percent of plant annual net generation.
PLGTPR = 100 * (PLGENAGT / PLNGENAN).
114. Plant Other Fossil Generation Percent (PLOFPR) – The other fossil resource mix expressed as a percent of plant annual net generation.
PLOFPR = 100 * (PLGENAOF / PLNGENAN).
115. Plant Other Unknown/Purchased Fuel Generation Percent (PLOPPR) – The other unknown/purchased fuel/waste heat resource mix expressed as a percent of
plant annual net generation.
PLOPPR = 100 * (PLGENAOP / PLNGENAN).
116. Plant Total Nonrenewables Generation Percent (PLTNPR) – The total nonrenewables resource mix expressed as a percent of plant annual net
generation.
PLTNPR = 100 * (PLGENATN / PLNGENAN).
117. Plant Total Renewables Generation Percent (PLTRPR) – The total renewables resource mix expressed as a percent of plant annual net
generation.
PLTRPR = 100 * (PLGENATR / PLNGENAN).
118. Plant Total Nonhydro Renewables Generation Percent (PLTHPR) – The total nonhydro renewables resource mix expressed as a percent of plant annual
net generation.
PLTHPR = 100 * (PLGENATH / PLNGENAN).
119. Plant Total Combustion Generation Percent (PLCYPR) – The total combustion resource mix expressed as a percent of plant annual net
generation.
PLCYPR = 100 * (PLGENACY / PLNGENAN).
120. Plant Total Noncombustion Generation Percent (PLCNPR) – The total noncombustion resource mix expressed as a percent of plant annual net
generation.
PLCNPR = 100 * (PLGENACN / PLNGENAN).

DESCRIPTION OF DATA ELEMENTS
Technical Support Document for eGRID2016 ▌pg. 56
5.4 The ST (State) File
There are 112 variables in the fourth file, ST, which contains state level data. All size, heat input,
generation, and emission values are derived by aggregating from the plant level based on the state in
which the plant is located. Aggregated variable names generally begin with “ST.” Variables that are
either identical to those in the plant file or different from those in the plant file by the first two letters
of their names (e.g., STHTIAN instead of PLHTIAN) are not re-defined here.
1. State Abbreviation (PSTATABB) –
2. FIPS State Code (FIPSST) –
3. State Nameplate Capacity (NAMEPCAP) –
4. State Annual Heat Input from Combustion (STHTIAN) –
5. State Ozone Season Heat Input from Combustion (STHTIOZ) –
6. State Total Annual Heat Input (STHTIANT) –
7. State Total Ozone Season Heat Input (STHTIOZT) –
8. State Annual Net Generation (STNGENAN) –
9. State Ozone Season Net Generation (STNGENOZ) –
10. State Annual NOx Emissions (STNOXAN) –
11. State Ozone Season NOx Emissions (STNOXOZ) –
12. State Annual SO2 Emissions (STSO2AN) –
13. State Annual CO2 Emissions (STCO2AN) –
14. State Annual CH4 Emissions (STCH4AN) –
15. State Annual N2O Emissions (STN2OAN) –
16. State Annual CO2 Equivalent Emissions (STCO2EQA) – This field, in short tons, is the sum of each state’s plants’ PLCO2EQA.
17. State Annual Hg Emissions (STHGAN) –
18. State Annual NOx Total Output Emission Rate (STNOXRTA) – This field, in lb/MWh, is calculated as follows:
STNOXRTA = 2000 * (STNOXAN / STNGENAN).

DESCRIPTION OF DATA ELEMENTS
Technical Support Document for eGRID2016 ▌pg. 57
19. State Ozone Season NOx Total Output Emission Rate (STNOXRTO) – This field, in lb/MWh, is calculated as follows:
STNOXRTO = 2000 * (STNOXOZ / STNGENOZ).
20. State Annual SO2 Total Output Emission Rate (STSO2RTA) – This field, in lb/MWh, is calculated as follows:
STSO2RTA = 2000 * (STSO2AN / STNGENAN).
21. State Annual CO2 Total Output Emission Rate (STCO2RTA) – This field, in lb/MWh, is calculated as follows:
STCO2RTA = 2000 * (STCO2AN / STNGENAN).
22. State Annual CH4 Total Output Emission Rate (STCH4RTA) – This field, in lb/MWh, is calculated as follows:
STHCH4RTA = STCH4AN / STNGENAN.
23. State Annual N2O Total Output Emission Rate (STN2ORTA) – This field, in lb/MWh, is calculated as follows:
STN2ORTA = STN2OAN / STNGENAN.
24. State Annual CO2 Equivalent Total Output Emission Rate (STC2ERTA) –
This field, in lb/MWh, is calculated as follows:
STC2ERTA = 2000 * (STCO2EQA / STNGENAN).
25. State Annual Hg Total Output Emission Rate (STHGRTA) – Not calculated for eGRID2016.
26. State Annual NOx Input Emission Rate (STNOXRA) – This field, in lb/MMBtu, is calculated as follows:
STNOXRA = 2000 * (STNOXAN / STHTIAN).
27. State Ozone Season NOx Input Emission Rate (STNOXRO) – This field, in lb/MMBtu, is calculated as follows:
STNOXRO = 2000 * (STNOXOZ / STHTIOZ).
28. State Annual SO2 Input Emission Rate (STSO2RA) – This field, in lb/MMBtu, is calculated as follows:
STSO2RA = 2000 * (STSO2AN / STHTIAN).
29. State Annual CO2 Input Emission Rate (STCO2RA) – This field, in lb/MMBtu, is calculated as follows:
STCO2RA = 2000 * (STCO2AN / STHTIAN).
30. State Annual Hg Input Emission Rate (STHGRA) – Not calculated for eGRID2016.

DESCRIPTION OF DATA ELEMENTS
Technical Support Document for eGRID2016 ▌pg. 58
31. State Annual NOx Combustion Output Emission Rate (STNOXCRT) – This field, in lb/MMBtu, is calculated as follows:
STNOXCRT =2000 * (STNOXAN / STGENACY).
32. State Ozone Season NOx Combustion Output Emission Rate (STNOXCRO) – This field, in lb/MMBtu, is calculated as follows:
STNOXCRO = 2000 * (STNOXOZ / ((STGENACY*STNGENOZ)/STNGENAN)).
33. State Annual SO2 Combustion Output Emission Rate (STSO2CRT) – This field, in lb/MMBtu, is calculated as follows:
STSO2CRT = 2000 * (STSO2AN / STGENACY).
34. State Annual CO2 Combustion Output Emission Rate (STCO2CRT) – This field, in lb/MMBtu, is calculated as follows:
STCO2CRT = 2000 * (STCO2AN / STGENACY).
35. State Annual CH4 Combustion Output Emission Rate (STCH4CRT) – This field, in lb/MMBtu, is calculated as follows:
STCH4CRT = STCH4AN / STGENACY.
36. State Annual N2O Combustion Output Emission Rate (STN2OCRT) – This field, in lb/MMBtu, is calculated as follows:
STN2OCRT = STN2OAN / STGENACY.
37. State Annual Hg Combustion Output Emission Rate (STHGCRT) – Not calculated for eGRID2016.
38. State Annual NOx Coal Output Emission Rate (STCNOXRT) – The sum of the annual NOx emissions from all plants in the state that have coal as the
primary fuel (PLPRMFL) divided by the sum of the annual combustion net
generation from the same set of plants, and multiplied by a unit conversion factor, in
lb/MWh.
39. State Annual NOx Oil Output Emission Rate (STONOXRT) – The sum of the annual NOx emissions from all plants in the state that have oil as the
primary fuel (PLPRMFL) divided by the sum of the annual combustion net
generation from the same set of plants, and multiplied by a unit conversion factor, in
lb/MWh.
40. State Annual NOx Gas Output Emission Rate (STGNOXRT) – The sum of the annual NOx emissions from all plants in the state that have natural gas
as the primary fuel (PLPRMFL) divided by the sum of the annual combustion net
generation from the same set of plants, and multiplied by a unit conversion factor, in
lb/MWh.

DESCRIPTION OF DATA ELEMENTS
Technical Support Document for eGRID2016 ▌pg. 59
41. State Annual NOx Fossil Fuel Output Emission Rate (STFSNXRT) – The sum of the annual NOx emissions from all plants in the state that have any fossil
fuel (coal, oil, gas, or other fossil) as the primary fuel (PLPRMFL) divided by the
sum of the annual combustion net generation from the same set of plants, and
multiplied by a unit conversion factor, in lb/MWh.
42. - State Ozone Season NOx Coal, Oil, Gas, and Fossil Fuel Output Emission
45. Rates –
The descriptions of the ozone season NOx fields, in lb/MWh, contain the same
information as fields #37 through #40 for annual NOx, respectively. The state ozone
season combustion net generation, used in the denominator of the equations, is
calculated as the ratio of the state annual to ozone season net generation for that fuel
times the state annual combustion net generation.
46. - State Annual SO2 Coal, Oil, Gas, and Fossil Fuel Output Emission
49. Rates –
The descriptions of the annual SO2 fields, in lb/MWh, contain the same information
as fields #37 through #40 for annual NOx, respectively.
50. - State Annual CO2 Coal, Oil, Gas, and Fossil Fuel Output Emission
53. Rates –
The descriptions of annual CO2 fields, in lb/MWh, contain the same information as
fields #37 through #40 for annual NOx, respectively.
54. - State Annual Hg Coal, Oil, Gas, and Other Fossil Fuel Output Emission
55. Rates –
Not calculated for eGRID2016.
56. - State Annual NOx, Ozone Season NOx, Annual SO2, Annual CO2 Coal, Oil, Gas,
73. and Fossil Fuel Input Emission Rates; and Annual Hg Coal and Fossil Fuel
Input Emission Rates –
The descriptions of these fields, primary fuel-specific input emission rates, contain
the same information that fields #37 through #54 do for primary fuel-specific output
emission rates – except that the calculations include heat input, rather than net
generation. These values are calculated in the same manner as the input emission
rates, using heat input in place of generation.
74. - State Annual NOx, Ozone Season NOx, Annual SO2, Annual CO2, Annual CH4,
80. Annual N2O, and Annual Hg Non-baseload Output Emission Rate –
These fields, in lb/MWh, are calculated as the sum of the annual non-baseload NOx,
ozone season non-baseload NOx, annual non-baseload SO2, annual non-baseload
CO2, annual non-baseload CH4, and annual non-baseload N2O emissions divided by
the sum of annual non-baseload net generation in the state and then multiplied by a
unit conversion factor. These fields are intended to provide a more refined estimate
of avoided emissions than the fossil-fuel average output emission rate. The non-
baseload emissions and generation include only emissions and generation from

DESCRIPTION OF DATA ELEMENTS
Technical Support Document for eGRID2016 ▌pg. 60
combustion sources and exclude emissions and generation from plants that have high
capacity factors. The remaining emissions and generation are weighted by a factor
which is a function of capacity factor. For more information, see Section 3.1.3 on
emission rate estimates.
81. State Annual Coal Net Generation (STGENACL) –
82. State Annual Oil Net Generation (STGENAOL) –
83. State Annual Gas Net Generation (STGENAGS) –
84. State Annual Nuclear Net Generation (STGENANC) –
85. State Annual Hydro Net Generation (STGENAHY) –
86. State Annual Biomass Net Generation (STGENABM) –
87. State Annual Wind Net Generation (STGENAWI) –
88. State Annual Solar Net Generation (STGENASO) –
89. State Annual Geothermal Net Generation (STGENAGT) –
90. State Annual Other Fossil Net Generation (STGENAOF) –
91. State Annual Other Unknown/Purchased Fuel Net Generation (STGENAOP) –
92. State Annual Total Nonrenewables Net Generation (STGENATN) –
93. State Annual Total Renewables Net Generation (STGENATR) –
94. State Annual Total Nonhydro Renewables Net Generation (STGENATH) –
95. State Annual Total Combustion Net Generation (STGENACY) –
96. State Annual Total Noncombustion Net Generation (STGENACN) –
97. State Coal Generation Percent (STCLPR) –
98. State Oil Generation Percent (STOLPR) –
99. State Gas Generation Percent (STGSPR) –
100. State Nuclear Generation Percent (STNCPR) –
101. State Hydro Generation Percent (STHYPR) –
102. State Biomass Generation Percent (STBMPR) –

DESCRIPTION OF DATA ELEMENTS
Technical Support Document for eGRID2016 ▌pg. 61
103. State Wind Generation Percent (STWIPR) –
104. State Solar Generation Percent (STSOPR) –
105. State Geothermal Generation Percent (STGTPR) –
106. State Other Fossil Generation Percent (STOFPR) –
107. State Other Unknown/Purchased Fuel Generation Percent (STOPPR) –
108. State Total Nonrenewables Generation Percent (STTNPR) –
109. State Total Renewables Generation Percent (STTRPR) –
110. State Total Nonhydro Renewables Generation Percent (STTHPR) –
111. State Total Combustion Generation Percent (STCYPR) –
112. State Total Noncombustion Generation Percent (STCNPR) –
5.5 The BA (Balancing Authority) File
There are 112 variables in the fifth file, BA, which contains location (operator)-based balancing
authority data. All generation and emission values are derived by aggregating from the plant level
based on the associated balancing authority.
All variables have been described in previous file variable descriptions. Aggregated variable names
generally begin with “BA.”
5.6 The SRL (eGRID Subregion) File
There are 151 variables in the sixth file, SRL, which contains location (operator)-based eGRID
subregions. All generation and emission values are derived by aggregating from the plant level based
on the associated eGRID subregion.
The eGRID Subregion file contains several unique variables that are not included in the other
aggregated level files. These variables include: nonbaseload generation and resource mix by fuel type
(coal, oil, gas, and fossil fuel). These are calculated as the generation at a plant from the Plant file
multiplied by the nonbaseload factor for that plant, summed for each fuel type.
All other variables in the eGRID Subregion file have been described in previous file variable
descriptions. Aggregated variable names generally begin with “SR.”
5.7 The NRL (NERC Region) File
There are 112 variables in the seventh file, NRL, which contains location (operator)-based NERC
region data. All generation and emission values are derived by aggregating from the plant level based
on the associated NERC region.
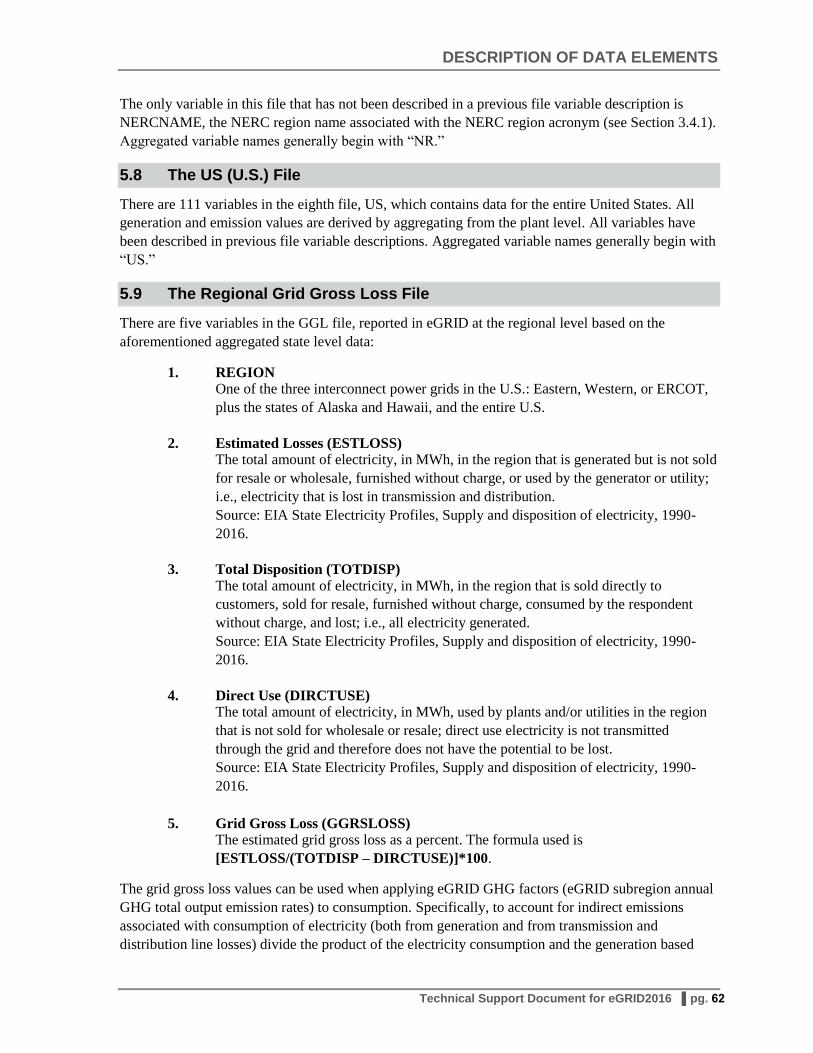
DESCRIPTION OF DATA ELEMENTS
Technical Support Document for eGRID2016 ▌pg. 62
The only variable in this file that has not been described in a previous file variable description is
NERCNAME, the NERC region name associated with the NERC region acronym (see Section 3.4.1).
Aggregated variable names generally begin with “NR.”
5.8 The US (U.S.) File
There are 111 variables in the eighth file, US, which contains data for the entire United States. All
generation and emission values are derived by aggregating from the plant level. All variables have
been described in previous file variable descriptions. Aggregated variable names generally begin with
“US.”
5.9 The Regional Grid Gross Loss File
There are five variables in the GGL file, reported in eGRID at the regional level based on the
aforementioned aggregated state level data:
1. REGION One of the three interconnect power grids in the U.S.: Eastern, Western, or ERCOT,
plus the states of Alaska and Hawaii, and the entire U.S.
2. Estimated Losses (ESTLOSS) The total amount of electricity, in MWh, in the region that is generated but is not sold
for resale or wholesale, furnished without charge, or used by the generator or utility;
i.e., electricity that is lost in transmission and distribution.
Source: EIA State Electricity Profiles, Supply and disposition of electricity, 1990-
2016.
3. Total Disposition (TOTDISP)
The total amount of electricity, in MWh, in the region that is sold directly to
customers, sold for resale, furnished without charge, consumed by the respondent
without charge, and lost; i.e., all electricity generated.
Source: EIA State Electricity Profiles, Supply and disposition of electricity, 1990-
2016.
4. Direct Use (DIRCTUSE) The total amount of electricity, in MWh, used by plants and/or utilities in the region
that is not sold for wholesale or resale; direct use electricity is not transmitted
through the grid and therefore does not have the potential to be lost.
Source: EIA State Electricity Profiles, Supply and disposition of electricity, 1990-
2016.
5. Grid Gross Loss (GGRSLOSS) The estimated grid gross loss as a percent. The formula used is
[ESTLOSS/(TOTDISP – DIRCTUSE)]*100.
The grid gross loss values can be used when applying eGRID GHG factors (eGRID subregion annual
GHG total output emission rates) to consumption. Specifically, to account for indirect emissions
associated with consumption of electricity (both from generation and from transmission and
distribution line losses) divide the product of the electricity consumption and the generation based

DESCRIPTION OF DATA ELEMENTS
Technical Support Document for eGRID2016 ▌pg. 63
eGRID total output emission rates by (one minus the grid gross loss as a decimal). See the equation
below:
GHG emis cons = GHG emis rate * Consumption / (1-ggl%/100)/2000
Where;
GHG emis cons = a specified GHG emission associated with a certain amount of electricity
consumption (generation and line losses) in short tons,
GHG emis rate = eGRID subregion annual total output emission rate in lb/MWh for a
specified GHG,
Consumption = the given electricity consumption in MWh (kWh/1000), and
ggl% = the estimated regional grid gross loss as a percent.
If reporting the indirect emissions for the electricity generation (scope 2 emissions) separately from
the indirect emissions as a result of transmission and distribution line losses (scope 3 emissions), then
the scope 2 emissions are simply the consumption in MWh multiplied by the eGRID subregion
annual total output emission rate in lb/MWh, and the scope 3 emissions are calculated in the
following equation:
GHG emis ll = GHG emis rate * Consumption * (ggl%/100) / (1-ggl%/100)/2000
Where;
GHG emis ll = a specified GHG emission associated with the line losses of a certain amount
of electricity consumption in short tons,
GHG emis rate = eGRID subregion annual total output emission rate in lb/MWh for a
specified GHG,
Consumption = the given electricity consumption in MWh (= kWh/1000), and
ggl% = the estimated regional grid gross loss as a percent.

REFERENCES
Technical Support Document for eGRID2016 ▌pg. 64
6. References
CARB, 2007: California Air Resources Board “Regulation for the Mandatory Reporting of
Greenhouse Gas Emissions (AB 32 requirements)” Table 5 in Appendix A, December 2007.
http://www.arb.ca.gov/regact/2007/ghg2007/frofinoal.pdf
Carbon Visuals, 2016: “Visualizing the carbon footprint of all US power stations,”
http://www.carbonvisuals.com/projects/2015/6/23/visualising-the-carbon-footprint-of-all-us-
power-stations?rq=eGRID
Diem, Salhotra and Quiroz, 2013: Diem, A., M. Salhotra, and C. Quiroz, “Using EPA’s eGRID to
Estimate GHG Emissions Reductions from Energy Efficiency” International Energy Program
Evaluation Conference, Chicago IL, August 2013.
Diem and Quiroz, 2013: Diem, A. and C. Quiroz, “Using eGRID Data for Carbon Footprinting
Electricity Purchases,” Energy, Utility, and Environment Conference, Phoenix, Arizona, January
2013.
Diem and Quiroz, 2012: Diem, A., and C. Quiroz, “How to use eGRID for Carbon Footprinting
Electricity Purchases in Greenhouse Gas Emission Inventories” presented at the U.S.
Environmental Protection Agency 2012 International Emission Inventory Conference, Tampa,
Florida, August 2012.
http://www.epa.gov/ttn/chief/conference/ei20/session3/adiem.pdf
Dorn et al., 2015: “EPA's Emissions & Generation Resource Integrated Database (eGRID):
Improvements and Applications,” presented at the Community Modeling and Analysis System
Conference. https://www.cmascenter.org/conference/2015/agenda.cfm
DOE, 2016: U.S. Department of Energy, Energy Efficiency and Renewable Energy, Combined Heat
and Power Installation Database. https://doe.icfwebservices.com/chpdb/
DVRPC, 2010: Delaware Valley Regional Planning Commission, Regional Greenhouse Gas
Emissions Inventory, revised December 2010.
http://www.dvrpc.org/reports/09038A.pdf
EIA, 2017a: Energy Information Administration, “2016 Annual Electric Generator Report,” Form
EIA-860, Washington, DC, 2014.
http://www.eia.gov/cneaf/electricity/page/eia860.html
EIA, 2017b: Energy Information Administration, “2016 Power Plant Operations Report,” Form EIA-
923, Washington, DC, 2014.
http://www.eia.gov/cneaf/electricity/page/eia906_920.html
EIA, 2017c: Energy Information Administration, “2016 Annual Electric Power Industry Report,”
Form EIA-861, Washington, DC, 2014.
http://www.eia.gov/cneaf/electricity/page/eia861.html
EIA, 2017d: Energy Information Administration, “2016 State Electricity Profiles.”
http://www.eia.gov/electricity/state/

REFERENCES
Technical Support Document for eGRID2016 ▌pg. 65
EIA, 2014: Energy Information Administration, “The Electricity Market Module of the National
Energy Modeling System: Model Documentation 2014,” Figure 3, Washington, DC, August
2014. http://www.eia.gov/outlooks/aeo/nems/documentation/electricity/pdf/m068(2014).pdf
EPA, 1995: U.S. Environmental Protection Agency, “Compilation of Air Pollutant Emission Factors,
Volume I: Stationary Point and Area Source, AP-42, Fifth Edition.” https://www.epa.gov/air-
emissions-factors-and-quantification/ap-42-compilation-air-emission-factors EPA, 2009: U.S.
Environmental Protection Agency, Final Mandatory Reporting of Greenhouse Gases
Rule (Table C-1, Default CO2 Emission Factors and High Heat Values for Various Types of Fuel
and Table C-2, Default CH4 and N2O Emission Factors for Various Types of Fuel), Washington,
D.C., October 30, 2009.
https://www.epa.gov/sites/production/files/2015-06/documents/ghg-mrr-finalrule.pdf
EPA, 2016a: EPA Center for Corporate Climate Leadership. https://www.epa.gov/climateleadership
EPA, 2017: Inventory of U.S. Greenhouse Gas Emissions and Sinks: 1990-2015.
https://www.epa.gov/ghgemissions/inventory-us-greenhouse-gas-emissions-and-sinks-1990-2015
EPA, 2016b: WebFIRE, Technology Transfer Network Clearinghouse for Inventories and Emissions
Factors. https://cfpub.epa.gov/webfire/
EPA, 2016c: LFG Energy Project Development Handbook. Landfill Methane Outreach Program.
https://www.epa.gov/sites/production/files/2016-11/documents/pdh_full.pdf
Galvin, 2011: Galvin Electricity Initiative, Achieve Cheaper, Cleaner Electricity Now through
Restructuring, 2010. http://www.galvinpower.org/achieve-cheaper-cleaner-electricity-now-
through-restructuring
GEA, 2007: Alyssa Kagel, Diana Bates, and Karl Gawell. Table 3, Air Emissions Summary, in “A
Guide to Geothermal Energy and the Environment”, Geothermal Energy Association,
Washington, D.C., April 2007.
http://geo-energy.org/reports/Environmental%20Guide.pdf
GEA, 2016: Geothermal Energy Association, geothermal plant type from annual power production
reports, http://geo-energy.org/reports.aspx.
Greenhouse Gas Protocol, 2016: The Greenhouse Gas Protocol. http://www.ghgprotocol.org/
IPCC, 2001: The Intergovernmental Panel on Climate Change (IPCC), “Climate Change 2001: The
Scientific Basis,” 2001. https://www.ipcc.ch/ipccreports/tar/wg1/pdf/WGI_TAR_full_report.pdf
IPCC, 2007: The Intergovernmental Panel on Climate Change (IPCC), “2006 IPCC Guidelines for
National Greenhouse Gas Inventories”, volume 2 (Energy), April 2007.
http://www.ipcc-
nggip.iges.or.jp/public/2006gl/pdf/2_Volume2/V2_2_Ch2_Stationary_Combustion.pdf
Johnson, 2016a: Travis Johnson, “How Part 75 Data is Used in GHG Reporting and EE/RE
Quantification,” EPRI Continuous Emissions Monitoring User Group Conference, Detroit, MI,
May 2016.

REFERENCES
Technical Support Document for eGRID2016 ▌pg. 66
Johnson, 2016b: Travis Johnson, “Emissions & Generation Resource integrated Database (eGRID),”
Energy, Utility, and Environment Conference, San Diego, CA, February 2016.
Johnson, Schreifels, and Quiroz, 2015: Johnson, T., J. Schreifels, and C. Quiroz, “eGRID Updates.”
Energy, Utility, and Environment Conference, San Diego, CA, February 2015.
Jones and Kammen, 2013: “Data & Calculations for "Quantifying Carbon Footprint Reduction
Opportunities for U.S. Households" Cool Climate Network Maps
https://docs.google.com/file/d/0BwI9ptFQU1QiM2IzNWE0YTQtNjY4NS00MzM5LWFkZDUt
OWNkY2NkNTMxOTM4
http://coolclimate.berkeley.edu/maps
Maryland, 2010: Maryland Department of the Environment, Technical Support Document for
Amendments to COMAR 26.09 MD CO2 Budget Training Program, Baltimore, MD, October 25,
2010.
http://www.mde.state.md.us/programs/Air/ClimateChange/RGGI/Documents/TSD_MD_CO2_B
udgetTradingProgram_Amendment.pdf
TCR, 2016: The Climate Registry, “General Reporting Protocol Version 2.1,”
https://www.theclimateregistry.org/tools-resources/reporting-protocols/general-reporting-
protocol/
UCS, 2012: Union of Concerned Scientists, “State of Charge: Electric Vehicles’ Global Warming
Emissions and Fuel-Cost Savings Across the United States, April 2012.
http://www.ucsusa.org/clean_vehicles/technologies_and_fuels/hybrid_fuelcell_and_electric_vehi
cles/emissions-and-charging-costs-electric-
cars.html?utm_source=SP&utm_medium=head&utm_campaign=EV%2BReport
US Census, 2016: United States Census Bureau, “2010 FIPS Codes for Counties and County
Equivalent Entities,” https://www.census.gov/geo/reference/codes/cou.html
Wheeler, 2007: David Wheeler, Senior Fellow, Center for Global Development, CARMA developer,
personal communication, November 30, 2007.

APPENDIX A
Technical Support Document for eGRID2016 ▌pg. 67
Appendix A. eGRID File Structure - Variable Descriptions for
eGRID2016
The structure of the nine files – including descriptions of the variables, unit of measurement, and
original source(s) of data – are delineated below in the file structure. NOTE: Italics indicates new
field; bold indicates methodological change. Units in the following tables represent the units in the
English unit eGRID2016 workbook.
Table A-1. eGRID File Structure, eGRID2016 UNIT Unit File
Field Name Description Unit Source(s)
1 SEQBLR16 eGRID2016 file boiler sequence number assigned
2 PSTATABB Plant state abbreviation EIA-860
3 PNAME Plant name EPA/CAMD
4 ORISPL DOE/EIA ORIS plant or facility code EPA/CAMD, EIA-860
5 UNITID Unit ID EPA/CAMD, EIA-923
6 PRMVR Prime Mover EPA/CAMD, EIA-860
7 UNTOPST Unit operational status EPA/CAMD, EIA-860
8 CAMDFLAG CAMD Program flag EPA/CAMD
9 PRGCODE Program code(s) EPA/CAMD
10 BOTFIRTY Boiler bottom and firing type EPA/CAMD, EIA-860
11 NUMGEN Number of associated generators EIA-860
12 FUELU1 Unit primary fuel EPA/CAMD, EIA-923, EIA-860
13 HRSOP Unit operating hours hours EPA/CAMD
14 HTIAN Unit unadjusted annual heat input MMBtu EPA/CAMD, EIA-923
15 HTIOZ Unit unadjusted ozone season heat input MMBtu EPA/CAMD, EIA-923
16 NOXAN Unit unadjusted annual NOx emissions tons EPA/CAMD, EIA-923
17 NOXOZ Unit unadjusted ozone season NOx emissions tons EPA/CAMD, EIA-923
18 SO2AN Unit unadjusted annual SO2 emissions tons EPA/CAMD
19 CO2AN Unit unadjusted annual CO2 emissions tons EPA/CAMD
20 HTIANSRC Unit unadjusted annual heat input source EPA/CAMD, EIA-923
21 HTIOZSRC Unit unadjusted ozone season heat input source EPA/CAMD, EIA-923
22 NOXANSRC Unit unadjusted annual NOx emissions source EPA/CAMD, EIA-923
23 NOXOZSRC Unit unadjusted ozone season NOx emissions source EPA/CAMD, EIA-923
24 SO2SRC Unit unadjusted annual SO2 emissions source EPA/CAMD, EIA-923
25 CO2SRC Unit unadjusted annual CO2 emissions source EPA/CAMD, EIA-923
26 SO2CTLDV Unit SO2 (scrubber) first control device EPA/CAMD, EIA-860
27 NOXCTLDV Unit NOx first control device EPA/CAMD
28 HGCTLDV Unit Hg activated carbon injection system flag EIA-860
29 UNTYRONL Unit year on-line EPA/CAMD, EIA-860
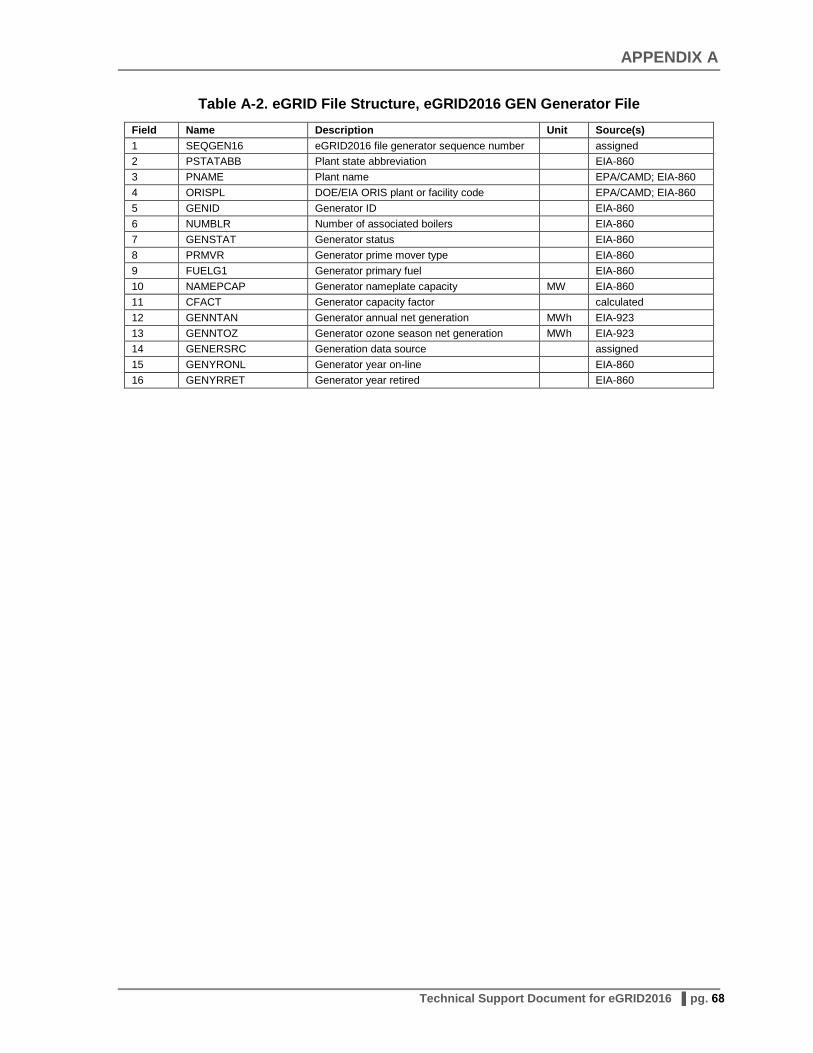
APPENDIX A
Technical Support Document for eGRID2016 ▌pg. 68
Table A-2. eGRID File Structure, eGRID2016 GEN Generator File
Field Name Description Unit Source(s)
1 SEQGEN16 eGRID2016 file generator sequence number
assigned
2 PSTATABB Plant state abbreviation
EIA-860
3 PNAME Plant name
EPA/CAMD; EIA-860
4 ORISPL DOE/EIA ORIS plant or facility code
EPA/CAMD; EIA-860
5 GENID Generator ID
EIA-860
6 NUMBLR Number of associated boilers
EIA-860
7 GENSTAT Generator status
EIA-860
8 PRMVR Generator prime mover type
EIA-860
9 FUELG1 Generator primary fuel
EIA-860
10 NAMEPCAP Generator nameplate capacity MW EIA-860
11 CFACT Generator capacity factor
calculated
12 GENNTAN Generator annual net generation MWh EIA-923
13 GENNTOZ Generator ozone season net generation MWh EIA-923
14 GENERSRC Generation data source
assigned
15 GENYRONL Generator year on-line
EIA-860
16 GENYRRET Generator year retired EIA-860
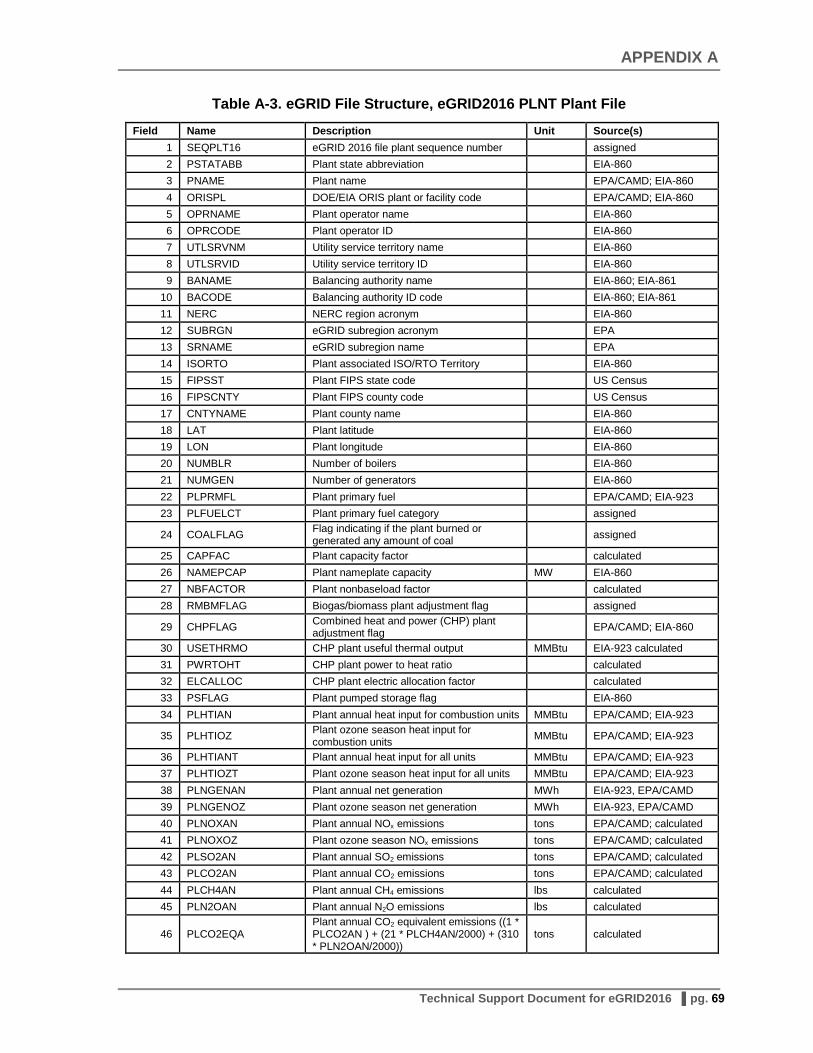
APPENDIX A
Technical Support Document for eGRID2016 ▌pg. 69
Table A-3. eGRID File Structure, eGRID2016 PLNT Plant File
Field Name Description Unit Source(s)
1 SEQPLT16 eGRID 2016 file plant sequence number assigned
2 PSTATABB Plant state abbreviation EIA-860
3 PNAME Plant name EPA/CAMD; EIA-860
4 ORISPL DOE/EIA ORIS plant or facility code EPA/CAMD; EIA-860
5 OPRNAME Plant operator name EIA-860
6 OPRCODE Plant operator ID EIA-860
7 UTLSRVNM Utility service territory name EIA-860
8 UTLSRVID Utility service territory ID EIA-860
9 BANAME Balancing authority name EIA-860; EIA-861
10 BACODE Balancing authority ID code EIA-860; EIA-861
11 NERC NERC region acronym EIA-860
12 SUBRGN eGRID subregion acronym EPA
13 SRNAME eGRID subregion name EPA
14 ISORTO Plant associated ISO/RTO Territory EIA-860
15 FIPSST Plant FIPS state code US Census
16 FIPSCNTY Plant FIPS county code US Census
17 CNTYNAME Plant county name EIA-860
18 LAT Plant latitude EIA-860
19 LON Plant longitude EIA-860
20 NUMBLR Number of boilers EIA-860
21 NUMGEN Number of generators EIA-860
22 PLPRMFL Plant primary fuel EPA/CAMD; EIA-923
23 PLFUELCT Plant primary fuel category assigned
24 COALFLAG Flag indicating if the plant burned or generated any amount of coal
assigned
25 CAPFAC Plant capacity factor calculated
26 NAMEPCAP Plant nameplate capacity MW EIA-860
27 NBFACTOR Plant nonbaseload factor calculated
28 RMBMFLAG Biogas/biomass plant adjustment flag assigned
29 CHPFLAG Combined heat and power (CHP) plant adjustment flag
EPA/CAMD; EIA-860
30 USETHRMO CHP plant useful thermal output MMBtu EIA-923 calculated
31 PWRTOHT CHP plant power to heat ratio calculated
32 ELCALLOC CHP plant electric allocation factor calculated
33 PSFLAG Plant pumped storage flag EIA-860
34 PLHTIAN Plant annual heat input for combustion units MMBtu EPA/CAMD; EIA-923
35 PLHTIOZ Plant ozone season heat input for combustion units
MMBtu EPA/CAMD; EIA-923
36 PLHTIANT Plant annual heat input for all units MMBtu EPA/CAMD; EIA-923
37 PLHTIOZT Plant ozone season heat input for all units MMBtu EPA/CAMD; EIA-923
38 PLNGENAN Plant annual net generation MWh EIA-923, EPA/CAMD
39 PLNGENOZ Plant ozone season net generation MWh EIA-923, EPA/CAMD
40 PLNOXAN Plant annual NOx emissions tons EPA/CAMD; calculated
41 PLNOXOZ Plant ozone season NOx emissions tons EPA/CAMD; calculated
42 PLSO2AN Plant annual SO2 emissions tons EPA/CAMD; calculated
43 PLCO2AN Plant annual CO2 emissions tons EPA/CAMD; calculated
44 PLCH4AN Plant annual CH4 emissions lbs calculated
45 PLN2OAN Plant annual N2O emissions lbs calculated
46 PLCO2EQA Plant annual CO2 equivalent emissions ((1 * PLCO2AN ) + (21 * PLCH4AN/2000) + (310 * PLN2OAN/2000))
tons calculated
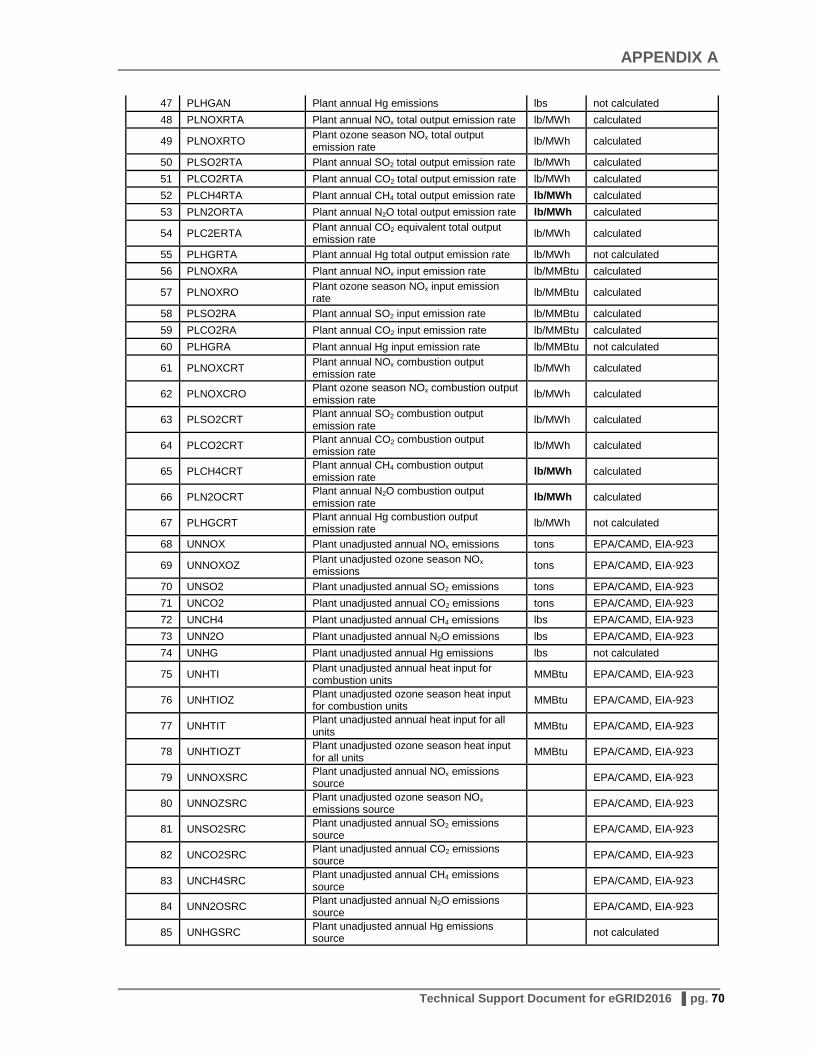
APPENDIX A
Technical Support Document for eGRID2016 ▌pg. 70
47 PLHGAN Plant annual Hg emissions lbs not calculated
48 PLNOXRTA Plant annual NOx total output emission rate lb/MWh calculated
49 PLNOXRTO Plant ozone season NOx total output emission rate
lb/MWh calculated
50 PLSO2RTA Plant annual SO2 total output emission rate lb/MWh calculated
51 PLCO2RTA Plant annual CO2 total output emission rate lb/MWh calculated
52 PLCH4RTA Plant annual CH4 total output emission rate lb/MWh calculated
53 PLN2ORTA Plant annual N2O total output emission rate lb/MWh calculated
54 PLC2ERTA Plant annual CO2 equivalent total output emission rate
lb/MWh calculated
55 PLHGRTA Plant annual Hg total output emission rate lb/MWh not calculated
56 PLNOXRA Plant annual NOx input emission rate lb/MMBtu calculated
57 PLNOXRO Plant ozone season NOx input emission rate
lb/MMBtu calculated
58 PLSO2RA Plant annual SO2 input emission rate lb/MMBtu calculated
59 PLCO2RA Plant annual CO2 input emission rate lb/MMBtu calculated
60 PLHGRA Plant annual Hg input emission rate lb/MMBtu not calculated
61 PLNOXCRT Plant annual NOx combustion output emission rate
lb/MWh calculated
62 PLNOXCRO Plant ozone season NOx combustion output emission rate
lb/MWh calculated
63 PLSO2CRT Plant annual SO2 combustion output emission rate
lb/MWh calculated
64 PLCO2CRT Plant annual CO2 combustion output emission rate
lb/MWh calculated
65 PLCH4CRT Plant annual CH4 combustion output emission rate
lb/MWh calculated
66 PLN2OCRT Plant annual N2O combustion output emission rate
lb/MWh calculated
67 PLHGCRT Plant annual Hg combustion output emission rate
lb/MWh not calculated
68 UNNOX Plant unadjusted annual NOx emissions tons EPA/CAMD, EIA-923
69 UNNOXOZ Plant unadjusted ozone season NOx emissions
tons EPA/CAMD, EIA-923
70 UNSO2 Plant unadjusted annual SO2 emissions tons EPA/CAMD, EIA-923
71 UNCO2 Plant unadjusted annual CO2 emissions tons EPA/CAMD, EIA-923
72 UNCH4 Plant unadjusted annual CH4 emissions lbs EPA/CAMD, EIA-923
73 UNN2O Plant unadjusted annual N2O emissions lbs EPA/CAMD, EIA-923
74 UNHG Plant unadjusted annual Hg emissions lbs not calculated
75 UNHTI Plant unadjusted annual heat input for combustion units
MMBtu EPA/CAMD, EIA-923
76 UNHTIOZ Plant unadjusted ozone season heat input for combustion units
MMBtu EPA/CAMD, EIA-923
77 UNHTIT Plant unadjusted annual heat input for all units
MMBtu EPA/CAMD, EIA-923
78 UNHTIOZT Plant unadjusted ozone season heat input for all units
MMBtu EPA/CAMD, EIA-923
79 UNNOXSRC Plant unadjusted annual NOx emissions source
EPA/CAMD, EIA-923
80 UNNOZSRC Plant unadjusted ozone season NOx emissions source
EPA/CAMD, EIA-923
81 UNSO2SRC Plant unadjusted annual SO2 emissions source
EPA/CAMD, EIA-923
82 UNCO2SRC Plant unadjusted annual CO2 emissions source
EPA/CAMD, EIA-923
83 UNCH4SRC Plant unadjusted annual CH4 emissions source
EPA/CAMD, EIA-923
84 UNN2OSRC Plant unadjusted annual N2O emissions source
EPA/CAMD, EIA-923
85 UNHGSRC Plant unadjusted annual Hg emissions source
not calculated

APPENDIX A
Technical Support Document for eGRID2016 ▌pg. 71
86 UNHTISRC Plant unadjusted annual heat input source EPA/CAMD, EIA-923
87 UNHOZSRC Plant unadjusted ozone season heat input source
EPA/CAMD, EIA-923
88 PLHTRT Plant nominal heat rate Btu/kWh calculated
89 PLGENACL Plant annual coal net generation MWh EIA-923
90 PLGENAOL Plant annual oil net generation MWh EIA-923
91 PLGENAGS Plant annual gas net generation MWh EIA-923
92 PLGENANC Plant annual nuclear net generation MWh EIA-923
93 PLGENAHY Plant annual hydro net generation MWh EIA-923
94 PLGENABM Plant annual biomass net generation MWh EIA-923
95 PLGENAWI Plant annual wind net generation MWh EIA-923
96 PLGENASO Plant annual solar net generation MWh EIA-923
97 PLGENAGT Plant annual geothermal net generation MWh EIA-923
98 PLGENAOF Plant annual other fossil net generation MWh EIA-923
99 PLGENAOP Plant annual other unknown/purchased fuel net generation
MWh EIA-923
100 PLGENATN Plant annual total nonrenewables net generation
MWh EIA-923
101 PLGENATR Plant annual total renewables net generation
MWh EIA-923
102 PLGENATH Plant annual total nonhydro renewables net generation
MWh EIA-923
103 PLGENACY Plant annual total combustion net generation
MWh EIA-923
104 PLGENACN Plant annual total noncombustion net generation
MWh EIA-923
105 PLCLPR Plant coal generation percent (resource mix)
% calculated
106 PLOLPR Plant oil generation percent (resource mix) % calculated
107 PLGSPR Plant gas generation percent (resource mix) % calculated
108 PLNCPR Plant nuclear generation percent (resource mix)
% calculated
109 PLHYPR Plant hydro generation percent (resource mix)
% calculated
110 PLBMPR Plant biomass generation percent (resource mix)
% calculated
111 PLWIPR Plant wind generation percent (resource mix)
% calculated
112 PLSOPR Plant solar generation percent (resource mix)
% calculated
113 PLGTPR Plant geothermal generation percent (resource mix)
% calculated
114 PLOFPR Plant other fossil generation percent (resource mix)
% calculated
115 PLOPPR Plant other unknown/purchased fuel generation percent (resource mix)
% calculated
116 PLTNPR Plant total nonrenewables generation percent (resource mix)
% calculated
117 PLTRPR Plant total renewables generation percent (resource mix)
% calculated
118 PLTHPR Plant total nonhydro renewables generation percent (resource mix)
% calculated
119 PLCYPR Plant total combustion generation percent (resource mix)
% calculated
120 PLCNPR Plant total noncombustion generation percent (resource mix)
% calculated

APPENDIX A
Technical Support Document for eGRID2016 ▌pg. 72
Table A-4. eGRID File Structure, eGRID2016 ST State File
Field Name Description Unit
1 PSTATABB State abbreviation
2 FIPSST FIPS state code
3 NAMEPCAP State nameplate capacity MW
4 STHTIAN State annual heat input from combustion MMBtu
5 STHTIOZ State ozone season heat input from combustion MMBtu
6 STHTIANT State total annual heat input MMBtu
7 STHTIOZT State total ozone season heat input MMBtu
8 STNGENAN State annual net generation MWh
9 STNGENOZ State ozone season net generation MWh
10 STNOXAN State annual NOx emissions tons
11 STNOXOZ State ozone season NOx emissions tons
12 STSO2AN State annual SO2 emissions tons
13 STCO2AN State annual CO2 emissions tons
14 STCH4AN State annual CH4 emissions lbs
15 STN2OAN State annual N2O emissions lbs
16 STCO2EQA State annual CO2 equivalent emissions tons
17 STHGAN State annual Hg emissions lbs
18 STNOXRTA State annual NOx total output emission rate lb/MWh
19 STNOXRTO State ozone season NOx total output emission rate lb/MWh
20 STSO2RTA State annual SO2 total output emission rate lb/MWh
21 STCO2RTA State annual CO2 total output emission rate lb/MWh
22 STCH4RTA State annual CH4 total output emission rate lb/MWh
23 STN2ORTA State annual N2O total output emission rate lb/MWh
24 STC2ERTA State annual CO2 equivalent total output emission rate lb/MWh
25 STHGRTA State annual Hg total output emission rate lb/MWh
26 STNOXRA State annual NOx input emission rate lb/MMBtu
27 STNOXRO State ozone season NOx input emission rate lb/MMBtu
28 STSO2RA State annual SO2 input emission rate lb/MMBtu
29 STCO2RA State annual CO2 input emission rate lb/MMBtu
30 STHGRA State annual Hg input emission rate lb/MMBtu
31 STNOXCRT State annual NOx combustion output emission rate lb/MWh
32 STNOXCRO State ozone season NOx combustion output emission rate lb/MWh
33 STSO2CRT State annual SO2 combustion output emission rate lb/MWh
34 STCO2CRT State annual CO2 combustion output emission rate lb/MWh
35 STCH4CRT State annual CH4 combustion output emission rate lb/MWh
36 STN2OCRT State annual N2O combustion output emission rate lb/MWh
37 STHGCRT State annual Hg combustion output emission rate lb/MWh
38 STCNOXRT State annual NOx coal output emission rate lb/MWh
39 STONOXRT State annual NOx oil output emission rate lb/MWh
40 STGNOXRT State annual NOx gas output emission rate lb/MWh
41 STFSNXRT State annual NOx other fossil fuel output emission rate lb/MWh
42 STCNXORT State ozone season NOx coal output emission rate lb/MWh
43 STONXORT State ozone season NOx oil output emission rate lb/MWh
44 STGNXORT State ozone season NOx gas output emission rate lb/MWh
45 STFSNORT State ozone season NOx other fossil fuel output emission rate lb/MWh
46 STCSO2RT State annual SO2 coal output emission rate lb/MWh
47 STOSO2RT State annual SO2 oil output emission rate lb/MWh
48 STGSO2RT State annual SO2 gas output emission rate lb/MWh
49 STFSS2RT State annual SO2 other fossil fuel output emission rate lb/MWh
50 STCCO2RT State annual CO2 coal output emission rate lb/MWh
51 STOCO2RT State annual CO2 oil output emission rate lb/MWh
52 STGCO2RT State annual CO2 gas output emission rate lb/MWh

APPENDIX A
Technical Support Document for eGRID2016 ▌pg. 73
Field Name Description Unit
53 STFSC2RT State annual CO2 other fossil fuel output emission rate lb/MWh
54 STCHGRT State annual Hg coal output emission rate lb/MWh
55 STFSHGRT State annual Hg other fossil fuel output emission rate lb/MWh
56 STCNOXR State annual NOx coal input emission rate lb/MMBtu
57 STONOXR State annual NOx oil input emission rate lb/MMBtu
58 STGNOXR State annual NOx gas input emission rate lb/MMBtu
59 STFSNXR State annual NOx other fossil fuel input emission rate lb/MMBtu
60 STCNXOR State ozone season NOx coal input emission rate lb/MMBtu
61 STONXOR State ozone season NOx oil input emission rate lb/MMBtu
62 STGNXOR State ozone season NOx gas input emission rate lb/MMBtu
63 STFSNOR State ozone season NOx other fossil fuel input emission rate lb/MMBtu
64 STCSO2R State annual SO2 coal input emission rate lb/MMBtu
65 STOSO2R State annual SO2 oil input emission rate lb/MMBtu
66 STGSO2R State annual SO2 gas input emission rate lb/MMBtu
67 STFSS2R State annual SO2 other fossil fuel input emission rate lb/MMBtu
68 STCCO2R State annual CO2 coal input emission rate lb/MMBtu
69 STOCO2R State annual CO2 oil input emission rate lb/MMBtu
70 STGCO2R State annual CO2 gas input emission rate lb/MMBtu
71 STFSC2R State annual CO2 other fossil fuel input emission rate lb/MMBtu
72 STCHGR State annual Hg coal input emission rate lb/MMBtu
73 STFSHGR State annual Hg other fossil fuel input emission rate lb/MMBtu
74 STNBNOX State annual NOx non-baseload output emission rate lb/MWh
75 STNBNXO State ozone season NOx non-baseload output emission rate lb/MWh
76 STNBSO2 State annual SO2 non-baseload output emission rate lb/MWh
77 STNBCO2 State annual CO2 non-baseload output emission rate lb/MWh
78 STNBCH4 State annual CH4 non-baseload output emission rate lb/MWh
79 STNBN2O State annual N2O non-baseload output emission rate lb/MWh
80 STNBHG State annual Hg non-baseload output emission rate lb/MWh
81 STGENACL State annual coal net generation MWh
82 STGENAOL State annual oil net generation MWh
83 STGENAGS State annual gas net generation MWh
84 STGENANC State annual nuclear net generation MWh
85 STGENAHY State annual hydro net generation MWh
86 STGENABM State annual biomass net generation MWh
87 STGENAWI State annual wind net generation MWh
88 STGENASO State annual solar net generation MWh
89 STGENAGT State annual geothermal net generation MWh
90 STGENAOF State annual other fossil net generation MWh
91 STGENAOP State annual other unknown/purchased fuel net generation MWh
92 STGENATN State annual total nonrenewables net generation MWh
93 STGENATR State annual total renewables net generation MWh
94 STGENATH State annual total nonhydro renewables net generation MWh
95 STGENACY State annual total combustion net generation MWh
96 STGENACN State annual total noncombustion net generation MWh
97 STCLPR State coal generation percent (resource mix) %
98 STOLPR State oil generation percent (resource mix) %
99 STGSPR State gas generation percent (resource mix) %
100 STNCPR State nuclear generation percent (resource mix) %
101 STHYPR State hydro generation percent (resource mix) %
102 STBMPR State biomass generation percent (resource mix) %
103 STWIPR State wind generation percent (resource mix) %
104 STSOPR State solar generation percent (resource mix) %
105 STGTPR State geothermal generation percent (resource mix) %
106 STOFPR State other fossil generation percent (resource mix) %

APPENDIX A
Technical Support Document for eGRID2016 ▌pg. 74
Field Name Description Unit
107 STOPPR State other unknown/purchased fuel generation percent (resource mix) %
108 STTNPR State total nonrenewables generation percent (resource mix) %
109 STTRPR State total renewables generation percent (resource mix) %
110 STTHPR State total nonhydro renewables generation percent (resource mix) %
111 STCYPR State total combustion generation percent (resource mix) %
112 STCNPR State total noncombustion generation percent (resource mix) %
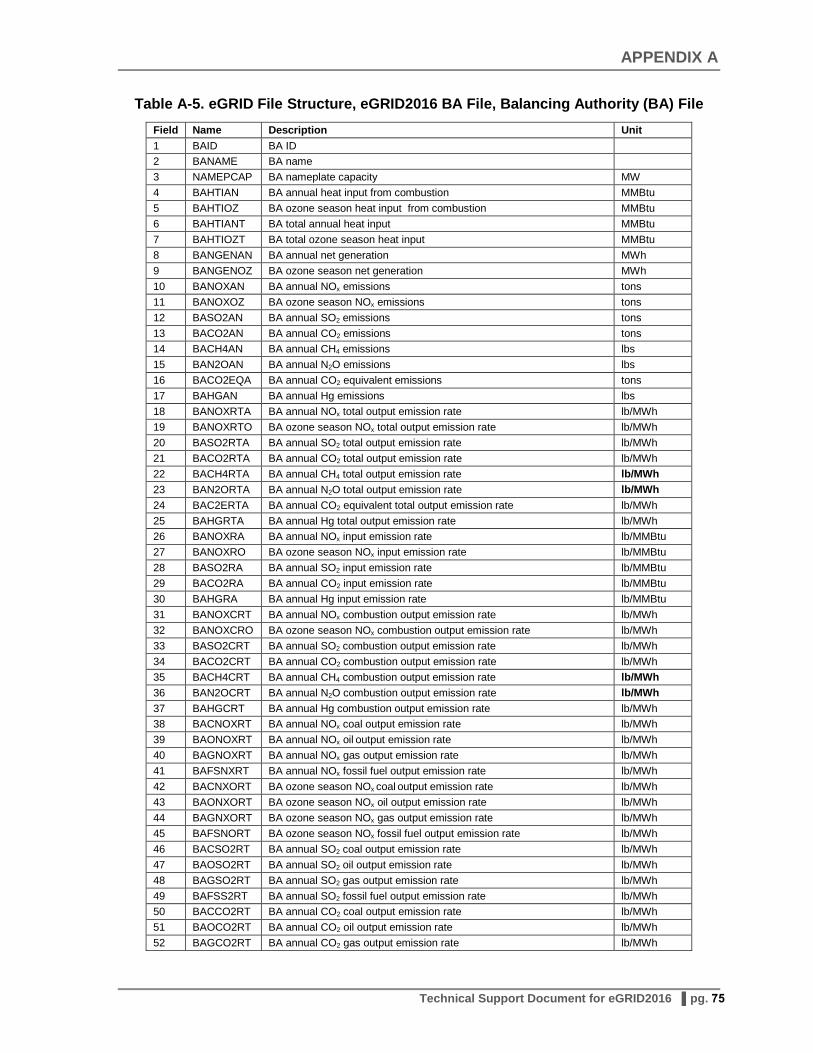
APPENDIX A
Technical Support Document for eGRID2016 ▌pg. 75
Table A-5. eGRID File Structure, eGRID2016 BA File, Balancing Authority (BA) File
Field Name Description Unit
1 BAID BA ID
2 BANAME BA name
3 NAMEPCAP BA nameplate capacity MW
4 BAHTIAN BA annual heat input from combustion MMBtu
5 BAHTIOZ BA ozone season heat input from combustion MMBtu
6 BAHTIANT BA total annual heat input MMBtu
7 BAHTIOZT BA total ozone season heat input MMBtu
8 BANGENAN BA annual net generation MWh
9 BANGENOZ BA ozone season net generation MWh
10 BANOXAN BA annual NOx emissions tons
11 BANOXOZ BA ozone season NOx emissions tons
12 BASO2AN BA annual SO2 emissions tons
13 BACO2AN BA annual CO2 emissions tons
14 BACH4AN BA annual CH4 emissions lbs
15 BAN2OAN BA annual N2O emissions lbs
16 BACO2EQA BA annual CO2 equivalent emissions tons
17 BAHGAN BA annual Hg emissions lbs
18 BANOXRTA BA annual NOx total output emission rate lb/MWh
19 BANOXRTO BA ozone season NOx total output emission rate lb/MWh
20 BASO2RTA BA annual SO2 total output emission rate lb/MWh
21 BACO2RTA BA annual CO2 total output emission rate lb/MWh
22 BACH4RTA BA annual CH4 total output emission rate lb/MWh
23 BAN2ORTA BA annual N2O total output emission rate lb/MWh
24 BAC2ERTA BA annual CO2 equivalent total output emission rate lb/MWh
25 BAHGRTA BA annual Hg total output emission rate lb/MWh
26 BANOXRA BA annual NOx input emission rate lb/MMBtu
27 BANOXRO BA ozone season NOx input emission rate lb/MMBtu
28 BASO2RA BA annual SO2 input emission rate lb/MMBtu
29 BACO2RA BA annual CO2 input emission rate lb/MMBtu
30 BAHGRA BA annual Hg input emission rate lb/MMBtu
31 BANOXCRT BA annual NOx combustion output emission rate lb/MWh
32 BANOXCRO BA ozone season NOx combustion output emission rate lb/MWh
33 BASO2CRT BA annual SO2 combustion output emission rate lb/MWh
34 BACO2CRT BA annual CO2 combustion output emission rate lb/MWh
35 BACH4CRT BA annual CH4 combustion output emission rate lb/MWh
36 BAN2OCRT BA annual N2O combustion output emission rate lb/MWh
37 BAHGCRT BA annual Hg combustion output emission rate lb/MWh
38 BACNOXRT BA annual NOx coal output emission rate lb/MWh
39 BAONOXRT BA annual NOx oil output emission rate lb/MWh
40 BAGNOXRT BA annual NOx gas output emission rate lb/MWh
41 BAFSNXRT BA annual NOx fossil fuel output emission rate lb/MWh
42 BACNXORT BA ozone season NOx coal output emission rate lb/MWh
43 BAONXORT BA ozone season NOx oil output emission rate lb/MWh
44 BAGNXORT BA ozone season NOx gas output emission rate lb/MWh
45 BAFSNORT BA ozone season NOx fossil fuel output emission rate lb/MWh
46 BACSO2RT BA annual SO2 coal output emission rate lb/MWh
47 BAOSO2RT BA annual SO2 oil output emission rate lb/MWh
48 BAGSO2RT BA annual SO2 gas output emission rate lb/MWh
49 BAFSS2RT BA annual SO2 fossil fuel output emission rate lb/MWh
50 BACCO2RT BA annual CO2 coal output emission rate lb/MWh
51 BAOCO2RT BA annual CO2 oil output emission rate lb/MWh
52 BAGCO2RT BA annual CO2 gas output emission rate lb/MWh

APPENDIX A
Technical Support Document for eGRID2016 ▌pg. 76
Field Name Description Unit
53 BAFSC2RT BA annual CO2 fossil fuel output emission rate lb/MWh
54 BACHGRT BA annual Hg coal output emission rate lb/MWh
55 BAFSHGRT BA annual Hg fossil fuel output emission rate lb/MWh
56 BACNOXR BA annual NOx coal input emission rate lb/MMBtu
57 BAONOXR BA annual NOx oil input emission rate lb/MMBtu
58 BAGNOXR BA annual NOx gas input emission rate lb/MMBtu
59 BAFSNXR BA annual NOx fossil fuel input emission rate lb/MMBtu
60 BACNXOR BA ozone season NOx coal input emission rate lb/MMBtu
61 BAONXOR BA ozone season NOx oil input emission rate lb/MMBtu
62 BAGNXOR BA ozone season NOx gas input emission rate lb/MMBtu
63 BAFSNOR BA ozone season NOx fossil fuel input emission rate lb/MMBtu
64 BACSO2R BA annual SO2 coal input emission rate lb/MMBtu
65 BAOSO2R BA annual SO2 oil input emission rate lb/MMBtu
66 BAGSO2R BA annual SO2 gas input emission rate lb/MMBtu
67 BAFSS2R BA annual SO2 fossil fuel input emission rate lb/MMBtu
68 BACCO2R BA annual CO2 coal input emission rate lb/MMBtu
69 BAOCO2R BA annual CO2 oil input emission rate lb/MMBtu
70 BAGCO2R BA annual CO2 gas input emission rate lb/MMBtu
71 BAFSC2R BA annual CO2 fossil fuel input emission rate lb/MMBtu
72 BACHGR BA annual Hg coal input emission rate lb/MMBtu
73 BAFSHGR BA annual Hg fossil fuel input emission rate lb/MMBtu
74 BANBNOX BA annual NOx non-baseload output emission rate lb/MWh
75 BANBNXO BA ozone season NOx non-baseload output emission rate lb/MWh
76 BANBSO2 BA annual SO2 non-baseload output emission rate lb/MWh
77 BANBCO2 BA annual CO2 non-baseload output emission rate lb/MWh
78 BANBCH4 BA annual CH4 non-baseload output emission rate lb/MWh
79 BANBN2O BA annual N2O non-baseload output emission rate lb/MWh
80 BANBHG BA annual Hg non-baseload output emission rate lb/MWh
81 BAGENACL BA annual coal net generation MWh
82 BAGENAOL BA annual oil net generation MWh
83 BAGENAGS BA annual gas net generation MWh
84 BAGENANC BA annual nuclear net generation MWh
85 BAGENAHY BA annual hydro net generation MWh
86 BAGENABM BA annual biomass net generation MWh
87 BAGENAWI BA annual wind net generation MWh
88 BAGENASO BA annual solar net generation MWh
89 BAGENAGT BA annual geothermal net generation MWh
90 BAGENAOF BA annual other fossil net generation MWh
91 BAGENAOP BA annual other unknown/purchased fuel net generation MWh
92 BAGENATN BA annual total nonrenewables net generation MWh
93 BAGENATR BA annual total renewables net generation MWh
94 BAGENATH BA annual total nonhydro renewables net generation MWh
95 BAGENACY BA annual total combustion net generation MWh
96 BAGENACN BA annual total noncombustion net generation MWh
97 BACLPR BA coal generation percent (resource mix) %
98 BAOLPR BA oil generation percent (resource mix) %
99 BAGSPR BA gas generation percent (resource mix) %
100 BANCPR BA nuclear generation percent (resource mix) %
101 BAHYPR BA hydro generation percent (resource mix) %
102 BABMPR BA biomass generation percent (resource mix) %
103 BAWIPR BA wind generation percent (resource mix) %
104 BASOPR BA solar generation percent (resource mix) %
105 BAGTPR BA geothermal generation percent (resource mix) %
106 BAOFPR BA other fossil generation percent (resource mix) %

APPENDIX A
Technical Support Document for eGRID2016 ▌pg. 77
Field Name Description Unit
107 BAOPPR BA other unknown/purchased fuel generation percent (resource mix) %
108 BATNPR BA total nonrenewables generation percent (resource mix) %
109 BATRPR BA total renewables generation percent (resource mix) %
110 BATHPR BA total nonhydro renewables generation percent (resource mix) %
111 BACYPR BA total combustion generation percent (resource mix) %
112 BACNPR BA total noncombustion generation percent (resource mix) %

APPENDIX A
Technical Support Document for eGRID2016 ▌pg. 78
Table A-6. eGRID File Structure, eGRID2016 SRL File, eGRID Subregion File
Field Name Description Unit
1 SUBRGN eGRID subregion acronym
2 SRNAME eGRID subregion name
3 NAMEPCAP eGRID subregion nameplate capacity MW
4 SRHTIAN eGRID subregion annual heat input from combustion MMBtu
5 SRHTIOZ eGRID subregion ozone season heat input from combustion MMBtu
6 SRHTIANT eGRID subregion total annual heat input MMBtu
7 SRHTIOZT eGRID subregion total ozone season heat input MMBtu
8 SRNGENAN eGRID subregion annual net generation MWh
9 SRNGENOZ eGRID subregion ozone season net generation MWh
10 SRNOXAN eGRID subregion annual NOx emissions tons
11 SRNOXOZ eGRID subregion ozone season NOx emissions tons
12 SRSO2AN eGRID subregion annual SO2 emissions tons
13 SRCO2AN eGRID subregion annual CO2 emissions tons
14 SRCH4AN eGRID subregion annual CH4 emissions lbs
15 SRN2OAN eGRID subregion annual N2O emissions lbs
16 SRCO2EQA eGRID subregion annual CO2 equivalent emissions tons
17 SRHGAN eGRID subregion annual Hg emissions lbs
18 SRNOXRTA eGRID subregion annual NOx total output emission rate lb/MWh
19 SRNOXRTO eGRID subregion ozone season NOx total output emission rate lb/MWh
20 SRSO2RTA eGRID subregion annual SO2 total output emission rate lb/MWh
21 SRCO2RTA eGRID subregion annual CO2 total output emission rate lb/MWh
22 SRCH4RTA eGRID subregion annual CH4 total output emission rate lb/MWh
23 SRN2ORTA eGRID subregion annual N2O total output emission rate lb/MWh
24 SRC2ERTA eGRID subregion annual CO2 equivalent total output emission rate lb/MWh
25 SRHGRTA eGRID subregion annual Hg total output emission rate lb/MWh
26 SRNOXRA eGRID subregion annual NOx input emission rate lb/MMBtu
27 SRNOXRO eGRID subregion ozone season NOx input emission rate lb/MMBtu
28 SRSO2RA eGRID subregion annual SO2 input emission rate lb/MMBtu
29 SRCO2RA eGRID subregion annual CO2 input emission rate lb/MMBtu
30 SRHGRA eGRID subregion annual Hg input emission rate lb/MMBtu
31 SRNOXCRT eGRID subregion annual NOx combustion output emission rate lb/MWh
32 SRNOXCRO eGRID subregion ozone season NOx combustion output emission rate lb/MWh
33 SRSO2CRT eGRID subregion annual SO2 combustion output emission rate lb/MWh
34 SRCO2CRT eGRID subregion annual CO2 combustion output emission rate lb/MWh
35 SRCH4CRT eGRID subregion annual CH4 combustion output emission rate lb/MWh
36 SRN2OCRT eGRID subregion annual N2O combustion output emission rate lb/MWh
37 SRHGCRT eGRID subregion annual Hg combustion output emission rate lb/MWh
38 SRCNOXRT eGRID subregion annual NOx coal output emission rate lb/MWh
39 SRONOXRT eGRID subregion annual NOx oil output emission rate lb/MWh
40 SRGNOXRT eGRID subregion annual NOx gas output emission rate lb/MWh
41 SRFSNXRT eGRID subregion annual NOx fossil fuel output emission rate lb/MWh
42 SRCNXORT eGRID subregion ozone season NOx coal output emission rate lb/MWh
43 SRONXORT eGRID subregion ozone season NOx oil output emission rate lb/MWh
44 SRGNXORT eGRID subregion ozone season NOx gas output emission rate lb/MWh
45 SRFSNORT eGRID subregion ozone season NOx fossil fuel output emission rate lb/MWh
46 SRCSO2RT eGRID subregion annual SO2 coal output emission rate lb/MWh
47 SROSO2RT eGRID subregion annual SO2 oil output emission rate lb/MWh
48 SRGSO2RT eGRID subregion annual SO2 gas output emission rate lb/MWh
49 SRFSS2RT eGRID subregion annual SO2 fossil fuel output emission rate lb/MWh
50 SRCCO2RT eGRID subregion annual CO2 coal output emission rate lb/MWh
51 SROCO2RT eGRID subregion annual CO2 oil output emission rate lb/MWh
52 SRGCO2RT eGRID subregion annual CO2 gas output emission rate lb/MWh

APPENDIX A
Technical Support Document for eGRID2016 ▌pg. 79
Field Name Description Unit
53 SRFSC2RT eGRID subregion annual CO2 fossil fuel output emission rate lb/MWh
54 SRCCH4RT eGRID subregion annual CH4 coal output emission rate lb/MWh
55 SROCH4RT eGRID subregion annual CH4 oil output emission rate lb/MWh
56 SRGCH4RT eGRID subregion annual CH4 gas output emission rate lb/MWh
57 SRFCH4RT eGRID subregion annual CH4 fossil fuel output emission rate lb/MWh
58 SRCN2ORT eGRID subregion annual N2O coal output emission rate lb/MWh
59 SRON2ORT eGRID subregion annual N2O oil output emission rate lb/MWh
60 SRON2ORT eGRID subregion annual N2O gas output emission rate lb/MWh
61 SRFN2ORT eGRID subregion annual N2O fossil output emission rate lb/MWh
62 SRCHGRT eGRID subregion annual Hg coal output emission rate lb/MWh
63 SRFSHGRT eGRID subregion annual Hg fossil fuel output emission rate lb/MWh
64 SRCNOXR eGRID subregion annual NOx coal input emission rate lb/MMBtu
65 SRONOXR eGRID subregion annual NOx oil input emission rate lb/MMBtu
66 SRGNOXR eGRID subregion annual NOx gas input emission rate lb/MMBtu
67 SRFSNXR eGRID subregion annual NOx fossil fuel input emission rate lb/MMBtu
68 SRCNXOR eGRID subregion ozone season NOx coal input emission rate lb/MMBtu
69 SRONXOR eGRID subregion ozone season NOx oil input emission rate lb/MMBtu
70 SRGNXOR eGRID subregion ozone season NOx gas input emission rate lb/MMBtu
71 SRFSNOR eGRID subregion ozone season NOx fossil fuel input emission rate lb/MMBtu
72 SRCSO2R eGRID subregion annual SO2 coal input emission rate lb/MMBtu
73 SROSO2R eGRID subregion annual SO2 oil input emission rate lb/MMBtu
74 SRGSO2R eGRID subregion annual SO2 gas input emission rate lb/MMBtu
75 SRFSS2R eGRID subregion annual SO2 fossil fuel input emission rate lb/MMBtu
76 SRCCO2R eGRID subregion annual CO2 coal input emission rate lb/MMBtu
77 SROCO2R eGRID subregion annual CO2 oil input emission rate lb/MMBtu
78 SRGCO2R eGRID subregion annual CO2 gas input emission rate lb/MMBtu
79 SRFSC2R eGRID subregion annual CO2 fossil fuel input emission rate lb/MMBtu
80 SRCCH4R eGRID subregion annual CH4 coal input emission rate lb/MMBtu
81 SROCH4R eGRID subregion annual CH4 oil input emission rate lb/MMBtu
82 SRGCH4R eGRID subregion annual CH4 gas input emission rate lb/MMBtu
83 SRFCH4R eGRID subregion annual CH4 fossil input emission rate lb/MMBtu
84 SRCN2OR eGRID subregion annual N2O coal input emission rate lb/MMBtu
85 SRON2OR eGRID subregion annual N2O oil input emission rate lb/MMBtu
86 SRGN2OR eGRID subregion annual N2O gas input emission rate lb/MMBtu
87 SRFN2OR eGRID subregion annual N2O fossil input emission rate lb/MMBtu
88 SRCHGR eGRID subregion annual Hg coal input emission rate lb/MMBtu
89 SRFSHGR eGRID subregion annual Hg fossil fuel input emission rate lb/MMBtu
90 SRNBNOX eGRID subregion annual NOx non-baseload output emission rate lb/MWh
91 SRNBNXO eGRID subregion ozone season NOx non-baseload output emission rate lb/MWh
92 SRNBSO2 eGRID subregion annual SO2 non-baseload output emission rate lb/MWh
93 SRNBCO2 eGRID subregion annual CO2 non-baseload output emission rate lb/MWh
94 SRNBCH4 eGRID subregion annual CH4 non-baseload output emission rate lb/MWh
95 SRNBN2O eGRID subregion annual N2O non-baseload output emission rate lb/MWh
96 SRNBC2ER eGRID subregion annual CO2e non-baseload output emission rate lb/MWh
97 SRNBHG eGRID subregion annual Hg non-baseload output emission rate lb/MWh
98 SRGENACL eGRID subregion annual coal net generation MWh
99 SRGENAOL eGRID subregion annual oil net generation MWh
100 SRGENAGS eGRID subregion annual gas net generation MWh
101 SRGENANC eGRID subregion annual nuclear net generation MWh
102 SRGENAHY eGRID subregion annual hydro net generation MWh
103 SRGENABM eGRID subregion annual biomass net generation MWh
104 SRGENAWI eGRID subregion annual wind net generation MWh
105 SRGENASO eGRID subregion annual solar net generation MWh
106 SRGENAGT eGRID subregion annual geothermal net generation MWh

APPENDIX A
Technical Support Document for eGRID2016 ▌pg. 80
Field Name Description Unit
107 SRGENAOF eGRID subregion annual other fossil net generation MWh
108 SRGENAOP eGRID subregion annual other unknown/purchased fuel net generation MWh
109 SRGENATN eGRID subregion annual total nonrenewables net generation MWh
110 SRGENATR eGRID subregion annual total renewables net generation MWh
111 SRGENATH eGRID subregion annual total nonhydro renewables net generation MWh
112 SRGENACY eGRID subregion annual total combustion net generation MWh
113 SRGENACN eGRID subregion annual total noncombustion net generation MWh
114 SRCLPR eGRID subregion coal generation percent (resource mix) %
115 SROLPR eGRID subregion oil generation percent (resource mix) %
116 SRGSPR eGRID subregion gas generation percent (resource mix) %
117 SRNCPR eGRID subregion nuclear generation percent (resource mix) %
118 SRHYPR eGRID subregion hydro generation percent (resource mix) %
119 SRBMPR eGRID subregion biomass generation percent (resource mix) %
120 SRWIPR eGRID subregion wind generation percent (resource mix) %
121 SRSOPR eGRID subregion solar generation percent (resource mix) %
122 SRGTPR eGRID subregion geothermal generation percent (resource mix) %
123 SROFPR eGRID subregion other fossil generation percent (resource mix) %
124 SROPPR eGRID subregion other unknown/purchased fuel generation percent (resource mix) %
125 SRTNPR eGRID subregion total nonrenewables generation percent (resource mix) %
126 SRTRPR eGRID subregion total renewables generation percent (resource mix) %
127 SRTHPR eGRID subregion total nonhydro renewables generation percent (resource mix) %
128 SRCYPR eGRID subregion total combustion generation percent (resource mix) %
129 SRCNPR eGRID subregion total noncombustion generation percent (resource mix) %
130 SRNBGNCL eGRID subregion annual total nonbaseload coal generation MWh
131 SRNBGNOL eGRID subregion annual total nonbaseload oil generation MWh
132 SRNBGNGS eGRID subregion annual total nonbaseload gas generation MWh
133 SRNBGNNC eGRID subregion annual total nonbaseload nuclear generation MWh
134 SRNBGNHY eGRID subregion annual total nonbaseload hydro generation MWh
135 SRNBGNBM eGRID subregion annual total nonbaseload biomass generation MWh
136 SRNBGNWI eGRID subregion annual total nonbaseload wind generation MWh
137 SRNBGNSO eGRID subregion annual total nonbaseload solar generation MWh
138 SRNBGNGT eGRID subregion annual total nonbaseload geothermal generation MWh
139 SRNBGNOF eGRID subregion annual total nonbaseload other fossil generation MWh
140 SRNBGNOP
eGRID subregion annual total nonbaseload other unknown/purchased fuel generation
MWh
141 SRNBCLPR eGRID subregion nonbaseload coal generation percent (resource mix) %
142 SRNBOLPR eGRID subregion nonbaseload oil generation percent (resource mix) %
143 SRNBGSPR eGRID subregion nonbaseload gas generation percent (resource mix) %
144 SRNBNCPR eGRID subregion nonbaseload nuclear generation percent (resource mix) %
145 SRNBHYPR eGRID subregion nonbaseload hydro generation percent (resource mix) %
146 SRNBBMPR eGRID subregion nonbaseload biomass generation percent (resource mix) %
147 SRNBWIPR eGRID subregion nonbaseload wind generation percent (resource mix) %
148 SRNBSOPR eGRID subregion nonbaseload solar generation percent (resource mix) %
149 SRNBGTPR eGRID subregion nonbaseload geothermal generation percent (resource mix) %
150 SRNBOFPR eGRID subregion nonbaseload other fossil generation percent (resource mix) %
151 SRNBOPPR
eGRID subregion nonbaseload other unknown/purchased fuel generation percent (resource mix)
%

APPENDIX A
Technical Support Document for eGRID2016 ▌pg. 81
Table A-7. eGRID File Structure, eGRID2016 NRL File, NERC Region File
Field Name Description Unit
1 NERC NERC region acronym
2 NERCNAME NERC region name
3 NAMEPCAP NERC region nameplate capacity MW
4 NRHTIAN NERC region annual heat input from combustion MMBtu
5 NRHTIOZ NERC region ozone season heat input from combustion MMBtu
6 NRHTIANT NERC total region annual heat input MMBtu
7 NRHTIOZT NERC total region ozone season heat input MMBtu
8 NRNGENAN NERC region annual net generation MWh
9 NRNGENOZ NERC region ozone season net generation MWh
10 NRNOXAN NERC region annual NOx emissions tons
11 NRNOXOZ NERC region ozone season NOx emissions tons
12 NRSO2AN NERC region annual SO2 emissions tons
13 NRCO2AN NERC region annual CO2 emissions tons
14 NRCH4AN NERC region annual CH4 emissions lbs
15 NRN2OAN NERC region annual N2O emissions lbs
16 NRCO2EQA NERC region annual CO2 equivalent emissions tons
17 NRHGAN NERC region annual Hg emissions lbs
18 NRNOXRTA NERC region annual NOx total output emission rate lb/MWh
19 NRNOXRTO NERC region ozone season NOx total output emission rate lb/MWh
20 NRSO2RTA NERC region annual SO2 total output emission rate lb/MWh
21 NRCO2RTA NERC region annual CO2 total output emission rate lb/MWh
22 NRCH4RTA NERC region annual CH4 total output emission rate lb/MWh
23 NRN2ORTA NERC region annual N2O total output emission rate lb/MWh
24 NRC2ERTA NERC region annual CO2 equivalent total output emission rate lb/MWh
25 NRHGRTA NERC region annual Hg total output emission rate lb/MWh
26 NRNOXRA NERC region annual NOx input emission rate lb/MMBtu
27 NRNOXRO NERC region ozone season NOx input emission rate lb/MMBtu
28 NRSO2RA NERC region annual SO2 input emission rate lb/MMBtu
29 NRCO2RA NERC region annual CO2 input emission rate lb/MMBtu
30 NRHGRA NERC region annual Hg input emission rate lb/MMBtu
31 NRNOXCRT NERC region annual NOx combustion output emission rate lb/MWh
32 NRNOXCRO NERC region ozone season NOx combustion output emission rate lb/MWh
33 NRSO2CRT NERC region annual SO2 combustion output emission rate lb/MWh
34 NRCO2CRT NERC region annual CO2 combustion output emission rate lb/MWh
35 NRCH4CRT NERC region annual CH4 combustion output emission rate lb/MWh
36 NRN2OCRT NERC region annual N2O combustion output emission rate lb/MWh
37 NRHGCRT NERC region annual Hg combustion output emission rate lb/MWh
38 NRCNOXRT NERC region annual NOx coal output emission rate lb/MWh
39 NRONOXRT NERC region annual NOx oil output emission rate lb/MWh
40 NRGNOXRT NERC region annual NOx gas output emission rate lb/MWh
41 NRFSNXRT NERC region annual NOx fossil fuel output emission rate lb/MWh
42 NRCNXORT NERC region ozone season NOx coal output emission rate lb/MWh
43 NRONXORT NERC region ozone season NOx oil output emission rate lb/MWh
44 NRGNXORT NERC region ozone season NOx gas output emission rate lb/MWh
45 NRFSNORT NERC region ozone season NOx fossil fuel output emission rate lb/MWh
46 NRCSO2RT NERC region annual SO2 coal output emission rate lb/MWh
47 NROSO2RT NERC region annual SO2 oil output emission rate lb/MWh
48 NRGSO2RT NERC region annual SO2 gas output emission rate lb/MWh
49 NRFSS2RT NERC region annual SO2 fossil fuel output emission rate lb/MWh
50 NRCCO2RT NERC region annual CO2 coal output emission rate lb/MWh
51 NROCO2RT NERC region annual CO2 oil output emission rate lb/MWh
52 NRGCO2RT NERC region annual CO2 gas output emission rate lb/MWh

APPENDIX A
Technical Support Document for eGRID2016 ▌pg. 82
Field Name Description Unit
53 NRFSC2RT NERC region annual CO2 fossil fuel output emission rate lb/MWh
54 NRCHGRT NERC region annual Hg coal output emission rate lb/MWh
55 NRFSHGRT NERC region annual Hg fossil fuel output emission rate lb/MWh
56 NRCNOXR NERC region annual NOx coal input emission rate lb/MMBtu
57 NRONOXR NERC region annual NOx oil input emission rate lb/MMBtu
58 NRGNOXR NERC region annual NOx gas input emission rate lb/MMBtu
59 NRFSNXR NERC region annual NOx fossil fuel input emission rate lb/MMBtu
60 NRCNXOR NERC region ozone season NOx coal input emission rate lb/MMBtu
61 NRONXOR NERC region ozone season NOx oil input emission rate lb/MMBtu
62 NRGNXOR NERC region ozone season NOx gas input emission rate lb/MMBtu
63 NRFSNOR NERC region ozone season NOx fossil fuel input emission rate lb/MMBtu
64 NRCSO2R NERC region annual SO2 coal input emission rate lb/MMBtu
65 NROSO2R NERC region annual SO2 oil input emission rate lb/MMBtu
66 NRGSO2R NERC region annual SO2 gas input emission rate lb/MMBtu
67 NRFSS2R NERC region annual SO2 fossil fuel input emission rate lb/MMBtu
68 NRCCO2R NERC region annual CO2 coal input emission rate lb/MMBtu
69 NROCO2R NERC region annual CO2 oil input emission rate lb/MMBtu
70 NRGCO2R NERC region annual CO2 gas input emission rate lb/MMBtu
71 NRFSC2R NERC region annual CO2 fossil fuel input emission rate lb/MMBtu
72 NRCHGR NERC region annual Hg coal input emission rate lb/MMBtu
73 NRFSHGR NERC region annual Hg fossil fuel input emission rate lb/MMBtu
74 NRNBNOX NERC region annual NOx non-baseload output emission rate lb/MWh
75 NRNBNXO NERC region ozone season NOx non-baseload output emission rate lb/MWh
76 NRNBSO2 NERC region annual SO2 non-baseload output emission rate lb/MWh
77 NRNBCO2 NERC region annual CO2 non-baseload output emission rate lb/MWh
78 NRNBCH4 NERC region annual CH4 non-baseload output emission rate lb/MWh
79 NRNBN2O NERC region annual N2O non-baseload output emission rate lb/MWh
80 NRNBHG NERC region annual Hg non-baseload output emission rate lb/MWh
81 NRGENACL NERC region annual coal net generation MWh
82 NRGENAOL NERC region annual oil net generation MWh
83 NRGENAGS NERC region annual gas net generation MWh
84 NRGENANC NERC region annual nuclear net generation MWh
85 NRGENAHY NERC region annual hydro net generation MWh
86 NRGENABM NERC region annual biomass net generation MWh
87 NRGENAWI NERC region annual wind net generation MWh
88 NRGENASO NERC region annual solar net generation MWh
89 NRGENAGT NERC region annual geothermal net generation MWh
90 NRGENAOF NERC region annual other fossil net generation MWh
91 NRGENAOP NERC region annual other unknown/purchased fuel net generation MWh
92 NRGENATN NERC region annual total nonrenewables net generation MWh
93 NRGENATR NERC region annual total renewables net generation MWh
94 NRGENATH NERC region annual total nonhydro renewables net generation MWh
95 NRGENACY NERC region annual total combustion net generation MWh
96 NRGENACN NERC region annual total noncombustion net generation MWh
97 NRCLPR NERC region coal generation percent (resource mix) %
98 NROLPR NERC region oil generation percent (resource mix) %
99 NRGSPR NERC region gas generation percent (resource mix) %
100 NRNCPR NERC region nuclear generation percent (resource mix) %
101 NRHYPR NERC region hydro generation percent (resource mix) %
102 NRBMPR NERC region biomass generation percent (resource mix) %
103 NRWIPR NERC region wind generation percent (resource mix) %
104 NRSOPR NERC region solar generation percent (resource mix) %
105 NRGTPR NERC region geothermal generation percent (resource mix) %
106 NROFPR NERC region other fossil generation percent (resource mix) %
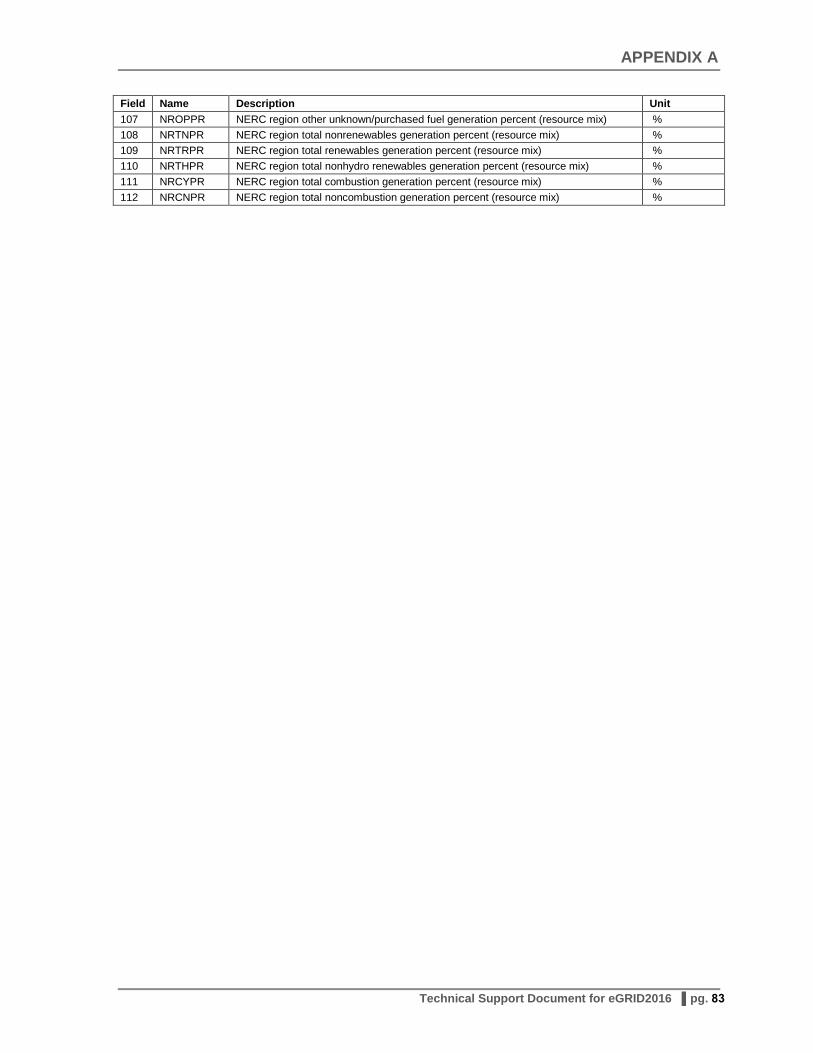
APPENDIX A
Technical Support Document for eGRID2016 ▌pg. 83
Field Name Description Unit
107 NROPPR NERC region other unknown/purchased fuel generation percent (resource mix) %
108 NRTNPR NERC region total nonrenewables generation percent (resource mix) %
109 NRTRPR NERC region total renewables generation percent (resource mix) %
110 NRTHPR NERC region total nonhydro renewables generation percent (resource mix) %
111 NRCYPR NERC region total combustion generation percent (resource mix) %
112 NRCNPR NERC region total noncombustion generation percent (resource mix) %

APPENDIX A
Technical Support Document for eGRID2016 ▌pg. 84
Table A-8. eGRID File Structure, eGRID2016 U.S. File, United States File
Field Name Description Unit
1 NAMEPCAP U.S. nameplate capacity MW
2 USHTIAN U.S. annual heat input from combustion MMBtu
3 USHTIOZ U.S. ozone season heat input from combustion MMBtu
4 USHTIANT U.S. total annual heat input MMBtu
5 USHTIOZT U.S. total ozone season heat input MMBtu
6 USNGENAN U.S. annual net generation MWh
7 USNGENOZ U.S. ozone season net generation MWh
8 USNOXAN U.S. annual NOx emissions tons
9 USNOXOZ U.S. ozone season NOx emissions tons
10 USSO2AN U.S. annual SO2 emissions tons
11 USCO2AN U.S. annual CO2 emissions tons
12 USCH4AN U.S. annual CH4 emissions lbs
13 USN2OAN U.S. annual N2O emissions lbs
14 USCO2EQA U.S. annual CO2 equivalent emissions tons
15 USHGAN U.S. annual Hg emissions lbs
16 USNOXRTA U.S. annual NOx total output emission rate lb/MWh
17 USNOXRTO U.S. ozone season NOx total output emission rate lb/MWh
18 USSO2RTA U.S. annual SO2 total output emission rate lb/MWh
19 USCO2RTA U.S. annual CO2 total output emission rate lb/MWh
20 USCH4RTA U.S. annual CH4 total output emission rate lb/MWh
21 USN2ORTA U.S. annual N2O total output emission rate lb/MWh
22 USC2ERTA U.S. annual CO2 equivalent total output emission rate lb/MWh
23 USHGRTA U.S. annual Hg total output emission rate lb/MWh
24 USNOXRA U.S. annual NOx input emission rate lb/MMBtu
25 USNOXRO U.S. ozone season NOx input emission rate lb/MMBtu
26 USSO2RA U.S. annual SO2 input emission rate lb/MMBtu
27 USCO2RA U.S. annual CO2 input emission rate lb/MMBtu
28 USHGRA U.S. annual Hg input emission rate lb/MMBtu
29 USNOXCRT U.S. annual NOx combustion output emission rate lb/MWh
30 USNOXCRO U.S. ozone season NOx combustion output emission rate lb/MWh
31 USSO2CRT U.S. annual SO2 combustion output emission rate lb/MWh
32 USCO2CRT U.S. annual CO2 combustion output emission rate lb/MWh
33 USCH4CRT U.S. annual CH4 combustion output emission rate lb/MWh
34 USN2OCRT U.S. annual N2O combustion output emission rate lb/MWh
35 USHGCRT U.S. annual Hg combustion output emission rate lb/MWh
36 USCNOXRT U.S. annual NOx coal output emission rate lb/MWh
37 USONOXRT U.S. annual NOx oil output emission rate lb/MWh
38 USGNOXRT U.S. annual NOx gas output emission rate lb/MWh
39 USFSNXRT U.S. annual NOx fossil fuel output emission rate lb/MWh
40 USCNXORT U.S. ozone season NOx coal output emission rate lb/MWh
41 USONXORT U.S. ozone season NOx oil output emission rate lb/MWh
42 USGNXORT U.S. ozone season NOx gas output emission rate lb/MWh
43 USFSNORT U.S. ozone season NOx fossil fuel output emission rate lb/MWh
44 USCSO2RT U.S. annual SO2 coal output emission rate lb/MWh
45 USOSO2RT U.S. annual SO2 oil output emission rate lb/MWh
46 USGSO2RT U.S. annual SO2 gas output emission rate lb/MWh
47 USFSS2RT U.S. annual SO2 fossil fuel output emission rate lb/MWh
48 USCCO2RT U.S. annual CO2 coal output emission rate lb/MWh
49 USOCO2RT U.S. annual CO2 oil output emission rate lb/MWh
50 USGCO2RT U.S. annual CO2 gas output emission rate lb/MWh
51 USFSC2RT U.S. annual CO2 fossil fuel output emission rate lb/MWh

APPENDIX A
Technical Support Document for eGRID2016 ▌pg. 85
Field Name Description Unit
52 USCHGRT U.S. annual Hg coal output emission rate lb/MWh
53 USFSHGRT U.S. annual Hg fossil fuel output emission rate lb/MWh
54 USCNOXR U.S. annual NOx coal input emission rate lb/MMBtu
55 USONOXR U.S. annual NOx oil input emission rate lb/MMBtu
56 USGNOXR U.S. annual NOx gas input emission rate lb/MMBtu
57 USFSNXR U.S. annual NOx fossil fuel input emission rate lb/MMBtu
58 USCNXOR U.S. ozone season NOx coal input emission rate lb/MMBtu
59 USONXOR U.S. ozone season NOx oil input emission rate lb/MMBtu
60 USGNXOR U.S. ozone season NOx gas input emission rate lb/MMBtu
61 USFSNOR U.S. ozone season NOx fossil fuel input emission rate lb/MMBtu
62 USCSO2R U.S. annual SO2 coal input emission rate lb/MMBtu
63 USOSO2R U.S. annual SO2 oil input emission rate lb/MMBtu
64 USGSO2R U.S. annual SO2 gas input emission rate lb/MMBtu
65 USFSS2R U.S. annual SO2 fossil fuel input emission rate lb/MMBtu
66 USCCO2R U.S. annual CO2 coal input emission rate lb/MMBtu
67 USOCO2R U.S. annual CO2 oil input emission rate lb/MMBtu
68 USGCO2R U.S. annual CO2 gas input emission rate lb/MMBtu
69 USFSC2R U.S. annual CO2 fossil fuel input emission rate lb/MMBtu
70 USCHGR U.S. annual Hg coal input emission rate lb/MMBtu
71 USFSHGR U.S. annual Hg fossil fuel input emission rate lb/MMBtu
72 USNBNOX U.S. annual NOx non-baseload output emission rate lb/MWh
73 USNBNXO U.S. ozone season NOx non-baseload output emission rate
lb/MWh
74 USNBSO2 U.S. annual SO2 non-baseload output emission rate lb/MWh
75 USNBCO2 U.S. annual CO2 non-baseload output emission rate lb/MWh
76 USNBCH4 U.S. annual CH4 non-baseload output emission rate lb/MWh
77 USNBN2O U.S. annual N2O non-baseload output emission rate lb/MWh
78 USNBC2E U.S. annual CO2 equivalent non-baseload output emission rate
lb/MWh
79 USNBHG U.S. annual Hg non-baseload output emission rate lb/MWh
80 USGENACL U.S. annual coal net generation MWh
81 USGENAOL U.S. annual oil net generation MWh
82 USGENAGS U.S. annual gas net generation MWh
83 USGENANC U.S. annual nuclear net generation MWh
84 USGENAHY U.S. annual hydro net generation MWh
85 USGENABM U.S. annual biomass net generation MWh
86 USGENAWI U.S. annual wind net generation MWh
87 USGENASO U.S. annual solar net generation MWh
88 USGENAGT U.S. annual geothermal net generation MWh
89 USGENAOF U.S. annual other fossil net generation MWh
90 USGENAOP U.S. annual other unknown/purchased fuel net generation
MWh
91 USGENATN U.S. annual total nonrenewables net generation MWh
92 USGENATR U.S. annual total renewables net generation MWh
93 USGENATH U.S. annual total nonhydro renewables net generation MWh
94 USGENACY U.S. annual total combustion net generation MWh
95 USGENACN U.S. annual total noncombustion net generation MWh
96 USCLPR U.S. coal generation percent (resource mix) %
97 USOLPR U.S. oil generation percent (resource mix) %
98 USGSPR U.S. gas generation percent (resource mix) %
99 USNCPR U.S. nuclear generation percent (resource mix) %
100 USHYPR U.S. hydro generation percent (resource mix) %
101 USBMPR U.S. biomass generation percent (resource mix) %
102 USWIPR U.S. wind generation percent (resource mix) %

APPENDIX A
Technical Support Document for eGRID2016 ▌pg. 86
Field Name Description Unit
103 USSOPR U.S. solar generation percent (resource mix) %
104 USGTPR U.S. geothermal generation percent (resource mix) %
105 USOFPR U.S. other fossil generation percent (resource mix) %
106 USOPPR U.S. other unknown/purchased fuel generation percent (resource mix)
%
107 USTNPR U.S. total nonrenewables generation percent (resource mix)
%
108 USTRPR U.S. total renewables generation percent (resource mix) %
109 USTHPR U.S. total nonhydro renewables generation percent (resource mix)
%
110 USCYPR U.S. total combustion generation percent (resource mix) %
111 USCNPR U.S. total noncombustion generation percent (resource mix)
%

APPENDIX A
Technical Support Document for eGRID2016 ▌pg. 87
Table A-9. eGRID File Structure, eGRID2016 GGL File, Grid Gross Loss (%) File
Field Name Description Unit Source(s)
1 REGION One of the three interconnect power grids in the U.S. (plus Alaska, Hawaii, and the entire U.S.)
2 ESTLOSS
The total amount of electricity in the region that is generated but is not sold for resale or wholesale, furnished without charge, or used by the generator or utility MWh
EIA State Electricity Profiles, Supply and disposition of electricity, 1990-2016
3 TOTDISP
The total amount of electricity in the region that is sold directly to customers, sold for resale, furnished without charge, consumed by the respondent without charge, and lost MWh
EIA State Electricity Profiles, Supply and disposition of electricity, 1990-2016
4 DIRCTUSE
The total amount of electricity used by plants and/or utilities in the region that is not sold for wholesale or resale; direct use electricity is not transmitted through the grid and therefore does not have the potential to be lost MWh
EIA State Electricity Profiles, Supply and disposition of electricity, 1990-2016
5 GGRSLOSS The estimated regional grid gross loss as a percent [Estimated losses/(Total disposition – Direct use)]*100 %
7 YEAR Data year

APPENDIX B
Technical Support Document for eGRID2016 ▌pg. 88
Appendix B. eGRID Subregion and NERC Region
Representational Maps
Figure B-1. eGRID Subregion Representational Map
This is a representational map; many of the boundaries shown on this map are approximate because they are
based on companies, not on strict geographical boundaries.

APPENDIX B
Technical Support Document for eGRID2016 ▌pg. 89
Figure B-2. NERC Region Representational Map
This is a representational map; many of the boundaries shown on this map are approximate because they are
based on companies, not on strict geographical boundaries.

APPENDIX C
Technical Support Document for eGRID2016 ▌pg. 90
Appendix C. Crosswalks and Additional Data Tables
This Appendix contains reference tables used in the development of eGRID2016. These include:
Emission factors used to estimate emissions (where they are not available from
EPA/CAMD);
Biomass fuels used in the plant file biomass emissions adjustment;
A crosswalk of plant ORISPL IDs that are different between EPA/CAMD and EIA datasets;
Geothermal emission factors by geotype and pollutant; and
English to Metric conversion factors.
Emission Factors – NOx, CO2, SO2, CH4, and N2O
For more information regarding the emission factors used and the methodology to estimate emissions,
please see Section 3.1.
Table C-1. eGRID Emission Factors for CO2, CH4, and N2O
Fuel Type EIA Fuel
Type Code
CO2 EF
(ton
CO2/mmBtu)
CH4 EF
(lb
CH4/mmBtu)
N2O EF
(lb
N2O/mmBtu)
Source
Agricultural
Byproducts AB 0.13026 0.07055 0.00926 (EPA, 2009)
Anthracite ANT 0.11413 0.02425 0.00353 (EPA, 2009)
Blast Furnace
Gas BFG 0.30239 0.00005 0.00022 (EPA, 2009)
Bituminous BIT 0.10296 0.02425 0.00353 (EPA, 2009)
Sulphite lyes
(Black Liquor) BLQ 0.11083 0.00698 0.00465 (IPCC, 2007)
Coke Oven
Gas COG 0.05164 0.00106 0.00022 (EPA, 2009)
Distillate Fuel
Oil (avg) DFO 0.08166 0.00661 0.00132 (EPA, 2009)
Hydrogen H 0.00000 0.00000 0.00000 No EF
Kerosene-
Type Jet Fuel JF 0.07961 0.00661 0.00132 (EPA, 2009)
Kerosene KER 0.08289 0.00661 0.00132 (EPA, 2009)
Landfill Gas LFG 0.06350 0.00233 0.00023 (IPCC, 2007)
Lignite LIG 0.10622 0.02425 0.00353 (EPA, 2009)
Municipal Solid
Waste MSW 0.09998 0.07055 0.00926 (EPA, 2009)
Megawatt
hours MWH 0.00000 0.00000 0.00000 No EF
Pipeline
(Weighted
U.S. Average)
NG 0.05844 0.00220 0.00022 (EPA, 2009)
Nuclear NUC 0.00000 0.00000 0.00000 No EF

APPENDIX C
Technical Support Document for eGRID2016 ▌pg. 91
Fuel Type EIA Fuel
Type Code
CO2 EF
(ton
CO2/mmBtu)
CH4 EF
(lb
CH4/mmBtu)
N2O EF
(lb
N2O/mmBtu)
Source
Other Biogas OBG 0.06350 0.00233 0.00023 (IPCC, 2007)
Other Liquid
Biofuels OBL 0.09257 0.00698 0.00140 (IPCC, 2007)
Other Primary
Solid Biomass OBS 0.11630 0.06978 0.00930 (IPCC, 2007)
Other Gas OG 0.05844 0.00220 0.00022 Use NG EF
Petroleum
Coke PC 0.11289 0.00661 0.00132 (EPA, 2009)
Propane PG 0.06775 0.00661 0.00132 (EPA, 2009)
Process Gas PRG 0.05844 0.00220 0.00022 Use NG EF
Purchased
Steam PUR 0.00000 0.00000 0.00000 No EF
Refined Coal RC 0.10529 0.00233 0.00349 (EPA, 2016b)
Residual Fuel
Oil (avg) RFO 0.08159 0.00661 0.00132 (EPA, 2009)
Synthetic Gas
- Petroleum
Coke
SGP 0.05844 0.00220 0.00022 Use NG EF
Sludge Waste SLW 0.09257 0.00698 0.00140 Same as OBL
Subbituminous SUB 0.10695 0.02425 0.00353 (EPA, 2009)
Solar SUN 0.00000 0.00000 0.00000 No EF
Tires TDF 0.09477 0.07055 0.00926 (EPA, 2009)
Water WAT 0.00000 0.00000 0.00000 No EF
Waste Coal WC 0.10529 0.00233 0.00349 (EPA, 2016b)
Wood, Wood
Waste Liquid WDL 0.09257 0.00698 0.00140 Use OBL EF
Wood and
Wood
Residuals
WDS 0.10340 0.07055 0.00926 (EPA, 2009)
Waste Heat WH 0.00000 0.00000 0.00000 No EF
Wind WND 0.00000 0.00000 0.00000 No EF
Waste Oils WO 0.08525 0.06978 0.00930 (IPCC, 2007)
Table C-2. eGRID Emission Factors for Nitrogen Oxides (NOx)
Prime Mover
Primary Fuel Type
Boiler Firing Type (if applicable)
Emission Factor
Emission Factor
Numerator
Emission Factor
Denominator
ST AB N/A 1.2 lb ton
ST AB STOKER 1.2 lb ton
ST BFG WALL 0.0154 lb Mcf
ST BFG N/A 0.0154 lb Mcf

APPENDIX C
Technical Support Document for eGRID2016 ▌pg. 92
Prime Mover
Primary Fuel Type
Boiler Firing Type (if applicable)
Emission Factor
Emission Factor
Numerator
Emission Factor
Denominator
ST BFG TANGENTIAL 0.0154 lb Mcf
ST BIT WET VERTICAL 31 lb ton
ST BIT WET WALL 31 lb ton
ST BIT WET TANGENTIAL 14 lb ton
ST BIT WET OTHER 31 lb ton
ST BIT DRY VERTICAL 12 lb ton
ST BIT WET FLUIDIZED 5 lb ton
ST BIT OTHER 12 lb ton
ST BIT DRY WALL 12 lb ton
ST BIT WET CYCLONE 33 lb ton
ST BIT CYCLONE 33 lb ton
ST BIT N/A 12 lb ton
ST BIT DRY CYCLONE 33 lb ton
ST BIT DRY TANGENTIAL 10 lb ton
ST BIT TANGENTIAL 10 lb ton
ST BIT DRY STOKER 11 lb ton
ST BIT DRY FLUIDIZED 5 lb ton
ST BIT FLUIDIZED 5 lb ton
ST BIT STOKER 11 lb ton
ST BLQ OTHER 1.5 lb ton
ST BLQ CYCLONE 1.5 lb ton
ST BLQ DRY TANGENTIAL 1.5 lb ton
ST BLQ TANGENTIAL 1.5 lb ton
ST BLQ DRY FLUIDIZED 1.5 lb ton
ST BLQ WALL 1.5 lb ton
ST BLQ DRY WALL 1.5 lb ton
ST BLQ N/A 1.5 lb ton
ST DFO DRY WALL 1.008 lb barrels
GT DFO N/A 5.124 lb barrels
ST DFO OTHER 1.008 lb barrels
ST DFO WET TANGENTIAL 1.008 lb barrels
ST DFO DRY TANGENTIAL 1.008 lb barrels
CS DFO N/A 5.124 lb barrels
CT DFO N/A 5.124 lb barrels
CT DFO N/A 5.124 lb barrels
ST DFO N/A 1.008 lb barrels
CA DFO N/A 5.124 lb barrels
ST DFO N/A 1.008 lb barrels

APPENDIX C
Technical Support Document for eGRID2016 ▌pg. 93
Prime Mover
Primary Fuel Type
Boiler Firing Type (if applicable)
Emission Factor
Emission Factor
Numerator
Emission Factor
Denominator
IC DFO N/A 18.6396 lb barrels
IC JF N/A 18.144 lb barrels
ST JF N/A 1.008 lb barrels
GT JF N/A 4.9896 lb barrels
GT KER N/A 4.9896 lb barrels
CT LFG N/A 0.144 lb Mcf
GT LFG N/A 0.144 lb Mcf
ST LFG N/A 0.07244 lb Mcf
IC LFG N/A 1.21522 lb Mcf
CA LFG N/A 0.144 lb Mcf
CS LFG N/A 0.144 lb Mcf
ST LIG DRY TANGENTIAL 7.1 lb ton
ST LIG FLUIDIZED 3.6 lb ton
ST LIG WET FLUIDIZED 3.6 lb ton
ST LIG TANGENTIAL 7.1 lb ton
ST LIG DRY FLUIDIZED 3.6 lb ton
ST LIG DRY WALL 6.3 lb ton
ST LIG WET CYCLONE 15 lb ton
ST MSB N/A 5 lb ton
ST MSW N/A 5 lb ton
ST MSW OTHER 5 lb ton
ST NG DRY VERTICAL 0.28 lb Mcf
ST NG DRY WALL 0.28 lb Mcf
ST NG DRY DUCTBURNER 0.17 lb Mcf
CT NG N/A 0.328 lb Mcf
CT NG DUCTBURNER 0.328 lb Mcf
ST NG DRY TANGENTIAL 0.17 lb Mcf
GT NG TANGENTIAL 0.328 lb Mcf
ST NG DUCTBURNER 0.17 lb Mcf
IC NG N/A 2.768 lb Mcf
ST NG N/A 0.17 lb Mcf
ST NG DRY STOKER 0.28 lb Mcf
ST NG DRY CYCLONE 0.28 lb Mcf
ST NG CYCLONE 0.28 lb Mcf
GT NG N/A 0.328 lb Mcf
ST NG FLUIDIZED 0.28 lb Mcf
ST NG OTHER 0.17 lb Mcf
CS NG N/A 0.328 lb Mcf

APPENDIX C
Technical Support Document for eGRID2016 ▌pg. 94
Prime Mover
Primary Fuel Type
Boiler Firing Type (if applicable)
Emission Factor
Emission Factor
Numerator
Emission Factor
Denominator
ST NG N/A 0.17 lb Mcf
CS NG DUCTBURNER 0.328 lb Mcf
ST NG WET CYCLONE 0.28 lb Mcf
ST NG STOKER 0.28 lb Mcf
ST NG TANGENTIAL 0.17 lb Mcf
CA NG DUCTBURNER 0.328 lb Mcf
CA NG N/A 0.328 lb Mcf
ST NG WALL 0.28 lb Mcf
CA NG DRY DUCTBURNER 0.328 lb Mcf
CA NG DRY WALL 0.328 lb Mcf
CT NG N/A 0.328 lb Mcf
CS OBG N/A 0.3136 lb Mcf
IC OBG N/A 2.64648 lb Mcf
ST OBG N/A 0.11283 lb Mcf
GT OBG N/A 0.3136 lb Mcf
CA OBG N/A 0.3136 lb Mcf
CT OBG N/A 0.3136 lb Mcf
GT OBL N/A 4.7166 lb barrels
IC OBL N/A 17.1486 lb barrels
ST OBS N/A 2 lb ton
ST OG CYCLONE 0.15282 lb Mcf
IC OG N/A 2.22641 lb Mcf
ST OG DRY TANGENTIAL 0.15282 lb Mcf
ST OG DRY DUCTBURNER 0.15282 lb Mcf
ST OG DUCTBURNER 0.15282 lb Mcf
GT OG N/A 0.26382 lb Mcf
ST OG DRY WALL 0.15282 lb Mcf
ST OG N/A 0.15282 lb Mcf
ST OG OTHER 0.15282 lb Mcf
ST OG N/A 0.15282 lb Mcf
ST PC FLUIDIZED 5 lb ton
ST PC N/A 21 lb ton
CA PC OTHER 21 lb ton
ST PC OTHER 21 lb ton
ST PC WET WALL 21 lb ton
ST PC DRY WALL 21 lb ton
ST PC DRY FLUIDIZED 5 lb ton
GT PG N/A 803.36 lb MMcf

APPENDIX C
Technical Support Document for eGRID2016 ▌pg. 95
Prime Mover
Primary Fuel Type
Boiler Firing Type (if applicable)
Emission Factor
Emission Factor
Numerator
Emission Factor
Denominator
ST PRG DRY WALL 0.28 lb Mcf
ST PRG DUCTBURNER 0.17 lb Mcf
ST PRG OTHER 0.17 lb Mcf
ST PRG TANGENTIAL 0.17 lb Mcf
ST PRG N/A 0.17 lb Mcf
ST RC DRY TANGENTIAL 10 lb ton
CA RFO N/A 5.5314 lb barrels
IC RFO N/A 20.118 lb barrels
ST RFO WET WALL 1.974 lb barrels
CT RFO N/A 5.5314 lb barrels
CT RFO N/A 5.5314 lb barrels
CS RFO N/A 5.5314 lb barrels
GT RFO N/A 5.5314 lb barrels
ST RFO DRY TANGENTIAL 1.344 lb barrels
ST RFO DRY WALL 1.974 lb barrels
ST RFO WALL 1.974 lb barrels
ST RFO N/A 1.974 lb barrels
ST RFO TANGENTIAL 1.344 lb barrels
ST SGC N/A 0.28 lb Mcf
CT SGP N/A 0.28 lb Mcf
CA SGP N/A 0.28 lb Mcf
CS SGP N/A 0.28 lb Mcf
ST SUB DRY TANGENTIAL 7.2 lb ton
ST SUB DRY FLUIDIZED 5 lb ton
ST SUB N/A 5 lb ton
ST SUB TANGENTIAL 7.2 lb ton
ST SUB FLUIDIZED 5 lb ton
ST SUB CYCLONE 17 lb ton
ST SUB WET TANGENTIAL 7.2 lb ton
ST SUB DRY WALL 7.4 lb ton
ST SUB WET FLUIDIZED 5 lb ton
ST SUB WET CYCLONE 17 lb ton
ST SUB WET WALL 24 lb ton
ST TDF STOKER 11 lb ton
ST WC FLUIDIZED 3.6 lb ton
ST WC N/A 3.6 lb ton
ST WC DRY FLUIDIZED 3.6 lb ton
ST WDL N/A 0.22806 lb barrels
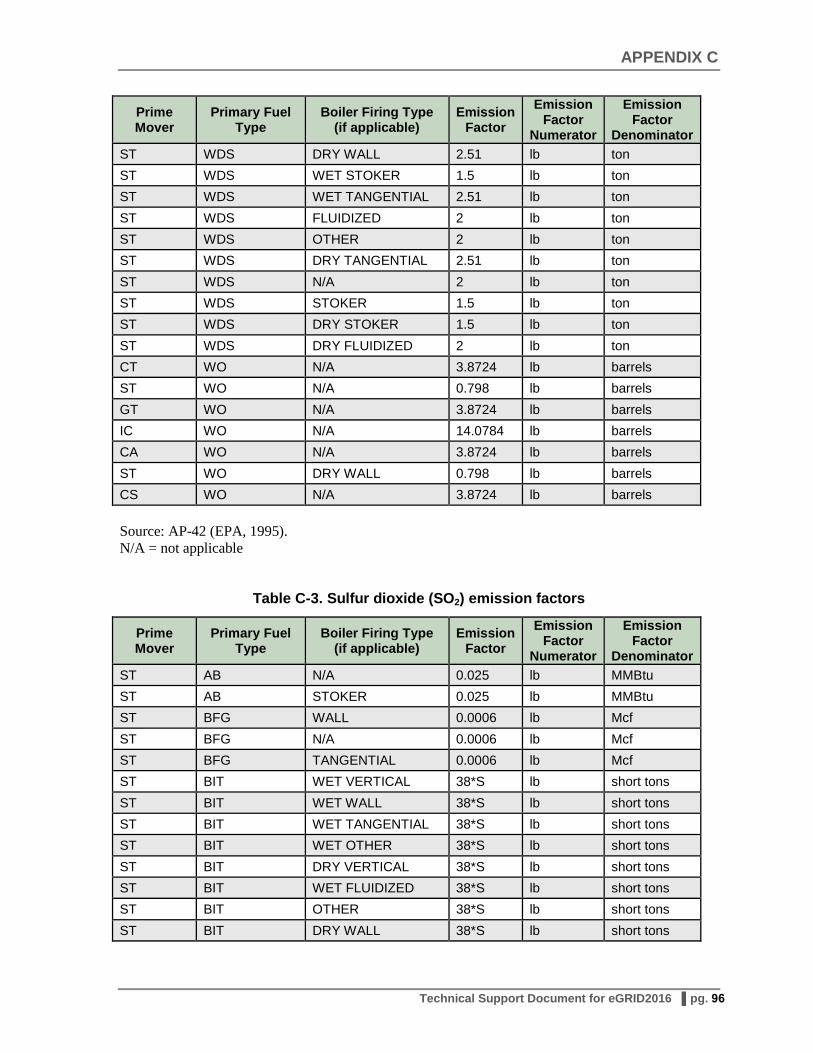
APPENDIX C
Technical Support Document for eGRID2016 ▌pg. 96
Prime Mover
Primary Fuel Type
Boiler Firing Type (if applicable)
Emission Factor
Emission Factor
Numerator
Emission Factor
Denominator
ST WDS DRY WALL 2.51 lb ton
ST WDS WET STOKER 1.5 lb ton
ST WDS WET TANGENTIAL 2.51 lb ton
ST WDS FLUIDIZED 2 lb ton
ST WDS OTHER 2 lb ton
ST WDS DRY TANGENTIAL 2.51 lb ton
ST WDS N/A 2 lb ton
ST WDS STOKER 1.5 lb ton
ST WDS DRY STOKER 1.5 lb ton
ST WDS DRY FLUIDIZED 2 lb ton
CT WO N/A 3.8724 lb barrels
ST WO N/A 0.798 lb barrels
GT WO N/A 3.8724 lb barrels
IC WO N/A 14.0784 lb barrels
CA WO N/A 3.8724 lb barrels
ST WO DRY WALL 0.798 lb barrels
CS WO N/A 3.8724 lb barrels
Source: AP-42 (EPA, 1995).
N/A = not applicable
Table C-3. Sulfur dioxide (SO2) emission factors
Prime Mover
Primary Fuel Type
Boiler Firing Type (if applicable)
Emission Factor
Emission Factor
Numerator
Emission Factor
Denominator
ST AB N/A 0.025 lb MMBtu
ST AB STOKER 0.025 lb MMBtu
ST BFG WALL 0.0006 lb Mcf
ST BFG N/A 0.0006 lb Mcf
ST BFG TANGENTIAL 0.0006 lb Mcf
ST BIT WET VERTICAL 38*S lb short tons
ST BIT WET WALL 38*S lb short tons
ST BIT WET TANGENTIAL 38*S lb short tons
ST BIT WET OTHER 38*S lb short tons
ST BIT DRY VERTICAL 38*S lb short tons
ST BIT WET FLUIDIZED 38*S lb short tons
ST BIT OTHER 38*S lb short tons
ST BIT DRY WALL 38*S lb short tons
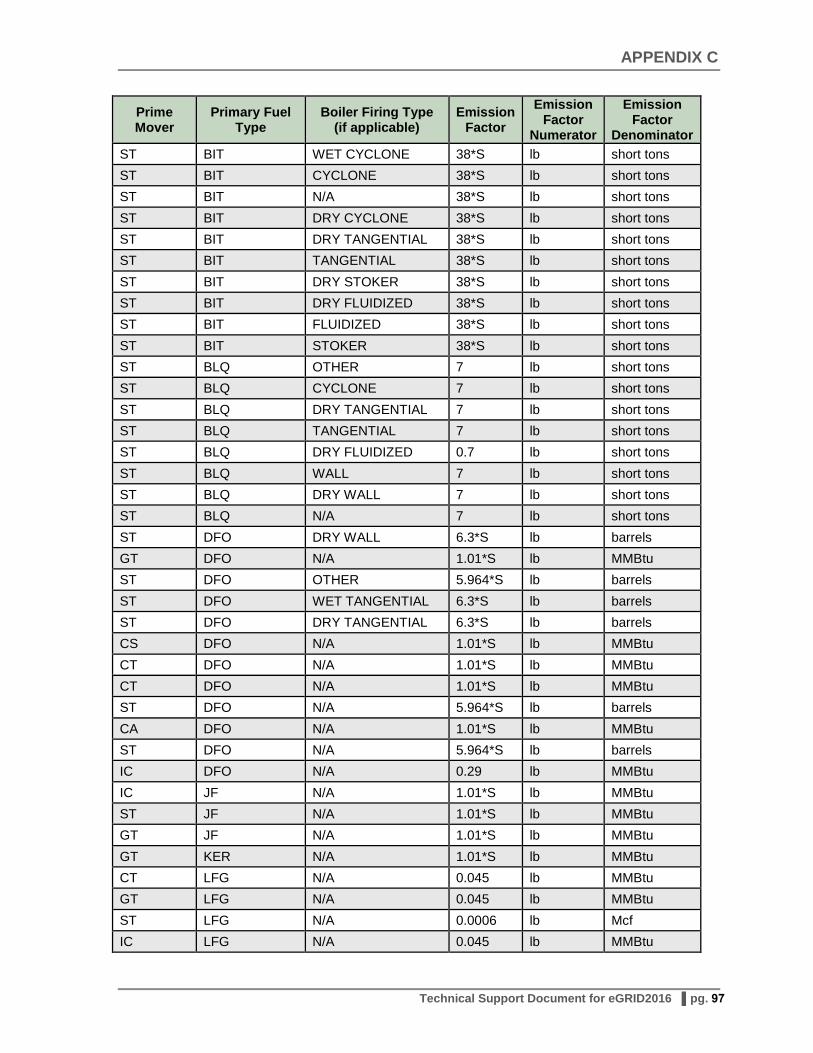
APPENDIX C
Technical Support Document for eGRID2016 ▌pg. 97
Prime Mover
Primary Fuel Type
Boiler Firing Type (if applicable)
Emission Factor
Emission Factor
Numerator
Emission Factor
Denominator
ST BIT WET CYCLONE 38*S lb short tons
ST BIT CYCLONE 38*S lb short tons
ST BIT N/A 38*S lb short tons
ST BIT DRY CYCLONE 38*S lb short tons
ST BIT DRY TANGENTIAL 38*S lb short tons
ST BIT TANGENTIAL 38*S lb short tons
ST BIT DRY STOKER 38*S lb short tons
ST BIT DRY FLUIDIZED 38*S lb short tons
ST BIT FLUIDIZED 38*S lb short tons
ST BIT STOKER 38*S lb short tons
ST BLQ OTHER 7 lb short tons
ST BLQ CYCLONE 7 lb short tons
ST BLQ DRY TANGENTIAL 7 lb short tons
ST BLQ TANGENTIAL 7 lb short tons
ST BLQ DRY FLUIDIZED 0.7 lb short tons
ST BLQ WALL 7 lb short tons
ST BLQ DRY WALL 7 lb short tons
ST BLQ N/A 7 lb short tons
ST DFO DRY WALL 6.3*S lb barrels
GT DFO N/A 1.01*S lb MMBtu
ST DFO OTHER 5.964*S lb barrels
ST DFO WET TANGENTIAL 6.3*S lb barrels
ST DFO DRY TANGENTIAL 6.3*S lb barrels
CS DFO N/A 1.01*S lb MMBtu
CT DFO N/A 1.01*S lb MMBtu
CT DFO N/A 1.01*S lb MMBtu
ST DFO N/A 5.964*S lb barrels
CA DFO N/A 1.01*S lb MMBtu
ST DFO N/A 5.964*S lb barrels
IC DFO N/A 0.29 lb MMBtu
IC JF N/A 1.01*S lb MMBtu
ST JF N/A 1.01*S lb MMBtu
GT JF N/A 1.01*S lb MMBtu
GT KER N/A 1.01*S lb MMBtu
CT LFG N/A 0.045 lb MMBtu
GT LFG N/A 0.045 lb MMBtu
ST LFG N/A 0.0006 lb Mcf
IC LFG N/A 0.045 lb MMBtu

APPENDIX C
Technical Support Document for eGRID2016 ▌pg. 98
Prime Mover
Primary Fuel Type
Boiler Firing Type (if applicable)
Emission Factor
Emission Factor
Numerator
Emission Factor
Denominator
CA LFG N/A 0.045 lb MMBtu
CS LFG N/A 0.045 lb MMBtu
ST LIG DRY TANGENTIAL 30*S lb short tons
ST LIG FLUIDIZED 10*S lb short tons
ST LIG WET FLUIDIZED 10*S lb short tons
ST LIG TANGENTIAL 30*S lb short tons
ST LIG DRY FLUIDIZED 30*S lb short tons
ST LIG DRY WALL 30*S lb short tons
ST LIG WET CYCLONE 30*S lb short tons
ST MSB N/A 1.7 lb short tons
ST MSW N/A 1.7 lb short tons
ST MSW OTHER 1.7 lb short tons
ST NG DRY VERTICAL 0.0006 lb Mcf
ST NG DRY WALL 0.0006 lb Mcf
ST NG DRY DUCTBURNER 0.0006 lb Mcf
CT NG N/A 0.0006 lb Mcf
CT NG DUCTBURNER 0.0006 lb Mcf
ST NG DRY TANGENTIAL 0.0006 lb Mcf
GT NG TANGENTIAL 0.0006 lb Mcf
ST NG DUCTBURNER 0.0006 lb Mcf
IC NG N/A 0.0006 lb Mcf
ST NG N/A 0.0006 lb Mcf
ST NG DRY STOKER 0.0006 lb Mcf
ST NG DRY CYCLONE 0.0006 lb Mcf
ST NG CYCLONE 0.0006 lb Mcf
GT NG N/A 0.0006 lb Mcf
ST NG FLUIDIZED 0.0006 lb Mcf
ST NG OTHER 0.0006 lb Mcf
CS NG N/A 0.0006 lb Mcf
ST NG N/A 0.0006 lb Mcf
CS NG DUCTBURNER 0.0006 lb Mcf
ST NG WET CYCLONE 0.0006 lb Mcf
ST NG STOKER 0.0006 lb Mcf
ST NG TANGENTIAL 0.0006 lb Mcf
CA NG DUCTBURNER 0.0006 lb Mcf
CA NG N/A 0.0006 lb Mcf
ST NG WALL 0.0006 lb Mcf
CA NG DRY DUCTBURNER 0.0006 lb Mcf

APPENDIX C
Technical Support Document for eGRID2016 ▌pg. 99
Prime Mover
Primary Fuel Type
Boiler Firing Type (if applicable)
Emission Factor
Emission Factor
Numerator
Emission Factor
Denominator
CA NG DRY WALL 0.0006 lb Mcf
CT NG N/A 0.0006 lb Mcf
CS OBG N/A 0.0065 lb MMBtu
IC OBG N/A 0.0065 lb MMBtu
ST OBG N/A 0.0006 lb Mcf
GT OBG N/A 0.0065 lb MMBtu
CA OBG N/A 0.0065 lb MMBtu
CT OBG N/A 0.0065 lb MMBtu
GT OBL N/A 0.0065 lb MMBtu
IC OBL N/A 0.0065 lb MMBtu
ST OBS N/A 0.025 lb MMBtu
ST OG CYCLONE 0.0006 lb Mcf
IC OG N/A 0.000588 lb MMBtu
ST OG DRY TANGENTIAL 0.0006 lb Mcf
ST OG DRY DUCTBURNER 0.0006 lb Mcf
ST OG DUCTBURNER 0.0006 lb Mcf
GT OG N/A 0.0006 lb Mcf
ST OG DRY WALL 0.0006 lb Mcf
ST OG N/A 0.0006 lb Mcf
ST OG OTHER 0.0006 lb Mcf
ST OG N/A 0.0006 lb Mcf
ST PC FLUIDIZED 0.362*S lb MMBtu
ST PC N/A 0.362*S lb MMBtu
CA PC OTHER 0.362*S lb MMBtu
ST PC OTHER 0.362*S lb MMBtu
ST PC WET WALL 0.362*S lb MMBtu
ST PC DRY WALL 0.362*S lb MMBtu
ST PC DRY FLUIDIZED 0.362*S lb MMBtu
GT PG N/A 0.0006 lb Mcf
ST PRG DRY WALL 0.0006 lb Mcf
ST PRG DUCTBURNER 0.0006 lb Mcf
ST PRG OTHER 0.0006 lb Mcf
ST PRG TANGENTIAL 0.0006 lb Mcf
ST PRG N/A 0.0006 lb Mcf
ST RC DRY TANGENTIAL 38*S lb short tons
CA RFO N/A 1.01*S lb MMBtu
IC RFO N/A 0.29 lb MMBtu
ST RFO WET WALL 6.594*S lb barrels

APPENDIX C
Technical Support Document for eGRID2016 ▌pg. 100
Prime Mover
Primary Fuel Type
Boiler Firing Type (if applicable)
Emission Factor
Emission Factor
Numerator
Emission Factor
Denominator
CT RFO N/A 1.01*S lb MMBtu
CT RFO N/A 1.01*S lb MMBtu
CS RFO N/A 1.01*S lb MMBtu
GT RFO N/A 1.01*S lb MMBtu
ST RFO DRY TANGENTIAL 6.594*S lb barrels
ST RFO DRY WALL 6.594*S lb barrels
ST RFO WALL 6.594*S lb barrels
ST RFO N/A 6.594*S lb barrels
ST RFO TANGENTIAL 6.594*S lb barrels
ST SGC N/A 38*S lb short tons
CT SGP N/A 0.362*S lb MMBtu
CA SGP N/A 0.362*S lb MMBtu
CS SGP N/A 0.362*S lb MMBtu
ST SUB DRY TANGENTIAL 35*S lb short tons
ST SUB DRY FLUIDIZED 35*S lb short tons
ST SUB N/A 35*S lb short tons
ST SUB TANGENTIAL 35*S lb short tons
ST SUB FLUIDIZED 35*S lb short tons
ST SUB CYCLONE 35*S lb short tons
ST SUB WET TANGENTIAL 35*S lb short tons
ST SUB DRY WALL 35*S lb short tons
ST SUB WET FLUIDIZED 35*S lb short tons
ST SUB WET CYCLONE 35*S lb short tons
ST SUB WET WALL 35*S lb short tons
ST TDF STOKER 38*S lb short tons
ST WC FLUIDIZED 30*S lb short tons
ST WC N/A 30*S lb short tons
ST WC DRY FLUIDIZED 30*S lb short tons
ST WDL N/A 0.025 lb MMBtu
ST WDS DRY WALL 0.025 lb MMBtu
ST WDS WET STOKER 0.025 lb MMBtu
ST WDS WET TANGENTIAL 0.025 lb MMBtu
ST WDS FLUIDIZED 0.025 lb MMBtu
ST WDS OTHER 0.025 lb MMBtu
ST WDS DRY TANGENTIAL 0.025 lb MMBtu
ST WDS N/A 0.025 lb MMBtu
ST WDS STOKER 0.025 lb MMBtu
ST WDS DRY STOKER 0.025 lb MMBtu

APPENDIX C
Technical Support Document for eGRID2016 ▌pg. 101
Prime Mover
Primary Fuel Type
Boiler Firing Type (if applicable)
Emission Factor
Emission Factor
Numerator
Emission Factor
Denominator
ST WDS DRY FLUIDIZED 0.025 lb MMBtu
CT WO N/A 1.01*S lb MMBtu
ST WO N/A 6.174*S lb barrels
GT WO N/A 1.01*S lb MMBtu
IC WO N/A 0.29 lb MMBtu
CA WO N/A 1.01*S lb MMBtu
ST WO DRY WALL 6.174*S lb barrels
CS WO N/A 1.01*S lb MMBtu
Source: AP-42 (EPA, 1995).
N/A = not applicable
S = sulfur content of fuel (%)
Biomass fuels used in the Plant file biomass emission adjustments
For more information regarding the methodology for biomass adjustments to emissions, please see
Section 3.1.2.1.
Table C-4. Fuel types and pollutants included in the Plant file biomass emission
adjustments
Fuel Type
EIA Fuel Type
Code CO2 NOx CH4 N2O
Agricultural
Byproducts AB x
Sulphite lyes
(Black
Liquor) BLQ
x
Digester Gas DG x
Landfill Gas LFG x x x x
Municipal
Solid Waste -
biomass
component MSB
x
Other Biogas OBG x
Other Liquid
Biofuels OBL x
Other
Primary Solid
Biomass OBS
x
Sludge
Waste SLW x
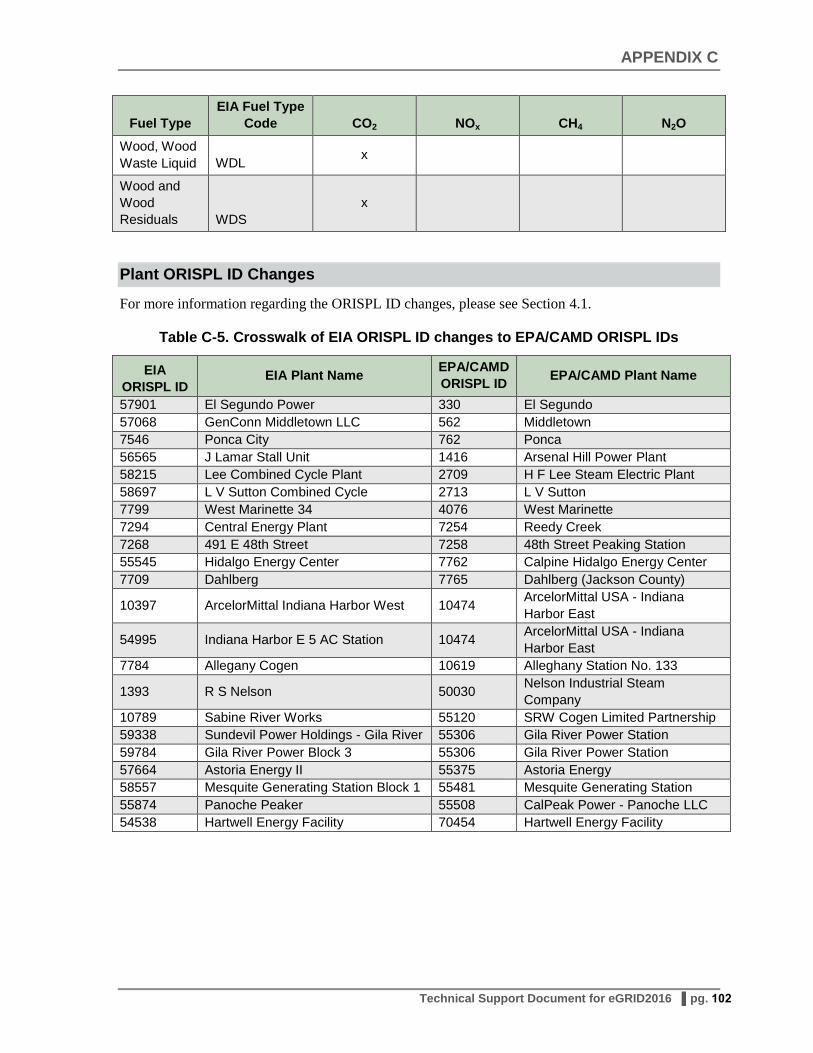
APPENDIX C
Technical Support Document for eGRID2016 ▌pg. 102
Fuel Type
EIA Fuel Type
Code CO2 NOx CH4 N2O
Wood, Wood
Waste Liquid WDL x
Wood and
Wood
Residuals WDS
x
Plant ORISPL ID Changes
For more information regarding the ORISPL ID changes, please see Section 4.1.
Table C-5. Crosswalk of EIA ORISPL ID changes to EPA/CAMD ORISPL IDs
EIA
ORISPL ID EIA Plant Name
EPA/CAMD
ORISPL ID EPA/CAMD Plant Name
57901 El Segundo Power 330 El Segundo
57068 GenConn Middletown LLC 562 Middletown
7546 Ponca City 762 Ponca
56565 J Lamar Stall Unit 1416 Arsenal Hill Power Plant
58215 Lee Combined Cycle Plant 2709 H F Lee Steam Electric Plant
58697 L V Sutton Combined Cycle 2713 L V Sutton
7799 West Marinette 34 4076 West Marinette
7294 Central Energy Plant 7254 Reedy Creek
7268 491 E 48th Street 7258 48th Street Peaking Station
55545 Hidalgo Energy Center 7762 Calpine Hidalgo Energy Center
7709 Dahlberg 7765 Dahlberg (Jackson County)
10397 ArcelorMittal Indiana Harbor West 10474 ArcelorMittal USA - Indiana
Harbor East
54995 Indiana Harbor E 5 AC Station 10474 ArcelorMittal USA - Indiana
Harbor East
7784 Allegany Cogen 10619 Alleghany Station No. 133
1393 R S Nelson 50030 Nelson Industrial Steam
Company
10789 Sabine River Works 55120 SRW Cogen Limited Partnership
59338 Sundevil Power Holdings - Gila River 55306 Gila River Power Station
59784 Gila River Power Block 3 55306 Gila River Power Station
57664 Astoria Energy II 55375 Astoria Energy
58557 Mesquite Generating Station Block 1 55481 Mesquite Generating Station
55874 Panoche Peaker 55508 CalPeak Power - Panoche LLC
54538 Hartwell Energy Facility 70454 Hartwell Energy Facility

APPENDIX C
Technical Support Document for eGRID2016 ▌pg. 103
Geothermal Geotype
Table C-6. Geothermal Emission Factors by Geotype and Pollutant
Geotype Code Geotype
Description NOx EF (lb/mWh) CO2 EF (lb/mWh) SO2 EF (lb/mWh)
F Flash 0 60 0.35
S Steam 0.00104 88.8 0.000215
B Binary 0 0 0
B/F Binary/Flash 0 0 0
English to Metric Conversion Factors
Table C-7. Conversion Factors
English
Value
English
Unit
Metric
Value
Metric
Unit
1.10231 short ton 1 metric ton
2.2046 pound (lb) 1 Kilogram (kg)
0.9478 MMBtu 1 Gigajoule (GJ)
0.2778 GJ 1 Megawatt-hour
(MWh)

APPENDIX D
Technical Support Document for eGRID2016 ▌pg. 104
Appendix D. Information on Prior Editions of eGRID
Previous releases of eGRID include the following:
eGRID1996 was first released in December 1998.
eGRID1997, with 1996 and 1997 data, was first released in December 1999.
eGRID1998, with 1998 data, and with 1996 and 1997 data from eGRID97, was released in March
and September 2001.
eGRID2000, with preliminary 2000 data, was first released as Version 1.0 in December 2002 and
with 1996-2000 data as Version 2.0 in April 2003 and Version 2.01 in May 2003.
eGRID2004 Version 1.0, with the year 2004 plant spreadsheet file, was first released in
December 2006; Version 2.0, which includes one Excel workbook with an updated plant file, as
well as the boiler and generator files for year 2004, was released in early April 2007; and Version
2.1, with the complete set of files – boiler, generator, plant, state, electric generating company
(EGC) location (operator)- and owner-based, parent company location (operator)- and owner-
based, power control area, eGRID subregion, and North American Electric Reliability
Corporation (NERC) region – was released in late April 2007 and updated for typos in May 2007.
eGRID2005 Version 1.0 was released in October 2008 and Version 1.1 was released in January
2009, both with two Excel workbooks with year 2005 data (plant and aggregation) and one Excel
workbook with years 2004 and 2005 data (ImportExport).
eGRID2007 Version 1.0 was released on February 23, 2011 and Version 1.1 was released May
20, 2011, including three Excel workbooks with year 2007 data as well as data for years 2004 and
2005 (the same as those included in eGRID2007). Import-export data for years 2007, 2005, and
2004 are also included.
eGRID2009 Version 1.0 with year 2009 data was release on May 10, 2012. This edition also
includes year 2007, 2005, and 2004 data from the three previously released editions. Import-
export data for years 2009, 2007, 2005, and 2004 are also included.
eGRID2010 Version 1.0 with year 2010 data was released on February 24, 2014. This edition
also includes year 2009, 2007, 2005, and 2004 data from the three previously released editions.
Import-export data for years 2010, 2009, 2007, 2005, and 2004 are also included.
eGRID2012 Version 1.0 with year 2012 data was released on October 8, 2015.
eGRID2014 Version 1.0 with year 2014 data was released on January 13, 2017 and Version 2.0
was released on February 27, 2017.
Note that the naming convention for eGRID had been changed since the release of eGRID2012 so
that the year noted in the title reflects the data year rather than the release year.
Top Related