


![Edinburgh Research Explorer · The effect of pressure on the crystal structure of [Gd(PhCOO) 3 (DMF)] n to 3.7 GPa and the transition to a second phase at 5.0 GPa**† Pascal Parois,1](https://static.fdocuments.in/doc/165x107/60ac0d3fb64b383e4a627853/edinburgh-research-explorer-the-effect-of-pressure-on-the-crystal-structure-of-gdphcoo.jpg)

Languages
Pages
Legal


THE EFFECTS OF THE WEB TRANSITION PROGRAM ON MIDDLE
SCHOOL STUDENT GPA, ATTENDANCE, AND SUSPENSIONS
Steven Jerome Skoczek
Bachelors in Science – Secondary Science 1995
Masters of Science – Educational Administration 2001
Submitted to the Faculty of the School of Education of Baker University in partial
fulfillment of the requirements for the degree of Doctor of Education in Educational
Leadership.
April 25th, 2011
Copyright 2011 by Steven Jerome Skoczek

ii
Clinical Research Study Committee
Major Advisor

iii
ABSTRACT
The purpose of this study was to compare achievement, attendance, and
suspensions of Olathe, Kansas seventh grade students who participated in the Where
Everybody Belongs (WEB) program with seventh grade students who did not participate
in the WEB program as they made the transition from an elementary school setting to a
junior high setting.
During the 2008 – 2009 school year, four Olathe, Kansas junior high schools
implemented the WEB transition program and four schools did not implement the WEB
program as students transitioned from an elementary school setting to a junior high
school setting.
For this study, the researcher collected archived quantitative data covering
cumulative student grade point averages, student daily attendance, and student
suspensions from the Olathe School Database system known as the AS400. Descriptive
statistics, two-tailed independent samples t-tests (at the 0.05 level of significance), and
ANOVAs were conducted. The results of the study indicate WEB participants earned a
significantly higher GPA compared to students who were not exposed to the WEB
program. There was no significant difference in attendance or suspensions between the
two groups of students. ANOVA results also revealed no effect of gender, minority,
SES, SPED, or ELL status on the difference in GPA, attendance, or suspensions between
the two groups.

iv
ACKNOWLEDGEMENTS
The realization of this degree could not have come without the help and guidance
from others. First, I want to thank Dr. Bill Neuenswander, my major advisor, for
countless pieces of advice and suggestions. The words, “keep moving forward” served to
motivate me and push me through the times I would have sooner given up on this study.
Next, I want to thank Peg Waterman, Baker University Research Analyst. Peg, you kept
the wonderful world of statistics simple enough that even I could understand. Thank you
for all of the time spent going over numbers with me.
Third, I wish to thank my wife, Marsha, and my four children, Sophie, Jacob,
Natalie, and Daniel. Marsha put up with Thursday night classes, late night work sessions,
limited help from her husband, and tornadoes for two years,. Your support and love kept
me motivated. To my children, I hope you learned that you can do anything you put your
mind to doing.
Finally, I want to thank my parents, Donna and Jerry, for always being there for
me. I hope you are proud of my accomplishments as you played a huge role by you
encouraging me to complete the doctorate degree. I cannot begin to tell you how grateful
I am for what you have given me over the years.

v
TABLE OF CONTENTS
CLINICAL RESEARCH STUDY COMMITTEE AND SIGNATURES ......................... ii
ABSTRACT ....................................................................................................................... iii
ACKNOWLEDGEMENTS ............................................................................................... iv
TABLE OF CONTENTS .....................................................................................................v
LIST OF TABLES ........................................................................................................... viii
CHAPTER ONE: INTRODUCTION AND RATIONALE ................................................1
Problem Statement .......................................................................................1
Background & Conceptual Framework .......................................................2
Significance..................................................................................................7
Purpose Statement ........................................................................................7
Delimitations ................................................................................................8
Assumptions .................................................................................................8
Research Questions ......................................................................................8
Definition of Terms......................................................................................9
Overview of Methodology ........................................................................10
Summary/Organization of Study ...............................................................11
CHAPTER TWO: REVIEW OF LITERATURE ..................................................12
Introduction ................................................................................................12
History of Junior High and Middle Schools ..............................................13
Transition from one Delivery System to Another......................................17
Transition Programs ...................................................................................19
Motivation ..................................................................................................20

vi
Achievement ..............................................................................................23
Attendance .................................................................................................24
Student Suspensions and Behavior ............................................................26
Summary ....................................................................................................28
CHAPTER THREE: METHODS ..........................................................................29
Introduction ................................................................................................29
Research Design.........................................................................................29
Population and Sample ..............................................................................29
Sampling Procedures .................................................................................30
Instrumentation and Data Collection .........................................................31
Data Analysis and Hypothesis Tests ..........................................................32
Limitations .................................................................................................33
Summary ....................................................................................................34
CHAPTER FOUR: RESULTS ..............................................................................35
Introduction ................................................................................................35
Descriptive Statistics ..................................................................................35
Hypothesis Testing and Results .................................................................43
Additional Analyses ...................................................................................45
Summary ....................................................................................................47
CHAPTER FIVE: INTERPRETATION AND RECOMMENDATIONS ............48
Introduction ................................................................................................48
Study Summary ..........................................................................................48
Overview of the Problem ...........................................................................48

vii
Purpose Statement ......................................................................................48
Review of Methodology ............................................................................48
Major Findings ...........................................................................................49
Findings Related to the Literature..............................................................50
Conclusions ................................................................................................52
Implications for Action ..............................................................................52
Recommendations for Future Research .........................................................52
Concluding Remarks ..................................................................................54
REFERENCES ......................................................................................................56
APPENDEX ..........................................................................................................63
APPENDEX A: INSTITUTIONAL REVIEW BOARD FORM .........................64
APPENDEX B: INSTITUTIONAL REVIEW BOARD APPROVAL ................68
APPENDEX C: OLATHE UNIFIED SCHOOL DISTIRCT #233 APPROVAL . 69

viii
LIST OF TABLES
Table 1. Demographics for Schools that Implemented WEB in 2008 - 2009 .......... 3
Table 2. Demographics for Schools that did not Implement WEB in 2008 - 2009 .. 4
Table 3. Olathe School District Junior High School Enrollment 2008 - 2009 ....... 30
Table 4. Gender Data for Sample ........................................................................... 35
Table 5. English Language Learner Status ............................................................ 36
Table 6. Socio-Economic Status ............................................................................. 37
Table 7. Special Education Status ........................................................................... 38
Table 8. Student Ethnicity Status ............................................................................ 39
Table 9. WEB Participation – Gender Cross Tabulation ........................................ 39
Table 10. WEB Participation – ELL Status Cross Tabulation ................................ 40
Table 11. WEB Participation – Special Education Status Cross Tabulation .......... 41
Table 12. WEB Participation – SES Status Cross Tabulation ................................ 42
Table 13. WEB Participation – Student Ethnicity Cross Tabulation ...................... 43
Table 14. ANOVA Results for Grade Point Average ............................................. 45
Table 15. ANOVA Results for Attendance ............................................................ 46
Table 16. ANOVA Results for Suspensions ........................................................... 46

CHAPTER ONE
INTRODUCTION AND RATIONALE
Transitions in schools are typically marked by a student moving up in grade level,
moving to new school facilities, or moving to a school where the organizational structure
is different than previous schools. Most elementary school students are taught in small,
self-contained classrooms where students develop close relationships with classroom
peers and the individual teacher. On the other hand, most junior highs and middle
schools employ a departmental setting, require students to interact with more peers,
increase the number of teachers for students to work with, and use competition to
motivate student performance in the classroom. In addition to the substantial changes
observed in the transition to middle schools, students are also undergoing many personal
changes, including emotional, social, psychological, and physiological, which can make
the transition more difficult. “The lack of coping skills can have significant effects on
adjustment, achievement, aspirations, and feelings of self-worth” and can overwhelm
students (Shoffner & Williamson, 2000, p. 3). Since all students encounter transitions
during their educational lives, it is important that school leaders understand the effects of
transitions on student learning, student attendance, and student behavior.
Problem Statement
Every year, students undergo educational transitions moving from self-contained
elementary classrooms to junior high or middle school settings. This transition, once
defined as a rite of passage, has been pushed to the center of educational debate as federal
legislation mandates success for all students. Illustrating difficulties with transitions, an
almost 30 year old study by Blyth, Simmons, and Carlton-Ford (1983) illustrated

2
significant drops in grade point average (GPA), especially for students who made a
transition from an elementary school in grade six to junior high in grade seven. A 2010
study completed by Rockoff and Lockwood found significant drops in academic
achievement for both math and English. Freeman (2005) discovered students in grade K-
8 schools had higher attendance than students who attended middle schools. It is critical,
therefore, for educators to understand the difficulties students experience in making
transitions from one educational design to another. Finally, a study completed by
Balfanz (2008) found that sixth grade students who attended school less than 80% of
school days, had more behavior problems, failed more frequently in math and reading,
and had 25% lower graduation rates than did their peers who attended more regularly.
Drawing on findings and concepts from previous works which looked at several
school outcome measures, this study investigates whether seventh grade students who
were exposed to the Where Everybody Belongs (WEB) transition program had
differences in grade point averages, attendance, and suspensions compared with those
seventh grade students who were not exposed to the WEB program. Students in seventh
grade were chosen for this study as this is the grade at which students transitioned from
elementary school to junior high school in the Olathe School District during the 2008 –
2009 school-year. This study involved students in a junior high setting. Although much
of the research was conducted in middle school settings, both the junior high and middle
school settings are transitioning elementary students into new organizational structures
with similar age students.
Background and Conceptual Framework
Traditionally, the Olathe School District has served students in grades seven
3
through nine using the junior high school delivery model. Starting with the 2008 school
year the Olathe School District implemented the WEB transition program for students
entering seventh grade in four of its eight junior high schools. The WEB program was
implemented to assist students transitioning from self contained elementary schools to
more departmentalized junior high schools (Olathe School District, 2007).
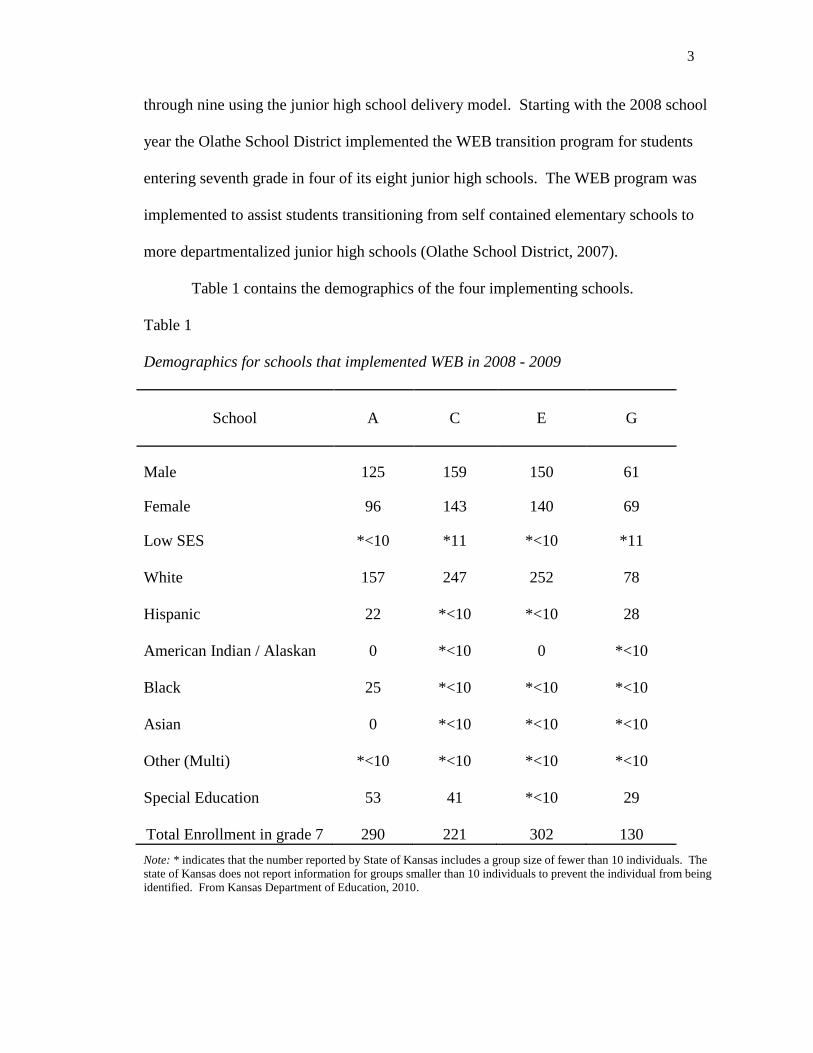
Table 1 contains the demographics of the four implementing schools.
Table 1
Demographics for schools that implemented WEB in 2008 - 2009
School
A
C
E
G
Male 125 159 150 61
Female 96 143 140 69
Low SES *<10 *11 *<10 *11
White
157
247
252
78
Hispanic
22
*<10
*<10
28
American Indian / Alaskan
0
*<10
0
*<10
Black
25
*<10
*<10
*<10
Asian
0
*<10
*<10
*<10
Other (Multi)
*<10
*<10
*<10
*<10
Special Education
53
41
*<10
29
Total Enrollment in grade 7
290
221
302
130
Note: * indicates that the number reported by State of Kansas includes a group size of fewer than 10 individuals. The
state of Kansas does not report information for groups smaller than 10 individuals to prevent the individual from being
identified. From Kansas Department of Education, 2010.

4
Table 2
Demographics for schools that did not implement WEB in 2008 - 2009
School
B
D
F
H
Male 113 121 143 107
Female 115 115 165 100
Low SES *<10 *<10 *<10 31
White
159
208
247
125
Hispanic
43
*<10
*<10
42
American Indian /Alaskan
0
0
0
*<10
Black
*<10
*<10
*<10
*10
Asian
0
0
*<10
0
Other (Multi)
*<10
*<10
*<10
*<10
Special Education
30
*10
*<10
*14
Total
228
236
308
207
Note: * indicates that the number reported by State of Kansas includes a group size of fewer than 10
individuals. The state of Kansas does not report information for groups smaller than 10 individuals to
prevent the individual from being identified. From Kansas Department of Education, 2010.
The four schools that implemented the WEB program represent a total enrollment
of 2848 students spanning grades seven through nine. 943 seventh grade students started
the 2008 – 2009 year in schools that implemented the WEB program. This study used
only those Olathe seventh grade students who began the 2008 – 2009 school-year and
completed the year in the same school building. Only 902 WEB students were used in
this study because they both started and completed the school year in the same building.
5
The four schools that did not implement the WEB program had a total enrollment
of 2845 students, of which 979 were in the seventh grade. Of the students enrolled in
non-WEB schools, only 921 were used in the study because they both started and
completed the school year in the same building. Table 2 (page 4) contains the
demographic data for seventh grade students in schools that did not implement the WEB
program in 2008 – 2009 school-year.
Hill, C., Campbell, M. B., & Jacobson, M. (2007), developers of the WEB
program, suggested that the program should increase attendance, decrease student
discipline, and increase student achievement. Hill, et al (2007) also offered that
participation in WEB program activities might accomplish these three changes by
addressing the three fundamental student transition needs: safety, information, and
connection. According to the training provided by the Boomerang Project, in order for
schools to see the benefits of the WEB program, schools must implement the WEB
program specifically as presented at WEB Leader Basic Training (Boomerang Project,
2009).
The National Middle School Association (NMSA) (2002) has made several
suggestions that need to be considered when implementing successful transition
programs. The NMSA suggests that transition programs should address (a) student
anxiety associated with the move to a new school, (b) the importance of the parents and
school staff in the transition process, and (c) the understanding that successfully
overcoming the transition is an on-going process, not a one-time event or activity
(NMSA, 2002).
6
Akos (2002) discovered what students want most is to know the rules and
procedures in the school. WEB orientation-day activities are designed to give new
students tools for success at their new school. These activities provide students with
information, such as class bell schedules, school layout, and the location of the counselor
and administrator offices, to help them understand where to access assistance when it is
needed. In a study conducted by Arowsafe and Irvin (1992), students reported having
safety concerns about how new students might get along with the older students. Safety is
addressed through several WEB program activities by utilizing older students as peer
mentors and activity leaders for the incoming students. New students develop positive
relationships with older students, providing the new students an initial and consistent safe
person at the new school (Hill et al, 2007).
According to a 2007 posting by Hill et al, the WEB program fosters and develops
connectedness for students as they transition into the middle school by using older peers
working with incoming students for the whole school year. The WEB program begins by
partnering students entering grade seven with older student mentors (ninth grade
students) where relationships develop in small group settings on the very first day of
school. The school year continues with social and academic “follow-ups” designed to
build upon those initial relationships and increase student connectedness to school. The
more connected to school students are, the “better they will do in all measures that count”
(Hill et al, 2007, paragraph 10). Akos’ 2002 report is consistent with Hill et al’s rationale
as Akos suggested students new to a school tend to have questions regarding rules and
procedures but they also worry about topics such as bullying, safety, and homework.
Akos also suggested that peers be used as tour guides or mentors to build relationships

7
(connectedness) as “students often look to significant others for help” during the
transition to the middle school (p.7).
Significance of the Study
This study will be useful in assisting the Olathe School District make decisions
related to transitions and the continued use of the WEB program. With the new grade
configuration, the Olathe School District (2007) realized new challenges relating to
student transition. Data, such as that provided by this study, on differences existing
between WEB and non-WEB schools relating to student achievement, absences, and
suspensions needs to be evaluated. The results of this study will demonstrate the
effectiveness of the WEB program when transitioning seventh grade students to a
different organizational structure within the Olathe School District justifying the decision
to use or abandon the WEB program. Malaspina & Rimm-Kauffman (2008) stated, there
is “surprisingly little research that exists about the extent to which school transitions pose
a challenge and cause academic and social performance declines” (p.1). Parents,
teachers, and students alike are all concerned about the academic successes of students as
they move from the elementary school to a new middle or junior high school setting.
Statement of Purpose
The purpose of this study was to compare the achievement, attendance, and
suspensions of seventh grade students who participated in the WEB program with
seventh grade students who did not participate in the program as they made the transition
from an elementary-school setting to junior high setting.
8
Delimitations
The delimitations for this study begin with the schools selected for participation.
This study used data from all of the eight Olathe District junior high schools. All
students in seventh grade during the 2008 – 2009 school year who started and ended the
school year in the same school building were used in this study.
A second delimitation in the study was the year the data were collected. Data
were used from the 2008 - 2009 school year, the year the Olathe School District
implemented the WEB Transition Program in four of its eight junior high schools.
A third delimitation was the variables used in this study. This study explored
student grade-point averages, student daily attendance and student suspensions. Results
from state assessments were not used as part of the grade-point-average calculation.
Examples of variables not chosen for the study were student scores on the Kansas Math
and Reading Assessments, Kansas Writing Assessment, and the Kansas Social Studies
Assessment.
Assumptions
It was assumed that the results obtained from this study participants mirror results
from other members of the population. Secondly, it was assumed that all schools that
implemented the WEB program did so in accordance with WEB guidelines and timelines.
Finally, it was assumed the data used in this study were accurately pulled from the school
database system.
Research Questions
Following are three research questions that guided this investigation into the
effects of the implementation of an elementary to middle or junior high school

9
transition program.
1. Do students who participate in the WEB transition program have differences
in grade point averages than those who do not participate in the WEB
program?
2. Do students who participate in the WEB transition program have differences
in attendance than those who do not participate in the WEB program?
3. Do students who participate in the WEB transition program have differences
in occurrences of in-school and/or out-of-school suspensions than those who
do not participate in the WEB program?
Definitions of Terms
The following terms were used in the study:
Attendance: The total number of school days in membership (enrolled) for
each student. In the Olathe School District, when students missed1-2 class
periods a day, a full day of attendance was counted. When students missed 3
class periods then .50 day of attendance was counted and when a student
missed more than 4 periods in a day, no attendance was recorded (Olathe
School District, 2011).
Suspension: The number of suspension days (in-school suspension or out-of-
school suspension) assigned to a student. In the Olathe School District, if a
student is in ISS or OSS for any part of the day, the whole day is coded as a
suspension day (Olathe School District, 2011).
Grade Point Average: The total number of grade points earned, divided by
the total number of class hours (credits) attempted. Grades are based upon a

10
4-point system and weighted grades are not used in the junior high schools
(Olathe School District, 2011).
Transition: The process of moving from one organizational structure to
another.
Where Everybody Belongs Transition Program (WEB): A transition
program developed by Hill et al. designed for students leaving elementary
school moving into a middle or junior high school building. The WEB
program consists of an orientation day, mentor program, and on-going social
and academic activities throughout the school year (Hill et al, 2007).
Overview of Methodology
Quantitative data were collected for the 2008 - 2009 school year from the Olathe
School District record-keeping software known as the AS400. Participant data were
tracked as students moved from sixth grade (elementary school) to seventh grade (junior
high school) in the Olathe School District. This study actually included 1823 seventh
grade students who both began and completed the 2008 – 2009 school year in the same
school building. Data on student grade point average, student attendance, and student
suspensions were gathered. A t test for independent means was conducted to test
whether students exposed to the WEB program and those not exposed to the WEB
program had differences in any of the following: grade point averages, daily attendance,
and number of days suspended. Descriptive statistics were calculated to describe the
demographics of the sample. Finally, ANOVAs were conducted to determine whether
minority, SES, SPED, ELL, or gender status affected the difference in GPA, attendance,
and suspensions between WEB participants and non-WEB participants.

11
Summary and Organization of the Study
Chapter one presented the rationale and background for this study. Chapter two
presented a review of the literature on transitioning to a new delivery system, a brief
history of the junior high and middle schools, and research summarizing the effects of
transition on achievement, attendance, and behavior in junior high and middle schools.
Chapter three presented methodology and explains the methods and statistics that were
utilized in this study. Chapter four presented the results found in the study, framing them
around the questions and hypothesis developed in chapter one. Finally, chapter five
contained an interpretation of the results, linking study data to research and making
recommendations for further study on the topic of transitions.

12
CHAPTER TWO
REVIEW OF THE LITERATURE
The National Middle School Association (NMSA) estimates that, more than 88%
of public school students move from an elementary school to junior highs and middle
schools to the middle-level grades (NMSA, 2002). As students move from one
organizational structure to another, problems often arise in the areas of achievement,
attendance, and suspensions. Therefore, it is imperative to research strategies and
techniques that enable students to undergo transitions from one organizational structure
to another.
Recent middle school reform has centered upon comprehensive transition
programs that address needs of incoming students. Successful transition programs not
only focus on the academic needs of students but also spotlight the social needs, center on
teaching new students survival skills, and provide opportunities for student involvement
(Cauley & Jovanovich, 2007; Eccles, Wigfield, Midgley, Reumn, Mac Iver, & Feldlaufer
(1993); and Juvonen, 2007). Additionally, some argue that, in order to be successful,
transition programs need to be year-long and not just a one day activity (Elias, 2002;
NMSA, 2002; Shoffner & Williamson, 2000). Since the passage of the No Child Left
Behind legislation, the importance has increased for schools to understand the effects
transitions have on student achievement, attendance, and suspensions.
The purpose of this study is to determine if the implementation of the WEB
transition program has an impact on student achievement, attendance, and student
suspensions. This chapter is designed to summarize the research and effectiveness of
transition programs on middle level programs. The first area of review is the history of

13
junior high and middle school programs, followed by a review of suggested components
of transitions to junior high and middle level programs. Next is a summary of an
example of a transition program for students entering junior high and / or middle schools.
Additional research is needed on the transition from elementary school settings to junior
high or middle school and the variables of attendance, grade point average, and student
suspensions.
The earliest creation of middle level schools sought to better serve student needs
by offering schools that were responsive not only to academics but also to social needs
(Alexander & McEwin, 1989; Coleman 2001; and Manning, 2000). The National Middle
School Association (2002) suggests that middle schools focus on connecting students to
school as a way to impact student engagement and academic achievement.
The chapter concludes by reviewing how transitions impact student achievement,
attendance, and suspensions. Researchers discussed below have illustrated that
motivation, achievement and attendance often drop and suspensions rise as students move
from elementary to junior high and / or middle schools. Explanation for these drops
varies, but they might be related to student connectedness to school and the structure of
the school itself.
History of Junior High and Middle Schools
The first junior high schools were implemented in Ohio in 1909 and were created
to ease the transition from elementary school to high school (Juvonen, 2007; Manning,
2000). Curriculum for students was centered upon either vocational training or college
preparatory programs. This model worked for a long time because it was very good at

14
producing workers for the workforce while separating higher-ability students for college
(Manning, 2000).
Traditional schools of the 19th
century in the United States were built on a two-
level system (grades K-8 and 9-12) but the shift to junior high schools changed the
structure to a three-level system. A major reason for the shift to the junior high concept
came from groups such as the National Education Association (NEA) which sought to
create a school to better meet the needs of its students (Manning, 2000). Additionally, in
the 20th
century, junior high schools (as well as early middle schools) were created to
comply with mandates on desegregation and to address overcrowding issues found in
many elementary schools (George & Alexander, 2002). By the 1960s, approximately 80
percent of the schools in the United States were on the three-level delivery system
(elementary, junior high or middle school, and high school) compared to the 1920s, when
nearly 80 percent used a two-level delivery system (Alexander & McEwin, 1989).
During the 1950s and 1960s, the junior high model began to undergo a review because of
federal de-segregation regulations and to determine if there were better ways to meet the
needs of the students. Researchers such as Eccles, Midgley, and Lord (1991) began to
look at the structure of the school and the needs of students and noticed a mismatch
between the junior high school and the learner.
Groups such as the National Middle School Association began to lobby for the
creation of a new school called a “middle school” that would be better at meeting the
needs of the students. Early middle schools did not focus solely on academic needs, but
also focused on social and emotional needs (Coleman, 2001; Alexander & McEwin
1989). Michigan is credited with implementing the first middle school in 1950.

15
Following its development, the middle school became a buzz word in the education world
and many more middle schools were implemented in school districts across the country
(Manning, 2000).
What separates a junior high from a middle school is in the characteristics of the
school itself. Alexander and Williams (1968, as cited in Manning, 2000) made
recommendations to provide additions to the original junior high school curriculum by
adding opportunities such as “guidance programs, exploratory programs, and vocational
and home arts” (p. 192). Erb (2006) suggested that “highly qualified teachers and
schools with strong leadership are a strong indicator of school success” and with “faithful
implementation of middle school reform efforts such as Turning Points, the research is
overwhelmingly positive in terms of student achievement and behavior” (p. 5). Middle
schools also depend upon teacher collaboration, looping, and flexible scheduling, as well
as changing the role of administration from a facilitator to a curriculum leader (George &
Alexander, 2002). In 1989, Alexander and McEwin generated the following list of
effective middle school characteristics:
1. Interdisciplinary teaching model with flexible time schedules.
2. Adequate guidance programming (including advisory programs).
3. Exploratory programming.
4. Comprehensive curriculum to prepare students in basic and continued learning
skills.
5. The use of effective instructional methods in the classrooms.
6. Continued preparation for the next level of schooling (high school).
(Alexander & McEwin, 1989, pp. 4-7)
16
Felner and Jackson (1997) noted that positive changes have occurred in the way
schools are aligned with student needs, but he suggested additional change is needed to
become more effective. Much of what was originally considered effective in middle
school design continues to be in use, but the middle school has evolved as it has aged. In
addition to utilizing what has stood the test of time, Felner and Jackson suggested
implementing ideas promoted by the Turning Points Comprehensive School
Transformation project. Turning Points schools (where implementation has been
comprehensive) have demonstrated that student achievement raises, student behavior
problems decrease, and students feel safer at school. Suggested changes in the middle
school recommended by Turning Points include:
1. Keeping older students away from younger students.
2. Use of teacher teams and advisory-based time with adults. Teams should be
no more than 120 students per four adults.
3. Monitor the social losses associated with the transition from elementary to
middle school, especially for students who come from “at risk” populations.
4. Provide teachers a minimum of four common planning periods a week to
collaborate.
Coleman (2001) recommended that, for schools to have meaningful changes there
must be buy-in by all members of the school. Coleman also added that middle schools
are now dealing with emphasizing a rigorous curriculum, a re-design of advisory time,
and purposeful planning for students as they enter the middle school.
Yecke (2005) used the 1989 Carnegie Report to begin a hard look at the
shortcomings of middle schools. Yecke looked at data on how the United States is

17
falling in comparison to other nations on the National Assessment on Educational
Progress (NAEP) test and concluded schools need to change their focus back to education
and achievement and move away from other social issues. Yecke argued that parents are
dissatisfied with the middle school curriculum and behavior expectations and urged those
involved with education reform movements to return to a focus on high academic
standards rather than a low-level curriculum that waits for students to pass through the
early adolescence phase of life.
Transitioning from one Delivery System to Another
Huntinger (1981, as cited in Perkins & Gelfer, 1995) defined transitional activities
by saying, transitions are “those practices and procedures that schools can use to ensure
the smooth adjustment of students as they move from one grade to another” (p. 171).
Transitions in schools are often viewed as “rites of passage” that tend to upset the balance
within students, forcing them to redefine themselves in an environment that is more
demanding (Elias, 2002). Many studies have concluded students often have lower
academic success, increased absences, and increased behavior issues as students move
from one delivery system to another (Alspaugh, 1998; Bedard & Do, 2005; Balfanz
Herzog, & Mac Iver, 2007).
Several pieces of research suggested that students experience more stressors as
they move from one organizational structure to another. For example, Eccles and
Midgley (1989) hypothesized student declines in middle level schools were due not only
to changes in the individual, but also to the differences in the structure of the school and
how middle schools do not adequately meet the needs of its students. Eccles, et al (1993)
suggested that adolescents in middle schools need autonomy, social acceptance, and

18
engagement in abstract activities. Further, Crockett, Peterson, Graber, Schulenberg, and
Ebata (1989) noted boys seem to struggle more with academic achievement and girls tend
to struggle with peer relationships. Perkins and Gelfer (1995) completed a study that
showed the transition to middle schools is difficult because students must learn new
school rules and procedures, make new friends, learn the layout of a new school,
complete more academic work on their own, and live up to greater teacher expectations.
Arowsafe and Irvin (1992) interviewed middle level students and found students feared
learning new procedures, bullies, academic workload, getting lost at school, and
friendship as they moved to the middle school. Anderman and Midgley (1996) noticed
that motivational losses occured due to the increased stress on social and interpersonal
skills.
Building upon the work of Anderman and Midgley (1996), Chung, Elias, and
Schneider, (1998), Perkins and Gelfer (1995), and Eccles, et al (1993) suggested students
must also deal with larger class sizes, the addition of activities, additional teacher styles,
and changing relationships with adults and peers. Akos (2002) added that transitions are
difficult because they involve changes in the individual as well as in the physical setting
of the school itself.
Elias (2002) reported that, during the transition from elementary to middle-level
schools, students might lose sight of their identity, which causes them to develop a new
identity in a more challenging environment (p. 41). Elias suggested that, for students to
have the most successful transition, adults need to provide “skill training and social-
emotional learning” (p. 42). Elias generated a list of ideas that schools should build
experiences around so the school meets the student’s needs. The list includes:

19
1. Opportunities to give contributions to causes.
2. Opportunities to find and develop positive relationships with peers.
3. Opportunities for the student to explore and develop their talents.
4. Opportunities to learn and practice life skills such as goal setting,
understanding feelings and emotions, and how to work in groups (pp. 42-43).
Perkins and Gelfer (1995) also generated a list of ideas that make the transition
from elementary school to middle level schools smoother. This list is as follows:
1. Planning team consisting of administration, counselors, etc. to assist with
special needs of students.
2. Identification and goal setting for problems that come up.
3. Development of strategic plans written and shared with all stakeholders.
4. Building wide support for the efforts of the transition team.
5. An evaluation of the process (p. 172).
Transition Programs
A number of studies have been conduced to measure the effects of a transition
program on GPA, attendance, and suspensions. Following is a summary of research
studies covering the effects of elementary school to middle level transition programs on
several school outcomes.
Ferguson and Bulach (1994) conducted a study of the Shadow Program, an
elementary-to-middle school transition program used by Whitewater School in Fayette
County, Georgia. Ferguson and Bulach’s study compared the social adjustment levels of
students exposed to the Shadow Program to those who were not exposed to it. In the
Shadow Program, elementary students visited the middle school where they shadowed an

20
older student for a day. Ferguson and Bulach found that students who were exposed to
the Shadow Program were more socially adjusted compared to those who were not
exposed to the program. Further, according to Ferguson and Bulach, “Students need to
believe the environment is challenging, secure, and safe” (p. 22) and suggested that a
transition program be built to address these needs.
The Kickoff Transition Program combined orientation and mentoring programs
that helped students transition from elementary schools to middle school (Lonzo, 2001).
The Kickoff Program used upper classmen to organize an interactive orientation day
before school started and continued with year-long activities designed to ease the
transition for both students and parents. Implementation of the activities of the Kickoff
Program helped develop a positive school atmosphere where students want to stay in
school and mentors are used as a “safety net” for new students. While no formal research
studies have been done about the Kickoff Program, the program developers cited schools
where administrators are very positive about the implementation of the Kickoff Program.
The WEB program has been used by many schools across the nation. The WEB
program developers have collected data from several school districts who have
implemented the WEB program. According to Hill et al, WEB schools generally showed
a decrease in suspensions and an increase in student grades (Hill et al, 2007).
Motivation
As students transition to new organizational structures, it is imperative to
understand what factors might impact student achievement, attendance, and suspensions
so intervention programs can better address student transitions. Motivation towards

21
school tends to drop from late elementary through middle school into early high school
(Hudley,Doud, Hershberg, Wright-Castro, & Polanco, 2002).
Anderman and Midgley (1998) looked at academic motivation in middle school
from three points of view in an attempt to explain the drop in motivation in middle
school. First, they reviewed Attribution Theory, which simply states student perceptions
of their own ability impact motivation. If students feel they are in control and can
succeed, they are more likely to try harder and maintain motivation. If the opposite is
true and students feel successes are out of their control, motivation decreases. Hudley, et
al (2002) states, “those who are intrinsically motivated will learn because they feel they
can and they find joy in the action” of learning (pp. 3-4).
Anderman and Midgley’s (1998) second point of view related to Goal Theory,
which was explained as students being either goal or task orientated. Task orientated
students believe the purpose of learning is to increase one’s own skills or understanding.
Goal orientated students focus on one’s own progress and learning. Goal orientated
students tend to focus their energy on demonstrating what they have learned while task
orientated learners tend to focus on tasks to complete to increase their learning.
Anderman and Midgley suggested that the best match for success in schools is for
students to be task oriented. They took a more detailed approach to the goal theory and
studied it while looking at academic success. Looking at the structure of the middle level
classroom, they found many middle level classrooms tend to focus on ability goals and
elementary school classrooms focus on task completion. If the learner perceives the
classroom as one that aligns with his or her style (task or goal orientated) the student may

22
put forth more or less effort. Anderman and Midgley suggested student perception of the
classroom can impact motivation depending upon the learning style of the learner.
Anderman and Midgley’s (1998) third point of view was related to Self
Determination Theory, which they explained as students’ need to believe in oneself,
desire to fit in, and need to be independent. Hudley, et al. (2002) discovered a “major
predictor of engagement was a student’s own perceptions of their school abilities” (p.10).
Juvonen (2007) summarized studies done by others finding that students who felt others
cared for them, tried harder in school and did better with the transition to middle school.
Siefert (2004) suggested there are four theories at the forefront of explaining
student motivation: Self Efficacy Theory, Attribution Theory, Self-Worth Theory, and
Achievement Goal Theory. Self Efficacy Theory relates to how a person interprets
his/her own ability to complete a given task. Students who feel they will perform
satisfactorily on a task often do perform well, and those who feel they will not perform
well on a task often do not do well. Self efficacy is based on how a student feels about
how they will perform. Attribution Theory is explained as how students perceive their
skills on the outcome (success) of a task. If students feel they have the skills, then they
will succeed because the outcome was based upon the fact they had the skills to succeed.
Those who feel they do not possess the skill will feel they failed because they do not have
the skills. This leads to a drop in motivation. The Self-Worth Theory is understood as the
ability to complete a task being related to how one views oneself. If a person feels he/she
has worth, motivation will increase and the person will work harder to succeed. If a
person does not feel he/she is worth anything, motivation is low and the person will not
work very hard to succeed. Siefert also suggested that when a student’s learning style is

23
closer to the expectations of the classroom, motivation to succeed will be higher than
when the learning style disagrees with the classroom structure.
Eccles and Midgley (1989) discussed Stage Environment Theory, which
suggested that negative results occur when students’ needs are not met, and positive
results, such as growth and positive motivational changes, occur when the environment
meets the learners’ needs. The Stage Environment Theory might explain why
motivation drops in middle school students as their needs are not met by the school.
The National Association of Secondary School Principals (2006) added, “Well
designed transition programs can restore the strong sense of belonging the entering
student once felt in elementary school -- a key element associated with the positive
motivation to enjoy and succeed in academic tasks” (p. 2). Wentzel (1998) suggested
that, when students lack positive relationships (connections) with peers and adults in the
school, motivation will drop and academic problems will result. The middle school
movement has demonstrated the need for students to feel connected to school. Shulkind
(2007) suggested most dropouts did so because they felt the teachers did not care about
them. Further, Juvonen (2007) found students in American schools do not like to be in
school. Though one cannot assume school connectedness produces increased academics,
Juvonen said there is some information to suggest that motivation is affected by
connectedness.
Achievement
Researchers such as Alspaugh (1998) found that students experience a loss in
achievement or a drop on achievement tests in the transition from elementary to middle
school. Parades (1990) agreed and found that achievement test scores drop regardless of

24
when a student transitions. For example, students who were in a K-6 setting scored
higher than students who were in a 6-8 setting (Parades, 1990). Alspaugh (1998)
reported that the scores tended to rebound to pre-transition levels in the year following
the transitions. A possible explanation for this might be the mismatch between the needs
of the students in middle school and the structure of the middle school. Alspaugh also
found that when students arrive from different elementary schools, achievement drops
more than when students all come from the same elementary school.
Looking at other influences on achievement, Erb (2006) studied the relationship
between grade configuration and student achievement and suggested that configuration is
a weak indicator of student achievement. Erb felt that other factors that need to be
present to increase student achievement are (a) strong building leadership, (b) highly
qualified teachers, (c) “Turning Points” characteristics, and (d) a healthy school culture.
Rockoff and Lockwood (2010) found that as students transition from elementary
school to a new middle school, academic achievement in both math and English drops.
Rockoff and Lockwood found that students making the transition to sixth grade in the
middle school have lower achievement than students who make the transition entering
grade seven. Rockoff and Lockwood suggest these losses continue to impact academic
success in grade eight.
Attendance
Freeman (2002) illustrated that students who attend a K-8 setting school have
higher attendance than students who attend middle schools. Freeman suggested the K-8
structure may help to develop supportive relationships in the elementary school but are
void in the middle school. Parades (1990) discovered students in an elementary school

25
setting have higher attendance when compared to students in the first year of junior high
school. Parades attributed the difference in attendance to rules and procedures of the new
school as opposed to actual student behavior. Lee and Burkam’s (2003) study discovered
that, when students feel cared about at school, they come to school.
The National Forum on Education Statistics (2009, p. 1) states, “A missed school
day is a missed opportunity to learn.” There is a large body of empirical evidence that
suggested a relationship exists between inputs into the education process and student
performance level (Lamdin, 1996). Caldas (1993) and the National Forum on
Educational Statistics (NCES) (2009) found that student attendance was positively and
significantly associated with student performance, but suggested more study is necessary
on this topic. Baker and Jansen (2000) emphasized three points related to excessive
absenteeism, including (a) missing school is against the law, (b) frequent absences lead to
future problems once the student returns to school, and (c) habits that are developed can
lead to larger issues such as truancy. Lamdin (1996) suggested that school attendance
can be over-weighted relative to other factors such as parent pressure, internal
motivation, and teacher quality, so the impact of attendance might be overstated.
Much of the research on attendance has focused on what to do once an attendance
problem is noticed rather than trying to limit absences in the first place (Railsback &
Northwest Regional Educational Laboratory (NREL), 2004). A possible predictor of
excessive absenteeism was a lack of connectedness to the school. Wagstaff, Combs, and
Jarvis (2000) conducted a study that interviewed students which found several risk
factors related to missing excessive amounts of school, including few positive

26
relationships with peers, high levels of suspensions, feeling unsafe at school, and being
bored at school.
Lee and Burkam (2003) stated that absenteeism is related not only to issues with
the student but also with the school culture. Examples of building a healthy school
culture included implementation of an adult mentoring program, development of positive
peer relations at school, and peer mentoring.
A recent study (Balfanz et al, 2007) suggested failing classes and missing school
was predictive of dropping out of school. Balfanz et al (2007) suggested that when a
student drops out, it is because they have disengaged from school a long time before.
The data in Balfanz et al.’s, 2007 study predicted that, when students in grade 6 miss
more than 10% of school, the odds are increased that they will not graduate from high
school. When a sixth-grade student misses 20% or more of school, the odds are
overwhelmingly strong that the student will not graduate from high school.
As cited in Dube and Orpinas (2009), previous research noted that students who
miss school have a greater possibility of acquiring negative health and social problems,
dropping out of school, having lower academic achievement, and having a poor life after
school. Further, students who miss school were usually more behaviorally challenged
and had difficulty making positive relations at school. Finally, Dube and Orpinas (2009)
summarized that students who had high absences may also have had fewer quality peer
relationships as they were disconnected to school but the direction of that finding may be
reversed meaning the lack of relationships caused high absenteeism.
Student Suspensions and Behavior
Hirst (2005) suggested that rates of discipline referrals and suspensions

27
increase in middle school. Although there are many possible explanations why the rates
increase, research on adolescent delinquency illustrates a pattern of negative peer
influence (Jang, 1999). Juvonen presumed that students who do not feel connected are
not motivated to behave the way others want them to behave. Failure to connect with
school can lead to many negative behaviors (2007).
Railsback identified three sources of inappropriate student behavior. Starting
with the school environment, the study explained that student perception of rules, the
staff, and the degree of freedom afforded to the students all impact a student’s decisions
related to behaviors. Second, Railsback concluded that transitions tend to impact
behaviors. Behaviors during the first year of the transition tended to be lower at first,
then spike finally returning to pre-transition levels. Finally, peer relationships can impact
behavior choices. Contacts with peers who are older or choosing more inappropriate
behaviors may lead students to make poor behavior choices (2004).
Theriot and Dupper (2010) conducted a study using data from 2003-2005 about
students moving from grade 5 (elementary school) to grade 6 (middle school). They
found that discipline referrals increased 18% for students in grade 6 relative to students in
grade 5. Another study completed by Malaspina and Rimm-Kauffman (2008) suggested
student discipline issues did increase at the student’s first educational transition point.
It is important to understand that, although the increase in discipline rates as
students transitioned to middle level schools is a concern in the short term, long term
impacts are also evident as suspension rates in grade 6 appear to be a “moderate to strong
predictor of dropping out of school” (Skiba & Peterson, 1999, p. 376).

28
Summary of Research
This chapter reviewed the history and purpose of junior high and middle school
programs. Junior high and middle schools have undergone a transformation over time
and, surely, these changes will continue as more research is completed assesses middle
level schools that best meet the needs of students.
The research on transitions from one organizational structure to another often
impacts educational outcomes such as achievement, attendance, and school suspensions.
There appears to be a link between students transitioning from an elementary school to
junior high and middle schools and a decline in student achievement. A possible
mismatch between the needs of the students and the structure of middle level schools may
be the reason for the decline in achievement. Student attendance may also be affected by
the transition from elementary to middle level schools. It appears that the structure of
middle level schools may impact the attendance of the students themselves while another
possibility is the administrative rules and procedures that students must learn may effect
student attendance. Discipline referrals and suspensions also increase in middle level
schools. A possible cause for increased discipline referrals and suspensions is that
students may not feel a strong connection to their school. Increased discipline problems
and student suspensions may place students at risk and result in additional problems in
the future.

29
CHAPTER THREE
METHODS
The purpose of this study was to compare achievement, attendance, and student
suspensions of seventh grade students who participated in the Where Everybody Belongs
(WEB) program with seventh grade students who did not participate in the program as
they made the transition from an elementary-school setting to a junior high setting.
This chapter contains information on the population and sample of the study,
sampling procedures, instrumentation, measurement, data collection procedures, data
analysis procedures, and limitations of the study. The chapter concludes with a brief
summary of the chapter.
Research Design
This study is a quantitative research study utilizing an experimental group which
was made up of Olathe seventh grade students who were exposed to the WEB program
and a control group which was comprised of Olathe seventh grade students who did not
experience the WEB program.
Population and Sample
The Olathe School District had eight junior high schools spread across the
District. This study used only Olathe seventh-grade students who started the 2008 – 2009
school year and completed the year in their respective buildings. Four of the eight junior
high schools in Olathe implemented the WEB program in the 2008 – 2009 school year.
Table 3 identifies which Olathe junior high schools implemented the WEB transition
program at the beginning of the 2008 – 2009 school year.

30
Table 3
Olathe School District Junior High School WEB Implementation in 2008 - 2009
School Implemented in 2008 - 2009
A X
B
C X
D
E X
F
G X
H
Total
Note: X indicates schools that implemented the WEB program during the 2008 – 2009 school
year. From Olathe School District, 2008 – 2009; KSDE, 2010
Sampling Procedures
Purposeful sampling was used in this study. To eliminate students who might
have experienced only partial exposure to the WEB program, only students who started
the first day of school and ended the school year in the same building used in the study.
The experimental group used in this study consisted of 902 seventh grade students, and
the control group used in the study consisted of 921 seventh grade students. Tables 1 and

31
2 (pages 3-4) show the seventh grade enrollment of each of the junior high schools at the
beginning of the 2008 – 2009 school year.
Instrumentation and data collection
Permission for conducting this study and using data contained in the AS 400
covering students in the Olathe School District was obtained from the following two
sources: First, permission was granted by the Baker University Institutional Review
Board on February 24th
, 2011. A copy of the IRB Form is included in Appendix A.
Second, the Olathe School District designee, Kim Gillespe, gave permission to access the
data from the AS 400 for the study. A copy of the Olathe approval letter is included in
Appendix C. Rita Hoffman assisted with accessing school demographic data including
grade-point average, attendance, and discipline data from the AS400 System.
Quantitative data for this study came from the Olathe School District’s student
database known as the AS 400. The AS 400 is a computer program that tracks each
student and includes demographic information such as entry date into the Olathe Public
Schools, grade point average, attendance data, and suspension data. Student grade-point
averages stored in the AS 400 system were retrieved for each student who qualified for
the study. The Olathe School District uses a 4.0-based grade-point average scale. The
Olathe School District calculates cumulative student grade point averages using the total
number of grade points earned divided by the class credits taken. GPA’s were calculated
at the conclusion of the students’ seventh-grade year in May 2009. Grades earned prior
to the start of the seventh grade year were not included in the calculation of the grade-
point average.

32
Student daily attendance was calculated for each student who qualified for the study.
Daily attendance was calculated using only full days of student attendance. Attendance
was a cumulative number that represented the total number of school days attended
during the seventh grade school year. Suspensions were calculated for each student who
qualified for the study. Suspensions recorded in the AS400 system for all disciplinary
reasons were used in the calculation of the suspensions. Suspensions were reported as a
cumulative number of all in school and out of school suspension days added together for
each category (in-school or out-of-school suspension).
Data Analysis and Hypothesis Testing
Descriptive statistics were calculated through the use of the program, SPSS
Faculty Pack Software V. 18 and were used to describe the student enrollment at WEB
schools and non-WEB schools.
Three research hypotheses were written so the researcher could review each of the
three variables individually. The three research hypotheses used in this study were:
H1: The GPA of students who were exposed to the WEB program will be
higher than students who were not exposed to the WEB program.
A two-tailed independent samples t test at the 0.05 level of significance for the
difference between mean scores of the WEB and non-WEB groups was calculated using
the students’ grade point averages on SPSS Faculty Pack V. 18. Additionally, an effect
size was calculated using the mean and standard deviation of the GPA data.
H2: The attendance of students who were exposed to the WEB program will be
higher than students who were not exposed to the WEB program.

33
A two-tailed independent samples t test at the 0.05 level of significance for the
difference between mean scores of the WEB and non-WEB groups was calculated using
the students’ attendance on SPSS Faculty Pack V. 18. Additionally, an effect size was
calculated using the mean and standard deviation of the attendance data.
H3: The number of suspensions for students who were exposed to the WEB
program will be lower than students who were not exposed to the WEB
program.
A two-tailed independent samples t test at the 0.05 level of significance for the
difference between mean scores of the WEB and non-WEB groups was calculated using
students’ suspensions on SPSS Faculty Pack V. 18. Additionally, using the mean and
standard deviation of the suspension data, effect size was calculated.
Limitations
The study has the following limitations:
1. The information recorded in the AS 400 system may not have been recorded
in an accurate manner. Data collection and input occurs in individual schools
and errors might have been made with data entry.
2. The data used in this study covered students in seventh grade during the 2008
– 2009 school year. Data from different school years may produce different
results.
3. The groups of students used in this study varied in their composition.
Differences in student make up could produce results that artificially influence
the results of the study.

34
Summary
Chapter 3 contained an overview of the techniques used to gather and measure
data collected from students who were exposed to the WEB transition program and those
who were not exposed to the WEB program. The chapter further describes who was
chosen for the study, the method data was analyzed, and hypotheses that guided the
study. Finally, the limitations for the study were listed. Chapter four presents the results
of the study framed around the research questions and hypotheses developed in chapter
one.

35
CHAPTER FOUR
RESULTS
The purpose of this study was to determine whether there were differences in
grade point averages, attendance, and suspensions between Olathe, Kansas seventh grade
students who were exposed to the Where Everybody Belongs (WEB) transition program
during the 2008 – 2009 school year and those Olathe seventh grade students who were
not exposed to the WEB program during the same year. Archived data was collected on
1823 seventh grade students who began and finished their seventh grade year in the same
school to ensure full exposure to the WEB program treatments. The data presented in
chapter four differs slightly from data presented in chapters one and three as chapters one
and three were based on the September 20th
building principal student count. Data used
in this study were based on students who met the conditions of being enrolled on the first
and last day of school in the same Olathe junior high school.
Descriptive Statistics
Table 4 contains gender data for the sample used in the study. Of the total 1823
students in the seventh grade in 2008 – 2009, 902 were females and 921 were males.
Table 4
Gender Data for Sample
Frequency Percent
Female 902 49.5
Male 921 50.5
Total 1823 100.0

36
Table 5 displays data based on student English Language Learner (ELL) status.
1727 students were Non-ELL and 96 students were coded as ELL. Thirteen students
coded as consult, 3 students declined services, 39 were coded as monitor, 13 were
considered proficient, and 28 were active ELL students. A student’s ELL status was
based on scores on the Kansas English Language Proficiency Assessment (KELPA).
Students who made up all of the ELL categories (monitor, proficient, active, etc.) were
combined to produce the ELL portion of the each group.
Table 5
English Language Learner Status
Frequency Percent
NON-ELL 1727 94.7
Consult 13 .7
Denied 3 .2
Monitor 39 2.1
Proficient 13 .7
Active 28 1.5
Total 1823 100.0
Table 6 contains student Socio-Economic Status (SES) data. The sample for this
study contained 1474 students who were not considered low SES and 349 students who
were coded as low SES. Of the 349 low SES students, 248 were coded as free and 101

37
were coded as reduced. Free and reduced students were combined to produce the Low
SES group in the study.
Table 6
Socio-Economic Status
Frequency Percent
Non Free or Reduced 1474 80.9
Free 248 13.6
Reduced 101 5.5
Total 1823 100.0
Table 7 displays data relating to student special education status. In the study,
1572 students were not served in special education, including 100 students who were
coded as gifted for a total of 1672 students who were not considered part of the special
education group. The sample used in the study contained 151 students who were
considered special education students. The students who made up the special education
portion of the sample were coded as Autism Spectrum Disorders, Emotionally Disturbed,
Hearing Impaired, Learning Disabled, Mentally Retarded, Other Health Impaired,
Orthopedically Impaired, Speech Language, Traumatic Brain Injury, and Visually
Impaired.

38
Table 7
Special Education Status
Frequency Percent
Non-SPED 1572 86.2
Autism Spectrum
Disorders 11 .6
Emotionally
Disturbed 8 .4
Gifted (Non-SPED) 100 5.5
Hearing Impaired 1 .1
Learning Disabled 90 4.9
Mentally Retarded 8 .4
Other Health
Impaired 21 1.2
Orthopedically
Impaired 1 .1
Speech and
Language 8 .4
Traumatic Brain
Injury 1 .1
Visually Impaired 2 .1
Total 1823 100.0
Table 8 displays data on ethnicity as reported by each student or family. The
student ethnic population included 1415 white students, three students American Indian /

39
Alaskan students, 84 Asian students, 159 Hispanic students, 105 African American
students, and 57 multi-racial students.
Table 8
Student Ethnicity Status
Frequency Percent
White 1415 77.6
American Indian/Alaskan 3 .2
Asian 84 4.6
Hispanic 159 8.7
African American 105 5.8
Multi-racial 57 3.1
Total 1823 100.0
In order to determine the exact composition of the WEB participants and non-
WEB participants, several cross tabulations were calculated. Table 9 displays cross
tabulation data covering group and ethnicity.
Table 9
WEB Participation - Gender Cross Tabulation
Gender
Female Male Total
Group
WEB 429 473 902
Non-
WEB 473 448 921
Total 902 921 1823
40
First, when gender was crossed with group, the break down was 429 females and
473males who participated in the WEB program and 473 females and 448 males who did
not participate in the WEB program.
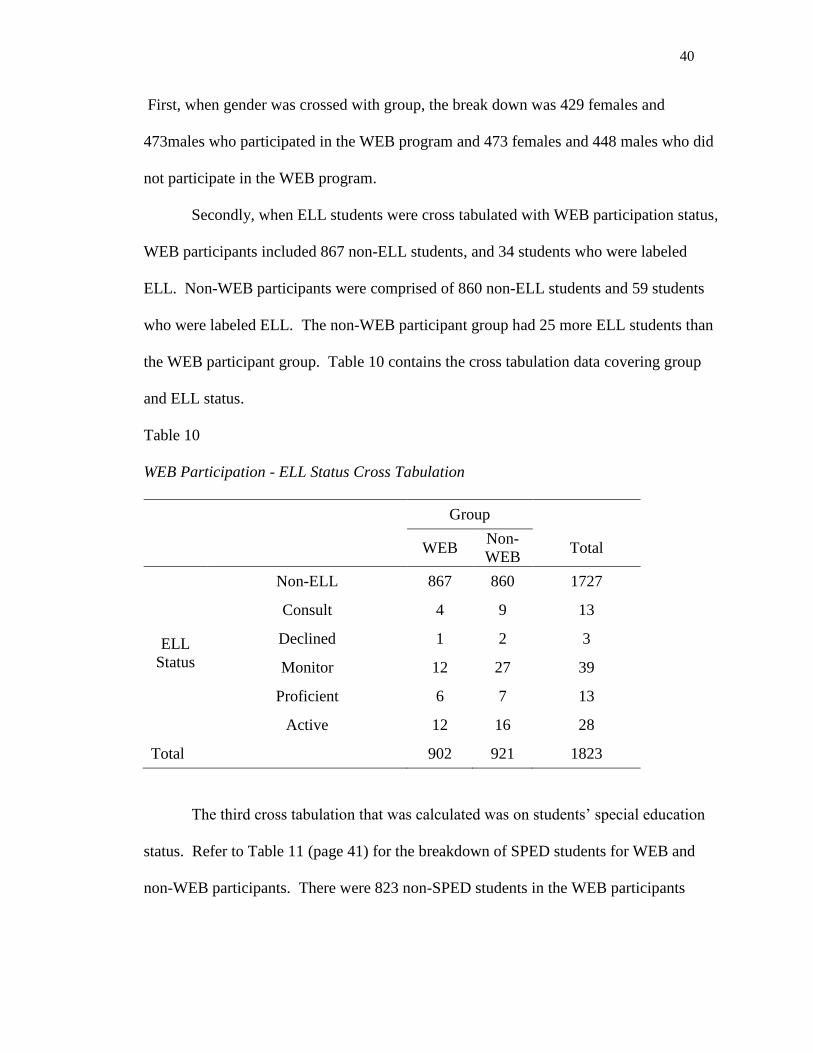
Secondly, when ELL students were cross tabulated with WEB participation status,
WEB participants included 867 non-ELL students, and 34 students who were labeled
ELL. Non-WEB participants were comprised of 860 non-ELL students and 59 students
who were labeled ELL. The non-WEB participant group had 25 more ELL students than
the WEB participant group. Table 10 contains the cross tabulation data covering group
and ELL status.
Table 10
WEB Participation - ELL Status Cross Tabulation
Group
WEB Non-
WEB Total
ELL
Status
Non-ELL 867 860 1727
Consult 4 9 13
Declined 1 2 3
Monitor 12 27 39
Proficient 6 7 13
Active 12 16 28
Total 902 921 1823
The third cross tabulation that was calculated was on students’ special education
status. Refer to Table 11 (page 41) for the breakdown of SPED students for WEB and
non-WEB participants. There were 823 non-SPED students in the WEB participants

41
Table 11
WEB Participation – Special Education Status Cross Tabulation
Group
WEB Non-
WEB Total
SPED
Status
Non-SPED 781 791 1572
Autism 7 4 11
Emotionally Disturbed 3 5 8
Gifted (non-sped) 42 58 100
Hearing Impaired 1 0 1
Learning Disabled 44 46 90
Mentally Retarded 5 3 8
Other Health Impaired 12 9 21
Orthopedically Impaired 0 1 1
Speech and Learning 6 2 8
Traumatic Brain Injury 0 1 1
Vision Impaired 1 1 2
Total 902 921 1823
group and there were 849 non-sped students in the non-WEB group. There were 72
special education students in the WEB participant group and 68 special education
students in the non-WEB group.
The fourth cross tabulation calculated crossed group and student socio-economic
status. The group of WEB participants had 97 free students and 34 reduced students for a

42
total of 131 low SES students and 771 students who were not considered low SES. Non-
WEB participants was comprised of 151 free students and 67 reduced students for a total
of 218 low SES students and 703 students who were not considered low SES. Table 12
displays the SES cross tabulation results.
Table 12
WEB Participation - SES Status Cross Tabulation
SES Status Total
Non Low-
SES Free Reduced
Group
WEB 771 97 34 902
Non-
WEB 703 151 67 921
Total 1474 248 101 1823
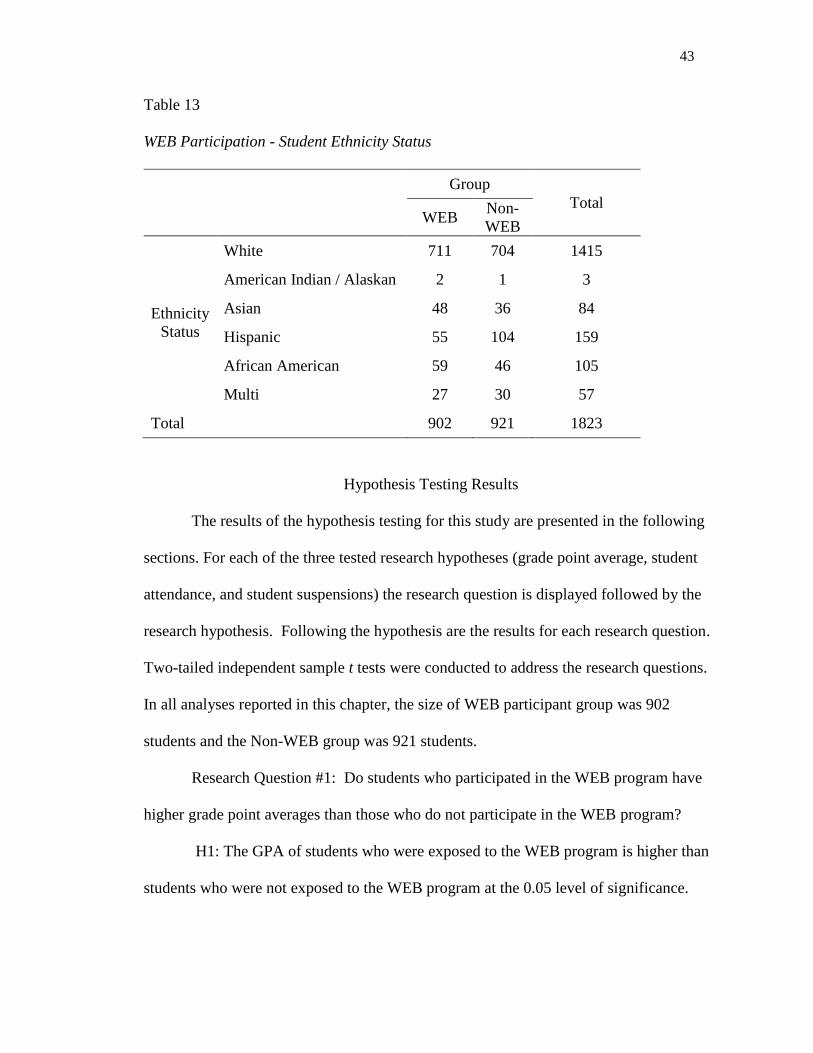
The final cross tabulation was calculated using student ethnicity as shown in
Table 13 (page 43). The group of WEB participants had 711 white students, 2 American
Indian/Alaskan, 48 Asian, 55 Hispanic, 59 African American, and 27 multi-racial
students. The group of non-WEB participants had 704 white students, 1 American
Indian/Alaskan, 36 Asian, 104 Hispanic, 46 African American, and 30 multi-racial
students.
43
Table 13
WEB Participation - Student Ethnicity Status
Group
Total WEB
Non-
WEB
Ethnicity
Status
White 711 704 1415
American Indian / Alaskan 2 1 3
Asian 48 36 84
Hispanic 55 104 159
African American 59 46 105
Multi 27 30 57
Total 902 921 1823
Hypothesis Testing Results
The results of the hypothesis testing for this study are presented in the following
sections. For each of the three tested research hypotheses (grade point average, student
attendance, and student suspensions) the research question is displayed followed by the
research hypothesis. Following the hypothesis are the results for each research question.
Two-tailed independent sample t tests were conducted to address the research questions.
In all analyses reported in this chapter, the size of WEB participant group was 902
students and the Non-WEB group was 921 students.
Research Question #1: Do students who participated in the WEB program have
higher grade point averages than those who do not participate in the WEB program?
H1: The GPA of students who were exposed to the WEB program is higher than
students who were not exposed to the WEB program at the 0.05 level of significance.

44
The results of the independent samples t test (t = 4.53, df = 1821, p = .000)
indicated a statistically significant difference between the average GPA of participants
and non-participants. Since the p-value was less than 0.05, there was enough evidence to
conclude the research hypothesis is true. Participants (3.49) have a higher GPA than non-
participants (3.35).
Research Question #2: Do students who participated in the WEB program have
better attendance than those who do not participate in the WEB program?
H2: The attendance of students who were exposed to the WEB program is higher
than students who were not exposed to the WEB program at the 0.05 level of
significance.
The results of the independent samples t test (t = -1.44, df = 1821, p = .151)
indicated there was not a statistically significant difference between the average
attendance of participants and non-participants. Since the p-value was greater than 0.05,
there was not enough evidence to conclude research hypothesis is true. WEB participant
attendance (163.68 days) and non-WEB participants (164.11 days) were not statistically
different.
Research Question #3: Do students who participated in the WEB program have
lower occurrences of in-school and / or out-of-school suspensions than those who do not
participate in the WEB program?
H3: The number of suspensions for students who were exposed to the WEB
program is lower than students who were not exposed to the WEB program at the 0.05
level of significance.

45
The results of the independent samples t test (t = -.66, df = 1821, p = .509)
indicated there was not a statistically significant difference between the average
suspensions of WEB participants and non-WEB participants. Since the p-value was
greater than 0.05, the research hypothesis was not accepted. Suspensions for WEB
participants (.66) and non-WEB participants (.66) were not statistically different.
Additional Analyses
Hypothesis testing yielded no differences in attendance and suspensions so
further analysis was completed. In order to determine whether gender status, minority,
SPED, SES, or ELL, affected the difference in GPA, attendance, or suspensions between
WEB participants and non-WEB participants, fifteen two-factor univariate analyses of
variance (ANOVAs) were conducted.
Table 14
ANOVA Results for Grade Point Average
Interaction Effect df F statistic p
Gender by Group (WEB /
non-WEB) 1,1819 1.780 .182
Minority by Group (WEB /
non-WEB) 1,1819 .041 .839
SPED by Group (WEB / non-
WEB) 1,1819 .623 .430
SES by Group (WEB / non-
WEB) 1,1819 2.056 .152
ELL by Group (WEB / non-
WEB) 1,1819 .011 .917
Table 14 (above) presents ANOVA results for GPA. The results of the analyses
indicated no effect on the differences between WEB participants and non-participants
based on gender, minority, SPED, SES, or ELL.

46
Table 15 displays ANOVA results for attendance. The results of the analyses
indicated no effect on the differences between WEB participants and non-participants
based on gender, minority, SPED, SES, or ELL.
Table 15
ANOVA Results for Attendance
Interaction Effect df F statistic p
Gender by Group (WEB /
non-WEB) 1,1819 .252 .616
Minority by Group (WEB /
non-WEB) 1,1819 1.722 .190
SPED by Group (WEB / non-
WEB) 1,1819 .671 .413
SES by Group (WEB / non-
WEB) 1,1819 .167 .683
ELL by Group (WEB / non-
WEB) 1,1819 2.007 .157
Table 16 shows ANOVA results for suspensions. The results of the analyses
indicated no effect on the differences between WEB participants and non-participants
based on gender, minority, SPED, SES, or ELL.
Table 16
ANOVA Results for Suspensions
Interaction Effect df F statistic p
Gender by Group (WEB /
non-WEB) 1,1819 .016 .899
Minority by Group (WEB /
non-WEB) 1,1819 .055 .815
SPED by Group (WEB / non-
WEB) 1,1819 .120 .729
SES by Group (WEB / non-
WEB) 1,1819 .257 .612
ELL by Group (WEB / non-
WEB) 1,1819 .896 .344

47
Summary
Chapter four presented the descriptive statistics and hypotheses testing used in
this study. All calculations were obtained using SPSS Faculty Pack V. 18.0. Mean,
median, mode, standard deviation, were calculated and a t-test score was used to
determine the outcome of testing each of the three hypotheses. There was a statistically
significant difference for students who participated in the WEB program in GPA’s.
There were no statistically significant differences between suspensions or the attendance
of WEB students and non-WEB students. Further, two-factor ANOVAs were conducted
to look more closely at the effect of gender, minority status, SES, SPED, and ELL
classification on the differences between participants and non-participants in GPA,
attendance, and suspensions. No significant statistical difference in GPA, attendance,
and suspensions was observed based on gender, minority, SES, SPED, or ELL status for
WEB and non-WEB participants. The final chapter of this study provides a summary of
findings, offers recommendations for further study, compares study findings to literature
review, and provides information for the Olathe School District and Hill et al, the
designers of the WEB program.

48
CHAPTER FIVE
INTREPREATION AND RECOMMENDATIONS
This chapter presents an overview of the problem, the purpose statement used to
drive the study, a review of the methodology, major study results, findings related to the
literature, and recommendations for future studies. Chapter five ends with implications
for action and concluding remarks.
Study Summary
Overview of the Problem
Studies have illustrated drops in GPA and attendance as students move from
elementary school settings to junior high or middle schools (Blyth, Simmons, and
Carlton-Ford, 1983; Rockoff & Lockwood, 2010; Freeman, 2005). Every year students
undergo educational transitions where students move from self-contained elementary
schools to junior high or middle school settings. It is critical for educators to fully
understand the difficulties associated with educational transitions so programs can be
implemented to limit losses associated with transitions.
Purpose Statement
The purpose of this study was to determine if there were differences in
achievement, attendance, and suspensions of Olathe, Kansas seventh grade students who
participated in the WEB program and students who did not experience the WEB program
as they made the transition from an elementary-school setting to a junior-high setting.
Review of the Methodology
All students who entered seventh grade in one of the eight Olathe, Kansas junior
high schools in August 2008 and completed the 2008 – 2009 school year in the same

49
junior high school were eligible participants for this study. Using the Olathe School
District AS400 system, archived student grade point average, attendance, and suspension
data were collected and analyzed for this study. All study related data calculations were
performed using SPSS Faculty Pack Software V. 18.
Major Findings
Results from testing the first variable, GPA, revealed there was a statistically
significant difference in GPA between the students exposed to the WEB program and
students who were not exposed to the WEB program. The hypothesis covering GPA
predicted students who were exposed to the WEB program would have higher GPA’s
than students who were not exposed to the WEB program at the 0.05 level of
significance. Since WEB students had a higher GPA than non-WEB students, with a p
value less than 0.05, the research hypothesis may be accepted as true. The hypothesis
covering attendance predicted students who were exposed to the WEB program would
have higher attendance than students who were not exposed to the WEB program at the
0.05 level of significance. WEB student attendance and non-WEB student attendance
were not statistically different; therefore the research hypothesis must be rejected.
Testing the final variable, suspensions, did not yield any significant differences in
suspensions between WEB students and non-WEB students. The hypothesis covering
suspensions predicted students who were exposed to the WEB program would have had
lower suspensions than students who were not exposed to the WEB program at the 0.05
level of significance. WEB student suspensions and non-WEB student suspensions were
not statistically different; therefore the research hypothesis must be rejected.

50
ANOVA results between each variable (GPA, attendance, and suspensions) and
student SES, SPED, ELL, ethnicity, and gender did not affect the differences between
seventh grade students exposed to WEB and non-WEB participants.
Findings Related to the Literature
Some research evaluates the impact of transition programs on GPA, attendance,
and suspensions as students move from an elementary school delivery model to a junior
high or middle school delivery model. A few research studies suggested that transition
programs, if implemented correctly, can aid in social adjustments during the transition to
middle schools for the new students (Ferguson & Bulach, 1994; Lonzo, 2001). The
results from this study suggest students who experienced the WEB program have higher
seventh grade GPA’s than students who were not exposed to the WEB program. A
possible explanation to why this significant difference exists for WEB participants may
be the result of students who experienced the WEB program participated in academic
follow up sessions on a weekly basis. These academic follow up sessions were taught by
peer mentors who covered such topics as successful study habits, organization, and time
management. All students who experienced the WEB program in their school
participated in the academic follow up sessions. Students in non-WEB schools may or
may not have participated in formal programs meant to address the skills academic
follow up sessions teach.
Research covering student attendance as students move from an elementary-
school delivery model to a middle school (or junior high) model is limited as much of the
research covers what to do once an attendance problem is realized rather than attempting

51
to prevent absences from occurring in the first place (Railsback, 2004). A common
finding in the research is the idea that students attended elementary school at higher rates
compared to middle school because in the elementary school they are better “connected”
or have better peer relationships (Freeman, 2002; Lee & Burkham, 2003). This study did
not compare attendance between elementary and middle school, rather, it looked at
attendance between WEB participants and non-WEB participants. The results of this
study did not illustrate any statistically significant differences in attendance between
WEB participants and non-WEB participants. A possible explanation for why there was
not a statistically significant difference between WEB participants and non-WEB
participants is that many students in Olathe junior high schools feel connected to school
and may have higher quality peer relationships or the difference could not be detected
because student attendance is so high.
Research related to student suspensions as students move from an elementary-
school delivery model to a middle school model illustrated that suspensions increase in
middle school (Hirst, 2005). Three possible explanations of this increase are peer
influences, student connectedness to school, and the school environment (Jang 1999;
Juvonen, 2007; Railsback, 2004). This study compared suspensions of WEB participants
to non-WEB participants. The results of this study did not demonstrate any statistically
significant difference in suspensions for WEB participants and non-WEB participants. A
possible explanation for the lack of statistical difference is that many students in Olathe
junior high schools may not feel negative peer pressure and maybe more connected to
their school or the difference could not be detected because suspensions are so low.

52
Conclusions
Implications for Action
The findings of this study may be useful to several groups of people. First, the
Administration and School Board of Education of the Olathe School District can use the
results of this study to assist in making decisions relating to the continued use of the
WEB program. The Olathe school district incurs WEB costs for training, materials, and
supplies for implementation which may be difficult during times when monetary
resources are limited. Second, the operators of the WEB program, Hill et al, may want to
review the WEB program to determine if changes are needed to better address attendance
or suspension problems. In this study both variables (attendance and suspensions)
showed no significant differences between WEB participants and non-WEB participants.
Hill et al could place more emphasis on attendance or suspensions as part of the activities
implemented through the WEB program. In light of the pressures brought about by the
No Child Left Behind legislation, it is critically important to make sure school district
decision makers reduce the negative impacts of transitions as much as possible for all
students.
Recommendations for Future Research
As the results of this study have been presented and explained, consideration for
future research needs to be considered. This researcher suggests that a similar study be
conducted with a more diverse student population. The relative Olathe, Kansas junior
high school percentages for ethnic minority students (23%), low SES students (19%),
SPED students (15.8%), and ELL students (5.3%) were low when compared to the
population of many junior-high aged students across the nation. Follow-up studies with a

53
more ethnically-diverse student population sample or studies completed in more rural or
urban settings than exists in the Olathe School District would allow for comparison to
determine whether this study’s results could result in different outcomes.
A second recommendation for a future study would be to conduct a student
survey to evaluate student connectedness to school and the quality of peer relationships.
The review of the literature focused on each of those two areas as possible causes for
changes in school outcome measures (GPA, attendance, and suspensions) in the middle
schools. The results of the recommended study could provide administrators information
relating to the importance of student connectedness when students make transitions from
one organizational structure to another.
A third recommendation for a future study would be to add the Kansas Reading or
Math Assessment results as a variable for study. In general, GPA’s can be subjective as
each teacher assigns grades based upon individual criteria using the district approved
curriculum as a basis. The addition of the state assessment data might be viewed more
objectively as all students take the same assessment under similar conditions.
Comparisons could be made with all Kansas school districts since all schools take the
same math and reading assessments.
A fourth recommendation for further study would be to perform a longitudinal
study of a three year implementation of a transition program like the WEB program. A
longitudinal study of three years or more might produce different results than obtained in
a one year snap-shot of a transition program.
A fifth recommendation for a future study would be to conduct the same study but
use students in sixth grade instead of using seventh grade students. Sixth grade students
54
are younger and may be less mature than older students which might produce different
results than the current study.
A final recommendation for a future study would be to survey individual building
WEB coordinators to determine if they have implemented the WEB program according to
the WEB guidelines. While at the WEB training, the trainers often said there are times it
is OK for each school to make individual changes to the WEB program but for the most
part, the WEB program needs to be implemented according to the WEB guidelines. The
implementation of the WEB program appears to be critical in determining the perceived
impact of the WEB program. If schools say they are implementing WEB but not
following the prescribed methods as designed, the results of the WEB program may be
altered.
Concluding Remarks
The purpose of this study was to compare achievement, attendance, and
suspensions of seventh grade students who participated in the WEB program with
seventh grade students who did not participate in the program as they made the transition
from an elementary school setting to junior high setting. This study has demonstrated
there was a statistically significant difference in GPA for seventh grade students who
experienced the WEB program compared to seventh grade students who did not
experience the WEB program. This study also showed there was not a statistically
significant difference for WEB participants and non-participants in attendance and
suspensions. The results of this study align with the findings of the research conducted
on GPA but the results of the study do not align with research findings for attendance and
suspensions. The findings of the study suggest that the WEB program may have value in

55
transitioning students from elementary to middle school settings; however, more research
is necessary to confirm the value of the WEB transition program.

56
REFERENCES
Akos, P. (2002). Student perceptions of the transition from elementary to middle school.
Professional School Counseling, 5(5), 339-345.
Alexander, M. W. & McEwin, C. K. (1989). Schools in the middle: Progress 1968-1988.
A report on trends and practices. National Association of Secondary School
Principals (ED327000).
Alspaugh, J. (1998). Achievement loss associated with the transition to middle and high
school. The Journal of Educational Research, 92(1), 20-25.
Anderman E. & Midgley, C. (1996, March). Changes in achievement goal orientation
after the transition to middle school. Paper presented at the biennial meeting of
the Society for Research on Adolescence. Boston, MA.
Anderman, L., Midgley, C. (1998). Motivation and Middle School Students. Retrieved
from ERIC digest: http://www.ericdigest.org/1999-1/motivation.html
Arowsafe, D. S. & Irvin, J. E. (1992). Transition to middle school: What kids say.
Middle School Journal, 24(2), 15-19.
Baker, D. & Jansen, J. (2000). Using Groups to Reduce Elementary School
Absenteeism. Social Work in Education, 22(1), 46-53.
Balfanz, R. (2009). Putting middle grades students on the graduation path. A policy and
practice brief. Retrieved from National Middle School Association website:
http://www.nmsa.org/portals/0/pdf/Research_from_the_Field/Policy_Brief_Balfa
nz.pdf
Balfanz, R., Herzog, L., & Mac Iver, D. J. (2007). Preventing student disengagement and
keeping students on the graduation path in urban middle schools: Early

57
identification and effective interventions. Educational Psychologist, 42(2), 223-
235.
Bedard K. & Do, C. (2005). Are middle schools more effective? The impact of school
structure on student outcomes. The Journal of Human Resources, 40(3), 660-682.
Blyth, D. A., Simmons, R. G., & Carlton-Ford, S. (1983). The adjustment of early
adolescents to school transition. Journal of Early Adolescence, 9, 181-210.
Boomerang Project-WEB Leader Basic Training Materials. March 9-11, 2009. Chicago,
Illinois.
Caldas, S. (1993). Reexamination of input and process factor effects on public school
achievement. Journal of Educational Research, 86, 206-214.
Chung, H., Elias, M., & Schneider, K. (1998). Patterns of individual adjustment changes
during the middle school transition. Journal of School Psychology, 36, 83-101.
Coleman, M. R. (2001). Middle Schools: New trends and issues. Gifted Child Today,
24(4), 20-22.
Crockett, L., Peterson, A., Graber, J., Schulenberg, J., & Ebata, A. (1989). School
transitions and adjustment during early adolescence. Journal of Early
Adolescence, 9, 181-210.
Dickinson, T. S. & Butler, D. A. (2001). Reinventing the Middle School. Middle School
Journal, 33(1), 7-13.
Dube, S. R. & Orpinas, P. (2009). Understanding excessive school absenteeism as school
refusal behavior. Children and Schools, 31(2), 87-94.

58
Eccles, J. S. & Midgley, C. (1989). Stage-environment fit: Developmentally appropriate
classrooms for young adolescents. In C. Ames & R. Ames (Eds.), Research on
motivation in education: Goals and cognitions, (Vol. 3, pp. 139-186). New York:
Academic Press.
Eccles, J. S., Midgley, C., & Lord, S. (1991). What are we doing to early adolescents?
The impact of educational contexts on early adolescents. American Journal of
Education, 99, 521-542.
Eccles, J. S., Wigfield, A., Midgley, C., Reuman, D., Mac Iver, D., & Feldaufer, H.
(1993). Negative effects of traditional middle schools on students’ motivation.
The Elementary School Journal, 93(5), 553-574.
Education Alliance of Brown University. (2006). Breaking ranks in the middle:
Strategies for middle level reform. Reston, VA: National Association of
Secondary School Principals.
Elias, M. J. (2002, April). Transitioning to middle school. The education digest, 41-43.
Erb, T. O. (2006). Middle school models are working in many grade configurations to
boost student performance. American Secondary Education, 34(3), 4-13.
Felner, R. D. & Jackson, A.W. (1997). The impact of school reform for the middle years:
Longitudinal study of a network engaged in Turning Points-based comprehensive
school transformation. Phi Delta Kappan, 78(7), 528-533.
Ferguson, J. & Bulach, C. (1994).The effects of the Shadow Transition Program on the
social adjustment of Whitewater Middle School students. Retrieved from
www.eric.gov/ERICWebPortal/recordDetail?accno=ED380878
Freeman, C. T. (2005). A comparison of K--8 schools, junior high schools,
59
and middle schools with respect to student academic achievement and attendance
in North Carolina. (Doctoral Dissertation). Retrieved from Dissertations &
Theses: Full Text.(Publication No. AAT 3194231).
George, P. S. & Alexander, W.M. (2002). The exemplary middle school (2nd ed.).
New York: Holt, Rinehart, and Winston.
Hill, C., Campbell, M. B., & Jacobson, M. (2007). What is WEB? Retrieved from
http://www.boomerangproject.com/web
Hirst, R. K. (2005). Reducing discipline referrals in middle schools. Principal, 84, 51
Hudley, C, Daoud, A., Hershberg, R., Wright-Castro, R., & Polanco, T. (2002). Factors
supporting school engagement and achievement among adolescents. Paper
presented at the Annual Meeting of the American Educational Research
Association, New Orleans, LA.
Jang, S. J. (1999). Age-varying effects of family, school, and peers on delinquency: A
multilevel modeling test of interactional theory. Criminology, 37, 643-685.
Juvonen, J. (2007). Reforming middle schools: Focus on continuity, social
connectedness, and engagement. Educational Psychologist, 42(4), 197-208.
Kansas Department of Education. (2010). Kansas K-12 Reports. Retrieved from
http://svapp15586.ksde.org/k12/organization.aspx?org_no=DO233
Lamdin, D. J. (1996). Evidence of student attendance as an independent variable in
education production functions. Journal of Educational Research. 89(3), 155-
162.
60
Lee V. E. & Burkam D. T. (2003). Dropping out of high school: The role of school
organization and structure. American Education Research Journal, 40(2), 309-
332.
Lonzo, Lee. (2001). Kickoff Transition Program website, About Us button. Retrieved
from http://www.koprogram.com
Lunnenberg, F. C. & Irby, B. J. (2008). Writing a successful thesis or dissertation.
Thousand Oaks, CA: Corwin Press.
Malaspina D. & Rimm-Kaufman, S. E. (2008). Early predictors of school performance
declines at school transition points. Research on Middle Level Education, 31(9),
1-16.
Manning, M. L. (2000). A brief history of middle school. The Clearing House: A
Journal of Educational Strategies, Issues and Ideas, 73(4),192
National Forum on Education Statistics. (2009). Every School Day Counts. The Forum
Guide to Collecting and Using Attendance Data. NFES Publication Number
2009804
National Middle School Association. (2002). Supporting students in their transition to
middle school. Retrieved from
http://www.nmsa.org/AboutNMSA/PositionStatements/TransitioningStudents/tabi
d/283/Default.aspx
Olathe School District. (2007). 6-9 Design begins to unfold. Retrieved from
http://www.olatheschools.com/index.php?option=com_docman&task=cat_view&
gid=186

61
Paredes, V. (1990). Sixth graders in elementary and middle schools: A longitudinal
study. Austin, Texas: Austin Independent School District, Texas Office of
Research and Evaluation.
Perkins, P. G. & Gelfer, J. I. (1995). Elementary to Middle School: Planning for
Transition. Clearing House, 68(3), 171-173.
Railsback, J., (2004). Increasing student attendance: Strategies from research and
practice. Portland, OR: Northwest Regional Educational Laboratory (now
Education Northwest). Retrieved from
http://educationnorthwest.org/resource/692
Rockoff, J. E. & Lockwood, B. B. (2010). Stuck in the middle: Impacts of grade
configuration in public schools. Retrieved from
http://www0.gsb.columbia.edu/faculty/jrockoff/rockoff_lockwood_middle_school
_8_30_09.pdf
Shoffner, M. F. & Williamson, R. D. (2000). Facilitating student transitions into middle
school. Middle School Journal, 31(4), 108.
Shulkind, S. B. (2007). Fostering connectedness through middle school advisory
programs. Los Angles: University of California Press.
Siefert, T. L. (2004). Understanding student motivation. Educational Research, 46(2),
137-148.
Skiba, R. & Peterson, R. (1999). The dark side of zero tolerance: Can punishment lead to
safe schools? Phi Delta Kappan, 80(5), 372-382
Theriot, M. T. & Dupper, D. R. (2010). Student discipline problems and the transition
from elementary to middle school. Education and Urban Society, 42(2), 206-222.

62
Wagstaff, M, Combs, L., & Jarvis, B. (2000). Solving high school attendance problems:
A case study. Journal of At-Risk Issues, 7, 21-30.
Wentzel, K. R. (1998) Social relationships and motivation in middle school: The role of
parents, teachers, and peers. Journal of Educational Psychology, 90(2) 202-209.
Yecke, C. P. (2005, September). Mayhem in the middle: How middle schools have failed
America and how to make them work. Washington, DC: Thomas D. Fordham
Institute.

63
APPENDIX

64
Appendix A – IRB Form
Date: January 1, 2011 School of education IRB PROTOCOL NUMBER _________________
Graduate department (irb USE ONLY)
IRB Request
Proposal for Research Submitted to the Baker University Institutional Review Board
I. Research Investigator(s) (Students must list faculty sponsor first) Department(s) School of Education Graduate Department Name Signature 1. Dr. Bill Neuenswander ____________________, Major Advisor 2. Margaret Waterman ____________________, Research Analyst 3. , University Committee Member 4. , External Committee Member Principal Investigator: ___Steven J. Skoczek_______________ Phone: 913-768-8370 Email: [email protected] Mailing address: 16695 W 155th Terr Olathe, Kansas 66062 Faculty sponsor: Dr. Bill Neuenswander
Phone: 785-594-4518
Email: [email protected]
Expected Category of Review: ___Exempt __ Expedited _ X__Full
II: Protocol: PERCEPTIONS OF ALLIED HEALTH EMPLOYERS AND CAREER COLLEGE ALLIED HEALTH INSTRUCTORS ON NEEDED KNOWLEDGE AND SKILLS FOR THE WORKPLACE. _______________________________________________________________________

65
Summary In a sentence or two, please describe the background and purpose of the research.
The purpose of this study was to compare student achievement (GPA), attendance, and behaviors of seventh grade students who have participated in the Where Everybody Belongs (WEB) transition program with seventh grade students who did not participate in the WEB program as they made the transition from elementary to junior high school. The study was conducted using data from the 2008 – 2009 school year in the Olathe, Kansas School District.
The results of the study will be used to determine the impact of the WEB program on students transitioning from the elementary school setting to the middle school setting. Briefly describe each condition or manipulation to be included within the study.
Student GPA was the 2008 – 2009 grade seven cumulative grade point averages for each 7th grade student in the study.
Student attendance was the cumulative number of days each 7th grade student in the study attended school in the 2008 – 2009 school year.
Student suspension was the total number of suspension days (in school and out of school) each 7th grade student in the study accumulated during the 2008 – 2009 school year.
What measures or observations will be taken in the study? If any questionnaire or other instruments are used, provide a brief description and attach a copy. Will the subjects encounter the risk of psychological, social, physical or legal risk? If so, please describe the nature of the risk and any measures designed to mitigate that risk. On each of the three variables described above, descriptive statistics and two-tailed independent t-tests will be calculated for both 7th grade populations (WEB and non-WEB participants) using SPSS faculty pack v. 18. No questionnaires were used in this study. There were no risks on students associated with this study. Will any stress to subjects be involved? If so, please describe. No Will the subjects be deceived or misled in any way? If so, include an outline or script of the debriefing. No Will there be a request for information which subjects might consider to be personal or sensitive? If so, please include a description. No

66
Will the subjects be presented with materials which might be considered to be offensive, threatening, or degrading? If so, please describe. No Approximately how much time will be demanded of each subject? None Who will be the subjects in this study? How will they be solicited or contacted? Provide an outline or script of the information which will be provided to subjects prior to their volunteering to participate. Include a copy of any written solicitation as well as an outline of any oral solicitation.
Data for all 2008 – 2009 Olathe School District 7th grade students (both WEB and non-WEB participants) will be used in this study. Data will be provided for all 2008 – 2009 Olathe School District 7th grade students; however, there will be no identification of individual student information.
The study will solicit no information from students.
What steps will be taken to insure that each subject’s participation is voluntary? What if any inducements will be offered to the subjects for their participation? Permission to use data from the Olathe School District AS400 records system was provided by the Olathe superintendent of schools. This study did not involve voluntary student participation.) How will you insure that the subjects give their consent prior to participating? Will a written consent form be used? If so, include the form. If not, explain why not. A student consent form was not used. Permission to use the data was provided by the Olathe superintendent of schools. Will any aspect of the data be made a part of any permanent record that can be identified with the subject? If so, please explain the necessity. No
Will the fact that a subject did or did not participate in a specific experiment or study be made part of any permanent record available to a supervisor, teacher or employer? If so, explain. No What steps will be taken to insure the confidentiality of the data?

67
Data will be provided by the Olathe School District in a manner that is free
of any individual identifier that could be used to identify any specific student. If there are any risks involved in the study, are there any offsetting benefits that might accrue to either the subjects or society?
No
Will any data from files or archival data be used? If so, please describe.
Data from the Olathe School District AS400 records system covering students in 7th grade during the 2008 – 2009 school year will be used. The 7th grade data used will include student achievement (GPA), attendance, and suspension information.

68
Appendix B – Institutional Review Board Consent Letter 2-24-2011 Mr. Steve Skoczek School of Education Graduate Department Baker University RE: IRB: BU-2011-01: Untitled Dear Mr. Skoczek:
The Baker University Intuitional Review Board (IRB) has reviewed your research project application (BU-2011-01) and approved this project under the Expedited category. As described, the project complies with all the requirements and policies established by Baker University for protection of human subjects in research. Unless renewed, approval lapses one year after approval date.
1. A Project Status Report must be filed with the IRB annually for continuation. 2. Any significant change in the research protocol must be reviewed and approved
by the IRB prior to altering the project. 3. Any change in the investigator(s) named in the original application must be
reviewed and approved by the IRB prior to altering the project. 4. Any injury to a subject because of the research procedure must be reported to the
IRB immediately. 5. When signed consent forms are required:
a. the primary investigator must retain the forms until filed, b. consent forms must be filed with the OIR with the annual report, c. the subject must be given a copy of the form at the time of consent.
6. If this is a funded project, a copy of this letter must be with the grant file.
The Office of Institutional Research (OIR) must be notified when this project is completed or terminated. As noted above, you must provide an annual status report to receive approval for maintaining your project. If your project receives funding which requests an annual update, you must file your annual report at least one month prior to the annual update.
Thanks for your cooperation. If you have questions, please contact me.

69
Sincerely, William R. Miller, Ph.D. Chair, Baker University Institutional Review Board CC: Bill Neuenswander, Ph.D., Faculty Supervisor.

70
Appendix C: Olathe Unified School District #233 Approval
Top Related