


Languages
Pages
Legal


The Crisis of 2002-2003:Causes and Solutions
Richard E. Anderson, M.D.ChairmanThe Doctors Company
PLUS Medical Professional Liability SymposiumChicago, March 12, 2003

• ProblemsFrequencySeverity Randomness Fallacy of the bad doctor
Harvard, IOM, and patient safety
• SolutionsTort reform: theory and practice

Frequency by Specialty1995-2001
0%
10%
20%
30%
40%
50%
60%
NSU01 PLA01 ORT01 GES01 OBG01 FGP02 INT01 ANE01 PAT01
Specialty
Frequency

Frequency
Meaning• On any given day there are more than
125,000 malpractice suits in progress against America’s doctors.

Specialty Relativity Nationwide
1.00
1.07
1.00
1.08
2.97
3.90
2.32
4.37
6.51
0.00 2.00 4.00 6.00 8.00
Neurosurgery
Obstetrics & Gynecology
Plastic Surgery(With Breast Implants)
General Surgery
Orthopedic Surgery
Family/General Practice(Minor Surgery/No Obstetrics)
Internal Medicine
Anesthesiology
Pathology
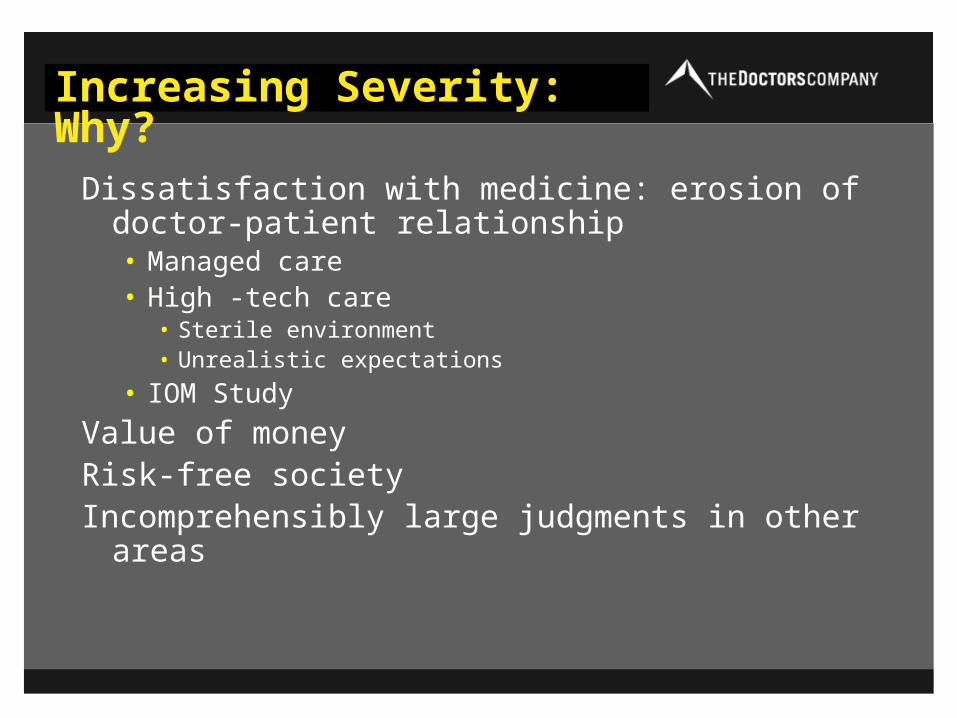
Increasing Severity: Why?
Dissatisfaction with medicine: erosion of doctor-patient relationship • Managed care• High -tech care
• Sterile environment• Unrealistic expectations
• IOM Study
Value of moneyRisk-free societyIncomprehensibly large judgments in other areas

Severity – Distribution of Claimsby Size of Indemnity
0%
2%
4%
6%
8%
10%
12%
>=500k, <1mill >=1mill
1996
1999
2002
Size of Indemnity
Per
cen
tag
e o
f C
lose
d C
laim
s
Distribution of Claims by Size of Indemnity by Closing Year

Large Claims Analysis
Total number of claims 1998-2002: 16,398• 0.8% (140) paid $1 million or more, 28.5% of paid
indemnity
• 2.3% (378) paid $500,000 or more, 55.4% of paid indemnity
Total paid claims 1998-2002: 3,307• 4.2% (140) paid $1 million or more, 28.5% of paid
indemnity
• 11.4% (378) paid $500,000 or more, 55.4% of paid indemnity
0.00
2.00
4.00
6.00
8.00
85 87 89 91 93 95 97 99 2001
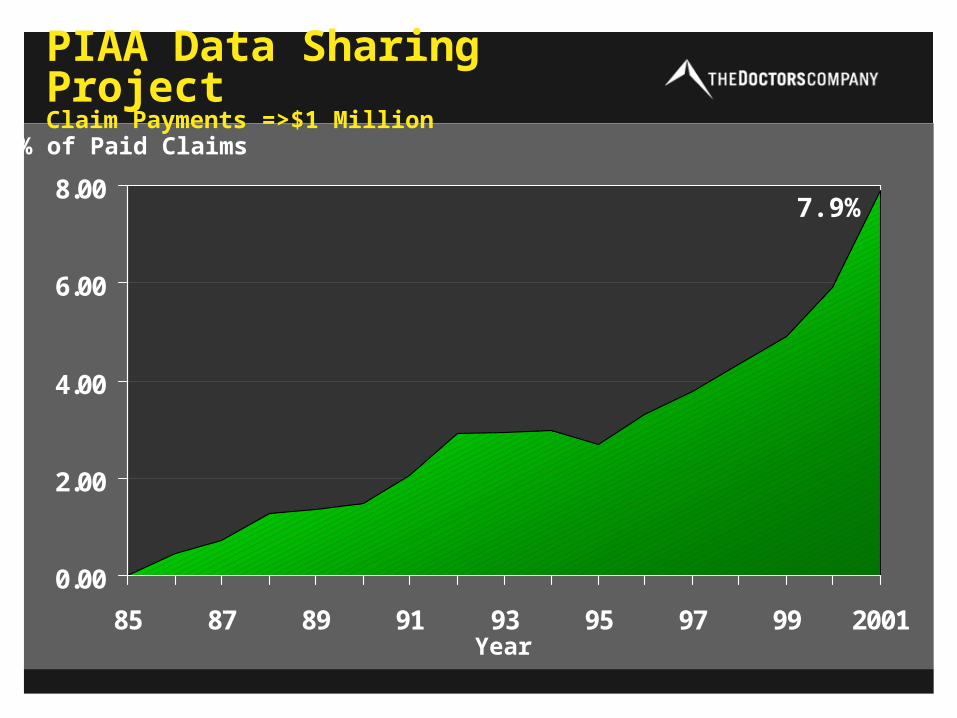
PIAA Data Sharing ProjectClaim Payments =>$1 Million
Year
% of Paid Claims
7.9%

The Most Expensive Claims
• Texas: $268,000,000
• Many states: $100,000,000
• Philadelphia: Jury verdicts exceed the entire state of CA over past 3 years.
• Verdicts drive settlement value.

Top Jury Awards of 2002
$0 $50 $100 $150 $200 $250 $300
Car Accident
Cerebral Palsy
Cerebral Palsy
Cerebral Palsy
Investment Firms
Headon Collision
Philip Morris
Truck Roll
Gas Explosion
Medication Dilution
Philip Morris
Millions

Top Jury Awards of 2002
$0 $4,000 $8,000 $12,000 $16,000 $20,000 $24,000 $28,000
Car Accident
Cerebral Palsy
Cerebral Palsy
Cerebral Palsy
Investment Firms
Headon Collision
Philip Morris
Truck Roll
Gas Explosion
Medication Dilution
Philip Morris

Randomness

Harvard Medical Practice Study and the Institute of Medicine Report on Medical Errors

Institute of Medicine Study
44,000 to 98,000 deaths annually due to malpractice
Goal: 50% reduction over 5 years
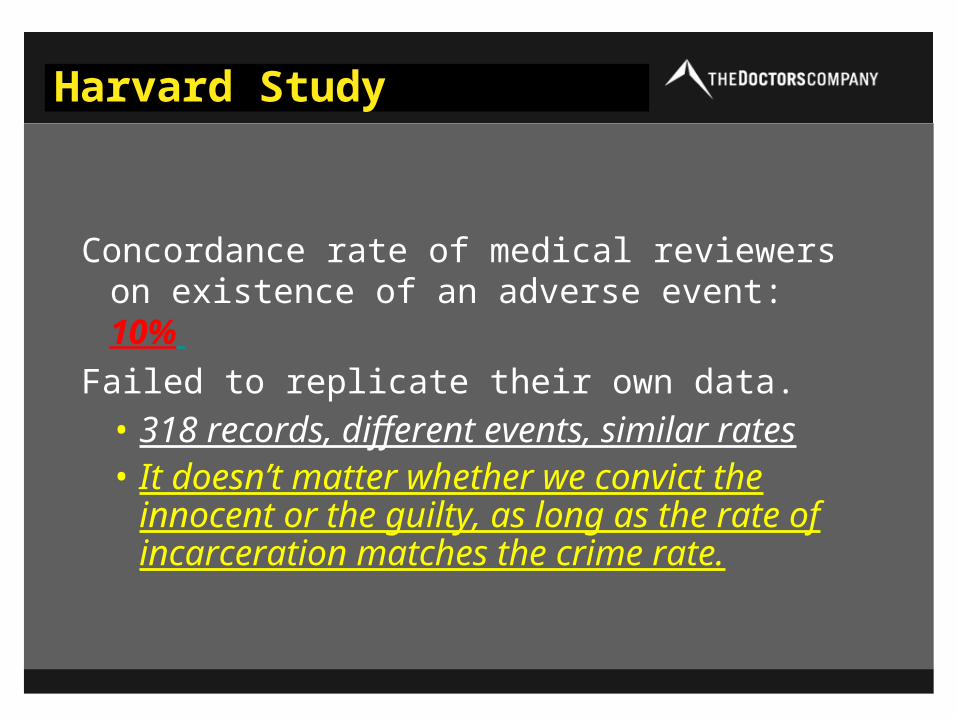
Harvard Study
Concordance rate of medical reviewers on existence of an adverse event: 10%
Failed to replicate their own data.• 318 records, different events, similar rates• It doesn’t matter whether we convict the
innocent or the guilty, as long as the rate of incarceration matches the crime rate.

Harvard Study: Consequent Distortions
Extrapolation: • 180 inadequately classified deaths became
98,000 Americans dying every year due to malpractice.

Harvard Study: The Actual Claims
51 claims8 involved “negligent adverse event”43 involved no “negligent adverse event”26 involved no medical injury at all7.6 times as many negligent adverse events as
malpractice claims.Likelihood of a negligent adverse event
resulting in litigation 1 in 65 (1.53%)

Claims Analysis
Malpractice Trial Outcomes:
• No correlation whatever between the presence or absence of medical negligence and outcome of malpractice litigation

The Bad Doctor Fallacy
• 2% of the doctors cause 50% of the losses• Post hoc, ergo propter hoc• Harvard: Degree of injury, not medical negligence,
predicts outcome.
• Fewer than 1% of physicians have 2 paid claims over a 10-year period of time.• Only one in five doctors with a single paid claim
gets a second within 10 years.

Trial Lawyer Trial Balloons and Myths

Trial Lawyer Trial Balloons
• It’s just about the few bad doctors.• It’s about insurance companies’ bad
investments.• It’s about insurance companies not charging
enough (sic).• It’s not about MICRA, it’s about Prop. 103.• Claims losses don’t matter.

Insurance Company Investments
• Commendably, used to subsidize premium levels in relation to claims losses.
• No malpractice insurer has ever had negative investment income.
• Malpractice insurers average less than 10% of assets in equities.

The Proposition 103 Myth
MICRA 1975, final Constitutional Challenge 1985.
Prop. 103 approved 1989, final court challenge 1993.
• Med mal hearings 1991• TDC had been paying dividends for 11 years
prior to its 103 dividend.• TDC dividends were higher in the 5 years prior
to 103 than they were in the 5 years after.

The Proposition 103 Myth
• The med mal insurers were specifically exempted from rate rollbacks.
• There has not been a single med mal rate increase denied under 103.

AZ
CA
FL
GA
IL MD
MA
MI
NJ NYNC OH
PA TN
TX
VA
-60.0
-50.0
-40.0
-30.0
-20.0
-10.0
0.0
10.0
Underwriting Results 1991-2000 NAIC
Source: 2000 NAIC Profitability Report

The Medical Liability Crisis Is a National Issue
• Federal government pays for 45% of all medical care in the U.S.
• Many states are in crisis today and more will follow.
• HR 5 will not preempt state law wherever the state has spoken.
• Standards of care are national.• Defensive medicine costs the nation in excess
of $100 billion annually.

Economic Loss
• Awarded for children, homemakers, and seniors.
• The $17 million dollar two year old.

Tort Reform

Goals and Benefits
• Sustainable insurance system providing full indemnification of actual loss
• More money for injured patients• Faster settlements• Preserves access to medical care without impeding
access to courts for truly injured patients • Society does not incur double costs • Assures money is available at the time it is needed

MICRA
1. Mandates a $250,000 cap on noneconomic damages ONLY.
2. Allows introduction into evidence of collateral sources of payment.
3. Allows periodic payments of future damages.
4. Provides for a sliding scale limit on attorneys’ contingency fees.

MICRA
5. Provides for a shorter statute of limitations .
6. Requires a 90-day “Notice of Intent to Sue.”
7. Encourage and facilitate arbitration.
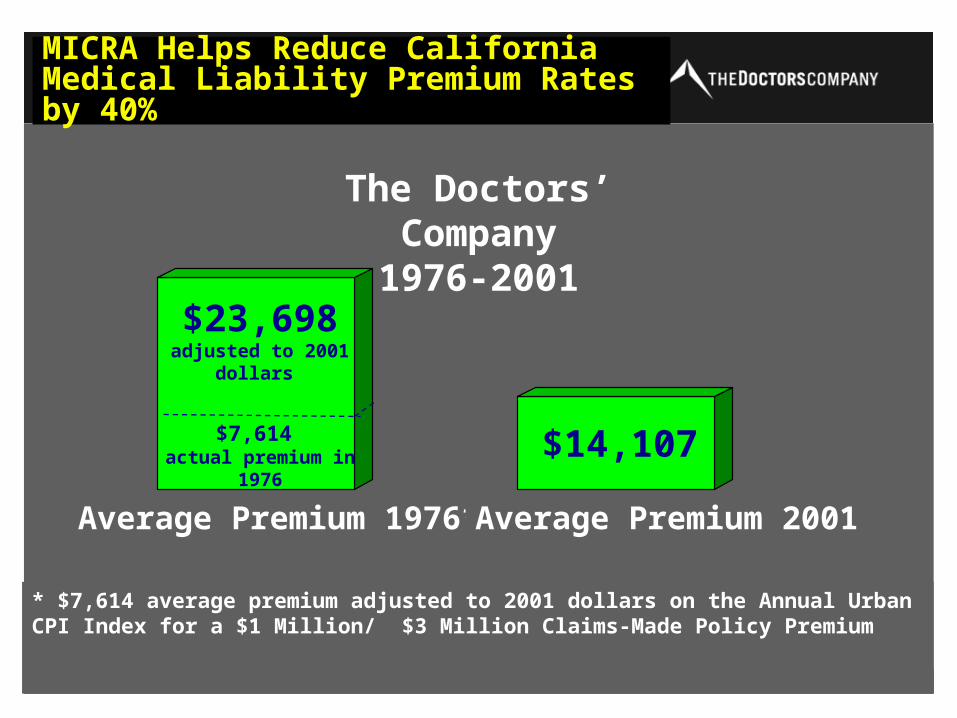
MICRA Helps Reduce CaliforniaMedical Liability Premium Rates by 40%
The Doctors’ Company1976-2001
Average Premium 1976*
* $7,614 average premium adjusted to 2001 dollars on the Annual Urban CPI Index for a $1 Million/ $3 Million Claims-Made Policy Premium
Average Premium 2001
$23,698adjusted to 2001
dollars
$14,107$7,614 actual premium in
1976

MICRA Reduces Verdict Cost and Frequency
Sources: Jury Verdict Research, AMA
$1 Million+ Verdicts Per 1,000 Doctors
3.713.10
2.402.14
1.93
1.31
NY NJ OH FL Nat’l Avg
ex CA
CA

The Doctors’ Company, 1997-2001
1.8 years
2.4 years
California States with No Noneconomic Caps
33%Longer
*Indemnity payments only
MICRA Reduces Average Time to Settlement
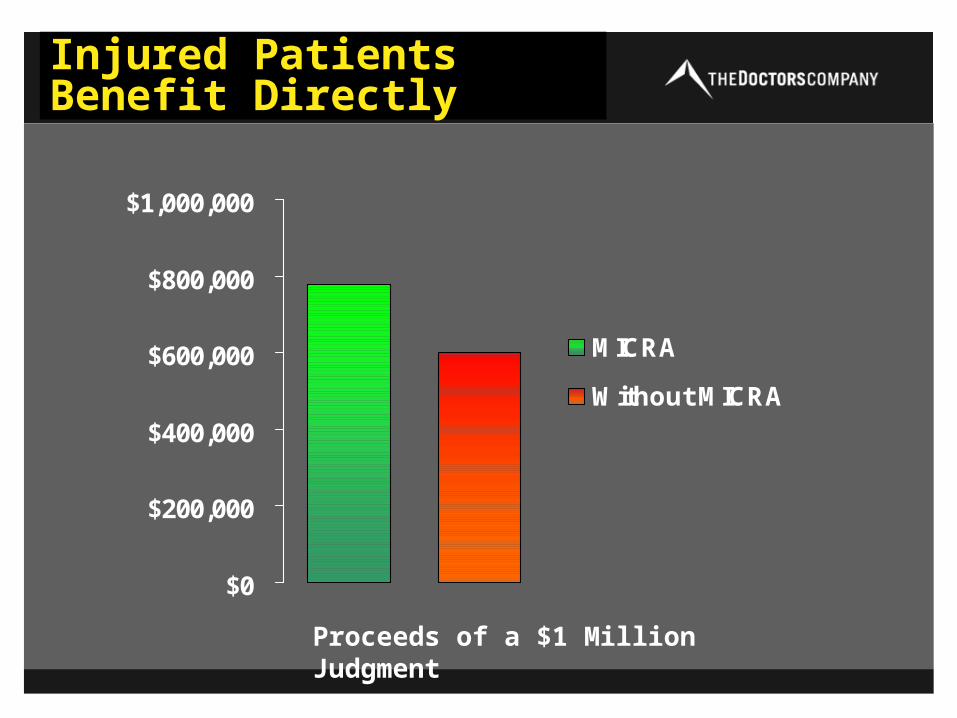
Injured Patients Benefit Directly
$0
$200,000
$400,000
$600,000
$800,000
$1,000,000
MICRA
Without MICRA
Proceeds of a $1 Million Judgment

Average Medical Liability Claim in CA vs. Average Claim Adjusted for Inflation 1976-2001
Actual average physician medical liability claim paid in CA 1976-2001.
Average medical liability claim in CA beginning 1976, adjusted for rate of inflation (CPI) 1976-2001.
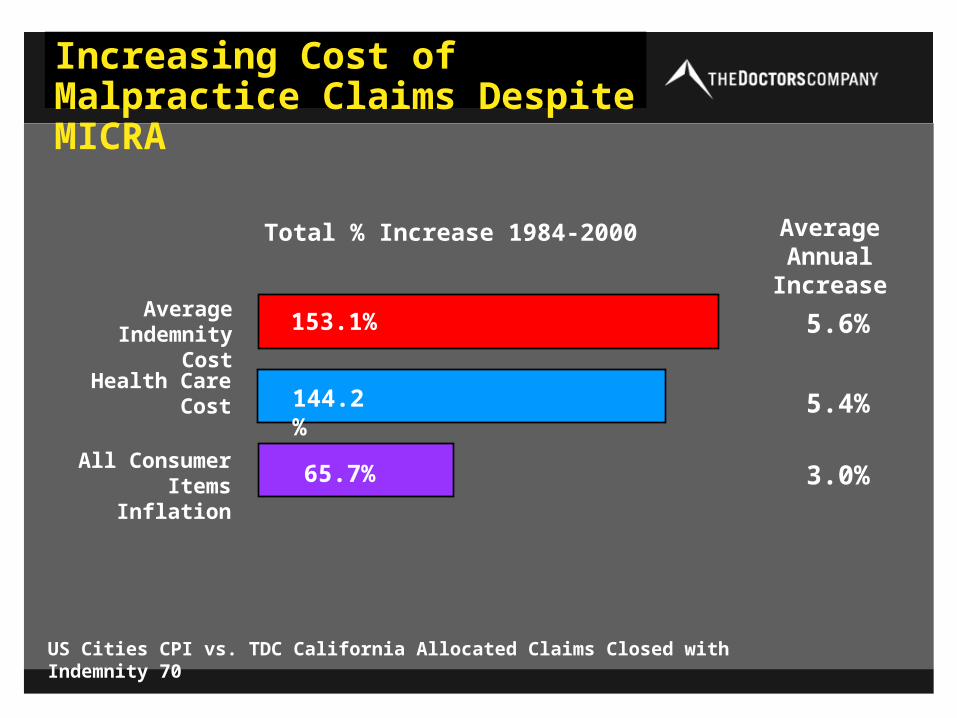
Increasing Cost of Malpractice Claims Despite MICRA
Total % Increase 1984-2000
153.1%
65.7%
144.2%
All Consumer ItemsInflation
Health CareCost
Average Indemnity Cost
AverageAnnual Increase
5.6%
5.4%
3.0%
US Cities CPI vs. TDC California Allocated Claims Closed with Indemnity 70

MICRA Does Not Limit Access to Courts
TDC PHYSICIAN CLAIM FREQUENCY
0.040
0.080
0.120
0.160
0.2001
97
6
19
78
19
80
19
82
19
84
19
86
19
88
19
90
19
92
19
94
19
96
19
98
20
00
20
02
Report Year
An
nu
al
Cla
ims
Per
Ma
ture
In
tern
al
Me
d.
Eq
uiv
ale
nt
Do
cto
r
California Rest of Nation

Oregon: Loss of Tort Reform
$0
$10
$20
$30
$40
$50
$60
$70
1998 1999 Lost TortReform
2000
Millions

Total Plaintiff’s Demand in Settled Cases
$0
$50,000,000
$100,000,000
$150,000,000
$200,000,000
$250,000,000
Total Demand
1998 1999 2000
Oregon: Loss of Tort Reform
2001

California vs. TexasAverage Rate by Specialty (2002)
$0
$20,000
$40,000
$60,000
$80,000
$100,000
Family &GeneralPractice
Ob-Gyn InternalMedicine
GeneralSurgery
OrthopedicSurgery
Texas California

California vs. FloridaAverage Rate by Specialty (2002)
$0
$20,000
$40,000
$60,000
$80,000
$100,000
$120,000
$140,000
$160,000
Family &GeneralPractice
Ob-Gyn OrthopedicSurgery
GeneralSurgery
InternalMedicine
Florida California

Stanford Study: The Cost of Defensive Medicine
States with effective tort reform lower health care costs 5-9%. Savings nationally would be $50 billion.HHS estimates savings as high as $110 billion.
$0
$10
$20
$30
$40
$50
$60 Savings
5-9% Lower Health Care Costs
Billions

MICRA Works
• CA: 27 year experience
• Congressional Budget Office
• Health and Human Services
• State DOIs
• American Academy of Actuaries

MICRA Works
• Florida Governor’s Select Task Force• “The primary cause of increased medical
malpractice premiums has been the substantial increase in loss payments…”
• $250,000 cap• “…will bring relief to this current crisis”• “Without the inclusion of a cap on potential
awards of non-economic damages in a legislative package, no legislative reform plan can be successful in achieving the goal of controlling increases in healthcare costs, and thereby promoting improved access to healthcare”

MICRA Works
• “…there is no other alternative remedy that will immediately alleviate Florida’s crisis…”
• “…a cap of $250,000 per incident will lead to significantly lower malpractice premiums.”
• “If society wishes to have unlimited judgments, then insurance companies will be required to charge unlimited premiums. Unlimited medical malpractice premiums mean unlimited increases in the cost of healthcare. Unlimited increases in the cost of healthcare mean decreased access to healthcare. Limitations of access inevitably affect the most vulnerable members of our society.”

Summary
• Frequency is stable at extremely high levels.
• Severity is rising to unprecedented levels.
• This is a state crisis primarily because some states have effective legal reforms and some do not.
• Access to health care is imperiled.

Summary
• The failure of the states to act, and the fact the Federal Government purchases 45% of all healthcare in the U.S. today justifies national as well as state action.
• Ineffective reforms are worse than none.• Additional regulation of insurance industry will
not address the problems in our legal system.• Proven remedies are available now.
Top Related