


Languages
Pages
Legal


THE COST OF LIVING IN NUNAVIK
RESEARCH REPORT
Jean Robitaille, Enrico Guénard and Gérard Duhaime

The Canada Research Chair on Comparative Aboriginal Conditions is affiliated with
the Interuniversity Centre for Aboriginal Studies and Research (CIÉRA) at the Faculty of
Social Sciences of Université Laval. The Agri-Food Economics and Consumer
Sciences Department is affiliated with the Faculty of Agriculture and Food Sciences
at Université Laval.
Address:
Canada Research Chair on Comparative Aboriginal Conditions
Université Laval
Pavillon Charles-De Koninck
1030, avenue des sciences humaines
Local 2439
Québec, QC
Canada, G1V 0A6
Phone: (418) 656-7596
Fax: (418) 656-3023
© Jean Robitaille, Enrico Guénard and Gérard Duhaime.
To contact the authors:
Reference: Robitaille, Jean, Enrico Guénard and Gérard Duhaime, 2016. The Cost of
Living in Nunavik, Research Report. Québec, Canada Research Chair on Comparative
Aboriginal Conditions, Université Laval, 24 pages + appendices.
Cover illustration:
©Elisapec Qumaluk/Leah Qumaluk, Chasse au petit matin. Povungnituk, 1986, numéro 18.
Reproduced with authorization from the family and the Fédération des coopératives du Nouveau-
Québec.
ISBN: 978-2-921438-01-8
(French edition: ISBN : 978-2-921438-00-1)
Legal deposit: Bibliothèque nationale du Québec, 4th quarter 2016
Legal deposit: Library and Archives Canada, 4th quarter 2016

THE COST OF LIVING IN NUNAVIK
RESEARCH REPORT
Jean Robitaille, Enrico Guénard and Gérard Duhaime


The Cost of Living in Nunavik: RESEARCH REPORT i
Abstract
Context and objective – Université Laval was asked by the Québec government, the Kativik
Regional Government and Makivik Corporation to conduct a survey in order to evaluate the cost
of living in Nunavik and provide input for discussions on ways to establish effective long-term
solutions to the high cost of living.
Method – The survey was conducted over a 16-month period in six selected communities in
Nunavik. In all, 450 randomly-selected households took part in the survey by completing a brief
questionnaire and reporting all expenditure by household members during a two-week period.
The data used for the calculations covered 3,682 goods and services, or 5 times more articles than
the 690 goods and services used by Statistics Canada to calculate the CPI.
Spending structure – The survey was used to establish the spending structure of households in
Nunavik. The results highlighted major differences in the spending structure when analyzed in
terms of household income level: households with the lowest income devoted over 70% of their
expenditure to food and shelter, in contrast to households with a higher income.
The comparative cost of living index for Nunavik – The survey also made it possible to
establish a general cost of living index for Nunavik compared to Québec City, and indexes for
each component. The index for all components was 113.1 in Nunavik and 100 in Québec City,
meaning that the cost of living was 13% higher overall in Nunavik. In addition, with the
exception of the shelter component, the indexes calculated for all the other components are
significantly higher in Nunavik than in Québec City. A basket of groceries costs 48% more in
Nunavik; household operations are 43% more expensive; alcohol and tobacco products are 37%
more expensive; recreation is 32% more expensive; and so on. Only shelter is less expensive in
Nunavik. The differences are observed despite the cost-of-living reduction measures already in
effect in the region.
Shelter – The results show the special place held by shelter in the spending structure, and the
downward pressure it places on the comparative cost of living index for Nunavik. Even though
shelter costs less in Nunavik than in Québec City, it still accounts for between 22.1% and 27.0%
of household expenditure. Social housing currently has the effect of an important cost-of-living
reduction measure for Nunavimmiut households.
Conclusion – The survey made it possible to construct a unique database that could be used for
more advanced analysis on specific subjects. Further investigations could periodically update the
general and component-specific indexes. This tool could be used to study the potential impacts of
measures at the planning stage, and to monitor the actual impacts of any measures adopted.

ii J. ROBITAILLE, E. GUÉNARD AND G. DUHAIME, 2016

Table of Contents
Acknowledgements ....................................................................................................................... vii
1. INTRODUCTION ..................................................................................................................... 1
2. OBJECTIVE .............................................................................................................................. 1
3. METHODOLOGICAL STRATEGY ...................................................................................... 2
3.1 Adaptation of a consumer price index to measure the cost of living ..................................... 2
3.2 Rationale for adapting the Paasche price index ..................................................................... 2
3.3 Data collection ....................................................................................................................... 3
3.4 Communities selected for the survey and sampling of households ....................................... 3
3.5 Recruitment of households, survey procedure and information collected ............................. 6
3.6 Processing of data by the Université Laval research team .................................................... 6
3.6.1 Classification of the goods and services purchased by sampled households .................. 7
3.6.2 Identification of prices in Québec City ........................................................................... 7
3.6.3 Stratification of households in the survey based on their annual pre-tax income ........... 8
3.6.4 Limits .............................................................................................................................. 9
3.6.5 Consumer profile captured by the survey and reliability of the indexes ...................... 10
4. RESULTS ................................................................................................................................. 11
4.2 Spending structure for all the Nunavimmiut households in the survey ............................... 12
4.2.1 Spending structure for households in the survey, by income level ............................... 13
4.3 Comparative cost of living index and sub-indexes for each of the eight components
for all households in the survey ........................................................................................... 15
4.3.1 Comparative cost of living indexes and sub-indexes for each of the eight cost of
living components, by income level ............................................................................. 18
4.4 Conclusion ........................................................................................................................... 20
5. DISCUSSION ........................................................................................................................... 20
References ..................................................................................................................................... 23
List of appendices .......................................................................................................................... 24

iv J. ROBITAILLE, E. GUÉNARD AND G. DUHAIME, 2016
List of Tables
Table 1. Distribution of households surveyed by community, geographic region and size,
Nunavik, 2015-2016, ......................................................................................................... 4
Table 2. Distribution of all households surveyed by community and by quarter, Nunavik,
2015-2016 ........................................................................................................................... 5
Table 3. The eight components used to list expenditure by households in the survey, Nunavik,
2015-2016 .......................................................................................................................... 7
Table 4. Businesses and service providers used to identify the price in Québec City of goods
and services purchased by households in the survey, Nunavik, 2015-2016 ....................... 8
Table 5. Rental market used to identify the average price for each type of dwelling, Nunavik,
2015-2016 ........................................................................................................................ 18

THE COST OF LIVING IN NUNAVIK: RESEARCH REPORT v
List of Figures
Figure 1. Distribution of all households surveyed by quarter, Nunavik, 2015-2016 ................... 5
Figure 2. Distribution of households by income level, Nunavik, 2015-2016 .................................. 8
Figure 3. Reported spending structure for households, Québec province and Nunavik,
2014, 2015-2016 ............................................................................................................. 12
Figure 4. Spending structure for households in the survey by income level, Nunavik,
2015-2016 ..................................................................................................................... 14
Figure 5. Cost of living index in Nunavik by spending component, Nunavik, 2015-2016 .......... 15
Figure 6. Cost of living index in Nunavik by spending component and by income level,
Nunavik, 2015-2016 ..................................................................................................... 19

vi J. ROBITAILLE, E. GUÉNARD AND G. DUHAIME, 2016

THE COST OF LIVING IN NUNAVIK: RESEARCH REPORT vii
Acknowledgements
This research project was made possible by a major collaborative effort. Many people made a
contribution, and to name them all here would be a challenge only slightly less difficult than
describing the consumer situation in Nunavik. As a result, we can only express our gratitude to all
our partners while, at the same time, asking for the indulgence of the people and organizations
whose contribution is not explicitly mentioned here.
Isabelle Parizeau not only shared our vision regarding the relevance of this research project, but
she also significantly contributed toward its accomplishment. Accordingly, we wish to express
her our first note of gratitude. In the same order of ideas, we must readily highlight the
fundamental contribution made by the people involved in the actual data collection. The local
employment officers played a key role in this long-term operation—Tommy Baron and Jessie
Etok in Kangiqsualujjuaq, Sarah Gordon in Kuujjuaq, Lucina Cain in Tasiujaq, Charlie N.
Saviadjuk and Aija Cameron in Salluit, Mina Kenuajuak and Viola Novalinga in Puvirnituq and
Markossie Tookaloo in Umiujaq. Several employees of the Kativik Regional Government,
especially in the Kuujjuaq office also helped organize, support and monitor the data collection
operation, including Sabine Georges, Annie-Claude Houle, Alain Turber and Mary Weetaluktuk.
Special thanks go to Margaret Gauvin, Maggie Shea, Lydia Watt and François Ouellet for their
constant support. The success of the data collection process reflects the human and professional
qualities and the personal commitment of Daniel Troie; we were lucky enough to work with him
once again on this project.
Other people and organizations in, or working in, Nunavik, played an important role in this study.
We would like to mention Watson Fournier at the Kativik Municipal Housing Bureau, Eileen
Klinkig at Makivik Corporation, Elyse Tratt at the Nunavik Regional Board of Health and Social
Services, and the outstanding assistance provided by Daniel Lelièvre at the Fédération des
coopératives du Nouveau-Québec and Paul Dalby and Derek Reimer at the North West Company.
We also had access to resources outside Nunavik and would like to highlight the contributions
made, at the Société d’habitation du Québec, by Chantal Bélanger, Serge Bouchard and Annie
Boutet; at the Canadian Mortgage and Housing Corporation by Elisabeth Koulouris; and at the
municipal housing office of Saint-Damien-de-Buckland by Daniel Guillemette.
The Université Laval team completed a colossal task by drawing up the research protocol and
instruments and processing and analyzing the data. Our thanks go to Claire Bauler, Andrée
Caron, Alexandre Germain, Pierre-Donald Leblanc Thibodeau, Sébastien Lévesque, Catherine
Naud, Olga Nigai Manciu, Christina Paquet and Yichen Yue. As always, Lise Fortin provided
ongoing and good-humoured support, even in difficult circumstances; we thank her. The same
applies to Louise Brassard, Anna Lafleur and Sylvie Levesque at the Agri-Food Economics and
Consumer Sciences Department, always on hand to assist the members of the research team
members affiliated with the Faculty of Agriculture and Food Sciences (FAFS) at Université
Laval. Our gratitude also extends to Renaud Fortier, Ali Ouzennou and Sébastien Verreault at the
Pedagogical Resource Centre of the FAFS for their assistance and advice concerning the
computer resources used for this research project.

viii J. ROBITAILLE, E. GUÉNARD AND G. DUHAIME, 2016

THE COST OF LIVING IN NUNAVIK: RESEARCH REPORT 1
1. INTRODUCTION
In December 2013, the Québec government, Kativik Regional Government (KRG) and Makivik
Corporation signed the Agreement on the Financing of Measures to Reduce the Cost of Living in
Nunavik. The agreement specified that a survey would be conducted to evaluate the cost of living
in Nunavik.
The survey was entrusted to the Canada Research Chair on Comparative Aboriginal Conditions at
Université Laval, under the direction of two Université Laval professors: G. Duhaime, from the
sociology department, for the scientific aspects, and J. Robitaille, from the agri-food economics
and consumer sciences department, for the methodology. The work began in the spring of 2014.
A monitoring committee, with representatives from the signatory parties to the agreement of
December 2013, was established when the research activities commenced, and was kept informed
of the progress of the work. In addition, a technical committee, made up of representatives from
the Kativik Regional Government and Makivik Corporation, was set up to assist the Université
Laval team. The technical committee met several times during the preliminary phases of the
survey and was closely involved in developing all the elements of the research protocol: selection
of the communities asked to take part in the survey, detailed revision of the data collection
method, inclusion or exclusion of certain types of consumer purchases, communications strategy
before and during the data collection, etc. The full research protocol was submitted to the
research ethics committee at Université Laval, which considered that the survey did not fall under
its jurisdiction. The research protocol was tested during a pilot survey in the fall of 2014.
Following this, the protocol was revised and approved by the technical committee. Prior to the
survey itself, local data collection staff were given training, and a communications campaign was
launched to inform the local authorities and general public about the survey.
This report presents the objectives of the survey, the methods used for data collection, treatment
and analysis, and the main findings from the survey.
2. OBJECTIVE
The objective of the survey was to evaluate the cost of living in Nunavik, taking into account the
consumer patterns of households in the region, the price of goods and services, and price
differences between Nunavik and southern Québec.
More specifically, the survey involved listing as exhaustively as possible the consumer patterns of
Nunavimmiut households in terms of the goods and services they purchase in the North,
calculating the costs associated with those consumer patterns according to the price structure in
effect in Nunavik, and evaluating what the same goods and services would cost if subject to the
price structure in effect in Québec City. Using the Québec City region as a geographical reference
point, the goal of the study was to calculate comparative cost of living indexes that would shed
light on the economic realities faced by private households in Nunavik.
Makivik Corporation, the Kativik Regional Government and the Québec government undertook
to use the findings from the survey to define effective long-term solutions to the high cost of
living in Nunavik.

2 J. ROBITAILLE, E. GUÉNARD AND G. DUHAIME, 2016
3. METHODOLOGICAL STRATEGY
The methodological strategy for the research consisted in measuring as exhaustively as possible
the effective demand among private households in Nunavik for the goods and services making up
their main items of expenditure, and determining the price of those goods and services;
establishing the price of the same goods and services in Québec City; and establishing the
difference between the amount effectively paid by Nunavik households to make their purchases
in the region, and the amount they would have paid to buy the same goods and services, or their
equivalent, in Québec City.
3.1 Adaptation of a consumer price index to measure the cost of living
Based on the data collected from a representative sample of private households in Nunavik, an
adaptation of the Paasche consumer price index (International Labour Office, 2004) was used to
calculate a synthetic weighted cost of living index for Nunavik, with Québec City as the
reference. The modified Paasche price index was calculated as follows:
IPaasche modified = ∑ (𝑃𝑁𝑖
𝑋 𝑄𝑁𝑖)𝑛
𝑖
∑ (𝑃𝑄𝑖 𝑋 𝑄𝑁𝑖
)𝑛𝑖
x 100
where PN and PQ refer to the prices, respectively in Nunavik and Québec City, of various "n",
which are goods and services purchased by the households surveyed in Nunavik at the time of the
survey; QN refers to the quantities of goods and services purchased by the households surveyed in
Nunavik.
3.2 Rationale for adapting the Paasche price index
The decision to adapt the Paasche price index results directly from the objective of this study. The
various different consumer price indexes calculated by government authorities are time-
referenced (for a given reference year), whereas the index needed for this project had to be
geographically referenced (Nunavik compared to Québec City). For this purpose, the change
made to the Paasche index rectifies the reference framework for the calculation of relative
indexes and sub-indexes for two distinct geographic regions. In addition, the adaptation of the
Paasche turned out to be relatively simple to operationalize.
At the theoretical level, for a consumer price index to measure the cost of living, the range of
goods and services available to and consumed by the target population must be circumscribed. At
the empirical level, this means that the more the goods and services used to calculated the price
index are exhaustive and representative of all the goods and services making up the available
consumer range of the population studied, the more the index will have potential for reflecting the
true cost of living for that population.
The various consumer price indexes are, in practice, calculated using a fixed basket that contains
only a limited sample of the range of goods and services available to a given population. For
example, Statistics Canada uses a basket of 690 goods and services to calculate the consumer
price index (CPI).

THE COST OF LIVING IN NUNAVIK: RESEARCH REPORT 3
As a result, most indexes are unable to capture the substitution effects which occur in a
household's expenditure and consumer patterns when the price structure for the goods and
services making up the consumer range changes. However, in this study, the adaptation of the
Paasche price index was operationalized via a survey that was intended to be as exhaustive as
possible. The application of the principle of aggregation subject to the law of large numbers
confirms the exhaustiveness of the consumer patterns of Nunavimmiut households.
The range of goods and services available in Nunavik is significantly more restricted than in the
South, mainly because of the remote location of the communities concerned, the costs generated
by transportation logistics, and the limited number of businesses physically present in the area.
These characteristics also legitimize the use of the adaptation of the Paasche index as a
comparative indicator for the cost of living in Nunavik and Québec City.
3.3 Data collection
Data collection took place over a 16-month period (January 2015 to April 2016), in order to take
into account seasonal variations in the consumer patterns of the Nunavimmiuts and in the price
structure. A pilot survey was implemented first, from mid-November to mid-December 2014, in
order to validate the data collection strategy for the households involved. In Nunavik, the data
was collected by local employment officers of the Kativik Regional Government, under the
supervision of a field coordinator from the Université Laval research team. The local employment
officers had received two days of training. In Québec City, the data was collected by the
Université Laval team.
3.4 Communities selected for the survey and sampling of households
In all, six of the fourteen communities in Nunavik were selected as the sample base for the
survey: Kuujjuaq, Kangiqsualujjuaq, Tasiujaq, Puvirnituq, Salluit and Umiujaq. They were
selected not only as being representative of Nunavik's two geographic regions (Ungava Bay and
Hudson Bay) and community size (large, medium and small), but also because of the number of
flight legs needed to reach each community.
In all, 450 private households were surveyed, selected randomly from the lists of addresses
provided by the Kativik Municipal Housing Bureau (KMHB) and employers. However, the
survey files of two households could not be located, and so this report is based on a sample of 448
households. Participation was open to all private households with at least one full year's residency
in Nunavik prior to the survey.
According to the most recent published data (Duhaime et al., 2015), the number of private
dwellings in Nunavik is 3,140, including 3,050 rental units and 90 owner-occupied dwellings. As
a result, the sample of 448 households selected for this cost of living survey gives a margin of
error of plus or minus 4.3%, with a confidence interval of 95%, 19 times out of 20.
4 J. ROBITAILLE, E. GUÉNARD AND G. DUHAIME, 2016
Table 1. Distribution of households surveyed by community, geographic region and size,
Nunavik, 2015-2016
Region Community Size of the community n %
Ungava Kuujjuaq Large 148 33.0
Kangiqsualujjuaq Medium 69 15.4
Tasiujaq Small 15 3.3
Subtotal for Ungava: 232 51.8
Hudson Puvirnituq Large 121 27.0
Salluit Medium 89 19.9
Umiujaq Small 6 1.3
Subtotal for Hudson: 216 48.2
Total Nunavik: 448 100.0
The order in which the surveys were conducted in the six communities was designed to maximize
the representation of seasonal variations in consumer patterns and in the price of the goods and
services purchased by households, and to minimize the costs associated with data collection. In
addition, the number of private households sampled in each community determined the number of
data collection segments and the duration of the survey in each community.

THE COST OF LIVING IN NUNAVIK: RESEARCH REPORT 5
Figure 1. Distribution of all households surveyed by quarter, Nunavik, 2015-2016
Table 2. Distribution of all households surveyed by community and by quarter, Nunavik,
2015-2016
Community Pilot
survey
1st
quarter
2015
2nd
quarter
2015
3rd
quarter
2015
4th
quarter
2015
1st
quarter
2016
Total
Kuujjuaq n 1 27 14 74 19 13 148
% 0.2 6.0 3.1 16.5 4.2 2.9 33.0
Kangiqsualujjuaq n 12 8 25 24 0 0 69
% 2.7 1.8 5.6 5.4 0.0 0.0 15.4
Tasiujaq n 0 7 4 0 0 4 15
% 0.0 1.6 0.9 0.0 0.0 0.9 3.3
Puvirnituq n 0 1 10 91 19 0 121
% 0.0 0.2 2.2 20.3 4.2 0.0 27.0
Salluit n 0 22 18 6 10 33 89
% 0.0 4.9 4.0 1.3 2.2 7.4 19.9
Umiujaq n 0 0 6 0 0 0 6
% 0.0 0.0 1.3 0.0 0.0 0.0 1.3
Total n 13 65 77 195 48 50 448
% 2.9 14.5 17.2 43.5 10.7 11.2 100

6 J. ROBITAILLE, E. GUÉNARD AND G. DUHAIME, 2016
3.5 Recruitment of households, survey procedure and information collected
The households surveyed in each of the six communities selected for the survey were first
contacted by a local employment officer working for the Kativik Regional Government, who
checked that the household qualified to take part in the survey. If it did, the employment officer
briefly presented the background and objective of the study, the procedure for the survey, and the
expectations concerning the household's participation. If the household indicated its willingness
to take part in the survey, one of its members was invited to meet with the local employment
officer to read and sign the consent form (see Appendix 1). The first interview took place at the
same time to collect information on the household's size and composition: number of members,
age and gender of each member, relationship of each member to the respondent, and number of
members who were beneficiaries under the James Bay and Northern Québec Agreement
(JBNQA). During the interview, information was also collected on the household's total pre-tax
(i.e., gross) income and its residential status (housing provided by the KMHB, housing provided
by the employer, or private dwelling) (see Appendix 2). At the end of the first interview, the
household's representative was given a survey kit comprising: a daily spending log, in which the
participant had to record, for two consecutive weeks, each item of expenditure by each household
member; an envelope for detailed receipts from all the purchases; and an explanatory guide for
completing the log (see Appendices 3 and 4).
Depending on the availability of the local employment officers in each of the six communities,
one or two follow-up meetings or phone calls took place with each household representative
during the two-week period for completing the log. This follow-up gave the employment officer
an opportunity to ensure that the household participants were completing the spending log in
accordance with the instructions. After completing the spending log, the household
representatives attended a last meeting where the spending log and an envelope containing all the
receipts were collected by the local employment officer, who checked with the respondent to
ensure that all the information recorded in the household's log was complete and correctly
documented. Once the local employment officer was satisfied that all the receipts and information
had been provided by the household for the expenditure recorded in the log, the completed survey
materials were sent to the field coordinator. The coordinator checked the information provided by
each household again, then digitized the data and uploaded it to a secure cloud-based account for
processing by the Université Laval team. The hard copies of the completed survey materials and
receipts were also sent to the Université Laval team for more in-depth analysis and processing.
Each household received $100 in financial compensation for its participation.
3.6 Processing of data by the Université Laval research team
Once the data had been digitized and recorded in the secure account, the Université Laval team
carried out the final checks and ensured that all the required information had been collected for
each participating household.
Based on the digital codes printed on the receipts, the Université Laval team identified the
Universal Product Code (UPC) for each article purchased. For this purpose, computerized lists
containing the UPC and a detailed description of each product available locally in Nunavik were
drawn up with the assistance of the North West Company (NWC) and the Fédération des
coopératives du Nouveau-Québec (FCNQ). In all, over 720,000 consumer articles were listed in
the computerized lists of product UPCs and the descriptions of products purchased by the
households in the survey. Once identified, the UPCs for the goods and services purchased were
entered into an Excel database with a detailed description of the products, the quantities
purchased, the prices paid and the dates of purchase.

THE COST OF LIVING IN NUNAVIK: RESEARCH REPORT 7
The price of all the goods and services purchased in Nunavik was also identified in Québec City.
When an article purchased in Nunavik could not be located in Québec City, the price of a close
substitute was used. This information was also recorded in the Excel database.
3.6.1 Classification of the goods and services purchased by sampled households
In the database, the goods and services purchased in Nunavik by the households in the survey
were divided into eight components, based on the classification generally used by Statistics
Canada for calculating the consumer price index (CPI). This classification was chosen for three
main reasons: it reflects the economic reality faced by consumers, it meets the needs of the
research project, and it uses components that are unambiguous, mutually exclusive and
exhaustive.
Table 3. The eight components used to list expenditure by households in the survey,
Nunavik, 2015-2016
Cost of living components
Food
Shelter
Household operations, furnishings and equipment
Clothing and footwear
Transportation
Health and personal care
Recreation, education and reading
Alcoholic beverages and tobacco products
3.6.2 Identification of prices in Québec City
In Québec City, many different places were visited to identify the price of the goods and services
purchased by households in the survey in Nunavik. Several businesses and service providers had
to be contacted to locate identical goods and services or, when this was not possible, to find close
substitutes in order to reconstitute as faithfully as possible the range of consumer products
purchased by households in Nunavik.

8 J. ROBITAILLE, E. GUÉNARD AND G. DUHAIME, 2016
Table 4. Businesses and service providers used to identify the price in Québec City of goods
and services purchased by households in the survey, Nunavik, 2015-2016
3.6.3 Stratification of households in the survey based on their annual pre-tax income
Given that the structure and the nature of a household's expenditure are not only subject to, but
also conditioned by, its ability to pay, the household's cost of living is largely dependent on its
available income. For the purposes of this study on the cost of living, surveyed households were
grouped into three separate strata based on their total annual pre-tax (i.e., gross) income, as
assessed by questionnaire (see Appendix 2). The 448 households in the survey were placed at
three income levels: low, medium and high.
Figure 2. Distribution of households by income level, Nunavik, 2015-2016
Food Shelter
Household operations,
furnishings and
equipment
Clothing and
footwearTransportation
Health and
personal care
Recreation,
education and
reading
Alcoholic
beverages and
tobacco products
IGA SCHL IGA Walmart Air Inuit Walmart Walmart Couche-tard
Walmart OMHQ Walmart Sports Experts First Air IGA Staples IGA
Couche-tard Meubles Ashley Columbia Canots Nor-West Brunet Louis Garneau Métro
Métro Canadian Tire FurCanada Canadian Tire Pharmaprix Eb games SAAQ
Maxi Corbeil Sears Walmart Métro Future Shop CPE
Normandin Ameublement Tanguay Atmosphere Canadian Tire Entrepôt du hockey
Stratos Best Buy Sewknit.ca Costco Toys"R"us
Maxi Canadian tire Jean-Coutu Software King
Brador Footlocker Babies"R"Us Canadian Tire
Canadian Tire Sears.ca
Jean-Coutu Renaud-Bray

THE COST OF LIVING IN NUNAVIK: RESEARCH REPORT 9
To stratify households based on their ability to pay, a low income measure (LIM) was calculated
using an adaptation of the methodology routinely used by Statistics Canada (Statistics Canada,
2002) (see Appendix 8). More specifically, the LIM used by Statistics Canada is a fixed
percentage (50%) of the median "adjusted" family income, where "adjusted" refers to the
consideration given to a family's needs depending on its composition and its size.1 The LIM,
since it indicates not only the situation of a family and its members, but also their position
compared to other families in the reference population, also measures relative poverty. For the
purposes of this study, the reference population is Nunavik. Considering the socio-demographic
characteristics of Nunavimmiut communities, and especially the high proportion of multi-family
households and the survival of a form of family solidarity, the LIM used for the study was based
on the total income of the households in the survey, in other words the sum of the total incomes
of all the individuals making up the household. In addition, for the purposes of the study, the LIM
chosen to separate low-income households from other households was 75% of the median
"adjusted" household income. The decision to set the LIM at 75%, rather than 50%, of the median
adjusted income was largely based on the fact that the purchasing power of one dollar of income
in Nunavik is considerably less than for the same dollar in the South, because of the higher cost
of living in communities located north of the 55th parallel. Similarly, the income measure used to
establish the LIM was a pre-tax measure, whereas purchases of goods and services are made with
after-tax dollars (see Appendix 8).
In this study, the households in the survey with a total annual pre-tax income of less than 75% of
the median "adjusted" income (LIM-75) constitute the low-income stratum. Households with an
annual pre-tax income equal to or above the LIM-75, but less than 200% of the median "adjusted"
income (LIM-200), are the middle-income stratum. Last, households with an annual pre-tax
income equal to or over the LIM-200 are the high-income stratum.
3.6.4 Limits
The range of consumer products noted during the survey does not include all the goods and
services that could be purchased. Some goods and services were excluded because of their nature,
and because of the theoretical, ethical, methodological or logistic problems that would have been
raised by their inclusion. Other goods and services were excluded after the data had been
collected, because of the incomplete nature of the information provided. This is discussed briefly
in the following paragraphs.
The decision to exclude certain goods or services was sometimes based on the nature of the goods
or services concerned. This concerns two groups of products—firstly, illegal substances (drugs,
smuggled alcohol) and other criminal products. During the planning stage, the technical
committee considered that the inclusion of these goods and services created a major risk for the
overall success of the survey, and for the safety of individuals, in particular those actively
involved in data collection.
1 The adjustment of the median income uses an equivalency scale that assigns a different weighting to each
household member based on his or her age. The oldest member is given an equivalence factor of 1, and the
second oldest member and all members aged 16 or over are given an equivalence factor of 0.4. Members
aged under 16 are given an equivalence factor of 0.3. The sum of all these equivalence factors provides the
equivalence factor for the household (Paquet 2009). This adjustment has the advantage of relating the
household's nominal income to its specific needs (Duhaime and Édouard 2012).

10 J. ROBITAILLE, E. GUÉNARD AND G. DUHAIME, 2016
The second group was excluded because of the swapping of goods, the exchanging of services, or
the free distribution of food products. This consumption did not generally involve any direct
monetary cost. Given the objective of the survey and the limited resources available, there was no
realistic way to produce a valid measurement of these aspects in Nunavik, or to identify valid
comparative measurements in Québec City.
Other goods and services were excluded after the data collection because the information
collected was incomplete. This concerned three types of consumption. First, in Kuujjuaq,
purchases made at the business Newviq’vi/Tullik could not be used to produce the various
indexes published in this report. The lack of digital product codes and detailed product
descriptions on the receipts issued by the business made it impossible to correctly list the articles
purchased. For some of the 148 households from Kuujjuaq in the survey, the purchases made at
the Newviq’vi/Tullik business represented over one-third of their expenditure over the two weeks
of the survey. On average, weekly expenditure of roughly $211 per household surveyed in
Kuujjuaq could not be included in the database used to produce the various indexes presented in
this report.
Secondly, not all the consumer goods purchased and documented on the cash register receipts
provided by the surveyed households could be identified by the Université Laval team because of
a lack of information about the specific characteristics of certain consumer goods. These goods,
representing 18.4% of the consumer expenditure of the surveyed households, could not be
documented with enough precision to be used in the computation of the indexes presented in this
report.
Thirdly, second-hand consumer goods were not included in calculating the indexes, although
some transactions of this kind were reported by a few households. This decision was made
because of the lack of information on the specific characteristics of these items, and the difficulty
of evaluating their economic value in Québec City.
A strict interpretation of the results must take into account these limits, which were necessary
here in order to achieve the survey objectives and preserve the methodological rigour needed to
ensure valid results.
3.6.5 Consumer profile captured by the survey and reliability of the indexes
Over 6,700 detailed, usable receipts from approximately 52,000 purchases made by the 448
Nunavimmiut households in the survey were compiled and processed for the purposes of this
study. In all, 7,008 separate consumer goods, representing a total expenditure of $524,617, were
reported by the surveyed households. Each of these 7,008 consumer goods purchased by the
households in the survey was placed in one of the eight components of goods and services
presented in Table 3.
However, as explained above, only the price of clearly identified goods and services was
collected in Québec City. For this reason, 3,682 articles representing 81.6% of the total reported
expenditure, or $428,122, were used to calculate the various indexes presented in this report. This
is over 5 times more than the 690 goods and services used by Statistics Canada to calculate the
CPI.
The consumer profile captured here is extremely important, although we cannot claim that it is
exhaustive. It may be considered as providing a faithful representation of the economic reality of
private households in Nunavik, provided its inherent limits are taken into account.

THE COST OF LIVING IN NUNAVIK: RESEARCH REPORT 11
4. RESULTS
4.1 Introduction
This section presents, first, the spending structure that reflects the consumer patterns for all the
Nunavimmiut households in the survey based on the eight components of goods and services used
by Statistics Canada to calculate the CPI, as shown in Table 3.
Second, the spending structure is broken down by the ability to pay of the households in the
survey. The households were placed in three strata: low income, medium income, and high
income.
Third, the comparative cost of living index calculated on the basis of all spending that reflects the
consumer patterns of private households in Nunavik (CCLIN) is presented. This comparative
index measures the gap between the cost of living for Nunavimmiut households generated by the
price structure in Nunavik for the goods and services they consume, and the cost of living that
would be generated for the same consumer patterns by the price structure in Québec City. The
index calculated for all spending is also broken down into eight sub-indexes, one for each
component of goods and services.
Last, the comparative cost of living index for the whole of Nunavik is broken down according to
the households' pre-tax ability to pay. The Nunavimmiut households in the survey are placed in
three income strata, and a comparative cost of living index is presented for each of the tree strata.
Once again, the index for each income stratum is then broken down into eight sub-indexes based
on the eight components of goods and services presented in Table 3.
In all, four comparative cost of living indexes (the index for all households in Nunavik and the
three indexes for the three strata of household income) and 32 comparative sub-indexes (the four
comparative cost of living indexes broken down by eight components of goods and services) are
presented in this section.

12 J. ROBITAILLE, E. GUÉNARD AND G. DUHAIME, 2016
4.2 Spending structure for all the Nunavimmiut households in the survey
For all the 448 households surveyed, food is the biggest spending item, at 37.4% of reported
spending. Shelter comes second, at 23.7% of documented spending, and transportation third at
12.4% of reported spending. Alcoholic beverages and tobacco products are fourth, at 9.7% of
reported spending, and household operations and furnishings come fifth at 8.5% of reported
spending. Similarly, clothing and footwear come sixth, at 3.5% of spending, and health and
personal care seventh, at 2.7% of reported spending. Last, recreation, education and reading come
last, with 2.1% of reported spending.
The spending structure which portrays Nunavik is different from the spending structure of
Québec as a whole. Notably, the expenditure share devoted on food in Nunavik is more than
twice the expenditure share allocated to food in Québec. Moreover, combined together, food and
shelter account for 41% of the total spending in Québec, whereas those two components add up to
61% in Nunavik. This is indeed an important difference which characterizes Nunavik when
compared to Québec.
Figure 3. Reported spending structure for households, Québec2 province and Nunavik,
2014, 2015-2016
2 The reported percentages for Québec province are budget shares originating from Table 203-0021 drawn
from Statistics Canada’s Survey of Household Spending.
aaaaaaQUÉBEC (2014) NUNAVIK (2015-2016)
1 5
2 6
3 7
4 8
Transportation Health and personal care
Alcoholic beverages and tobacco products Recreation, education and reading
Shelter Clothing and footwear
Food Household operations, furnishings and equipment
2.1%
2.7%
3.5%
8.5%
9.7%
12.4%
23.7%
37.4%
0% 10% 20% 30% 40%
8.3%
7.1%
5.9%
10.7%
3.1%
20.6%
26.0%
15.3%
0%10%20%30%40% 0%

THE COST OF LIVING IN NUNAVIK: RESEARCH REPORT 13
4.2.1 Spending structure for households in the survey, by income level
Since a household's spending structure could vary significantly depending on its ability to pay,
the households in the survey were placed in three mutually exclusive strata based on their total
pre-tax annual income. As mentioned in section 3.6.3 of this report, the 448 households in the
survey were placed at three income levels using a low income measure (LIM).
The next figure shows the spending structure of the surveyed households by income level, for
each of the eight components of goods and services that reflect their consumer patterns.
This figure shows clearly that Nunavimmiut low-income households spend more of their budget
on food than medium-income and high-income households. While 43.3% of the total spending of
low-income households is on food, the percentage drops to 36.6% for medium-income
households and 30.5% for high-income households.
Similarly, low-income households also devote more of their budget to shelter, which represents
27% of their spending, compared to 22.3% and 22.1% for medium-income households and high-
income households, respectively. Combined spending on food and shelter accounts for 70.3% of
the budget of low-income households, compared to 58.9% for medium-income households and
52.6% for high-income households.
For transportation, the spending structure of the households in the survey shows that high-income
households spend the largest percentage of their total budget on transportation, at 25.2%,
compared to 14.1% for medium-income households and only 1.1% for low-income households.
Although transportation is the smallest item in terms of its relative weight in the spending
structure of low-income households, it is the second largest item, ranking even above shelter, in
terms of its relative weight in the spending structure of high-income households.
Alcoholic beverages and tobacco products represent 11% of the spending of low-income
households, compared to 10.2% for medium-income households and 6.9% for high-income
households. While ranked third in terms relative weight in the spending structure of low-income
households, alcoholic beverages and tobacco products rank fourth and fifth for medium-income
households and high-income households, respectively.
The spending structure of the households surveyed shows that, regardless of income level,
household operations and furnishings rank up roughly the same percentage of the budget of all
Nunavimmiut households: 8.5% of total reported spending for low-income households, 8.6% for
medium-income households, and 8.2% for high-income households.
Clothing and footwear represent 3.6% of total reported spending for low-income households,
compared to 3.7% for medium-income households and 2.8% for high-income households.
Health and personal care accounts for 3.8% of total reported spending for low-income
households, 2.6% for medium-income households, and 1.6% for high-income households.
Last, with respect to recreation, education and reading, the spending structure of the households
in the survey shows that it is high-income households that devote the highest percentage of their
budget to this item, which represents 2.8% of total spending for high-income households,
compared to 1.9% for medium-income households, and 1.8% for low-income households.

14 J. ROBITAILLE, E. GUÉNARD AND G. DUHAIME, 2016
Figure 4. Spending structure for households in the survey by income level, Nunavik, 2015-
2016
1 5
2 6
3 7
4 8Alcoholic beverages and tobacco products Recreation, education and reading
Food Household operations, furnishings and equipment
Shelter Clothing and footwear
Transportation Health and personal care
1.8%
1.9%
2.8%
3.8%
2.6%
1.6%
3.6%
3.7%
2.8%
8.5%
8.6%
8.2%
11.0%
10.2%
6.9%
1.1%
14.1%
25.2%
27.0%
22.3%
22.1%
43.3%
36.6%
30.5%
0% 10% 20% 30% 40% 50%
Percentage of total expenditure
Medium income
Lowincome
High income
Income levelIncome level
(3)
(4)
(2)
(1)
(7)
(8)
(6)
(5)
(3)
(4)
(2)
(1)
(7)
(8)
(6)
(5)
(3)
(4)
(2)
(1)
(7)
(8)
(6)
(5)

THE COST OF LIVING IN NUNAVIK: RESEARCH REPORT 15
4.3 Comparative cost of living index and sub-indexes for each of the eight components for
all households in the survey
The comparative cost of living index for Nunavik is 113.1 points, reflecting the fact that, in
general and considering the specific spending structure of the Nunavimmiuts, it costs 13.1% more
to live in Nunavik than in Québec City. The breakdown of sub-indexes by component in Figure 5
provides more detail.
Figure 5. Cost of living index in Nunavik by spending component, Nunavik, 2015-2016
16 J. ROBITAILLE, E. GUÉNARD AND G. DUHAIME, 2016
More specifically, looking at the sub-indexes for each spending component in the CCLIN, it is
clear that
it costs 48.3% more to live in Nunavik in terms of spending on food;
the costs associated with shelter, mainly rent, are 27.7% lower than in Québec City. This
result is closely linked to the methodological choices inherent in the calculation of the
sub-index for the shelter component;
transportation costs are 17.3% higher in Nunavik. Spending on plane tickets or vehicles
(snowmobiles, ATVs) accounts for a large percentage of reported spending in this
component. Given similar prices in Québec City for this component, the sub-index is
close to 100. More sophisticated analysis at a later date could highlight the goods and
services in the transportation component for which the price differential is the greatest;
the consumption of goods in the alcoholic beverages and tobacco products component
costs 37.3% more in Nunavik than in Québec City. Spending on alcoholic beverages was
reported mainly in the community de Kuujjuaq, since this is where the beverages are
most available;
goods and services in the component of household operations and furnishings are 42.6%
more expensive in Nunavik than in the South;
clothing and footwear are 14.7% more expensive than in the South;
Nunavimmiut households pay 23.9% more for health and personal care;
goods and services in the recreation, education and reading component are, on average,
32.1% more expensive than in Québec City.
The availability of data and certain methodological choices had a significant impact on the results
for some sub-indexes. A short explanation of the process used to construct the indexes will make
it easier to understand the results and the nuances that must be introduced to transpose the price
differences observed into the socio-economic context in Nunavik. The construction of the
comparative cost of living index for Nunavik took place in several stages. The main phases were
as follows:
1- Identify the consumer profile of households living in Nunavik (7,008 separate goods and
services);
2- Characterize and document each expenditure reported in Nunavik in order to identify
what it would cost to purchase the same goods and services in Québec City;
3- Place all reported spending in eight components, and define the spending structure of
Nunavimmiuts by component;
4- Identify the price in Québec City of as many goods and services as possible reported by
the surveyed households (the price was identified for 3,682 goods and services,
representing 81.6% of total reported spending);
5- Calculate the sub-indexes for each component in the cost of living;
6- Calculate a CCLIN which takes into account the true actual spending structure reported
by all the households surveyed.
The last stage made it possible to calculate the ratio of spending at Nunavik prices compared to
Québec City prices for each component, based on the true actual spending structure reported
(7,008 separate goods and services), rather than the ratio for all the 3,682 goods and services for
which the prices were identified in businesses in the South. This apparently anodyne detail
guarantees a far more faithful depiction of the economic reality facing Nunavimmiut households.

THE COST OF LIVING IN NUNAVIK: RESEARCH REPORT 17
More specifically, two components, household operations, furnishings and equipment and
clothing and footwear, for which 47.2% and 48.4% respectively of reported spending were linked
to a price identified at a Québec City business, have an underestimated relative weight, without
an adjustment, with respect to their actual impact on the overall cost of living. For example, the
telecommunications services in the household operations and furnishings component could not be
associated with an equivalent in Québec City, given that the technical information3 available for
each subscription package was, in all reported cases, imprecise and unreliable. As a result, the
expenditure could not be used to calculate the indexes. The same difficulty arose when
identifying the Québec City price for designer or popular brands of clothing. The databases
consulted and the product descriptions on the bills were examined, but to no avail—it was not
possible to identify the characteristics of each item with enough certainty and precision to locate
it at Québec City business.
The shelter component, with an index of 72.3, was the only element in the whole spending
structure with a negative price differential between Nunavik and Québec City. Obviously, the
methodological choices that determined the calculation of the index resulted from the quality,
quantity and reliability of the collected data available. The assistance received from the Kativik
Municipal Housing Bureau (KMHB), the organization that manages all social housing in
Nunavik, gave us privileged access to the rental rates set for each of the households surveyed. A
classification of the dwellings based on the number of rooms allowed a price comparison to be
made with data from the Canada Mortgage and Housing Corporation (CHMC), which closely
monitors the rental market in the Québec City census metropolitan area (CMA). By comparing
the average rental price of private units at the studio, one-room, two-room and three-or-more-
room level with the prices set by the KMHB for each type of dwelling in its residential buildings,
a comparative index was obtained for the shelter component. The average rental price for the
Québec City CMA was based on the data collected by CHMC4 for the rental market in the area as
a whole. By removing zones 2, 4, 8 and 9 from the rental market for the Québec City CMA, as
presented in Table 5, the research team was able to limit the geographic dispersion of its data
collection and, as a result, the bias created by the dispersion of the points of collection for the
price of the goods and services in the consumer profile.
3 For Internet services, the information concerned upload and download speeds (measured in megabits per
second) and available bandwidth (measured in gigabits) under an agreement between the household and the
service provider.
4 The data comes from CMHC's October 2015 Rental Market Survey.

18 J. ROBITAILLE, E. GUÉNARD AND G. DUHAIME, 2016
Table 5. Rental market used to identify the average price for each type of dwelling,
Nunavik, 2015-2016
Using the average rental price for dwellings in zone 1, 3, 5, 6 and 7, a total of 46,370 dwellings,
the price comparisons between dwellings in Nunavik and those in key zones in the Québec City
CMA generated an index for the shelter component which, taking into account the attenuation
measures for housing costs that are already in place, shows that housing in Nunavik costs 72.3%
of what it would cost for a comparable dwelling in Québec City.
4.3.1 Comparative cost of living indexes and sub-indexes for each of the eight cost of living
components, by income level
The comparative cost of living index for Nunavik varies slightly depending on the income level
of the households concerned and, more specifically, varies between high-income and medium-
income households. The index of 111.6 for high-income households is 4.5 points below the index
for medium-income households (116.1) and 1.2 points above the index for low-income
households (110.4). The differences between the indexes are explained mainly by the fact that the
percentage of total expenditure for each component varies, sometimes considerably, by income
level. As a result, the nature of the expenditure made and the price of the goods and services play
an important role in the calculation of the indexes.5
The transportation component in the CCLIN for high-income households has a high relative
weight (25.2%) and shows a low price differential, at 107. The expenditure reported by high-
income households was mainly plane tickets, for which the price in the South is very similar.
5 The purchase of a 24-foot canoe for $12,449.99 by one medium-income household, while the exact same
product could be bought in the South for $8,900.00, had a significant influence on the "transportation"
index for medium-income households. This one canoe represented 36.2% of the expenditure reported for
this component for the medium-income stratum.
Zones selected, Québec City CMA Studio 1 bedroom 2 bedrooms 3 bedrooms + Total
1-Basse-Ville de Québec, Vanier 1 333 5 158 9 501 2 215 18 207
3-Québec des Rivières, L'Anc.-Lorette 213 1 867 6 103 1 035 9 218
5-Val-Bélair, St-Émile, Loretteville and others 40 736 2 113 529 3 418
6-Charlesbourg, Stoneham and others 225 2 124 5 565 1 162 9 076
7-Beauport, Boischâtel, Île-d'Orléans and others 198 1 384 3 818 1 051 6 451
Total 46 370
Zones not selected, Québec City CMA Studios 1 bedroom 2 bedrooms 3 bedrooms + Total
2-Québec Haute-Ville 1 252 3 262 2 826 1 329 8 669
4-Ste-Foy, Sillery, C.-Rouge, St-Aug. 1 331 5 598 8 198 2 608 17 735
8-Charny, St-Romuald, St-Jean-Chr. and others 52 660 3 562 546 4 820
9-Lévis, Pintendre and others 173 1 061 3 320 663 5 217
Total 36 441
Québec City CMR 4 817 21 850 45 006 11 138 82 811
Number of dwellings
Rental market in the Québec City census metropolitan area, by zone
Number of dwellings
THE COST OF LIVING IN NUNAVIK: RESEARCH REPORT 19
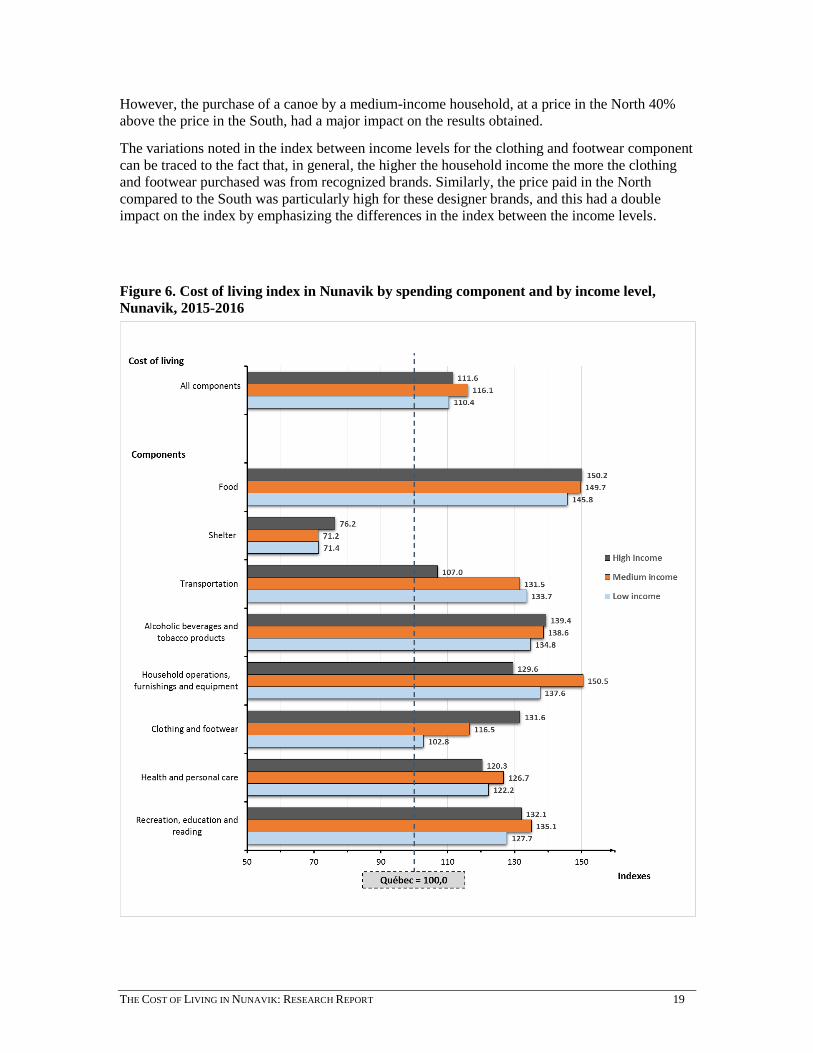
However, the purchase of a canoe by a medium-income household, at a price in the North 40%
above the price in the South, had a major impact on the results obtained.
The variations noted in the index between income levels for the clothing and footwear component
can be traced to the fact that, in general, the higher the household income the more the clothing
and footwear purchased was from recognized brands. Similarly, the price paid in the North
compared to the South was particularly high for these designer brands, and this had a double
impact on the index by emphasizing the differences in the index between the income levels.
Figure 6. Cost of living index in Nunavik by spending component and by income level,
Nunavik, 2015-2016

20 J. ROBITAILLE, E. GUÉNARD AND G. DUHAIME, 2016
4. Conclusion
The survey made it possible to establish the spending structure for households in Nunavik; major
differences were observed depending on the level of household income. The results of the survey
also made it possible to establish a comparative cost of living index for Nunavik, and separate
indexes for specific goods and services components. The indexes calculated separately for each
component showed that prices are always higher in Nunavik than in Québec City, except for
shelter. For example, a basket of groceries for which Nunavimmiut households pay $148 in
Nunavik would cost $100 in Québec City, and so on.
In addition, comparative indexes were calculated by household income level. These calculations
showed that the individual indexes for households with the lowest income were generally lower
than the individual indexes for households with the highest income. These results may reflect
consumer patterns that vary by income level. The households with the lowest income, which
already had to devote over 70% of their expenditure to the two items of food and shelter, are
apparently inclined to choose the least costly goods and services whenever possible.
Last, the results highlight the special place held by shelter in the spending structure, and the
downward pressure it places on the comparative cost of living index for Nunavik. Even though
shelter costs less in Nunavik than in Québec City, it still accounts for between 22.1% and 27.0%
of household expenditure.
5. DISCUSSION
The objective of this study was to evaluate the cost of living in Nunavik taking into account the
consumer patterns of households in the region, the price of goods and services, and the price
differences between Nunavik and southern Québec. For this purpose, we had to list as
exhaustively as possible the goods and services purchased by households, calculate the costs
based on the current price structure in Nunavik, and last evaluate the costs that would have been
paid under the current price structure in Québec City. The survey of 450 households over a period
of more than one year allowed us to meet to a rather large extent our objective.
Nevertheless, it is imperative to recall that, given the limits inherent to this study, results should
be interpreted with a certain note of caution. Further, although we have already discussed the
details of certain limits associated to the consumer profile captured by the survey (see Section
3.6.4), other limits actually exist. In fact, some of those other limits were identified when we
exposed the methodological choices we had to make, whereas others were not addressed
inasmuch as they arise from the very specificities which characterize Nunavik. Hence, because
the understanding of these limits is deemed essential for grasping the full extent of the research
results, we expose these limits here. First, the study relies on a probability sampling scheme
which involves a margin of error. Consequently, results cannot be considered as 100% exact;
however, they give us very sound orders of magnitude regarding the phenomenon of interest.
Second, the household income measure rests upon a procedure which asked respondents to report
their total household’s yearly pre-tax income within a simple interval. Although this income
measure should be considered as rudimentary, it was favoured by the technical research comity
since it not only allowed us to avoid the intrusive nature of more precise measurement
procedures, but it also helped respondents to canalize their main efforts on appropriately detailing
the spending of their household members. Moreover, this rudimentary measure of income was
judged sensible enough to enable the grouping of all sampled households into three gross
economic strata (i.e., low, medium, and high income households). In an attempt to validate

THE COST OF LIVING IN NUNAVIK: RESEARCH REPORT 21
reported household incomes, when possible, comparisons were made with KMHB data. Third,
the low income measures we used (i.e., LIM-75 and LIM-200) for the grouping of the surveyed
households into the three economic strata rely on reasoned explicit decisions; inasmuch as other
decisions could have led to different results. Finally, some characteristics that are specific to
households’ consumption in Nunavik must be kept in mind when expenditure shares for each
component are interpreted or compared to Québec. For instance, one must recall that, in Nunavik,
a portion of the food component is freely obtained via the community freezer and the traditional
customary sharing of country food. Although we did not try to assess this portion of the food
component, it is an important particularity which, without a doubt, impacts on the expenditure
share devoted to this component. In the same order of ideas, the expenditure share associated
which health care differs in Nunavik, in part because some services are freely dispensed whereas
this is not the case in Québec. Expenditure shares related to transportation also show important
difference compared to Quebec. Here, given the lack of a regional road network, nunavimmiuts
must fly by plane to commute from one community to another. Thus, all these specificities that
characterized Nunavik must be taken into account when interpreting the results of this research.
The same considerations must be fully integrated into the making of programs which aim to
reduce the cost of living in Nunavik.
Despite these different limits, the results of this study must be taken as reliable and valid. They
confirm that the cost of living in Nunavik is significantly higher than in Québec City, which had
already been revealed by various studies on consumer prices in Nunavik conducted periodically
over the last fifteen years. However, our study was not simply a price comparison, but a
comparison that took into account actual household consumption. This is a key difference, since it
illustrates the real effect of price differences on household expenditure.
However, the results also raise important questions concerning any attempt to intervene to reduce
the price gap between Nunavik and Québec City. For example, should measures be introduced to
reduce the price of all goods and services, or those with the largest price differential (such as
food, or household operations, furnishings and equipment), with or without consideration for the
volume of consumption? The question is even more relevant given the differences observed
despite cost-of-living reduction measures that are already implemented in the region. All the signs
indicate that these measures are insufficient to eliminate the differences.
Should such measures be universal, or should they target the households with the lowest incomes,
which are forced to devote most of their budget to food and housing? Any intervention targeting
low-income households would have to be studied in depth. To be effective, it would have to be
carefully calibrated and take into account the day-to-day realities of poverty in Nunavik. The
results obtained tend to show that low-income households do not consume in the same way as
other households, probably because they have no choice. From this point of view, broad-based
intervention could have little actual impact on the high cost of living these households must face.
Last, what should be done about social housing? The results show that social housing currently
has the effect of a cost-of-living reduction measure. The plans to increase the revenue generated
by the social housing stock may run counter to the effort made to reduce price differences
between Nunavik and the rest of Québec, and may denature the underlying vocation of social
policy.
A more in-depth examination of the data collected during the cost of living survey in Nunavik
could provide input for a debate on these questions, which appear to us to be essential. The
database we constructed is unique and extremely detailed, and could be used for more advanced
analysis on specific subjects. For example, we could measure, a posteriori, the actual impact of
the cost-of-living reduction measures in effect during the survey period. In addition, further
investigations could periodically update the indexes created and published here, creating a key

22 J. ROBITAILLE, E. GUÉNARD AND G. DUHAIME, 2016
tool to study the potential impact of any planned measure. For example, it would be possible to
calculate new indexes, taking into account potential price reductions for certain goods and
services, or the funding needed to reduce the price differences to a target threshold that is
considered acceptable. Last, the tool could be used to monitor the actual impact of cost-of-living
reduction measures that the sponsors of this research plan to adopt once the current discussions
have been completed. This would represent a significant step forward compared to previous
programs, for which the actual impact on household budgets remains unknown.

THE COST OF LIVING IN NUNAVIK: RESEARCH REPORT 23
References
Bureau international du travail (2004). Consumer price index manual: theory and practice.
Geneva: International Labour Office.
Duhaime, G. et A. Caron (2013). Suivi des prix à la consommation au Nunavik 2011-2013,
Chaire de recherche du Canada sur la condition autochtone comparée, Université Laval,
Québec, 17 p.
Duhaime, G., Lévesque S. et A. Caron (2015). Nunavik in figures 2015 – Full version. Chaire de
recherche du Canada sur la condition autochtone comparée, Université Laval, Québec,
133 p.
Duhaime, G. et R. Édouard (2012). Mesures et taux de faible revenu dans l’Inuit Nunangat. Note
de recherche, Université Laval, Québec, 20 p.
Paquet, B. (2009). Les seuils de faible revenu de 1992 à 2001 et Les mesures de faible revenu de
1991 à 2000. Statistique Canada, Ottawa : Division de la statistique du revenu, no
75F0002MIF2002005 au catalogue, 58 p.

24 J. ROBITAILLE, E. GUÉNARD AND G. DUHAIME, 2016
List of appendices
Appendix 1. Consent form
Appendix 2. Questionnaire-interview
Appendix 3. Diary of daily expenses
Appendix 4. Guide for filling out the diary of daily expenses
Appendix 5. Informative poster of the cost-of-living survey (French)
Appendix 6. Informative poster of the cost-of-living survey (English)
Appendix 7. Informative poster of the cost-of-living survey (Inuktitut)
Appendix 8. Low income measures (LIM) by household’s size and composition,
Nunavik, 2015-2016

Initials _____
Appendix 1. Consent form
CONSENT FORM
COST-OF-LIVING SURVEY IN NUNAVIK
Presentation This study is under the direction of Gérard Duhaime, professor at the Faculty of Social Sciences, Department of Sociology, Université Laval. Before you agree to take part in this study, please take the time to read and understand the following information. This document explains the purpose of this study, as well as its procedures, benefits, risks and inconveniences. We invite you to ask the person presenting you this document any questions that you consider useful. The Survey The goal of this study is to evaluate the cost of living in Nunavik by taking into account the consumption habits of the residents of the region, the prices of goods and services, and the price differences between Nunavik and southern Québec. Your Participation By participating to this research project, you voluntarily agree to:
Meet with your assigned KRG field representative. You shall expect to meet your field representative 4 times during the two weeks your household is being surveyed. Whereas the first meeting with your field representative would normally take about one hour of your time, the three other meetings would be shorter (i.e., between 15 and 30 minutes each meeting) inasmuch as the purpose of these meetings is mainly to assist you in the process of recording the daily expenses of your household members in the two-week diary.
Complete a short questionnaire-interview about your household composition, housing
arrangement, and overall household income. This questionnaire-interview is to be completed during the first meeting with your field representative, and shall take approximately 30 minutes. Another 30 minutes would be used to instruct you on how to suitably record your household daily expenses in the two-week diary.
Record daily expenditures of your household for two weeks (i.e., 14 days) in a diary form, and provide detailed receipts or other purchase records of these expenses. This should take few minutes each day.
Benefits, Risks and Potential Inconveniences Related To Your Participation

Initials _____
By taking part in this study, you will help us to better document the cost of living in Nunavik. Your participation will contribute to improve knowledge about the cost of living in Nunavik. With this knowledge, regional authorities intend to come to a permanent agreement with the Government of Québec to reduce the cost of living in Nunavik. In other words, one main benefit of your participation is to take part in the effort to improve the economic situation of Nunavik residents. You will receive an incentive payment of $100 to cover any inconvenience which could be associated with your participation in this study. Other than the time you devote to the survey, one disadvantage could be that recording your everyday expenditures may cause some tension in your household. If anything of that nature occurs and causes you concern, if you are willing to discuss it with your field representative, under the strictest confidentiality, she/he could help you find assistance from appropriate resources. Voluntary Participation and Right to Withdraw You are free to choose whether or not to participate in this study. You can also withdraw from the project without prejudice and without having to justify your decision. If you decide to end your participation, you must notify the interviewer whose contact information is included in this document. In that event, all your personal information will be destroyed. Privacy and Data Management The following measures will be implemented to ensure the confidentiality of the information provided by the participants:
The names of the participants will not be included in any reports.
All the documents will be codified, and only the researchers will have access to the personal information.
The data will be included in a database, with the exception of all the information that may allow the identification of persons and households.
The data will be used for scientific publications, but the participants will never be identifiable in any way.
Individual participant data will never be disclosed.
Even though the KRG is involved in this study, your participation will have no impact on the services you receive or may receive from the KRG.
Research material will be kept under lock and key and destroyed on May 2016. The database will be kept under lock and key, and will be kept for further analysis. It
will ultimately be destroyed by May 2020.

Initials _____
Acknowledgments Your collaboration is essential to us and we thank you for your participation. Signatures I, the undersigned, ______________________________ freely consent to participate in this study entitled "Cost-of-Living Survey in Nunavik". I have read the form and I understand the purpose, nature, benefits, risks and inconveniences of this research project. I am satisfied with the explanations, clarifications and answers that the interviewer has provided me regarding my potential participation in this project. __________________________________________ ________________________ Participant’s signature Date I explained the purpose, nature, benefits, risks and inconveniences of the study to the participant. I answered the participant’s questions to the best of my knowledge and made sure that the participant understands. __________________________________________ _______________________ Interviewer’s signature Date Additional Information If you have any questions about the study and your participation, or if you want to withdraw from the study, please contact [interviewer’s name and contact information]: Complaints or Comments Any complaint or comment about this research project should be sent to the Office of the Ombudsman of Université Laval: Pavillon Alphonse-Desjardins, bureau 3320 2325, rue de l’Université Université Laval Québec (Québec) G1V 0A6 Information - Secretariat: (418) 656-3081 Toll-free number: 1-866-323-2271 E-mail: [email protected]
Participant’s Copy


A
pp
end
ix 2
. Q
ues
tio
nn
air
e-i
nte
rvie
w
Cost
-of-
livi
ng S
urv
ey i
n N
un
avi
k
Qu
esti
on
nair
e-In
terv
iew
(HO
US
EH
OL
D C
OM
PO
SIT
ION
, H
OU
SIN
G A
RR
AN
GE
ME
NT
AN
D I
NC
OM
E)
Inte
rvie
w D
ate
H
OU
SE
NU
MB
ER
DD
M
M
1.
Res
pon
den
t’s
nam
e
______________________________________
2.
Tel
eph
on
e n
um
ber
______________________________________
3.
Com
mu
nit
y/V
illa
ge
Sal
luit
Um
iuja
q
P
uvir
nit
uq
Tas
iuja
q
K
uujj
uaq
Kan
giq
sual
ujj
uaq

Nam
e
(Fir
st
na
me,
last
na
me
Years
old
Less
than
1
year
Do
n't
kn
ow
Spouse
Parent
Child
Foster
child
Grand
child
Other
relative
Other
Fem
ale
(
)Y
es
( )
Male
( )
No
( )
Fem
ale
( )
Yes
( )
Male
( )
No
( )
Fem
ale
(
)Y
es
( )
Male
( )
No
( )
Fem
ale
( )
Yes
( )
Male
( )
No
( )
Fem
ale
(
)Y
es
( )
Male
( )
No
( )
Fem
ale
( )
Yes
( )
Male
( )
No
( )
Fem
ale
(
)Y
es
( )
Male
( )
No
( )
Fem
ale
( )
Yes
( )
Male
( )
No
( )
Fem
ale
(
)Y
es
( )
Male
( )
No
( )
Fem
ale
( )
Yes
( )
Male
( )
No
( )
Fem
ale
(
)Y
es
( )
Male
( )
No
( )
Fem
ale
( )
Yes
( )
Male
( )
No
( )
Fem
ale
(
)Y
es
( )
Male
( )
No
( )
Fem
ale
( )
Yes
( )
Male
( )
No
( )
Fem
ale
(
)Y
es
( )
Male
( )
No
( )
Fem
ale
( )
Yes
( )
Male
( )
No
( )
Fem
ale
(
)Y
es
( )
Male
( )
No
( )
Fem
ale
( )
Yes
( )
Male
( )
No
( )
2
( )
1_____
3
( )
( )
( )
( )
RE
SP
ON
DE
NT
( )
( )
( )
( )
5(
)(
)(
)(
)
4
( )
( )
( )
( )
( )
( )
( )
( )
( )
( )
( )
6
( )
( )
( )
( )
( )
( )
( )
( )
( )
( )
( )
( )
( )
( )
97
( )
( )
( )
( )
( )
( )
8 11
( )
( )
( )
( )
10
( )
( )
( )
( )
( )
( )
( )
( )
13
( )
( )
( )
( )
( )
( )
12
( )
( )
( )
( )
( )
( )
( )
( )
14
( )
( )
16
15
( )
( )
( )
( )
( )
( )
( )
( )
( )
( )
( )
( )
( )
( )
( )
18
( )
( )
( )
( )
( )
( )
17
( )
( )
( )
( )
( )
( )
( )
( )
( )
( )
_____
_____
( )
( )
( )
( )
( )
Ho
w i
s t
his
perso
n r
ela
ted
to
th
e
resp
on
den
t ?
Is t
his
perso
n
a J
BN
QA
ben
efi
cia
ry
?
( )
( )
( )
( )
( )
( )
( )
( )
( )
( )
( )
_____
Age
( )
( )
( )
( )
( )
( )
_____
Perso
n
Gen
der
Ch
eck
(√
)
_____
_____
_____
_____
_____
_____
_____
_____
_____
_____
_____
_____
_____
( )
( )
( )
( )
( )
( )
( )
( )
( )
( )
( )
( )
( )
( )
( )
( )
( )
( )
( )
( )
( )
( )
( )
( )
( )
( )
( )
( )
( )
( )

1
.
( )
( )
( )
( )
( )
( )
( )
( )
( )
( )
( )
( )
2.
( )
( )
( )
( )
3.
Co
mm
en
ts
$1
80
,00
0 a
nd o
ver
Refu
sed
Do
no
t k
now
Wh
at
is y
ou
r b
est
est
ima
te o
f y
ou
r H
OU
SE
HO
LD
’S t
ota
l
inco
me f
rom
all
so
urc
es
befo
re t
ax
es
an
d d
ed
ucti
on
s
du
rin
g t
he l
ast
yea
r?
Less
than
$2
0,0
00
$2
0,0
00
to
$3
9,9
99
$4
0,0
00
to
$5
9,9
99
$6
0,0
00
to
$7
9,9
99
Pri
vate
ho
use
Oth
er
Ho
w m
an
y b
ed
roo
ms
in y
ou
r d
well
ing
?
_________
Bedro
om
(s)
$8
0,0
00
to
$9
9,9
99
Em
plo
yer
ho
use
$1
00
,00
0 t
o $
11
9,9
99
$1
20
,00
0 t
o $
13
9,9
99
$1
40
,00
0 t
o $
15
9,9
99
$1
60
,00
0 t
o $
17
9,9
99
Yo
ur
ho
use
is:
KM
HB
ho
use


Appendix 3. Diary of daily expenses
Your Daily Expenses Help us learn about the buying habits of people in Nunavik.
When you write down how you spend money in this diary, you will help
us understand more about the products and services that are bought by the
people in Nunavik.
I will return on: First meeting _______________________
Second meeting _______________________
Third meeting _______________________
Last meeting _______________________
If you have any questions, please call: Field representative’s name: Telephone:
Field representative supervisor’s name: Telephone:
Diary Start Date Diary End date HOUSE NUMBER
DD MM DD MM
1. Respondent’s name
______________________________________
2. Telephone number
______________________________________
3. Community/Village
Salluit Umiujaq Puvirnituq
Tasiujaq Kuujjuaq Kangiqsualujjuaq
Section 1 Expenses for which you CAN provide detailed receipts or
other purchase records

dd/mm
$ . ¢
/ .
/ .
/ .
/ .
/ .
/ .
/ .
/ .
/ .
/ .
/ .
/ .
/ .
/ .
/ .
/ .
/ .
/ .
/ .
/ .
/ .
/ .
/ .
/ .
/ .
/ .
/ .
/ .
/ .
/ .
Section 1:Expenses for which you CAN provide detailed receipts or other
purchase records
Date of
expense
SHORT/GENERAL DESCRIPTION OF THE EXPENSE
Description of the expense
Rec
eip
t #
Cost
Write ONLY ONE expense per line. Total amount
on the receipt,
invoice or bill(See the Diary Guide for help with this section.)
Example
(15/03)

Section 2 Expenses for which you CANNOT provide detailed receipts
or other purchase records

BR
AN
D
NA
ME
MO
DE
L
NU
MB
ER
SIZ
E O
R
QU
AN
TIT
Y
dd/m
m(i
f re
leva
nt)
(if
rele
va
nt)
(if
rele
va
nt)
$¢
1/
Yes
No
.
2/
Yes
No
.
3/
Yes
No
.
4/
Yes
No
.
5/
Yes
No
.
6/
Yes
No
.
7/
Yes
No
.
8/
Yes
No
.
9/
Yes
No
.
10
/Y
es
No
.
11
/Y
es
No
.
12
/Y
es
No
.
13
/Y
es
No
.
14
/Y
es
No
.
15
/Y
es
No
.
16
/Y
es
No
.
17
/Y
es
No
.
18
/Y
es
No
.
19
/Y
es
No
.
20
/Y
es
No
.
Sec
tion
2:
Exp
en
ses
for
wh
ich
yo
u C
AN
NO
T p
rovid
e d
eta
iled
receip
ts o
r o
ther
pu
rch
ase
reco
rds
Item #
Date
of
exp
en
se
Desc
rip
tio
n o
f th
e ite
m p
urc
ha
sed
Co
st o
f it
em
Wri
te O
NL
Y O
NE
ite
m p
er
line.
(See
the
Dia
ry G
uid
e fo
r hel
p w
ith t
his
sec
tion.)
DE
TA
ILE
D D
ES
CR
IPT
ION
OF
TH
E I
TE
M P
UR
CH
AS
ED
BO
UG
HT
IN
NU
NA
VIK
?
Do
no
t
inclu
de t
axes
(Cir
cle
)

Sec
tio
n 3
F
OR
OF
FIC
E U
SE
ON
LY
PL
EA
SE
DO
NO
T W
RIT
E O
N T
HE
NE
XT
PA
GE
S

6
1.
1.
Yes
2.
No
3.
So
met
imes
4.
Mad
e at
lea
st o
ne
pu
rch
ase
ever
y d
ay
2.
1.Y
es –
go
to
#3
2.
No
– g
o t
o #
4
3.
Da
teB
RA
ND
NA
ME
MO
DE
L
NU
MB
ER
SIZ
E O
R
QU
AN
TIT
Y
(dd
/mm
)(i
f rele
van
t)(i
f rele
van
t)(i
f rele
van
t)$
¢
1.
/Y
es
No
.
2.
/Y
es
No
.
3.
/Y
es
No
.
4.
/Y
es
No
.
5.
/Y
es
No
.
6.
/Y
es
No
.
7.
/Y
es
No
.
8.
/Y
es
No
.
9.
/Y
es
No
.
10.
/Y
es
No
.
Did
yo
u w
rit
e “
no
sp
en
din
g”
in
th
e d
iary f
or t
he d
ays
wit
h n
o s
pen
din
g f
or a
ll m
em
bers
of
yo
ur h
ou
seh
old
?
DE
TA
ILE
D D
ES
CR
IPT
ION
OF
TH
E I
TE
M P
UR
CH
AS
ED
FO
R O
FF
ICE
US
E O
NL
Y
PL
EA
SE
DO
NO
T W
RIT
E O
N T
HIS
PA
GE
Y
ou
r a
ssig
ned
fie
ld r
ep
rese
nta
tive w
ill
ask
yo
u t
he q
uest
ion
s o
n t
his
pag
e w
hen
he/s
he r
etu
rn
s
to
pic
k u
p t
his
Dia
ry o
f D
ail
y E
xp
en
ses.
Co
st
Ple
ase
lis
t th
e it
ems
that
ha
ve
bee
n m
isse
d.
Inte
rvie
wer
: E
nte
r th
e d
escr
ipti
on
use
d b
y t
he
resp
on
den
t.
So
me
exp
ense
s su
ch a
s g
as
an
d o
ther
rel
ate
d v
ehic
le c
ost
s, l
ott
ery
tic
ket
s, c
igare
ttes
an
d n
ewsp
ap
ers,
mea
ls a
nd
bev
era
ges
bo
ug
ht
ou
tsid
e
yo
ur
ho
me,
lei
sure
act
ivit
ies,
or
ha
ir s
alo
n a
nd
po
sta
l se
rvic
es a
re e
asi
ly f
org
ott
en.
Did
yo
u o
r a
ny m
emb
er o
f y
ou
r h
ou
seh
old
, fo
rget
to
reco
rd a
ny o
f th
ese
exp
ense
s, o
r a
ny o
ther
ex
pen
se,
in t
he
dia
ry?
BO
UG
HT
IN
NU
NA
VIK
?
(Cir
cle
)

4.
1.
Yes
– g
o t
o #
52.
No –
Thank y
ou f
or
part
icip
ating in t
his
surv
ey
5.
Inte
rvie
wer:
Wri
te d
ow
n t
he n
am
es,
th
e d
ura
tio
n a
nd
th
e r
easo
n w
hy t
hey w
ere
aw
ay f
rom
ho
me
Du
rati
on
(d
ays)
1.
2.
3.
4.
5.
6.
7.
8.
Du
rin
g t
he 1
4 d
ays
wh
en
yo
u w
ere
reco
rdin
g y
ou
r p
urc
hase
s in
th
e d
iary
, w
ere
an
y m
em
ber
of
yo
ur
ho
use
ho
ld a
way f
rom
ho
me ?
Wh
ose
mem
ber(
s) o
f yo
ur
ho
use
ho
ld w
ere
aw
ay f
rom
ho
me d
uri
ng t
ho
se t
wo
week
s?
Ho
w l
on
g? A
nd
wh
y?
Nam
eR
easo
n w
hy t
his
mem
ber
was
aw
ay f
rom
ho
me
Appendix 4. Guide for filling out the diary of daily expenses
Cost-of-Living Survey in Nunavik
Diary Guide (for filling out the Diary of Daily Expenses)


Table of Contents Overview ……….………….………………….…………………………………………………………..........1
What is the diary? ……………………………………………………………………………………....1 Purpose of the diary …................................................................................................................1 Important tips for using the diary and saving time while filling it out ..……..……………………..2
How to record expenses of your household in the diary …………………………………...…….…...3
SECTION 1: Expenses for which you CAN provide detailed receipts or other purchase records ….......3
SECTION 2: Expenses for which you CANNOT provide detailed receipts or other purchase records ...4
What to do for days with no spending? ……………………………………………………………………..…4
Recording expenses in SECTION 1 of the diary ………………………………………………………...5
Examples of how to record expenses in SECTION 1 of the diary…………………………………6
Recording expenses in SECTION 2 of the diary. …………...………………...…………………………7
Examples of how to record expenses in SECTION 2 of the diary .………..…………………….. 8
General notes on what to include as household expenses and what to leave out..……………... 9
Important notes…………………………………….………….……………………………………………..10

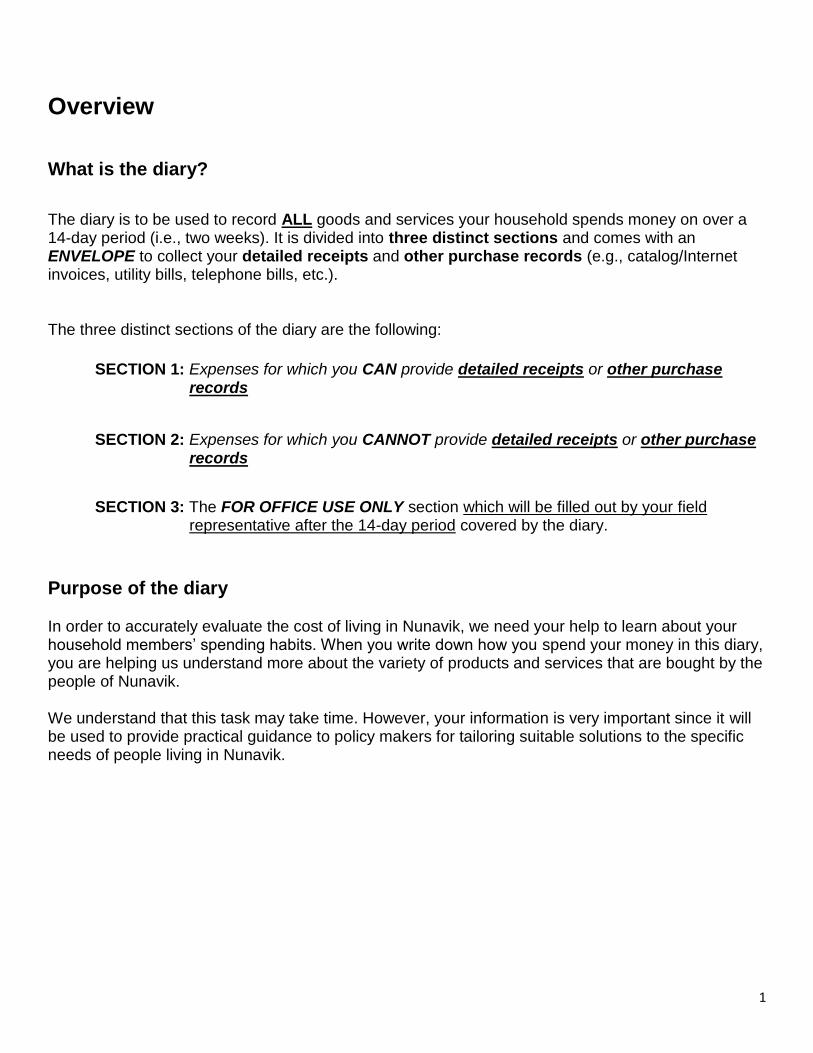
1
Overview
What is the diary?
The diary is to be used to record ALL goods and services your household spends money on over a 14-day period (i.e., two weeks). It is divided into three distinct sections and comes with an ENVELOPE to collect your detailed receipts and other purchase records (e.g., catalog/Internet invoices, utility bills, telephone bills, etc.). The three distinct sections of the diary are the following:
SECTION 1: Expenses for which you CAN provide detailed receipts or other purchase
records
SECTION 2: Expenses for which you CANNOT provide detailed receipts or other purchase
records
SECTION 3: The FOR OFFICE USE ONLY section which will be filled out by your field
representative after the 14-day period covered by the diary. Purpose of the diary
In order to accurately evaluate the cost of living in Nunavik, we need your help to learn about your household members’ spending habits. When you write down how you spend your money in this diary, you are helping us understand more about the variety of products and services that are bought by the people of Nunavik. We understand that this task may take time. However, your information is very important since it will be used to provide practical guidance to policy makers for tailoring suitable solutions to the specific needs of people living in Nunavik.

2
Important tips for using the diary and saving time while filling it out
1) Keep the diary journal and this guide handy so that you remember to enter items and amounts as your household members are making purchases. It is faster to record the goods and services your household has spent money on daily rather than trying to recall items and amounts after longer periods of time, especially casual purchases for which you may not have a detailed receipt.
2) Ask your household members to GET DETAILED RECEIPTS of their various
purchases. In order to accurately assess the cost of living of Nunavik households, we need accurate information about the expenses of your household members. This is why it is essential for us to get copies of your detailed receipts and other purchase records (e.g., catalog/Internet invoices, utility bills, telephone bills, cable bills, Internet bills, etc.).
3) Talk to the people of your household every day to find out how they spent their
money, and do not forget to remind them to get detailed receipts of their purchases.
Include payments of goods and services made by:
Cash
Check
Debit card
Credit card
Store Charge card
Gift certificate
Money order

3
How to record expenses of your household in the diary
The appropriate way for recording your household expenses in the diary depends on whether or not you can provide detailed receipts or other purchase records (e.g., catalog/Internet invoices, utility bills, telephone, cable and Internet bills, etc.) for your purchases.
SECTION 1: Expenses for which you CAN provide detailed receipts or other purchase records
For each of the expenses where you CAN provide a detailed receipt (or a copy of it), you will need to record:
1) The date of the expense in the diary.
2) A short general description of the expense.
3) A receipt number.***
4) The total amount paid.
*** VERY IMPORTANT: Note that receipt numbers to be recorded in the diary are
sequential numbers (e.g., 1, 2, 3, etc.) which YOU will write on each receipt or any other purchase record you provide.
The only information we need from your detailed receipts is the item(s) description(s), the price(s) of purchased item(s), the place and date of purchase, and your hand-written sequential number which matches the sequential receipt number you recorded in the diary. All detailed receipts and other purchase records you submit will be destroyed in a manner that fully complies with our Confidentiality Policy as soon as the relevant expense information has been recorded. Please feel free to ask your assigned field representative to make photocopies of your original receipts for those purchased items on which warranties might apply.

4
SECTION 2: Expenses for which you CANNOT provide detailed receipts or other purchase records
For each of the expenses where you CANNOT provide a detailed receipt, you will need to record:
1) The date of the expense in the diary.
2) A detailed description of EACH item purchased, including brand name, model number, size or quantity when this information is deemed relevant.***
3) Whether each item was bought in Nunavik or not.
4) The cost, before taxes, of each item purchased.
*** VERY IMPORTANT: Note that when you cannot provide a detailed receipt or any other purchase record for a particular expense, we absolutely need a detailed description of the item(s) bought. The item description you provide in the diary should be detailed in a way that will allow us to know EXACTLY what has been purchased.
What to do for days with no spending? If no one in your household had any spending on a given day, write the date and the words "no spending" in SECTION 1.

5
Recording expenses for which you have detailed receipts or other purchase records in SECTION 1 of the diary
Date of expense
Always include the date, using two digits for each day and month.
Short/general description of the expense
Write ONLY one short/general description of the expense per line. Record ALL purchases of goods and services, including food and beverages purchased from stores as well as meals, snacks and
drinks purchased from restaurants, fast-food outlets, and bars.
Receipt number
Write the number of the receipt (or other purchase record) which matches the sequential number you wrote on the cash register receipt (or other purchase record) you provide. Do not forget to insert your detailed receipts and other purchase records in the envelope that comes with the diary.
Cost
Record the total amount indicated on the receipt, invoice or bill.

6
EXAMPLES of how to record expenses for which you HAVE detailed receipts or
other purchase records in SECTION 1 of the diary
dd/mm
$ . ¢
02/01 1 28 . 32
02/01 2 180 . 79
02/01 3 70 . 00
02/01 4 201 . 83
03/01 5 8 . 16
04/01 .
05/01 6 51 . 23
05/01 7 79 . 28
05/01 8 111 . 64
06/01 .
07/01 9 211 . 70
08/01 .
09/01 10 318 . 44
09/01 11 30 . 00
10/01 12 28 . 11
10/01 13 40 . 00
10/01 14 67 . 91
11/01 15 39 . 34
11/01 16 180 . 00
12/01 17 74 . 65
12/01 18 28 . 03
12/01 19 17 . 80
13/01 .
Groceries
Men's Mitts - Hunter Support
Hockey Equipment
House stuffs
Example
(15/03) SHORT/GENERAL DESCRIPTION OF THE EXPENSE
(See the Diary Guide for help with this section.)
Section 1:
Write ONLY ONE expense per line. Total amount
on the receipt,
invoice or bill
Date of
expense
Description of the expense
Rec
eip
t #
Cost
Expenses for which you CAN provide detailed receipts or other
purchase records
Groceries
Cigarettes
*** NO SPENDING ***
Groceries
Baby diapers
Gas for skidoo
Telephone Bill - (e-bill)
Sewing materials
One month daycare - Coop
*** NO SPENDING ***
Beer, cigarettes and wine - Marché Turenne inc.
Fox Fur - Hunter support
*** NO SPENDING ***
Clothing - Northern
Candy - pop
*** NO SPENDING ***
Household furniture
4 meals + soft drink - Restaurant
Groceries & lotteries

7
Recording expenses for which you do not have detailed receipts or other purchase records in SECTION 2 of the diary
Date of expense
Always include the date, using two digits for each day and month.
Detailed description of the item purchased
Write a detailed description of EACH item purchased. Record only one item per line. Any purchase of goods and services, including food and beverages purchased from stores as well as meals, snacks and drinks purchased from restaurants, fast-food outlets and bars for which you cannot provide detailed receipts should be detailed in this section. The item description you provide should be detailed in a way that will allow us to know EXACTLY what has been purchased.
Brand name (if relevant)
When relevant, write the brand name of the purchased item.
Model number (if relevant)
When relevant, write the model number of the purchased item.
Size or quantity (if relevant)
When relevant, write the size or the quantity of the purchased item.
Bought in Nunavik?
For each item recorded in this section of the diary, indicate if it was bought in Nunavik by circling "Yes" or "No".
Cost of item
Record the cost of the good or service after deducting any coupons, rebates or subsidies which may apply. Do not include taxes (unless already included in the cost, such as gas, cigarettes, etc.). Write the exact amount for each item.

8
EXAMPLES of how to record expenses for which you DO NOT HAVE detailed receipts
or other purchase records in SECTION 2 of the diary
dd/mm BRAND
NAME
MODEL
NUMBER
SIZE OR
QUANTITY
(if relevant) (if relevant) (if relevant) $ ¢
1 02/01 Yes No 560 . 00
2 05/01 McCain Deluxe 900g Yes No 15 . 59
3 05/01 McCain Superfries 2 kg Yes No 12 . 69
4 08/01 Yes No 12 . 29
5 09/01 Panasonic NN-SD767W 1 Yes No 239 . 95
6 11/01 Beatrice 1 liter Yes No 2 . 95
7 12/01 Du Maurier 1 pack Yes No 16 . 90
8 / Yes No .
9 / Yes No .
10 / Yes No .
11 / Yes No .
Section 2:
2% Milk
1 pack of 25 cigarettes
Frozen Pizza
Frozen Fries
Date of
expense
Item
#
Do not
include taxes
(Circle)
(See the Diary Guide for help with this section.)
DETAILED DESCRIPTION OF THE ITEM PURCHASED
BOUGHT IN
NUNAVIK?
Expenses for which you CANNOT provide detailed receipts or other purchase records
Breakfast for 1 person at Kuujjuaq Inn : 2 eggs with bacon and potatoes + coffee
1.6 cubic foot, 1250 watts Microwave oven with Inverter technology
Description of the item purchased
Cost of itemWrite ONLY ONE item per line.
KMHB apartment monthly rent

9
General notes on what to include as household expenses and what to leave out
Remember to include these expenses if they occur within the 14-day period for which you have to fill out the diary:
- All your expenses, both goods and services, for all members of your household.
- Rent payments/insurance payments.
- Regular/typical household bills (electricity, oil, telephone services, television services, Internet services, etc.).
- Items or services purchased for people who do not live with you.
- Expenses made while on a trip away from home, such as airplane tickets, hotel rooms, gas, souvenirs, restaurants meals, entry or admittance fees to tourist attractions, theme parks, museums, etc.
- Expenses for occasional services, such as babysitting, hairdresser, postal services, etc.
- Expenses for secondary residences and/or hunting or fishing camps, etc.
- Any expense related to hunting, fishing or trapping equipment.
- Purchases of construction materials for home improvements or for building/repairing hunting, fishing and/or trapping camps.
- Purchases of vehicles (cars, trucks, snowmobiles, ATVs, boats, etc.).
- Gas for vehicles and all vehicle-related costs (maintenance, repairs, accessories, tires, etc.).
- Convenience store purchases such as cigarettes, lottery tickets, beers or other alcoholic beverages, newspapers, magazines, candies, etc.
- Expenses for movie and game rentals.
- Less frequent purchases such as household appliances, indoor/outdoor furniture, electronic or computer equipment, etc.
- Lunches or beverages purchased at school or work.
- Beverages purchased in bars including alcoholic drinks, and all snacks, beverages and meals purchased from any type of restaurant.

10
IMPORTANT NOTES:
- Include all expenses, whether paid for by cash, credit card, prepaid credit card, debit card, cheque or postal money order.
- For each item purchased using a credit card or on an instalment plan, record the whole amount on the day that the expense was made.
- Do not include payments for which you have been, or will be, reimbursed.
- Do not include expenses charged against a business
THANK YOU!

Appendix 5. Informative poster of the cost-of-living survey (French)

Appendix 6. Informative poster of the cost-of-living survey (English)

Appendix 7. Informative poster of the cost-of-living survey (Inuktitut)
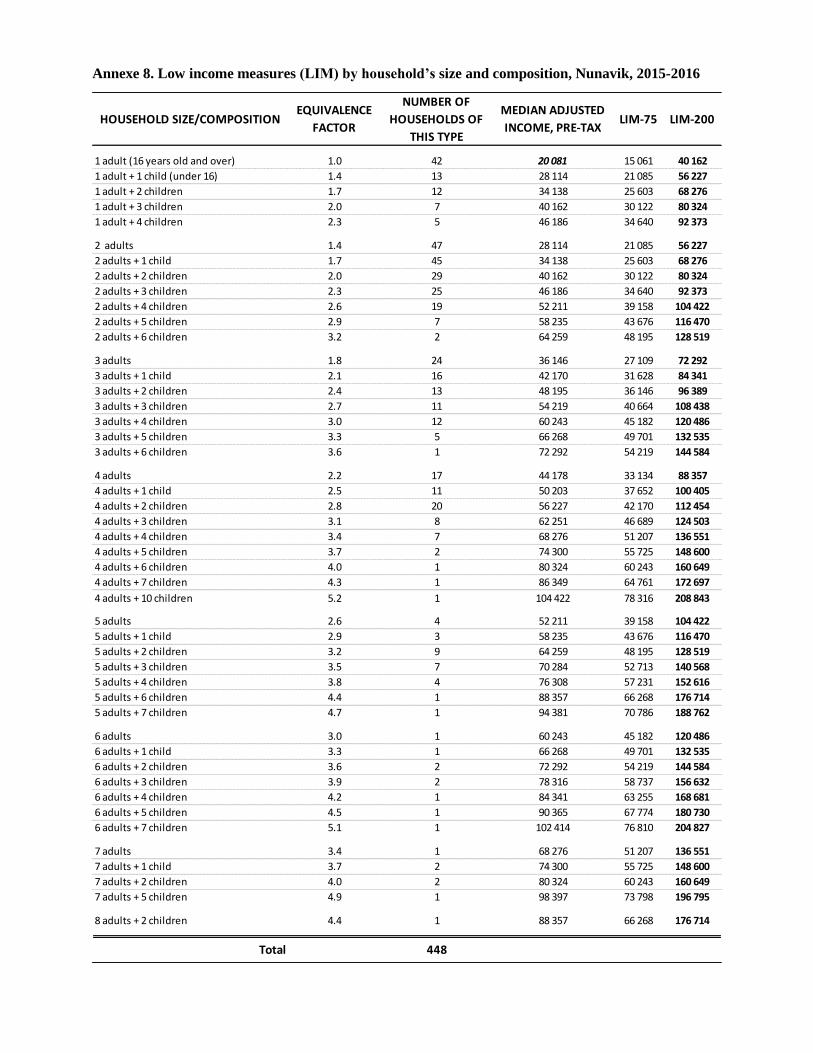
Annexe 8. Low income measures (LIM) by household’s size and composition, Nunavik, 2015-2016aa1
HOUSEHOLD SIZE/COMPOSITIONEQUIVALENCE
FACTOR
NUMBER OF
HOUSEHOLDS OF
THIS TYPE
MEDIAN ADJUSTED
INCOME, PRE-TAXLIM-75 LIM-200
1 adult (16 years old and over) 1.0 42 20 081 15 061 40 162
1 adult + 1 child (under 16) 1.4 13 28 114 21 085 56 227
1 adult + 2 children 1.7 12 34 138 25 603 68 276
1 adult + 3 children 2.0 7 40 162 30 122 80 324
1 adult + 4 children 2.3 5 46 186 34 640 92 373
2 adults 1.4 47 28 114 21 085 56 227
2 adults + 1 child 1.7 45 34 138 25 603 68 276
2 adults + 2 children 2.0 29 40 162 30 122 80 324
2 adults + 3 children 2.3 25 46 186 34 640 92 373
2 adults + 4 children 2.6 19 52 211 39 158 104 422
2 adults + 5 children 2.9 7 58 235 43 676 116 470
2 adults + 6 children 3.2 2 64 259 48 195 128 519
3 adults 1.8 24 36 146 27 109 72 292
3 adults + 1 child 2.1 16 42 170 31 628 84 341
3 adults + 2 children 2.4 13 48 195 36 146 96 389
3 adults + 3 children 2.7 11 54 219 40 664 108 438
3 adults + 4 children 3.0 12 60 243 45 182 120 486
3 adults + 5 children 3.3 5 66 268 49 701 132 535
3 adults + 6 children 3.6 1 72 292 54 219 144 584
4 adults 2.2 17 44 178 33 134 88 357
4 adults + 1 child 2.5 11 50 203 37 652 100 405
4 adults + 2 children 2.8 20 56 227 42 170 112 454
4 adults + 3 children 3.1 8 62 251 46 689 124 503
4 adults + 4 children 3.4 7 68 276 51 207 136 551
4 adults + 5 children 3.7 2 74 300 55 725 148 600
4 adults + 6 children 4.0 1 80 324 60 243 160 649
4 adults + 7 children 4.3 1 86 349 64 761 172 697
4 adults + 10 children 5.2 1 104 422 78 316 208 843
5 adults 2.6 4 52 211 39 158 104 422
5 adults + 1 child 2.9 3 58 235 43 676 116 470
5 adults + 2 children 3.2 9 64 259 48 195 128 519
5 adults + 3 children 3.5 7 70 284 52 713 140 568
5 adults + 4 children 3.8 4 76 308 57 231 152 616
5 adults + 6 children 4.4 1 88 357 66 268 176 714
5 adults + 7 children 4.7 1 94 381 70 786 188 762
6 adults 3.0 1 60 243 45 182 120 486
6 adults + 1 child 3.3 1 66 268 49 701 132 535
6 adults + 2 children 3.6 2 72 292 54 219 144 584
6 adults + 3 children 3.9 2 78 316 58 737 156 632
6 adults + 4 children 4.2 1 84 341 63 255 168 681
6 adults + 5 children 4.5 1 90 365 67 774 180 730
6 adults + 7 children 5.1 1 102 414 76 810 204 827
7 adults 3.4 1 68 276 51 207 136 551
7 adults + 1 child 3.7 2 74 300 55 725 148 600
7 adults + 2 children 4.0 2 80 324 60 243 160 649
7 adults + 5 children 4.9 1 98 397 73 798 196 795
8 adults + 2 children 4.4 1 88 357 66 268 176 714
Total 448
Top Related