


Languages
Pages
Legal

The Clay Research Group Issue 117 – February 2015 – Pa
The Clay Research Group
Monthly Bulletin
TheClay Research
Group
February 2015Edition 117
RESEARCH AREAS
Climate Change Data Analysis Electrical Resistivity Tomography
Time Domain Reflectometry BioSciences Ground Movement
Soil Testing Techniques Telemetry Numerical Modelling
Ground Remediation Techniques Risk Analysis
Mapping Software Analysis Tools

The Clay Research Group Issue 117 – February 2015 – Page 1
CONTENTSIssue 117, February, 2015
Page 2Probability of Valid and Causation
Page 3Re‐visiting BRE Digest 352
Page 42014 – warmer and wetter
Page 5, 6 and 7Using Statistical Techniques to
Identify Risk FactorsPage 8 & 9
Ground Movement Analysis Page 10
Canopy ManipulationPage 11
Google Earth 3D MappingPage 12, 13 & 14
Mapping Risk by Region
UKCRIC
The CRG are supporting Birmingham University’sapplication to EPSRC for funding to build a large‐scaletest facility as part of their UK Collaboration forResearch in Infrastructure and Cities (UKCRIC). Theproject has the potential to deliver significant benefitsto UK insurers across a range of perils, subsidence inparticular.
Tom Clinton is gathering data from the site of theAldenham willow and hopefully the results will bedelivered later in the year.
Weather Study
This month we look at the correlation between thevarious weather elements (hours of sunshine,temperature and rainfall) and compare them withclaim numbers.
What combination of months and values areassociated with higher than average claim numbers?
Essential Reads – Roots and Shoots
Neil Hipps has published his work on crownmanipulation undertaken at East Malling. See page 10.A study of tree root growth illustrating thedetermining role of soil type and water availabilityover species appears on page 7.
The Role of the BREGuidance from the Building ResearchEstablishment in the form of Digestsimproved our understanding ofsubsidence and changed the way thatclaims are handled.
In this and future editions we will betaking a look at some of their work anddiscussing their contribution. In thisedition and by way of introduction welook at BRE Digest 352, issued in 1990at a time of claims surge.
Next month Richard Driscoll recalls hisintroduction to the BRE and providessome interesting background.

The Clay Research Group Issue 117 – February 2015 – Page 2
Probability of Validity and CausationIf a claim is valid, the probability of causation is largely dictated by the geology. Inareas of North London for example, if the claim is notified in the summer months thenthere is something like an 80% probability that the cause will be clay shrinkage. Thisreduces to 25% in the winter. The category ‘other’ relates to repudiations.
Charts showing the ‘probability by cause of subsidence’ for winter and summermonths, by geology. The data will be skewed due to soil variability. Although the data
for the more homogenous clay series is clear, data relating to the drift series willinevitably be less accurate. The values will also vary with the weather.

The Clay Research Group Issue 117 – February 2015 – Page 3
Revisiting BRE Digest 352
It’s worth re‐visiting what would typically happen before the publication of BREDigest 352. The appearance of even small cracks was regarded as a serious matter. Inmany cases it would result in full or partial underpinning. After all, if the buildingmoved again, the engineer could be liable – not the insurer – and the risk wasregarded as unnecessary.
The Digest reports that in any year “as many as 14,000 families will experience theanxiety and disruption of the underpinning process”. Something our own research atthe time confirmed. Our estimate was that nearly half of all valid claims ended upbeing underpinned.
The Digest was published in June 1990 and would have been using figures fromearlier years. In 1989 there were 30,000 subsidence claims notified according to theABI and we were simply underpinning too many houses for what was, in manyinstances, fairly minor damage.
The Digest posed the question “why has this growth in underpinning occurred? Whatindeed is underpinning and why is it carried out at such expense?”
The Building Research Establishment set about trying to answer these questions andpublished “Foundation movement and remedial underpinning in low‐rise buildings”.The advice was the cornerstone to how we handle subsidence today.
They arrived at the conclusion that ”the degree of movement and consequentcracking that causes concern to homeowners is rarely of structural significance”.
Over time, and sometimes with the support of insurers who effectively agreed tounderwrite the engineer’s decision to cover those cases that did return, underpinningbecame something of a rarity. Many contractors and some engineers forecast lots ofclaims would re‐open, but that didn’t happen.
Instead, efforts were directed to removing the cause of damage. Dealing with thetree, repairing the leaking drain became the new norm. The work of the BREchanged the way we dealt with claims for the better.
Next month we have an article from Richard entitled “My Introduction toSubsidence”.

The Clay Research Group Issue 117 – February 2015 – Page 4
Maximum Temperature
Max temperature for 1970 onwards with 2014superimposed in red. As can be seen on thefollowing pages, temperature alone isn’t alwaysthe driver behind claim numbers.
Hours of Sunshine
Hours of Sunshine 1970 onwards with 2014superimposed in orange. Hours of sunshineare an important factor in delivering claimnumbers – possibly more significant thantemperature.
ANNUAL RAINFALL
Rainfall 1970 onwards with 2014 superimposedin blue. Met Office report that 2014 was thefourth wettest since records began in 1910. Theintermittent nature of the rainfall helps tomitigate against soil drying in warm years.
2014 Weather – Warmer and WetterThe various climate authorities (NOAA, NASA, the UK Met Office, WMO and JapanMeteorological Association) report that 2014 was the warmest both globally and for theUK, which poses the question why it wasn’t accompanied by higher claim numbers? Themost likely answer is an increase in rainfall. The Met Office advises that 2014 was thefourth wettest since records began in 2010. Yes it is warmer, but it is also wetter.
Since the 2006 event, it has been generally wetter but more important than the total isperhaps the fact that the rainfall is breaking up the long summer months and providingmuch needed water to rehydrate the soil.
Below, Met Office data from the Heathrow weather station are plotted to see where2014 sits in relation to the elements noted.

The Clay Research Group Issue 117 – February 2015 – Page 5
Root Induced Clay Shrinkage Claims - Analysis of RiskElements using Correlation Techniques
Below, charts showing temperature, rainfall, hours of sunshine and soil moisturedeficit by month for the Heathrow weather station (SMD values from tile 161, NWLondon), as supplied by the Met Office.
Previous editions have made linear comparisons between the elements overindividual years. This project sought to determine if there were more generalpatterns that would improve our understanding of claims when the elements werecombined.
Colour graduation has been applied to illustrate the known risk factors. Warmermonths and longer hours of sunshine have a darker shade. Tiles with less rainfall arelighter than those with more. The drier the soil, the lighter the tile. The higher thenumber of claims notified the redder the tile. Low claim numbers are green andyellow is intermediate.
A number of permutations have been used, combining differing elements andmonths to establish which have the most influence on claim numbers.
Claims (expressed as frequency)
warmer
drier
more sunshine
drier soil
high claims1990 1995 2003 2006
The Clay Research Group Issue 117 – February 2015 – Page 6
What are the weather conditions that deliver high subsidence claim numbers? Is itthe temperature? Or does the absence of rainfall determine risk? We looked atdifferent combinations for a range of summer months, comparing values for Juneand July, May to August, June to September and May to September (inclusive). Astrees were the main driver, the study was restricted to combinations between Mayand October.
The correlation between claims and rainfall was the weakest at 0.33, followed bytemperature with a score of 0.368. The correlation of claims with ‘hours of sunshine– rainfall’ for this period (May to August) was higher at 0.53.
The period May to August gave a correlation between hours of sunshine alone andclaims of 0.558.
The highest score was the period May to September. The correlation with hours ofsunshine of 0.64 may be regarded as quite good given the fact that we are dealingwith the vagaries of weather, soil and vegetation. The value for ‘hours of sunshine –rainfall’ was 0.617.
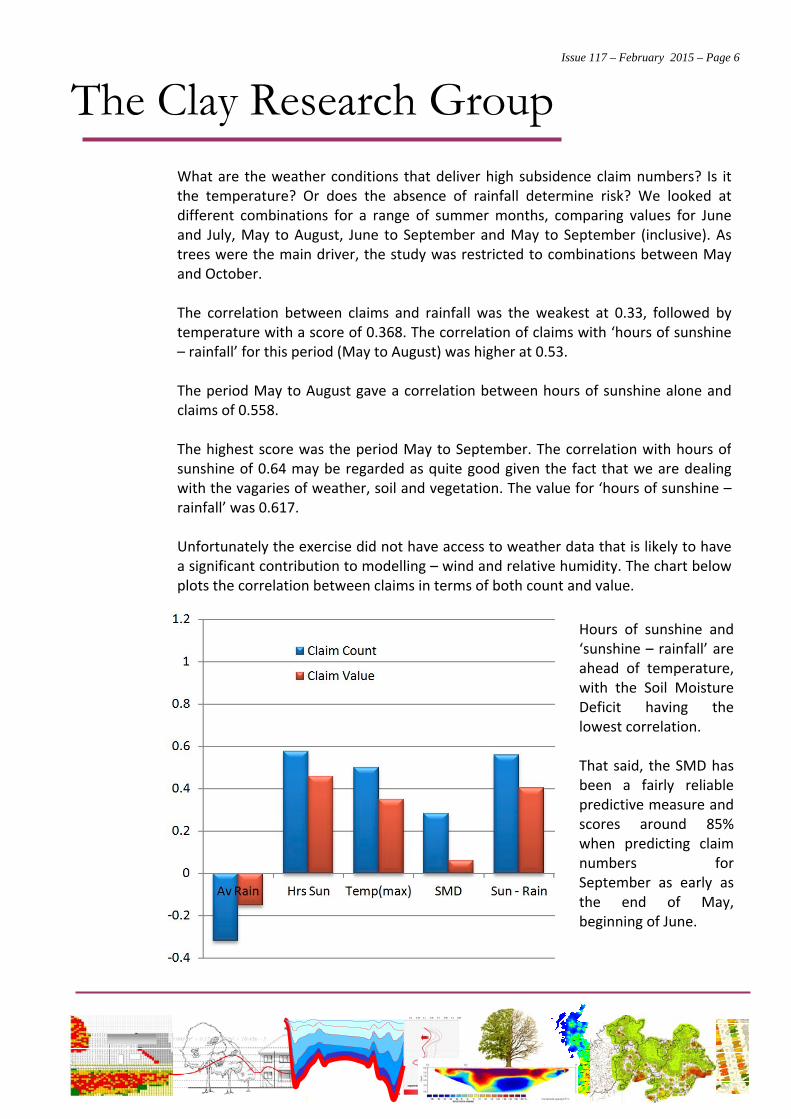
Unfortunately the exercise did not have access to weather data that is likely to havea significant contribution to modelling – wind and relative humidity. The chart belowplots the correlation between claims in terms of both count and value.
Hours of sunshine and‘sunshine – rainfall’ areahead of temperature,with the Soil MoistureDeficit having thelowest correlation.
That said, the SMD hasbeen a fairly reliablepredictive measure andscores around 85%when predicting claimnumbers forSeptember as early asthe end of May,beginning of June.

The Clay Research Group Issue 117 – February 2015 – Page 7
Monthly claim data uses ABI annualfigures redistributed according to theprofiles shown (left) for a range ofscenarios.
For a surge year we have used the2003 profile, 2006 for an intermediateyear and 1999 for a normal claim year.
So, why the relatively low correlation between claims and weather? Although theweather is an important driver, the real trigger is the tree. It is a little like discoveringthat root induced clay shrinkage claims have a link with the geology. Yes, of coursethat is the case, but that doesn’t mean that all trees cause damage on clay soils, andsimilarly, the missing link in our exercise is the fact we haven’t taken account of thetree.
We can see from the analysis that the warning bells with regard to the weather are (a)a temperature of 23degC., in excess of 220 hours of sunshine per year and low (oftenin the mid‐twenties) rainfall for the combined months, but the final determinant lieswith the tree and its immediate environment.
“Plasticity of tree root system structure in contrasting soilmaterials and environmental conditions”.
Caroline Zanetti et al., Plant and Soil Journal. February 2015, Volume 387
This paper looks at the root structure of several trees and concludes that theirenvironment – the structure of the soil in which they grow – rather than tree species,determines their distribution and growth patterns. The authors conclude “Root systemstructure was mainly influenced by soil material and water availability and far less bytree species.”
“Heart root systems were limited to fine material while mixed and tap root systemswere found on coarse material. In coarse materials, trees developed few but ratherlarge roots. In fine materials, root systems had three times more roots but they were40% smaller and shorter. Roots were 20% more numerous and 65 % larger on thedownslope side due to water availability at dike or riverbank toe.”

The Clay Research Group Issue 117 – February 2015 – Page 8
Ground movement comparing heave following unloadingwith seasonal root induced clay shrinkage.
The University of Arizona reports that the "Earth's crust under Iceland is rebounding asglobal warming melts the island's great ice caps. In south‐central Iceland some sites aremoving upward as much as 1.4 inches (35 mm) per year. A new paper is the first to showthe current fast uplift of the Icelandic crust is a result of accelerated melting of theisland's glaciers and coincides with the onset of warming that began about 30 yearsago.”
Re‐visiting levels at Aldenham in the vicinity of the willow, movement of 35mm in anyyear is unremarkable. Not that the two scenarios have any direct link but it did lead usto consider how much movement does take place over time. For example, at Station 23there was something like 0.75mm a day between the end of May and the end ofSeptember.
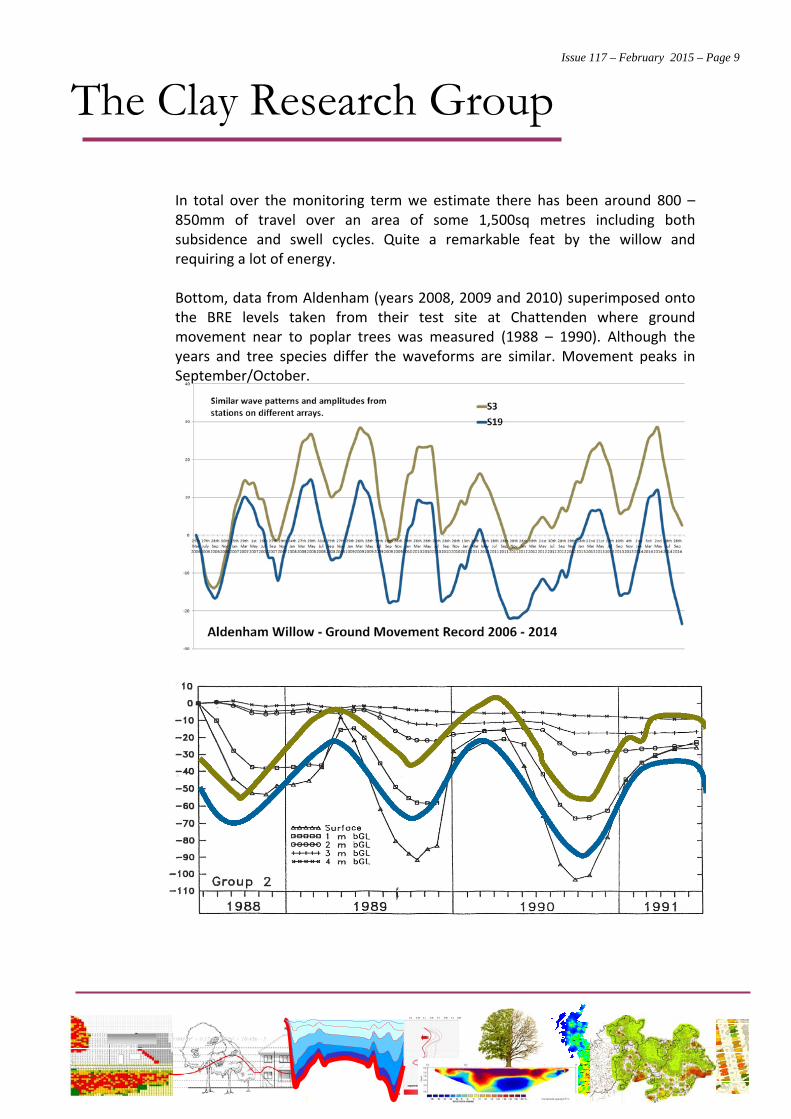
A little less at Station 8, which led us to consider the variation around the circumferenceof the tree at varying radii. Over the page is plotted the movement at Station 3 and 19.Each are situated on a different array, and although they are not too far apart spatiallythe amplitudes are similar.
Obviously this will change with variations in the geology as we saw at the Aldenham oaksite where sand strata reduced the movement. It would also be subject to wateravailability and tree physiology but in a fairly homogenous environment the movementappears to be similar both close to the tree and further away.
The Clay Research Group Issue 117 – February 2015 – Page 9
In total over the monitoring term we estimate there has been around 800 –850mm of travel over an area of some 1,500sq metres including bothsubsidence and swell cycles. Quite a remarkable feat by the willow andrequiring a lot of energy.
Bottom, data from Aldenham (years 2008, 2009 and 2010) superimposed ontothe BRE levels taken from their test site at Chattenden where groundmovement near to poplar trees was measured (1988 – 1990). Although theyears and tree species differ the waveforms are similar. Movement peaks inSeptember/October.

The Clay Research Group Issue 117 – February 2015 – Page 10
Canopy ManipulationNeil Hipps et al (2014) “Effect of two contrastingcanopy manipulations on growth and water use onLondon plane (Platinus x acerifolia) trees.” Plant and
Soil.
Neil Hipps and colleagues describe theresults of their research into canopymanipulation at the East Malling site.
The paper compares moisture uptake for 24/ 20m tall poplar trees over a four year term(April 1999 to June 2004) following differenttreatments. 8 trees were crown reduced, 8crown thinned and the remaining 8 wereused as a control.
Moisture uptake was measured using avariety of techniques.
The paper is essential reading and comparesthe effect of the two treatments. Below isan extract explaining their findings.
“Seventy per cent canopy volume reductionshowed greater soil moisture conservation at6 m from the tree and this suggests that thetree roots in this experiment spread at leastthis far and were within the distance rangethat caused a high frequency of damage tobuildings on swelling clay soils according toCutler and Richardson (1997).”
To summarise, the team found that severecrown reduction delivered better resultsthan crown thinning in terms of reducingwater uptake but the crown reductionrequired to deliver this benefit had to besevere and carried out on a regular basis.
The research was undertaken at East Mallingand supported by (amongst others) Cambridge
University (statistics),Delta T Devices (TDR moisture sensor),
Arboricultural Association, BRE, Association ofBritish Insurers and Giles Biddle
Summary of Findings:
1. Reduction of up to 50% of crownvolume is not consistently effectivefor decreasing soil drying.
2. For practical soil moistureconservation, severe crown‐reduction 70 ‐ 90% of crown volumewould need to be applied.
3. Crown reductions should berepeated on a regular managedcycle with an interval based onmonitoring re‐growth.
4. Crown‐thinning is not an effectivemethod to control soil drying bytrees.
Diagrammatic illustration of crown reduction(left) and thinning (right).

The Clay Research Group Issue 117 – February 2015 – Page 11
Google maps have added a 3D viewer that appearson the screen where the data is available – mainlycities at the moment. Select the satellite viewing
option from the bottom left hand corner of the screento switch between maps and aerial imagery. Rotate
image to display in 3D using the icon, right. Theoption is only available when the icon is present.
Google Maps – 3D Imagery

The Clay Research Group Issue 117 – February 2015 – Page 12
POPULATION DISTRIBUTION
‘Claim/Population’COMPARING CLAIMS DISTRIBUTION AND
POPULATION
Risk Distribution by RegionBelow, maps showing claim and populationdistribution.
The south east is the predominant risk. Claimsaccount for 43% of the UK total comparedwith a population percentage of 32%.Scotland is the least risky with only 3.5% ofthe UK claims compared with a population of9.4% of the UK.
The ‘Claim/Population’ map, right, uses thevalues from the maps below. On the followingpages are further maps showing regional riskon a normalised scale, and at district level.

The Clay Research Group Issue 117 – February 2015 – Page 13
REGIONAL MAP OF RISK on a NORMALISED SCALE
Data from the previous page re-imaged on a normalised scale 0 – 1showing risks relative to the SE of the UK. Scotland represents the
lowest risk, followed by Wales, reflecting the geology.

The Clay Research Group Issue 117 – February 2015 – Page 14
DISTRICT MAP OF RISK on a NORMALISED SCALE
Using the same data as the previous page but displayed at a higherresolution, showing the risk at district, rather than regional level.
Top Related