


Languages
Pages
Legal


The changing geography of the private rented sector in England between 2001 and 2011
Nigel de NoronhaDoctoral Researcher, CCSR
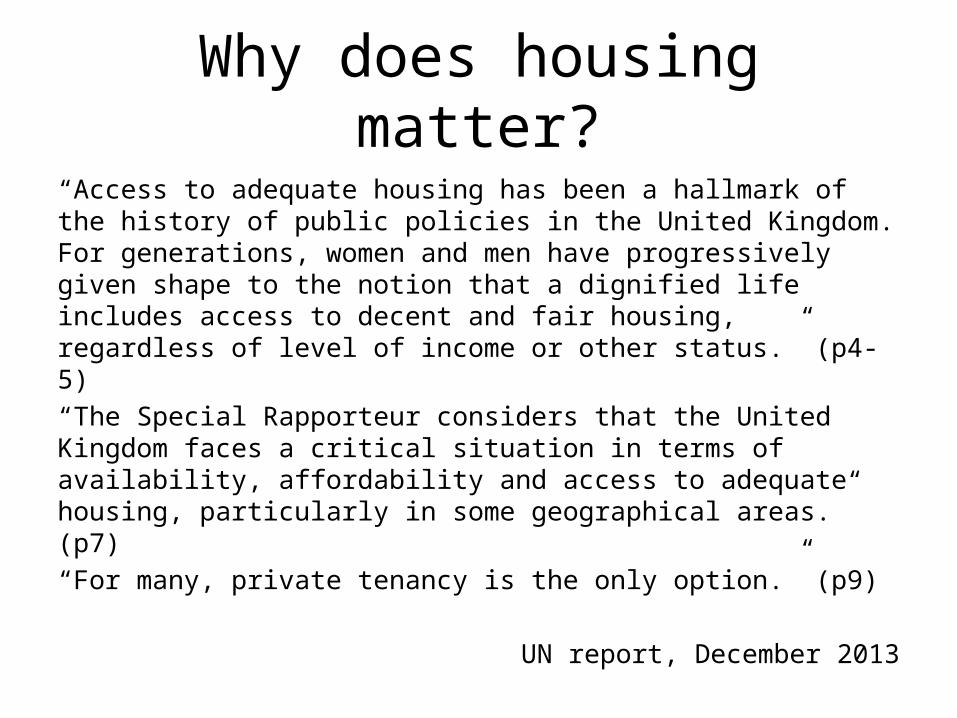
Why does housing matter?
“Access to adequate housing has been a hallmark of the history of public policies in the United Kingdom. For generations, women and men have progressively given shape to the notion that a dignified life includes access to decent and fair housing, regardless of level of income or other status.” (p4-5)“The Special Rapporteur considers that the United Kingdom faces a critical situation in terms of availability, affordability and access to adequate housing, particularly in some geographical areas.” (p7)“For many, private tenancy is the only option.” (p9)
UN report, December 2013

Agenda
• How has the private rented sector changed between 2001 and 2011 in England? Who has been affected by this change and where?– The growth in the private rented sector– Changing household types– Stories of change– A case in point – a tale of two cities
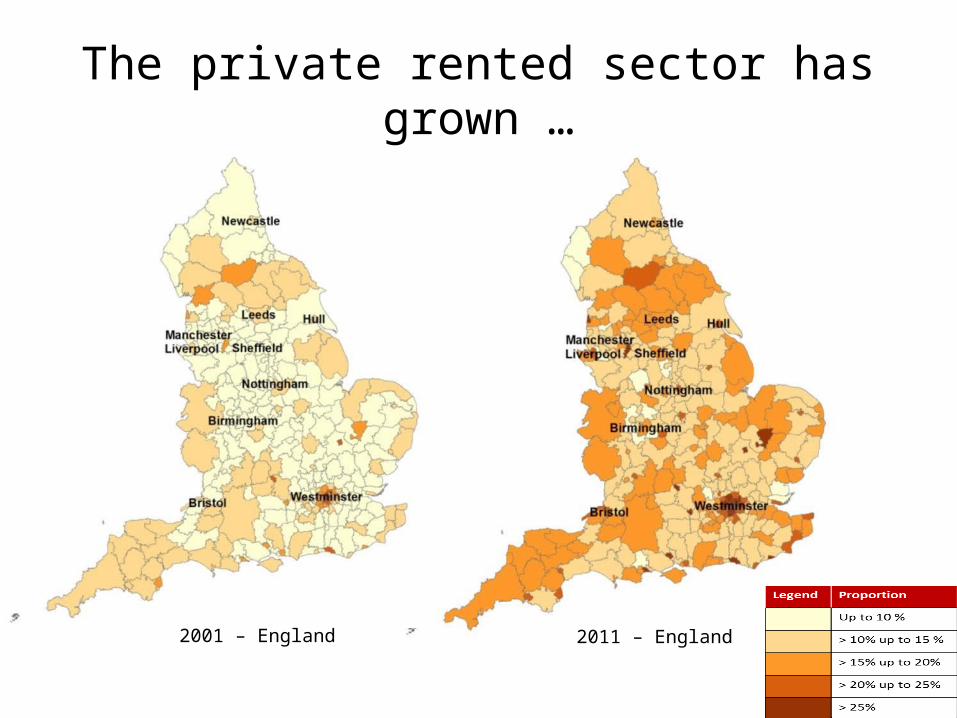
The private rented sector has grown …
2001 – England 2011 – England

… in England …
2001 – London 2011 – London
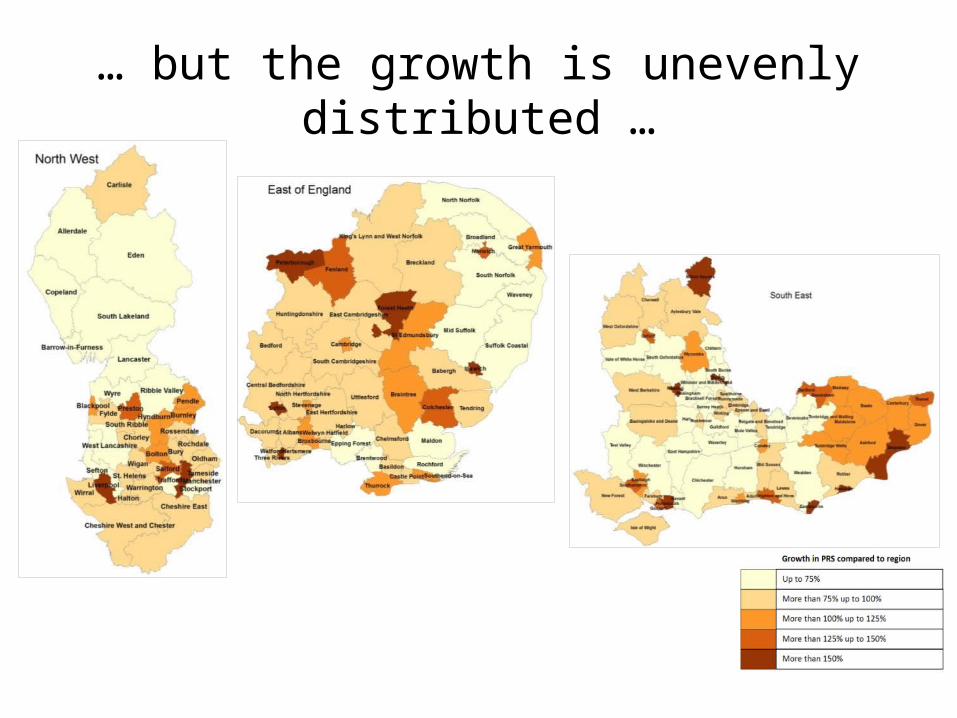
… but the growth is unevenly distributed …
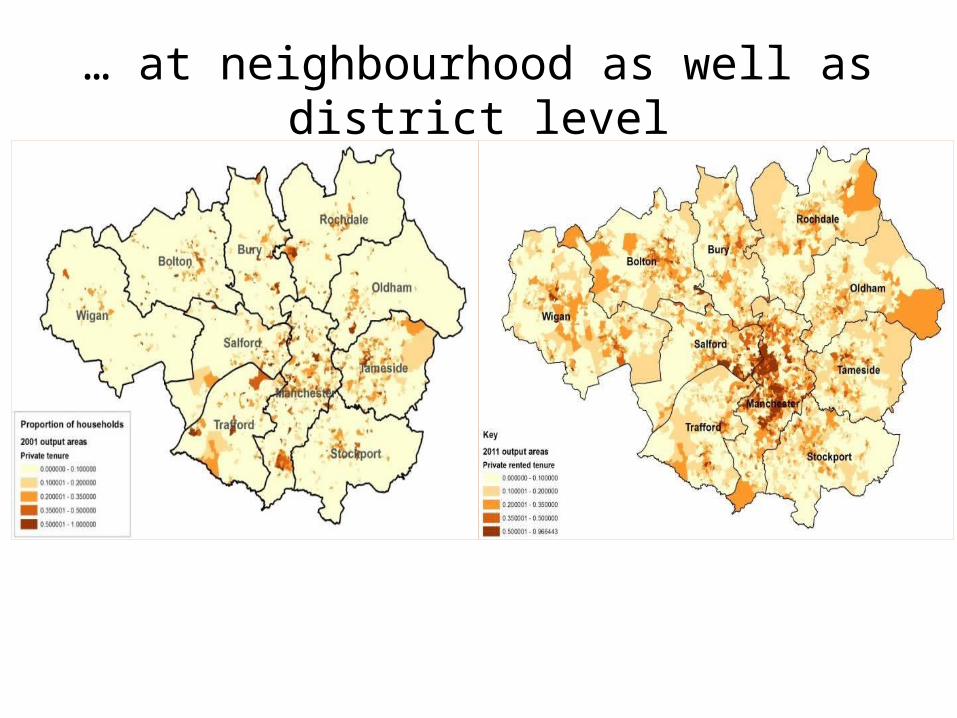
… at neighbourhood as well as district level

Household types are changingHouseholds ('000s) 2001 2011
Region
Households without
dependentsOlder
peopleDependent
children
Non dependent
children All
Households without
dependents Older peopleDependent
children
Non dependent
children All
England 7,672 (38%) 4,848 (24%) 6,022 (29%) 1,907 (9%)
20,450 8,953 (41%) 4,576 (21%) 6,423 (29%) 2,109 (10%) 22,063
London 1,326 (44%) 555 (18%) 872 (29%) 261 (9%) 3,015 1,499 (46%) 454 (14%) 1,009 (31%) 302 (9%) 3,266
South East 1,230 (37%) 807 (25%) 959 (29%) 289 (9%) 3,287 1,408 (40%) 779 (22%) 1,044 (29%) 322 (9%) 3,555
East 820 (37%) 551 (25%) 653 (29%) 205 (9%) 2,231 938 (39%) 540 (22%) 712 (29%) 231 (10%) 2,423
East Midlands 644 (37%) 414 (24%) 513 (30%) 160 (9%) 1,732 765 (40%) 407 (21%) 544 (29%) 178 (9%) 1,895
West Midlands 757 (35%) 512 (24%) 661 (31%) 221 (10%) 2,153 868 (38%) 492 (21%) 692 (30%) 240 (10%) 2,294
South West 778 (37%) 564 (27%) 569 (27%) 173 (8%) 2,085 921 (41%) 550 (24%) 598 (26%) 193 (9%) 2,264
North East 369 (35%) 265 (25%) 317 (30%) 113 (11%) 1,066 447 (40%) 247 (22%) 314 (28%) 119 (11%) 1,129
North West 993 (35%) 673 (24%) 856 (30%) 289 (10%) 2,812 1,199 (40%) 629 (21%) 867 (29%) 313 (10%) 3,009
Yorkshire and Humberside 751 (36%) 503 (24%) 617 (30%) 192 (9%)
2,064 904 (41%) 473 (21%) 639 (29%) 206 (9%) 2,224

So what type of households now live in the PRS? How has this changed over time?
Household type 2001 2011 Change
Single person households 673,117 1,083,074 409,957 (61%)
Couple with no children 395,950 675,659 279,709 (71%)
Student households 69,087 113,390 44,303 (64%)
Other households 236,537 426,334 189,797 (80%)
Single pensioner 303,974 233,839 -70,135 (-23%)
Couple pensioner 78,149 67,195 -10,954 (-14%)
Other pensioner 6,224 4,884 -1,340 (-22%)
Couple with dependent children 302,305 661,706 359,401 (119%)
Lone parent with dependent children 251,517 469,585 218,068 (87%)
Other household with dependent children 50,373 130,017 79,644 (158%)
Couple with no dependent children 46,810 66,445 19,635 (42%)
Lone parent no dependent children 42,347 78,906 36,559 (86%)

Some stories of change (1)
Single people under 65
Area
Proportion of all households
Proportion living in the PRS
More than 35% in PRS in 20112001 2011 2001 2011England 15.7% 17.9% 21.0% 27.5%
London 22.0% 22.0% 21.7% 29.6% Camden, Kensington and Chelsea, Westminster
South East 14.1% 16.1% 22.7% 28.0%Brighton and Hove, Eastbourne, Hastings, Oxford, Shepway, Thanet, Worthing
East 14.1% 15.8% 20.5% 26.2% Forest Heath
South West 14.2% 16.5% 26.0% 30.9% Bournemouth, Torbay, Torridge
East Midlands 14.3% 16.7% 19.2% 25.9%
West Midlands 14.5% 16.9% 17.8% 24.6%
North East 15.1% 18.4% 16.4% 23.2%
North West 15.9% 19.4% 19.5% 26.8% Blackpool, Burnley, Fylde, Liverpool
Yorkshire and Humberside 14.7% 17.9% 21.5% 28.2% Scarborough
Households of single people under 65 have increased in most regions and as a group they are increasingly reliant on the private rented sector. Coastal areas, three central London boroughs and Forest Heath, site of two US Air Force bases show the largest increases in reliance on the PRS for this group.
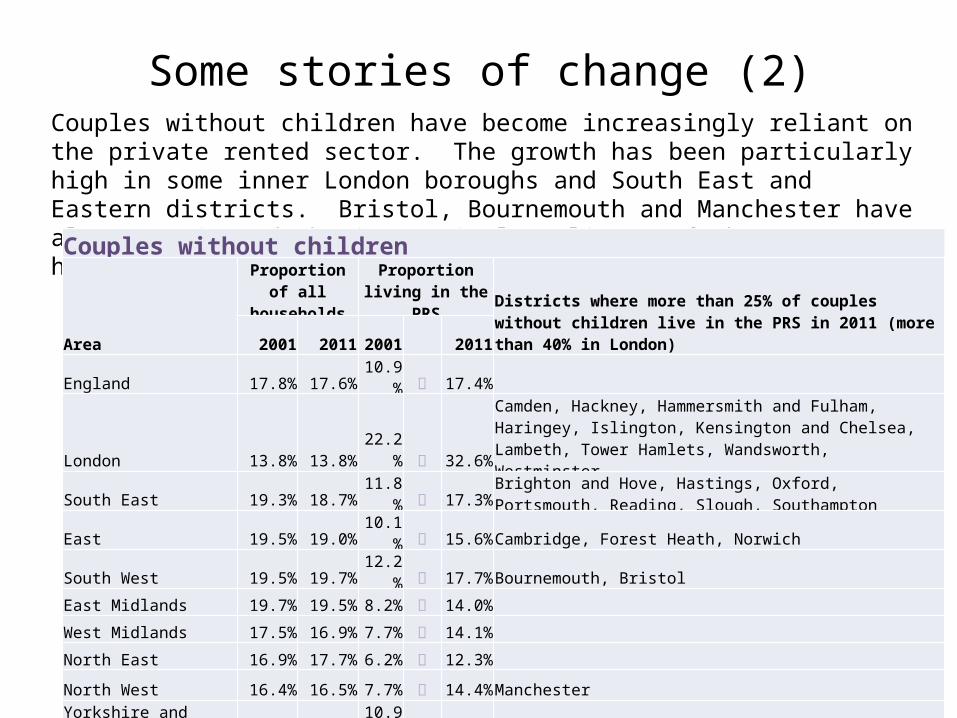
Some stories of change (2)Couples without children have become increasingly reliant on the private rented sector. The growth has been particularly high in some inner London boroughs and South East and Eastern districts. Bristol, Bournemouth and Manchester have also experienced the increasingly reliance of these households on the PRS.
Couples without children
Area
Proportion of all households
Proportion living in the PRS
Districts where more than 25% of couples without children live in the PRS in 2011 (more than 40% in London)2001 2011 2001 2011
England 17.8% 17.6% 10.9% 17.4%
London 13.8% 13.8% 22.2% 32.6%
Camden, Hackney, Hammersmith and Fulham, Haringey, Islington, Kensington and Chelsea, Lambeth, Tower Hamlets, Wandsworth, Westminster
South East 19.3% 18.7% 11.8% 17.3%Brighton and Hove, Hastings, Oxford, Portsmouth, Reading, Slough, Southampton
East 19.5% 19.0% 10.1% 15.6%Cambridge, Forest Heath, Norwich
South West 19.5% 19.7% 12.2% 17.7%Bournemouth, Bristol
East Midlands 19.7% 19.5% 8.2% 14.0%
West Midlands 17.5% 16.9% 7.7% 14.1%
North East 16.9% 17.7% 6.2% 12.3%
North West 16.4% 16.5% 7.7% 14.4%Manchester
Yorkshire and Humberside 18.5% 18.7% 10.9% 14.8%

Some stories of change (3)Other households have increased in most regions and as a group they are increasingly reliant on the private rented sector. The group is likely to be heterogeneous but one explanation might be affordability of accommodation for single people leading to shared households. Many of the areas where this is happening have major universities – perhaps a reflection of people staying around after studying.
Other households
Area
Proportion of all households
Proportion living in the PRS
More than 50% in PRS in 2011 (more than 65% in London)2001 2011 2001 2011England 3.7% 4.5% 31.6% 42.8%
London 7.7% 9.4% 44.5% 55.8% Newham, Tower Hamlets, Wandsworth
South East 3.7% 4.2% 29.7% 37.7% Brighton and Hove, Oxford, Reading and SouthamptonEast 2.9% 3.7% 26.2% 37.1% Cambridge, Forest Heath, NorwichSouth West 3.3% 4.0% 28.0% 37.7% Bournemouth, Bristol, CheltenhamEast Midlands 2.7% 3.5% 25.1% 37.6% Boston, Lincoln, NottinghamWest Midlands 2.8% 3.6% 21.3% 34.2%North East 2.3% 2.8% 20.2% 34.2% Newcastle upon TyneNorth West 2.7% 3.4% 22.2% 36.9% Manchester, Salford
Yorkshire and Humberside 2.6% 3.4% 26.6% 39.2% Leeds, York
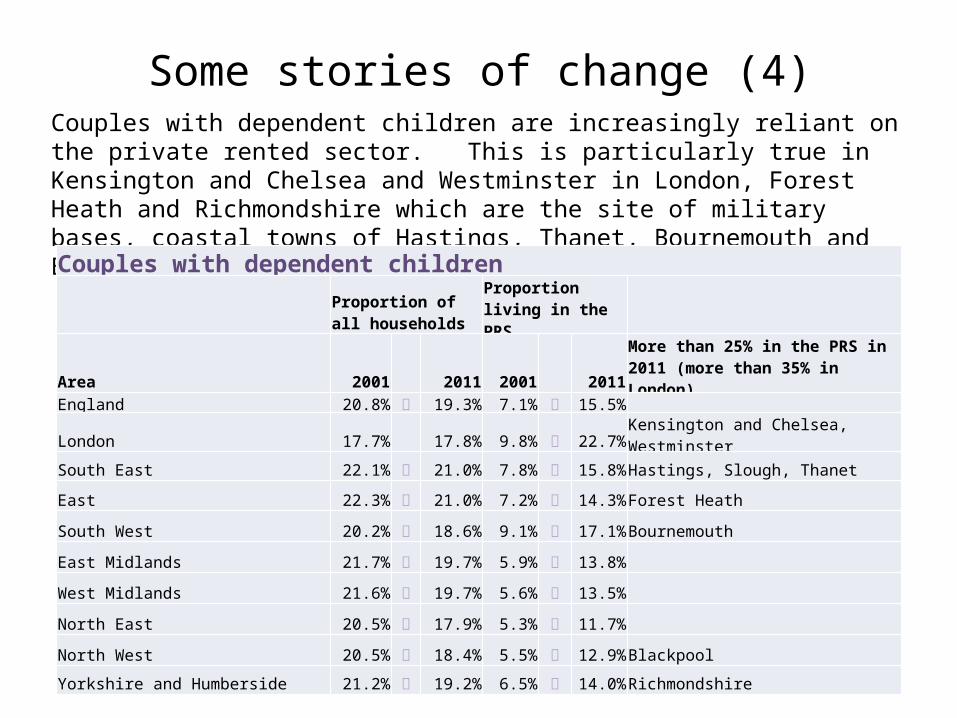
Some stories of change (4)Couples with dependent children are increasingly reliant on the private rented sector. This is particularly true in Kensington and Chelsea and Westminster in London, Forest Heath and Richmondshire which are the site of military bases, coastal towns of Hastings, Thanet, Bournemouth and Blackpool, as well as Slough.
Couples with dependent childrenProportion of all households
Proportion living in the PRS
Area 2001 2011 2001 2011More than 25% in the PRS in 2011 (more than 35% in London)
England 20.8% 19.3% 7.1% 15.5%
London 17.7% 17.8% 9.8% 22.7% Kensington and Chelsea, Westminster
South East 22.1% 21.0% 7.8% 15.8% Hastings, Slough, Thanet
East 22.3% 21.0% 7.2% 14.3% Forest Heath
South West 20.2% 18.6% 9.1% 17.1% Bournemouth
East Midlands 21.7% 19.7% 5.9% 13.8%
West Midlands 21.6% 19.7% 5.6% 13.5%
North East 20.5% 17.9% 5.3% 11.7%
North West 20.5% 18.4% 5.5% 12.9% Blackpool
Yorkshire and Humberside 21.2% 19.2% 6.5% 14.0% Richmondshire
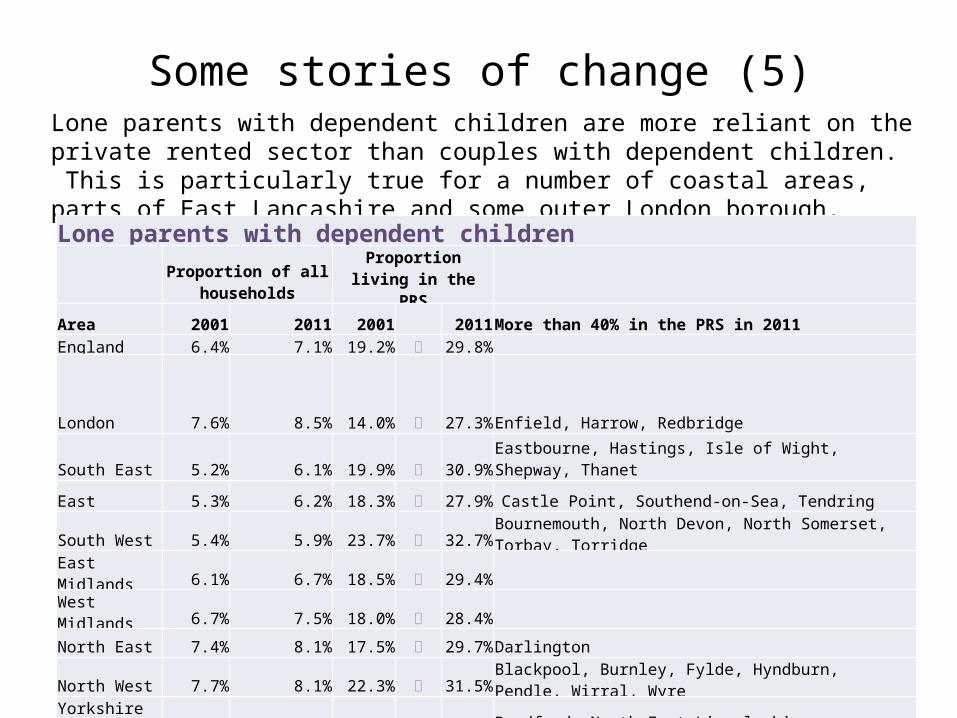
Some stories of change (5)Lone parents with dependent children are more reliant on the private rented sector than couples with dependent children. This is particularly true for a number of coastal areas, parts of East Lancashire and some outer London borough.
Lone parents with dependent childrenProportion of all
householdsProportion living in the
PRS
Area 2001 2011 2001 2011More than 40% in the PRS in 2011England 6.4% 7.1% 19.2% 29.8%
London 7.6% 8.5% 14.0% 27.3%Enfield, Harrow, Redbridge
South East 5.2% 6.1% 19.9% 30.9%Eastbourne, Hastings, Isle of Wight, Shepway, Thanet
East 5.3% 6.2% 18.3% 27.9% Castle Point, Southend-on-Sea, Tendring
South West 5.4% 5.9% 23.7% 32.7%Bournemouth, North Devon, North Somerset, Torbay, Torridge
East Midlands 6.1% 6.7% 18.5% 29.4%
West Midlands 6.7% 7.5% 18.0% 28.4%
North East 7.4% 8.1% 17.5% 29.7%Darlington
North West 7.7% 8.1% 22.3% 31.5%Blackpool, Burnley, Fylde, Hyndburn, Pendle, Wirral, Wyre
Yorkshire and Humberside 6.6% 7.1% 21.8% 31.9%Bradford, North East Lincolnshire, Richmondshire, Scarborough

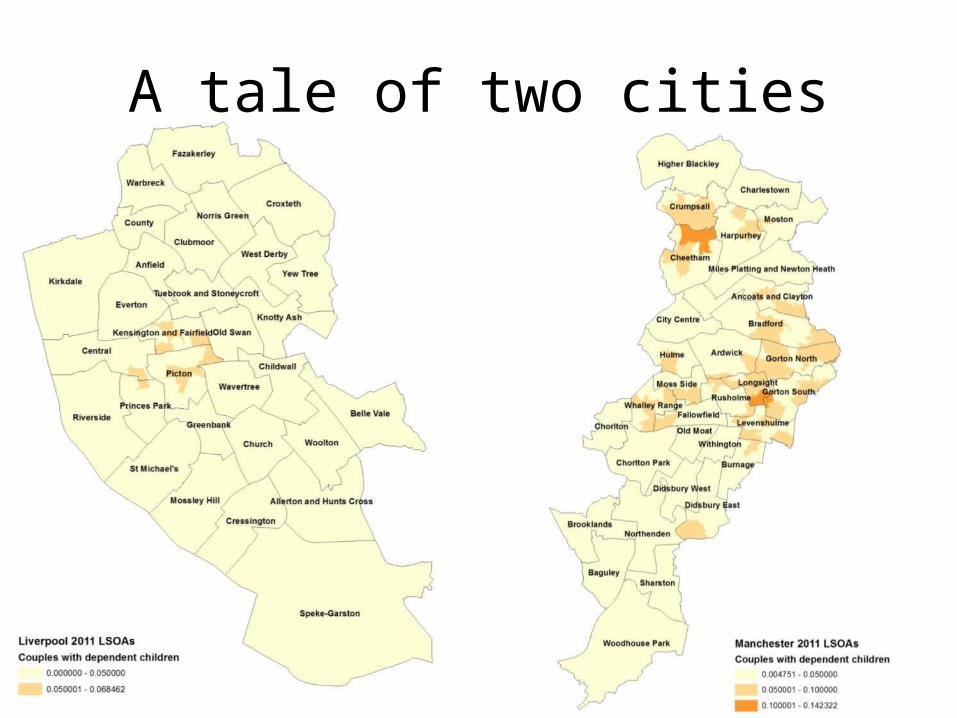
A tale of two cities
Source: 2001 and 2011 census
Manchester Liverpool
2001 2011 Change 2001 2011 Change
Households 167,451 204,969 22% 187,865 206,515 10%
PRS 31,424 61,411 95% 28,515 50,987 79%
Single people 9,908 17,390 76% 8,949 20,951 134%
Other 7,258 17,090 135% 3,872 7,864 103%
Couples with dependent children 2,152 6,950 223% 1,790 4,143 131%
Single parents with dependent children 3,356 5,121 53% 5,280 7,028 33%

A tale of two cities

A tale of two cities

A tale of two cities
A tale of two cities

A tale of two cities

Conclusion
• Growth of the private rented sector• Increasing reliance for some household types – Single people (28%)– Couples without children (17%)– Other households (43%)– Couples with dependent children (16%)– Lone parents with dependent children (30%)
• Spatial variation
Top Related