


Languages
Pages
Legal

20
02
an
nu
al
rep
ort
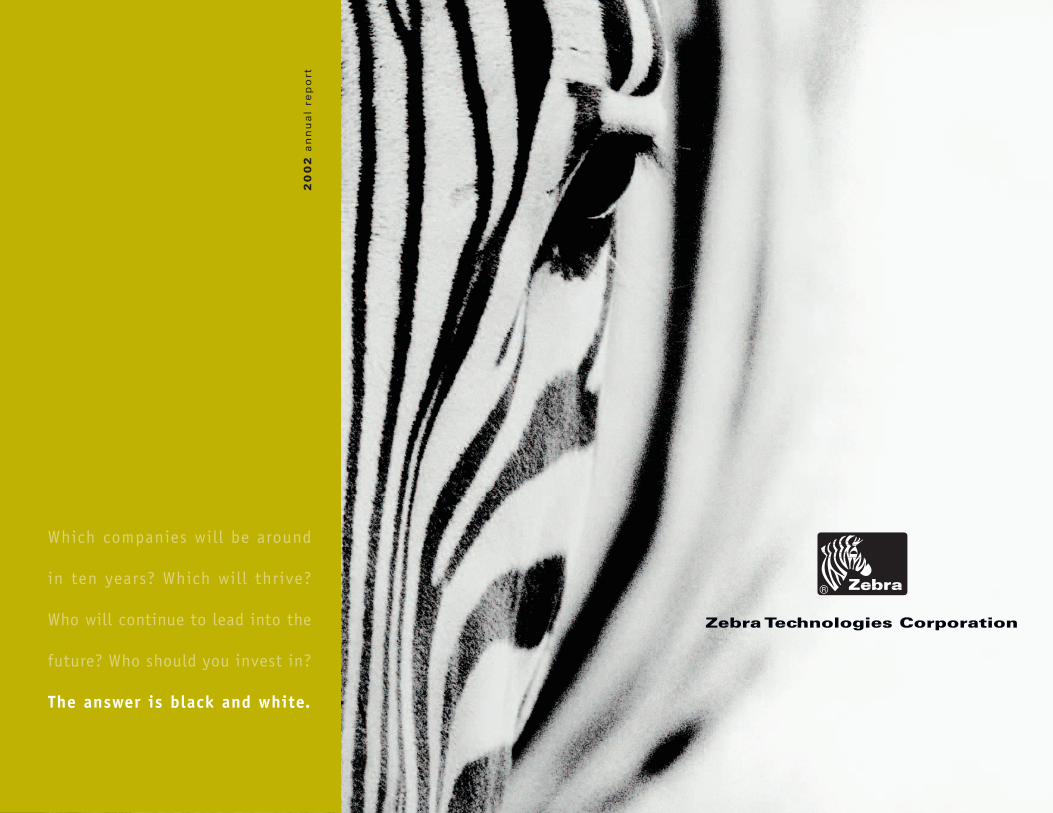
Which companies will be around
in ten years? Which will thrive?
Who will continue to lead into the
future? Who should you invest in?
The answer is black and white.
Zebra Technologies Corporation

Zebra Technologies Corporation
Mobile printing systems
Desktop label, ticket and receipt printers
Industrial and commercial bar code printers
Connectivity and label design software
Thermal printing supplies
Plastic card printers
Radio frequency identification(RFID)
High performance bar codelabel and specialty printers
Zebra Technologies Corporation delivers innovative
and reliable on-demand printing solutions for business
improvement and security applications in nearly 100
countries around the world. A broad range of applications
benefit from Zebra® thermal bar code, “smart” label
and receipt printers, and Eltron® card printers, resulting
in enhanced security, increased productivity, improved
quality, lower costs, and better customer service.
. . .

F I N A N C I A L S U M M A R Y 2002 % change 2001 % change 2000
Net sales $475,611 5.7% $450,008 -6.6% $481,569
Gross profit 230,747 9.9 209,893 -9.7 232,428
Operating income 101,805 10.1 92,459 -14.9 108,670
Net income 71,595 16.4 61,529 -14.1 71,622
Diluted earnings per share 2.29 15.1 1.99 -13.5 2.30
Cash and cash equivalentsand investments in marketable securities $348,577 $249,349 $156,714
Working capital 427,676 330,510 256,799
Total assets 573,088 479,556 418,896
Total stockholders’ equity 534,155 445,007 371,288
Operating Results
Capitalization
(In thousands, except per share data and percentages)
$80
70
60
50
40
20
Free cash flow (in millions)
$500
475
450
425
400
375
350
325
Sales (in millions)
19
98
19
99
20
00
20
01
20
02
$2.50
2.25
2.00
1.75
1.50
1.25
Diluted earningsper share
19
98
19
99
20
00
20
01
20
02
30
19
98
19
99
20
00
20
01
20
02
Zebra Technologies Corporation 2002 Annual Report | 1

At this time a year ago, we discussedwith you our strategy of investingin activities to extend Zebra’s marketleadership, improve its growthprospects and, fundamentally,continue to build value for all ofZebra’s stockholders over the longterm. We made these investmentswhile many of our competitorslacked the resources or had busi-ness models that required them topull back on their spending. Weaffirmed our confidence in the long-term prospects for our markets, ascompetitive forces drive companiesand organizations worldwide toincrease productivity, enhancequality, improve customer service,and ensure more effective security.
Throughout the U.S. economicdownturn, we leveraged our financialstrength to achieve these goals byfollowing a growth strategy based on:
Introducing new products, includingwireless and mobile printing systems,
photo ID card printers, and printer/encoders that incorporate radiotransponder technology (RFID).
Expanding our internationalpresence with greater Zebra repre-sentation in the high-growth, under-penetrated regions of Asia Pacific,Eastern Europe, and Latin America.
Increasing our focus on deliveringbusiness improvement and specialtyprinting applications and buildingthe infrastructure to support them.
Investing in marketing initiativesto enter high-growth verticalmarkets where we can deliver appli-cations in routing and tracking,identification and authentication,and transactions processing.
Pursuing acquisitions to deployour substantial cash reserves tostrengthen the strategic position ofour current business and diversifyinto related specialty printing andsupporting technologies.
Edward KaplanChairman and Chief Executive Officer
2 | Zebra Technologies Corporation 2002 Annual Report
At Zebra, we are proud of our accomplishments and the positions of financial
strength and market leadership that we occupy. We are confident in our ability to
achieve our strategic goals for growth and deliver increasing stockholder value.
L E T T E R T O S T O C K H O L D E R S

While pursuing these objectives,we also strengthened our manage-ment team and took steps to ensurefull compliance with the newcorporate governance regulationsenacted in 2002. At the same time,we invested in information systemsto support effective corporate gov-ernance, maintain strong financialoversight, and improve our abilityto serve our customers.
Our financial results for 2002reflect the success of theseinvestments and validate ourgrowth strategy. During thisdifficult economic environment:
Quarterly sales increasedthroughout the year.
North American sales, whichhad been a source of weakness,began to rebound.
All three international geographicterritories achieved record sales,as well as our Plastic CardBusiness Unit.
Net income advanced 16.4%to $2.29 per diluted share on 5.7%sales growth to $475.0 million,as we leveraged higher sales toachieve increased gross profit andoperating margins. We improved ouralready enviable financial positionwith tighter management of workingcapital to generate $82.8 millionin free cash flow, a record forthe second consecutiveyear. We ended 2002with $348 million incash and investmentsand no long-term debt.
Just as our invest-ments throughout theeconomic downturn helped usachieve growth in 2002, they willalso have an enduring effect onZebra’s business and provide afoundation for further investment aswe look to 2003 and beyond. As wediscuss in the following pages ofthis annual report, this year wewill extend our product leadership
with a stream of new bar code,specialty, and plastic card printerproducts. Our plans also call forbuilding on our strategy to deliverapplications into high-growthvertical markets. And, we will makeadditional investments in peopleand infrastructure to generate fur-ther international sales growth.
Innovative products.Industry-leading support.
Unprecedented financialstrength. Leadingindustry brand. Withthese attributes, Zebra
is attracting new busi-ness opportunities and new
customers who are assured thatthe company will continue to growand succeed in delivering printingsolutions for business improvement.
I believe we are a strongercompany today than at any time inour company’s history. Because ofour ability to invest, we distancedourselves from the competition
and improved our ability to serveour customers better. Zebra’s man-agement team, product portfolio,infrastructure, and competitiveposition have never been as great.We have the financial resources toinvest in high-growth areas togain share, develop new markets,and make acquisitions to strengthenour competitive positions further.These elements make us confidentthat Zebra’s business strategy putsus firmly on the path to deliversustainable long-term growth andincreasing stockholder value.
Edward KaplanChairman and Chief Executive Officer
Zebra Technologies Corporation 2002 Annual Report | 3
STOCKHOLDER VALUE
• Zebra
• Nasdaq
• S&P 500
1997
: Q4
1998
: Q4
1999
: Q4
2000
: Q4
2001
: Q4
2002
: Q4
300%
250%
200%
150%
100%
50%
Stockholder wealth in Zebra Technologies increased 40% for
the two years through 2002. For the five-year period, Zebra's
stock appreciated 93%. If you had become a stockholder at
Zebra’s IPO in 1991, the value of your holding would have
increased 639%, compared with 150% for the stock market.
We enhancedour ability to
GROW and DELIVERs t o c k h o l d e r value over the
long term.
•
•
•

ProductL E A D E R S H I P
Innovation is at the heart of Zebra Technologies.
New products and new ways to connect enable
us to extend our leadership into growing
markets by building on our unmatched
reputation for reliability and durability.
We offer the industry’s broadest product
line and incorporate market-leading wireless
and security technologies to deliver real value
in specialty printing, business improvement
and compliance labeling applications.
Zebra bar code label printers,
software, and connectivity
technologies enable the
delivery of goods and services
more accurately and with
greater efficiency. Routing
and tracking operations rely
L I N K I N G T H E S U P P L Y C H A I N
on automated information
exchange, facilitated by
network-addressable bar
code printers, to move
goods from production
and inventory all the way
to customer delivery. P L A S T I C C A R D P R I N T I N G
Personalized identification cards
printed on Zebra plastic card
printers are used for a broad
range of purposes, from simple
membership cards to controlled
access in sophisticated, high-
security environments. Overt
and covert technologies add
new levels of security to Zebra
printing systems and supplies.
4 | Zebra Technologies Corporation 2002 Annual Report
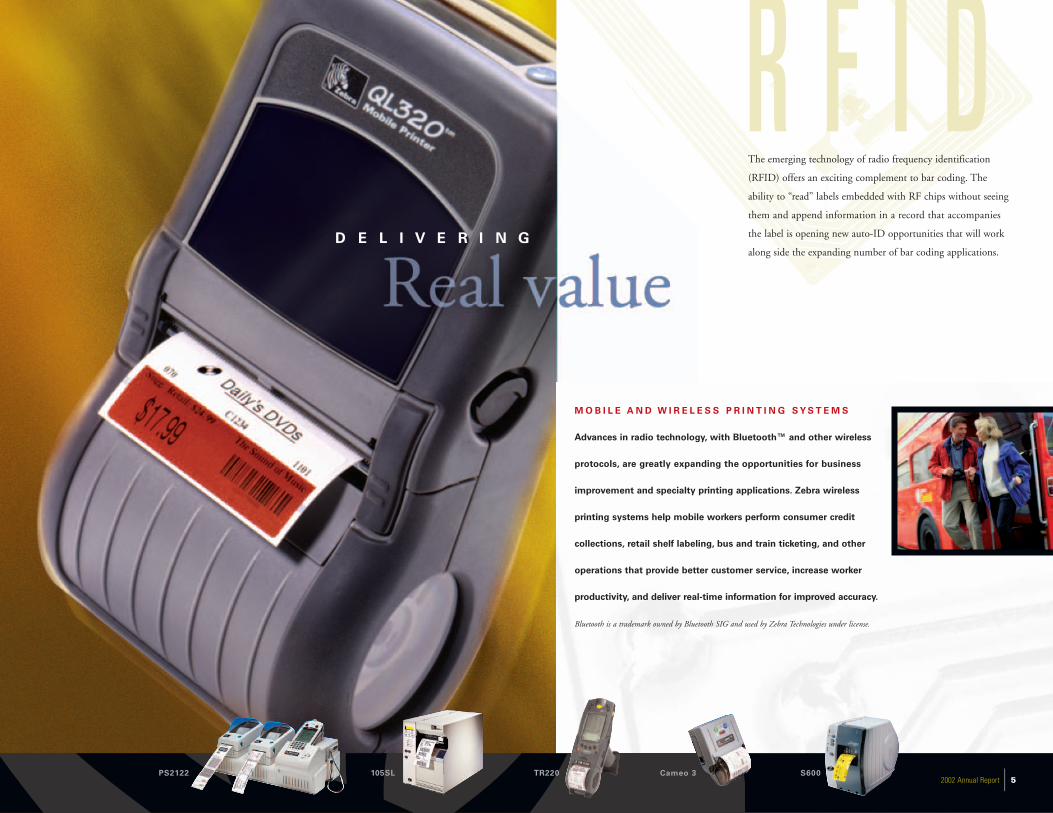
The emerging technology of radio frequency identification
(RFID) offers an exciting complement to bar coding. The
ability to “read” labels embedded with RF chips without seeing
them and append information in a record that accompanies
the label is opening new auto-ID opportunities that will work
along side the expanding number of bar coding applications.
R F I DD E L I V E R I N G
PS2122 105SL Cameo 3 S6002002 Annual Report | 5
TR220
M O B I L E A N D W I R E L E S S P R I N T I N G S Y S T E M S
Advances in radio technology, with Bluetooth™ and other wireless
protocols, are greatly expanding the opportunities for business
improvement and specialty printing applications. Zebra wireless
printing systems help mobile workers perform consumer credit
collections, retail shelf labeling, bus and train ticketing, and other
operations that provide better customer service, increase worker
productivity, and deliver real-time information for improved accuracy.
Bluetooth is a trademark owned by Bluetooth SIG and used by Zebra Technologies under license.

E L E C T R O N I C S
M A N U FA C T U R I N G
Small spaces need small
labels and even smaller bar
codes. Zebra’s 600 dpi
printers produce sharp bar
codes on a wide variety of
durable materials to ensure
accurate product ID during
production, and for subse-
quent warranty and product
authentication purposes.
Vertical M A R K E T F O C U S
Zebra is expanding its relationships with
channel partners to deliver high-growth
applications more effectively to targeted markets.
The company is enhancing its growth
opportunities by demonstrating the bottom-line
value of implementing printing solutions that
increase productivity, provide better customer
service, and strengthen safety and security.
S A F E T Y A N D S E C U R I T Y
Cards printed on Zebra plastic
card printers incorporating
digital photos, biometric infor-
mation, and other identification
technologies are one of numerous
solutions from Zebra to ensure
increased safety and more
effective security of people,
products, and property.
6 | Zebra Technologies Corporation 2002 Annual Report

H I G H G R O W T H
L I F E S C I E N C E S The life sciences supply chain increasingly relies on
the exceptional accuracy bar coding offers to minimize costly errors. With
the U.S. Food and Drug Administration taking positive steps to mandate the
use of bar coding, drug manufacturers are implementing unit-of-use marking
with bar codes, enabling health care facilities to conduct an automated and
reliable bedside match of medication and patient, identified by a bar coded
wristband. Prescription medicines are labeled more clearly with bar codes
to ensure proper dispensing, and bar coded specimen vials are identified,
tracked, and recorded more easily throughout the health care system.
P310 170xiIII Plus Supplies
and Software
2746e PA/PT4032002 Annual Report | 7

Global E X P A N S I O N
International Sales (in millions)
1998 - $134.7 2002 - $205.3
We continue to pursue international business
opportunities by expanding Zebra’s presence
in high-growth countries and regions.
In-country Zebra representatives are
successfully working with channel partners
to implement a broad range of solutions,
from important compliance and shipping
applications to emerging applications in retail,
transportation and postal delivery.
SP
AN
NI
NG
T
HE
G
LO
BE Our success in growing
international sales results from
our commitment to invest in the
scope of our global operations.
International Employees1998 - 221 2002 - 290
International Zebra Locations1998 - 9 2002 - 23
8 | Zebra Technologies Corporation 2002 Annual Report

E X T E N D I N G O U R
Q U E U E B U S T I N G
Retailers use mobile
printers equipped with
magnetic stripe readers in
stores and at entertain-
ment venues to speed
sales transactions and
ticketing during peak
times. Shorter checkout
lines increase customer
satisfaction and
minimize lost sales.
P O S TA L A P P L I C AT I O N S
Zebra is leveraging its strength
in bar code label printing for
small package delivery applica-
tions to help postal organizations
around the world become more
efficient in tracking parcels and
important mail. Mobile applica-
tions also are providing new
revenue opportunities for couriers.
I N T E R N A T I O N A L O P P O R T U N I T I E S
Global presence makes it attractive for multi-national companies
to do business with Zebra.The company’s financial resources give
it the ability to invest in the people and infrastructure to support
customers outside North America. As companies in developing
countries adopt bar coding, they increasingly turn to Zebra for
expertise in compliance and business improvement applications.
Zebra Technologies Corporation 2002 Annual Report | 9
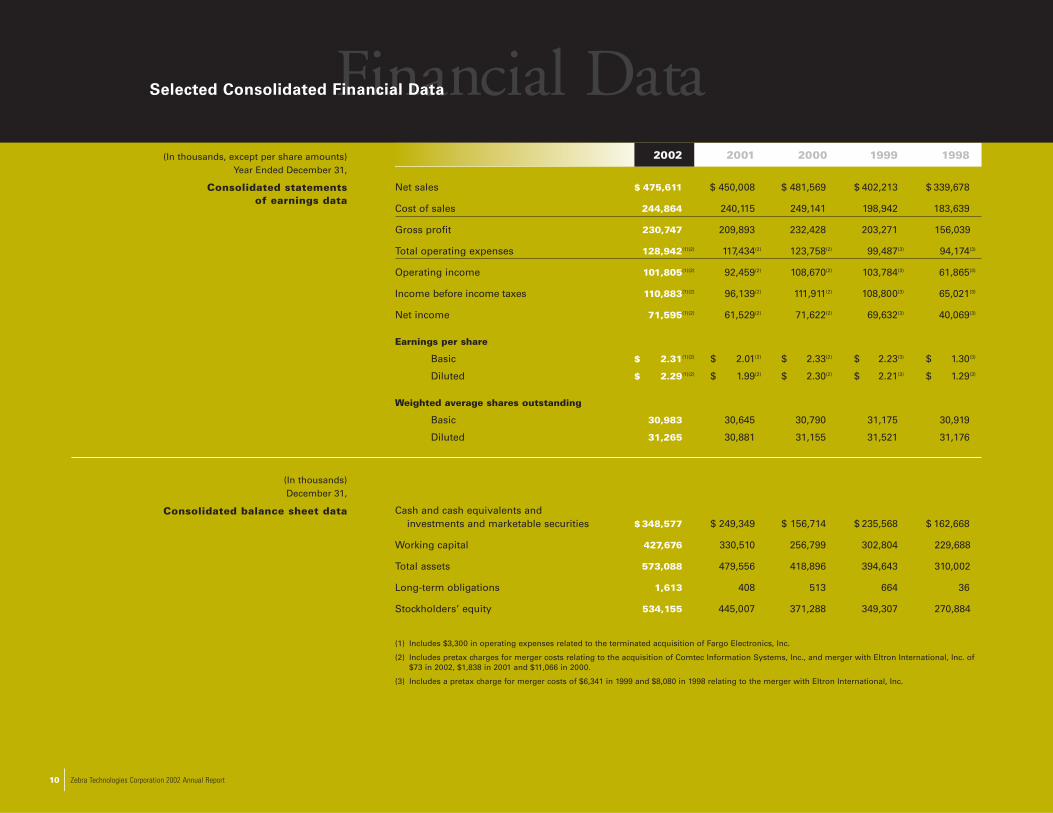
2002 2001 2000 1999 1998
Net sales $ 475,611 $ 450,008 $ 481,569 $ 402,213 $ 339,678
Cost of sales 244,864 240,115 249,141 198,942 183,639
Gross profit 230,747 209,893 232,428 203,271 156,039
Total operating expenses 128,942(1)(2) 117,434(2) 123,758(2) 99,487(3) 94,174(3)
Operating income 101,805(1)(2) 92,459(2) 108,670(2) 103,784(3) 61,865(3)
Income before income taxes 110,883(1)(2) 96,139(2) 111,911(2) 108,800(3) 65,021(3)
Net income 71,595(1)(2) 61,529(2) 71,622(2) 69,632(3) 40,069(3)
Earnings per share
Basic $ 2.31(1)(2) $ 2.01(2) $ 2.33(2) $ 2.23(3) $ 1.30(3)
Diluted $ 2.29(1)(2) $ 1.99(2) $ 2.30(2) $ 2.21(3) $ 1.29(3)
Weighted average shares outstanding
Basic 30,983 30,645 30,790 31,175 30,919
Diluted 31,265 30,881 31,155 31,521 31,176
Cash and cash equivalents and investments and marketable securities $348,577 $ 249,349 $ 156,714 $ 235,568 $ 162,668
Working capital 427,676 330,510 256,799 302,804 229,688
Total assets 573,088 479,556 418,896 394,643 310,002
Long-term obligations 1,613 408 513 664 36
Stockholders’ equity 534,155 445,007 371,288 349,307 270,884
(1) Includes $3,300 in operating expenses related to the terminated acquisition of Fargo Electronics, Inc.
(2) Includes pretax charges for merger costs relating to the acquisition of Comtec Information Systems, Inc., and merger with Eltron International, Inc. of $73 in 2002, $1,838 in 2001 and $11,066 in 2000.
(3) Includes a pretax charge for merger costs of $6,341 in 1999 and $8,080 in 1998 relating to the merger with Eltron International, Inc.
(In thousands, except per share amounts)Year Ended December 31,
Consolidated statements of earnings data
(In thousands)December 31,
Consolidated balance sheet data
Financial DataSelected Consolidated Financial Data
10 | Zebra Technologies Corporation 2002 Annual Report

DiscussionManagement’s Discussion and Analysis of Financial Condition and Results of Operations
Comparison of Years Ended December 31, 2002 and 2001
Sales by product category, related percent changes and percent of total sales for 2002 and 2001 were as follows:
Years Ended
December 31, December 31, Percent Percent of Percent of Product Category 2002 2001 Change Total Sales 2002 Total Sales 2001
Hardware $360,185 $339,895 6.0 75.7 75.6
Supplies 87,981 85,266 3.2 18.5 18.9
Service and software 23,301 19,336 20.5 4.9 4.3
Freight revenue 4,144 5,511 (24.8) 0.9 1.2
Total sales $475,611 $450,008 5.7 100.0 100.0
Sales to customers by geographic region, related percent changes, and percent of total sales for 2002 and 2001
were as follows:Years Ended
December 31, December 31, Percent Percent of Percent of Geographic Region 2002 2001 Change Total Sales 2002 Total Sales 2001
International $205,323 $180,053 14.0 43.2 40.0
North America 270,288 269,955 0.1 56.8 60.0
Total sales $475,611 $450,008 5.7 100.0 100.0
During 2001 and 2002, through the downturn in the
U.S. economy, the Company implemented its growth
strategy by introducing new products, expanding
international coverage, and creating new sales and
marketing programs. The Company’s investments in
product development resulted in a stream of product
introductions throughout this period. The Company
also placed Zebra sales representatives in international
territories deemed to have growth potential, thereby
allowing the Company to work more closely with its
channel partners in those regions. In addition, the
Company organized its sales and marketing efforts to
support a sales strategy that demonstrates the business
benefits associated with implementing bar code
labeling and specialty printing solutions. Management
believes that these investments contributed to the
Company’s sales growth in 2002.
In North America, the Company recorded positive sales
growth in the second, third and fourth quarters of 2002,
compared with the corresponding periods of 2001.
Overall, however, the slow U.S. economy continued
to limit sales growth of bar code label and receipt
printers to rates below the Company’s historical
average. Sales of supplies, specifically ribbons, were
affected by price pressure from increased international
competition particularly from Japan. Sales of supplies
nevertheless benefited from an increase in unit sales.
Management believes that the long-term outlook for
Zebra Technologies Corporation 2002 Annual Report | 11

bar code label and receipt printing in North America
remains favorable but is unable to determine at this
time when growth might return to historical levels
experienced before the 2001 downturn.
All three of the Company’s international regions —
Europe, Asia Pacific, and Latin America — had record
sales and contributed to the significant growth in
international sales in 2002. The Company’s increase of
the number of Zebra representatives in these regions,
including the formation of a sales team in Europe for
mobile printing solutions in 2001, was an important
factor in the growth of international sales. On a dollar-
volume basis, the largest increase occurred in the
Company’s European region. The strength of the British
pound and the euro versus the U.S. dollar increased
sales for the Company’s European region by approxi-
mately $5,565,000, compared with exchange rates that
prevailed during 2001. It is difficult for management to
accurately forecast the direction of foreign exchange
movements, and therefore, to estimate the impact of
foreign exchange rates on future financial results,
either positive or negative. Management believes
that international territories hold significant growth
opportunities for the Company and expects to continue
to invest in personnel and infrastructure to support
sales growth in these regions.
Gross profit was $230,747,000 for 2002, up 9.9% from
$209,893,000 for 2001. In addition, gross profit margin
increased to 48.5% from 46.6%. The major contributors
to the margin improvement were higher capacity
utilization related to the higher sales volume, product
cost reductions, and the effect of foreign exchange
movements. Management estimates that changes in
foreign exchange rates increased gross profit by
$4,377,000 in 2002.
Selling and marketing expenses increased 13.1% to
$56,176,000, or 11.8% of net sales, from $49,688,000,
or 11.0% of net sales. Most of the change can be
attributed to an increase in additional headcount and
performance-related payroll expenses, specifically
commissions and bonuses related to the Company’s
growth in net sales. Trade show, travel and consulting
expenses were also higher compared with 2001.
During 2002, the Company identified vertical markets
that management believes offer growth opportunities
for Zebra’s printing and connectivity technologies. To
this end, management expects that a higher level of
selling and marketing infrastructure will be required
to access these markets and achieve the Company’s
growth objectives within them, compared with Zebra’s
historical business model. Increased staffing occurred
in marketing functions in 2002 to enable the Company
to access vertical markets. Management expects that
selling and marketing expenses in future periods will
reflect the higher costs related to generating business
within vertical markets.
Research and development expenses for 2002 were
$29,210,000, up 3.6% from $28,184,000 for 2001, and
represented 6.1% of net sales in 2002 versus 6.3% in
2001. Printer products introduced over an 18-month
period that ended December 31, 2002 accounted for
approximately 22% of printer sales for 2002, compared
with 20% for the comparable period ending
December 31, 2001. Higher project and personnel
expenses were partially offset by lower expenditures for
consulting services. The Company considers its ability to
develop and introduce new products to be a significant
competitive factor. Accordingly, management expects
to continue high levels of expenditures on the develop-
ment of a broad range of printers and related items.
General and administrative expenses increased
19.1% to $38,689,000 from $32,491,000. As a percentage
of net sales, general and administrative expenses
increased to 8.1% from 7.2%. The Company had higher
bonus payments related to the growth in net sales. It
also incurred additional consulting expenses for the
development and implementation of growth strategies,
as well as higher expenditures on information systems
and insurance.
12 | Zebra Technologies Corporation 2002 Annual Report

During 2002, Zebra recorded $1,494,000 in amortization
of intangible assets, compared with $5,233,000 for
2001. During the first quarter of 2002, Zebra imple-
mented SFAS No. 142, Goodwill and Other Intangible
Assets, which eliminates the requirements to amortize
intangible assets with indefinite lives and goodwill
with a requirement for an annual impairment test.
SFAS No. 142 also establishes requirements for iden-
tifiable intangible assets. As a result, during the first
quarter Zebra reclassified $21,272,000 of intangible
assets into goodwill, as such assets, which included
assembled workforce and customer lists, did not meet
the criteria for recognition as an asset apart from
goodwill under SFAS No. 142. Operating income for
2001 includes $3,835,000 of amortization of goodwill
and other intangible assets that are not included in the
2002 results in conjunction with the implementation
of SFAS No. 142.
Also in the first quarter of 2002, the Company
terminated the acquisition agreement and tender offer
in which the Company would acquire all outstanding
shares of common stock (including associated rights to
purchase preferred stock) of Fargo Electronics, Inc. for
$7.25 per share in cash. In connection with the termi-
nation, the Company recorded $3,300,000 in expenses
for acquisition costs that would otherwise have been
capitalized. There was no such expense in 2001.
The Company incurred merger costs of $73,000 in
2002 and $1,838,000 in 2001. These costs related to
the acquisition of Comtec Information Systems in
April 2000. Management expects that future periods
will have no further merger costs related to acquisitions
completed prior to the date of this report. In the event
of future acquisitions, management expects to record
merger costs related to those acquisitions, the amount
of which cannot be determined at this time.
Investment income was $10,004,000 for 2002, an
increase of 84.6% from $5,419,000 for 2001. Favorable
investment income was a result of a $1,953,000 pre-
tax gain on the sale of 585,000 shares of common
stock of Fargo Electronics, in addition to the absence
of a $2,242,000 pre-tax write-down of a long-term
investment that occurred in 2001. The write-down
occurred because the decline in the asset’s value was
viewed as other than temporary. This write-down
reduced 2001 diluted earnings by $0.05 per share. The
Company made an additional write-down of $193,000
for this investment in 2002.
Income before income taxes increased 15.3% to
$110,883,000 from $96,139,000. As a percentage of net
sales, income before income taxes increased to 23.3%
from 21.4%.
The effective income tax rate for 2002 was 35.4%
versus 36.0% in 2001. This change is the result of
implementing tax minimization strategies during the
third quarter of 2002. Management expects that these
strategies will allow the Company to remain at a
35.0% effective tax rate in future periods.
Net income of $71,595,000, or $2.29 per diluted share,
for 2002 was up 16.4% from $61,529,000, or $1.99 per
diluted share, for 2001.
Z E B R A T E C H N O L O G I E S C O R P O R A T I O N
Zebra Technologies Corporation 2002 Annual Report | 13

Comparison of Years Ended December 31, 2001 and 2000
Sales by product category, related percent changes and percent of total sales for 2001 and 2000 were as follows:
Years Ended
December 31, December 31, Percent Percent of Percent of Product Category 2001 2000 Change Total Sales 2001 Total Sales 2000
Hardware $339,895 $378,093 (10.1) 75.6 78.5
Supplies 85,266 81,045 5.2 18.9 16.8
Service and software 19,336 16,659 16.1 4.3 3.5
Freight revenue 5,511 5,772 (4.5) 1.2 1.2
Total sales $450,008 $481,569 (6.6) 100.0 100.0
Sales to customers by geographic region, related percent changes, and percent of total sales for 2001 and 2000
were as follows:Years Ended
December 31, December 31, Percent Percent of Percent of Geographic Region 2001 2000 Change Total Sales 2001 Total Sales 2000
International $180,053 $179,989 0.0 40.0 37.4
North America 269,955 301,580 (10.5) 60.0 62.6
Total sales $450,008 $481,569 (6.6) 100.0 100.0
The decline in sales was primarily related to softness
in sales of bar code label and receipt printers in
North America from deteriorating economic conditions
in the U. S., specifically in the manufacturing and
technology sectors. A full year’s sales of mobile
printing systems as a result of the Comtec acquisition,
compared with only three quarters in 2000, partially
offset the decline from this weakness.
The decline in North American sales was a result of
the slowdown in the U.S. economy, which restricted
sales of bar code label and receipt printers in North
America. This slowdown began in 2000 and became
more severe in 2001.
International sales for 2001 showed virtually no
growth. Growth in the Company’s European region
to a record level resulted from the formation of a
team dedicated to the sale of mobile printing systems
and sales expansion in Eastern Europe. This growth
was offset by sales declines in Latin America and
Asia Pacific. The strength of the U.S. dollar versus
the British pound and the euro reduced sales for
the Company’s European region by approximately
$2,976,000, compared with exchange rates that
prevailed during 2000.
14 | Zebra Technologies Corporation 2002 Annual Report

Gross profit was $209,893,000 for 2001, down 9.7%
from $232,428,000 for 2000. In addition, gross profit
margin declined to 46.6% from 48.3%. Lower produc-
tion volumes and the resulting decline in manufacturing
capacity utilization had the predominant effect on the
gross profit and gross profit margin declines.
Selling and marketing expenses increased 2.9% to
$49,688,000, or 11.0% of net sales, from $48,306,000,
or 10.0% of net sales. During 2001, the Company
continued to invest in demand-generating activities
to support long-term growth. For 2001, higher
expenditures for personnel, market research and
co-op activities were partially offset by declines in
travel and entertainment and other expenses.
Research and development expenses for 2001 were
$28,184,000, up 5.4% from $26,746,000 for 2000, and
represented 6.3% of net sales in 2001 versus 5.6% in
2000. Lower project expenses partially offset higher
expenditures related to engineering personnel and
consulting services.
General and administrative expenses declined 3.3% to
$32,491,000 from $33,594,000. As a percentage of net
sales, general and administrative expenses increased
to 7.2% from 7.0%. Higher expenditures on information
systems were partially offset by expense declines for
personnel-related expenses from benefits and taxes,
as well as lower expenditures on outside services for
recruiting and consulting.
Amortization of intangible assets totaled $5,233,000,
compared with $4,046,000 for 2000. The increase was
due to a full year’s amortization of intangible assets
related to the Comtec acquisition, compared with
three quarters in 2000.
As part of the Comtec acquisition, the Company
acquired printer and wireless technology. A portion
of the purchase price was attributed to acquired
in-process technology, as the development work
associated with the projects had not yet reached
technological feasibility and was believed to have no
alternative future use. The Company assessed the
fair value of the acquired in-process technology
using an income approach. During the second quarter
of 2000, the Company recorded a $5,953,000 charge
to write off this acquired in-process technology.
There was no such charge in 2001.
The Company incurred merger costs of $1,838,000 in
2001 and $5,113,000 in 2000. These costs related to
the merger with Eltron International, Inc. in October
1998, which was accounted for as pooling-of-interests,
and the Comtec acquisition. These costs exclude
certain direct costs of the Comtec acquisition, which
were not included as a portion of the purchase price
or recorded at the time of the transaction. In 2001,
these costs primarily consisted of expenditures on
information technology infrastructure to integrate the
Comtec and Eltron operations.
Investment income was $5,419,000 for 2001, a
decrease of 52.2% from $11,345,000 for 2000. Lower
investment returns on invested balances contributed
to the decline. In addition, in the third quarter of
2001, the Company recorded a $2,242,000 pre-tax
write-down of a long-term investment, in which the
decline in value was viewed as other than temporary.
This write-down reduced 2001 diluted earnings by
$0.05 per share.
Interest expense and other expense, net, for 2001
totaled $1,739,000, compared with $8,104,000 in
2000. The 78.5% decline was primarily attributable to
the effectiveness of currency hedging strategies to
minimize the effects of foreign currency transactions,
which the Company implemented during the second
half of 2000. In 2001, losses from foreign currency
transactions on the value of euro-denominated cash
deposits and receivables from customers and pound
sterling-denominated receivables from the Company’s
U.K. subsidiary totaled $896,000, compared with
$6,032,000 for 2000.
Income before income taxes decreased 14.1% to
$96,139,000 from $111,911,000. As a percentage of net
sales, income before income taxes declined to 21.4%
from 23.2%.
Net income of $61,529,000, or $1.99 per diluted share,
for 2001 was down 14.1% from $71,622,000, or $2.30
per diluted share, for 2000.
Z E B R A T E C H N O L O G I E S C O R P O R A T I O N
Zebra Technologies Corporation 2002 Annual Report | 15

Critical Accounting Policies and Estimates
Management prepared the consolidated financial
statements of Zebra Technologies Corporation in
conformity with accounting principles generally
accepted in the United States. Accordingly, the
consolidated financial statements require certain
estimates, judgments and assumptions, which are
believed to be reasonable, based upon the information
available. These estimates and assumptions affect
the reported amounts of assets and liabilities at the
date of the financial statements and the reported
amounts of sales and expenses during the periods
presented. The following accounting policies comprise
those that management believes are the most critical
to aid in fully understanding and evaluating the
Company’s reported financial results.
Valuation of Long-Lived and
Intangible Assets and Goodwill
Management assesses the impairment of identifiable
intangibles, long-lived assets and related goodwill
and enterprise-level goodwill whenever events or
changes in circumstances indicate that the carrying
value may not be recoverable. Factors considered
important to possibly trigger an impairment review
consist of:
• significant underperformance relative to expected
historical or projected future operating results
• significant changes in the manner of use of the
acquired assets or the strategy for the overall business
• significant negative industry or economic trends
• significant decline in Zebra’s stock price for a
sustained period
• significant decline in market capitalization relative
to net book value
When it is determined that the carrying value of
intangibles, long-lived assets and related goodwill
and enterprise-level goodwill may not be recoverable
based upon the existence of one or more of the above
indicators of impairment, management measures any
impairment based on a projected discounted cash
flow method using a discount rate determined by
management to be commensurate with the risk
inherent in the current business model. Net intangible
assets, long-lived assets, and goodwill amounted to
$97,473,000 as of December 31, 2002.
In 2002, SFAS No. 142, Goodwill and Other Intangible
Assets, became effective. As a result, the Company
ceased amortizing approximately $54,455,000 of
goodwill, including existing intangible assets that
were not considered identifiable under SFAS No. 142.
The Company recorded approximately $3,835,000 of
amortization on these amounts during 2001 and
would have recorded approximately $3,835,000 of
amortization during 2002. In lieu of amortization, the
Company was required to perform an initial impairment
review of its goodwill in 2002 and an annual impairment
review thereafter.
The Company completed its initial impairment review
during the second quarter of 2002. Considering the
share price of the Company’s stock among other
measures of fair value, this impairment test indicated
that the fair value of the Company’s goodwill was sig-
nificantly in excess of the carrying value. Consequently,
no impairment charge was recorded.
Revenue Recognition
Zebra recognizes revenue from product sales at the
time of shipment and passage of title. Certain cus-
tomers have the right to return products that do not
function properly within a limited time after delivery.
The Company regularly monitors and tracks product
returns and records a provision for the estimated
amount of such future returns, based on historical
experience and any notification received of pending
returns. While such returns have historically been
within expectations and the provisions established,
the Company cannot guarantee that it will continue to
experience return rates consistent with historical pat-
terns. Any significant increase in product failure rates
and the resulting credit returns could have a material
adverse effect on operating results for the periods in
which such returns materialize. A 10% increase (decrease)
in returns above historical levels would decrease
(increase) operating income by approximately 0.3%.
16 | Zebra Technologies Corporation 2002 Annual Report

Accounts Receivable
The Company has established standardized credit
granting and review policies and procedures for all
customer accounts receivable. These policies and
procedures include credit reviews of all new customer
accounts to establish credit limits and payment terms
based on available credit information, which may
include customer financial statements, bank and trade
references, credit rating agency information and other
credit related information that becomes available.
Additionally, the Company performs ongoing credit
evaluations of current customers and adjusts credit
limits based upon payment history and the customer’s
current credit worthiness, as determined by a review
of current credit information. The Company has estab-
lished regional credit functions, reporting directly to
the corporate financial officers, to manage the credit
granting, review, and collections processes.
Over the last three years, quarter-end accounts
receivable balances have ranged from 53.0 to 68.5
days sales outstanding. As of December 31, 2002,
accounts receivable before provisions for uncollectible
accounts were $72,535,000, or 53.0 days of sales.
Similarly, past due accounts receivable are also at the
low end of historical ranges as of December 31, 2002.
The historically low balance, high quality, accounts
receivable portfolio is the result of improvements to
credit and collections policies, procedures, and
staffing implemented during 2002.
The Company maintains a provision for estimated
credit losses based upon historical experience and
any specific customer collection issues. Over the last
three years, accounts receivable reserves have been in
the range of 1.7% to 2.9% of total accounts receivable.
Accounts receivable reserves as of December 31,
2002 were $1,236,000, or 1.7% of the balance due.
Management feels this reserve level is appropriate
given the relatively low accounts receivable balances
combined with the quality of the portfolio as of
December 31, 2002. While credit losses have histori-
cally been within expectations and the provisions
established, management cannot guarantee that the
Company will continue to experience credit loss
consistent with historical experience.
Zebra’s accounts receivable portfolio is diversified
among a large number of customers and geographic
markets. No individual customer exceeds 9% of
gross accounts receivable balances as of December 31,
2002, and only one customer exceeds 5% of gross
accounts receivable as of December 31, 2002.
Included in accounts receivable is an account with a
$2,100,000 disputed balance. Although management
believes this account is fully collectible, a $481,000
accrued liability has been recorded to cover the
estimated cost of collection. If the actual collection,
net of costs, is less than $1,619,000, operating income
would be reduced.
Inventories
The Company values its inventories at the lower of
the actual cost to purchase or manufacture, or the
current estimated market value. Management regularly
reviews inventory quantities on hand and records a
provision for excess and obsolete inventory based
primarily on estimated forecasts of product demand and
production requirements for the subsequent twelve
months. A significant increase in the demand for
Zebra’s products could result in a short-term increase
in the cost of inventory purchases, while a significant
decrease in demand could result in an increase in
the amount of excess inventory quantities on hand.
Additionally, the Company’s estimates of future product
demand may prove to be inaccurate, in which case
the provision required for excess and obsolete inventory
may be understated or overstated. In the future, if
inventories are determined to be overvalued, the
Company would be required to recognize such costs
in cost of goods sold at the time of such determination.
Likewise, if inventories are determined to be under-
valued, the Company may have over-reported cost of
goods sold in prior periods and would be required to
recognize such additional operating income at the
time of sale. The Company makes every effort to ensure
the accuracy of its forecasts of future product demand;
however any significant unanticipated changes in
demand or technological developments could have a
significant impact on the value of inventories and
reported operating results.
Z E B R A T E C H N O L O G I E S C O R P O R A T I O N
Zebra Technologies Corporation 2002 Annual Report | 17

Over the last three years, the Company’s reserves for
excess and obsolete inventory have ranged from
9.7% to 12.9% of gross inventory. As of December 31,
2002, reserves for excess and obsolete inventory were
$5,075,000, or 11.5% of gross inventory.
Reserve for Tax Litigation and Tax Audits
The Company has recorded the estimated liability
related to certain pending tax litigation and tax audits
based on management’s estimates of the probable
range of loss. As additional information becomes
available, management will assess the potential liability
related to pending litigation and tax audits, and revise
estimates. Such revisions in the estimates of potential
future liabilities could materially affect the results of
operations and financial position.
The Company is litigating a dispute over a 1998 tax
assessment in the amount of approximately $2,000,000,
including penalties and interest, with the Illinois
Department of Revenue for the years 1993 through
1995. The case was filed by the Company in the District
Court of Illinois and tried during November 2000.
The decision from the court was unfavorable to the
Company but has been appealed. The Company does
not expect to know the result of the appeal until some
time in the second half of 2003.
The Illinois Department of Revenue has also examined
the Company’s tax returns for the years 1996 and
1997, and issued an assessment for $3,200,000. The
issues involved in this audit are identical to those
involved in the 1993 to 1995 returns being litigated.
The Company has paid this assessment under protest.
Management believes that the ultimate outcome of
this assessment will be consistent with the 1993 to
1995 litigation under appeal.
In addition, the Illinois Department of Revenue has not
yet examined the Company’s income tax returns for 1998
through 2001, but has a right to do so. Management
believes that if such an audit occurred, the Illinois
Department of Revenue would raise issues similar to
those raised during the 1993 through 1997 audits.
The Company recorded tax reserves equal to manage-
ment’s estimate of the likely outcome of the Illinois
Department of Revenue litigation for 1993 to 1995, the
audit assessment for 1996 and 1997, and the unaudited
1998 through 2001 returns. If the Company loses all
issues on appeal, the Company would record an
additional one-time tax expense of $1,300,000. If the
Company wins all issues on appeal, the Company
would record a reduction to tax expense of $4,400,000.
For additional information respecting this matter, see
Note 9 “Income Taxes” in the Notes to Consolidated
Financial Statements annexed to this report.
Liquidity and Capital Resources
Internally generated funds from operations are the
primary source of liquidity for the Company, largely
as a result of the Company’s sales and profitability,
control over working capital and relatively low require-
ments for purchases of property and equipment. As
of December 31, 2002, the Company had $348,577,000
in cash and cash equivalents and investments and
marketable securities, compared with $249,349,000 at
the end of 2001. Capital expenditures totaled $8,481,000
in 2002, $9,613,000 in 2001, and $8,947,000 in 2000.
Management believes that existing capital resources
and funds generated from operations are sufficient to
finance anticipated capital requirements.
For 2002, net cash used in operating activities was
$13,393,000, which included increases in investments
and marketable securities of $108,498,000 and
accounts receivable of $1,629,000, offset by a decline
in inventories and other assets totaling $6,891,000
and an increase in accrued liabilities of $2,564,000.
These changes are net of the effect of foreign exchange
rates on cash. Depreciation and amortization totaled
$12,259,000. Net cash used in investing activities
was used exclusively for $8,481,000 in purchases of
property and equipment, and $13,032,000 in net cash
provided by financing activities was substantially
generated by proceeds from the exercise of stock
options. Cash and cash equivalents decreased by
$7,910,000 for the year.
18 | Zebra Technologies Corporation 2002 Annual Report

Net cash provided by operating activities totaled
$14,076,000 in 2001, which included an increase in invest-
ments and marketable securities of $78,874,000 and
relatively significant declines of $16,223,000, or 19.3%,
in accounts receivable and of $17,284,000, or 30.4%, in
inventories. Both declines exclude the effect of foreign
exchange rates on cash. Depreciation and amortization
totaled $15,691,000. Net cash used in investing activities
was used exclusively for $9,613,000 in purchases of
property and equipment, and $8,863,000 in net cash pro-
vided by financing activities was substantially generated
by proceeds from the exercise of stock options.
Net cash provided by operating activities totaled
$132,565,000 in 2000. During the year, the Company
reduced its investments and marketable securities by
$60,860,000 as partial funding for the Comtec acquisi-
tion. The Company also recorded increases of $7,106,000
in accounts receivable and $7,179,000 in inventories.
Depreciation and amortization totaled $14,383,000.
Investing activities used $97,423,000 in cash in 2000.
In addition to the $8,947,000 used for purchases of
property and equipment, the Company used $88,476,000
for the Comtec acquisition, net of cash acquired. For
2000, the Company used $48,675,000 for financing
activities, including $55,505,000 for the purchase of
treasury stock. Proceeds of $6,653,000 from the exercise
of stock options had a positive effect on net cash
used in financing activities. For 2000, cash and cash
equivalents declined by $15,041,000.
Recently Issued Accounting Pronouncements
In June 2001, the FASB issued SFAS No. 143,
Accounting for Asset Retirement Obligations. SFAS 143
addresses financial accounting and reporting for
obligations associated with the retirement of tangible
long-lived assets and for the associated asset retirement
costs. SFAS 143 must be applied starting with fiscal
years beginning after June 15, 2002. Management does
not believe the adoption of SFAS No. 143 will have a
significant impact on the Company’s consolidated
financial statements.
In April 2002, the FASB issued SFAS No. 145,
Rescission of FASB Statements No. 4, 44, and 64,
Amendment of FASB Statement No. 13, and
Technical Corrections. SFAS 145 requires that gains
and losses from extinguishment of debt be classified
as extraordinary items only if they meet the criteria
in Accounting Principles Board Opinion No. 30.
Applying the provisions of Opinion No. 30 will
distinguish transactions that are part of an entity’s
recurring operations from those that are unusual
and infrequent and meet the criteria for classification
as an extraordinary item. SFAS No. 145 is effective
beginning January 1, 2003. Management does not
believe the adoption of SFAS No. 145 will have a
significant impact on the Company’s consolidated
financial statements.
In July 2002, the FASB issued SFAS No. 146, Accounting
for Costs Associated with Exit or Disposal Activities.
This standard requires companies to recognize costs
associated with exit or disposal activities when they
are incurred rather than at the date of a commitment
to an exit or disposal plan. Examples of costs covered
by the standard include lease termination costs and
certain employee severance costs that are associated
with a restructuring, discontinued operation, plant
closing, or other exit or disposal activity. This standard
will be applied prospectively to exit or disposal activities
initiated after December 31, 2002. Management does
not believe the adoption of SFAS No. 146 will have a
significant impact on the Company’s consolidated
financial statements.
Risk Factors
Investors should carefully consider the risks,
uncertainties and other factors described below, as
well as other disclosures in Management’s Discussion
and Analysis of Financial Condition and Results of
Operations, because they could have a material
adverse effect on the Company’s business, financial
condition, operating results, and growth prospects.
Z E B R A T E C H N O L O G I E S C O R P O R A T I O N
Zebra Technologies Corporation 2002 Annual Report | 19

The Company could encounter difficulties in any
acquisition it undertakes, including unanticipated
integration problems and business disruption.
Acquisitions could also dilute stockholder value and
adversely affect operating results. Proposed acquisitions
that are not consummated may result in the write-off
of certain acquisition costs.
The Company may acquire or make investments in
other businesses, technologies, services or products.
The process of integrating any acquired business,
technology, service or product into operations may
result in unforeseen operating difficulties and expendi-
tures. Integration of an acquired company also may
consume considerable management time and attention,
which could otherwise be available for ongoing devel-
opment of the business. The expected benefits of any
acquisition may not be realized. Moreover, the Company
may be unable to identify, negotiate or finance future
acquisitions successfully. Future acquisitions could
result in potentially dilutive issuances of equity secu-
rities or the incurrence of debt, contingent liabilities or
amortization expenses. To the extent that a proposed
acquisition is not consummated, the Company may
be required to write off certain costs associated with
the acquisition, which could be significant.
The Company may not be able to continue to develop
products to address user needs effectively in an
industry characterized by rapid technological change.
To be successful, Zebra must adapt to rapidly changing
technological and application needs by continually
improving its products as well as introducing new
products and services to address user demands.
Zebra’s industry is characterized by:
• rapidly changing technology
• evolving industry standards
• frequent new product and service introductions
• evolving distribution channels
• changing customer demands
Future success will depend on the Company’s ability
to adapt in this rapidly evolving environment. The
Company could incur substantial costs if it has to
modify its business to adapt to these changes, and
may even be unable to adapt to these changes.
The Company competes in a highly competitive market,
which is likely to become more competitive. Competitors
may be able to respond more quickly to new or emerg-
ing technology and changes in customer requirements.
Zebra faces significant competition in developing
and selling its systems. Principal competitors have
substantial marketing, financial, development and
personnel resources. To remain competitive, the
Company believes it must continue to provide:
• technologically advanced systems that satisfy the
user demands;
• superior customer service;
• high levels of quality and reliability, and
• dependable and efficient distribution networks
Zebra cannot assure it will be able to compete
successfully against current or future competitors.
Increased competition in printers or supplies may
result in price reductions, lower gross profit margins
and loss of market share, and could require increased
spending on research and development, sales and
marketing and customer support. Some competitors
may make strategic acquisitions or establish cooper-
ative relationships with suppliers or companies that
produce complementary products. Any of these
factors could reduce the Company’s earnings.
20 | Zebra Technologies Corporation 2002 Annual Report

The inability to protect intellectual property could
harm the Company’s reputation, and its competitive
position may be materially damaged.
Zebra’s intellectual property is valuable and provides
the Company with certain competitive advantages.
Copyrights, patents, trade secrets and contracts are
used to protect these proprietary rights. Despite these
precautions, it may be possible for third parties to
copy aspects of the Company’s products or, without
authorization, to obtain and use information which
Zebra regards as trade secrets.
Zebra sells a significant portion of its products
internationally and purchases important components
from foreign suppliers. These circumstances create a
number of risks.
The Company sells a significant amount of its products
to customers outside the United States. Shipments
to international customers are expected to continue
to account for a material portion of net sales. Risks
associated with sales and purchases outside the
United States include:
• Fluctuating foreign currency rates could restrict
sales, or increase costs of purchasing, in foreign
countries.
• Foreign governments may impose burdensome
tariffs, quotas and taxes or other trade barriers.
• Political and economic instability may reduce demand
for our products, or put our foreign assets at risk.
• Restrictions on the export or import of technology
may reduce or eliminate the ability to sell in or
purchase from certain markets.
• Potentially limited intellectual property protection in
certain countries, such as China, may limit recourse
against infringing products or cause the Company to
refrain from selling in certain geographic territories.
• Staffing and managing international operations may
be unusually difficult.
• The Company may not be able to control
international distributors working on its behalf.
Economic factors, which are outside the Company’s
control, could lead to deterioration in the quality of
the Company’s accounts receivables.
The Company sells its products to customers in the
United States and several other countries around the
world. Sales are typically made on unsecured credit
terms, which are generally consistent with the prevailing
business practices in a given country. A deterioration
of economic or political conditions in a country could
impair Zebra’s ability to collect on receivables in the
affected country.
Infringement on the proprietary rights of others could
put the company at a competitive disadvantage, and any
related litigation could be time consuming and costly.
Third parties may claim that Zebra violated their
intellectual property rights. To the extent of a violation
of a third party’s patent or other intellectual property
right, the Company may be prevented from operating
its business as planned, and may be required to pay
damages, to obtain a license, if available, or to use a
non-infringing method, if possible, to accomplish its
objectives. Any of these claims, with or without merit,
could result in costly litigation and divert the attention
of key personnel.
The Company depends on the ongoing service of its
senior management and ability to attract and retain
other key personnel.
Future success of the Company is substantially
dependent on the continued service and continuing
contributions of senior management and other key
personnel. The loss of the service of any of executive
officer or other key employees could adversely affect
business. The Company neither has long-term
employment agreements with key personnel, nor
maintains key man life insurance policies on any of
its key employees.
The ability to attract, retain and motivate highly
skilled employees is important to Zebra’s long-term
success. Competition for personnel in the Company’s
industry is intense, and the Company may be unable
to retain key employees or attract, assimilate or
retain other highly qualified employees in the future.
Z E B R A T E C H N O L O G I E S C O R P O R A T I O N
Zebra Technologies Corporation 2002 Annual Report | 21
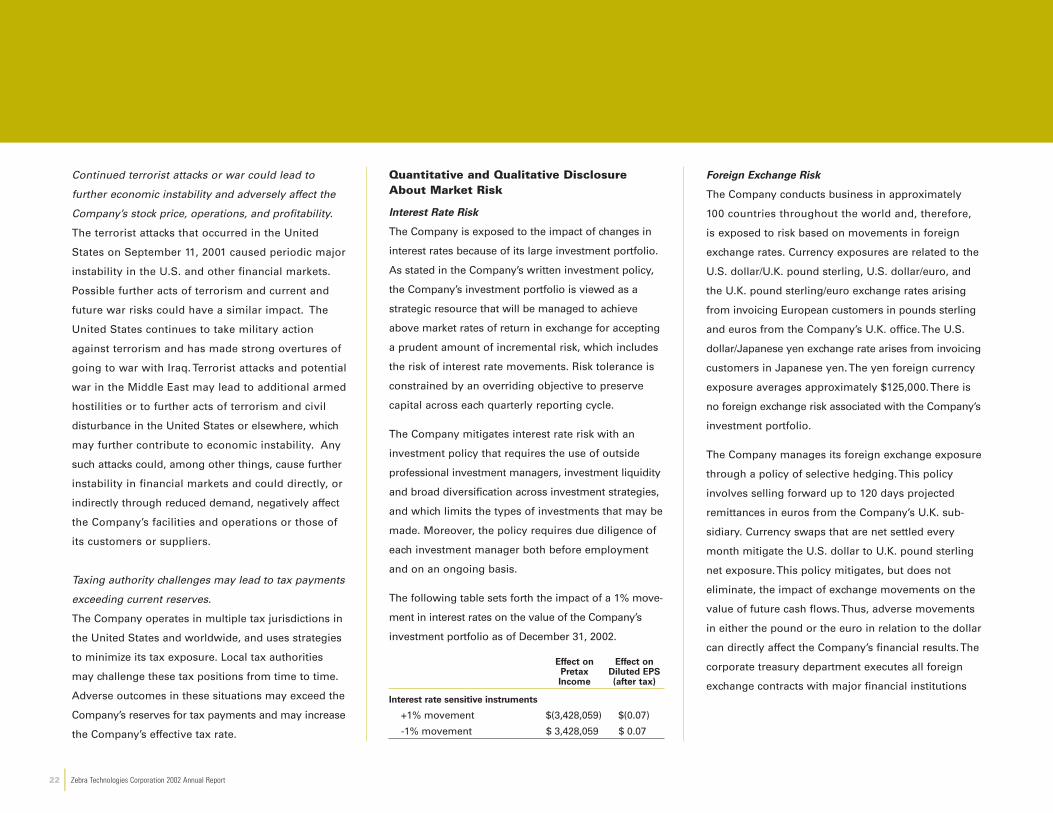
Continued terrorist attacks or war could lead to
further economic instability and adversely affect the
Company’s stock price, operations, and profitability.
The terrorist attacks that occurred in the United
States on September 11, 2001 caused periodic major
instability in the U.S. and other financial markets.
Possible further acts of terrorism and current and
future war risks could have a similar impact. The
United States continues to take military action
against terrorism and has made strong overtures of
going to war with Iraq. Terrorist attacks and potential
war in the Middle East may lead to additional armed
hostilities or to further acts of terrorism and civil
disturbance in the United States or elsewhere, which
may further contribute to economic instability. Any
such attacks could, among other things, cause further
instability in financial markets and could directly, or
indirectly through reduced demand, negatively affect
the Company’s facilities and operations or those of
its customers or suppliers.
Taxing authority challenges may lead to tax payments
exceeding current reserves.
The Company operates in multiple tax jurisdictions in
the United States and worldwide, and uses strategies
to minimize its tax exposure. Local tax authorities
may challenge these tax positions from time to time.
Adverse outcomes in these situations may exceed the
Company’s reserves for tax payments and may increase
the Company’s effective tax rate.
Quantitative and Qualitative DisclosureAbout Market Risk
Interest Rate Risk
The Company is exposed to the impact of changes in
interest rates because of its large investment portfolio.
As stated in the Company’s written investment policy,
the Company’s investment portfolio is viewed as a
strategic resource that will be managed to achieve
above market rates of return in exchange for accepting
a prudent amount of incremental risk, which includes
the risk of interest rate movements. Risk tolerance is
constrained by an overriding objective to preserve
capital across each quarterly reporting cycle.
The Company mitigates interest rate risk with an
investment policy that requires the use of outside
professional investment managers, investment liquidity
and broad diversification across investment strategies,
and which limits the types of investments that may be
made. Moreover, the policy requires due diligence of
each investment manager both before employment
and on an ongoing basis.
The following table sets forth the impact of a 1% move-
ment in interest rates on the value of the Company’s
investment portfolio as of December 31, 2002.
Effect on Effect onPretax Diluted EPS Income (after tax)
Interest rate sensitive instruments
+1% movement $(3,428,059) $(0.07)
-1% movement $ 3,428,059 $ 0.07
Foreign Exchange Risk
The Company conducts business in approximately
100 countries throughout the world and, therefore,
is exposed to risk based on movements in foreign
exchange rates. Currency exposures are related to the
U.S. dollar/U.K. pound sterling, U.S. dollar/euro, and
the U.K. pound sterling/euro exchange rates arising
from invoicing European customers in pounds sterling
and euros from the Company’s U.K. office. The U.S.
dollar/Japanese yen exchange rate arises from invoicing
customers in Japanese yen. The yen foreign currency
exposure averages approximately $125,000. There is
no foreign exchange risk associated with the Company’s
investment portfolio.
The Company manages its foreign exchange exposure
through a policy of selective hedging. This policy
involves selling forward up to 120 days projected
remittances in euros from the Company’s U.K. sub-
sidiary. Currency swaps that are net settled every
month mitigate the U.S. dollar to U.K. pound sterling
net exposure. This policy mitigates, but does not
eliminate, the impact of exchange movements on the
value of future cash flows. Thus, adverse movements
in either the pound or the euro in relation to the dollar
can directly affect the Company’s financial results. The
corporate treasury department executes all foreign
exchange contracts with major financial institutions
22 | Zebra Technologies Corporation 2002 Annual Report

only. Under no circumstances does the Company
enter into any type of foreign exchange contract for
trading or speculative purposes.
The following table sets forth the impact of a 1%
movement in the dollar/pound and dollar/euro rates
measured as if the Company did not engage in the
selective hedging practices described above. It is
based on the dollar/euro and dollar/pound exchange
rates and euro and pound denominated assets and
liabilities as of December 31, 2002.
Effect on Effect onPretax Diluted EPS Income (after tax)
Foreign exchange
Dollar/pound $ 96,582 $0.00
Dollar/euro $273,000 $0.01
Equity Price Risk
From time to time, the Company has taken direct
equity positions in companies. These investments
relate to potential acquisitions and other strategic
business opportunities. To the extent that it has a direct
investment in the equity securities of another company,
the Company is exposed to the risks associated with
such investments.
The Company currently employs three investment
managers, two of which manage portfolios of investment
funds (i.e. fund of funds). These investment funds use
a variety of investment strategies, some of which
involve the use of equity securities. Each investment
manager’s portfolio is designed to be market neutral,
although an individual fund within a portfolio may be
exposed to market risk. By policy, management limits
the amount of the Company’s investments in alternative
investment strategies to a maximum of 20% of the
total investment portfolio, with no single investment
exceeding $10,000,000.
The Company utilizes a “Value-at-Risk” (VaR) model
to determine the maximum potential one-day loss in
the fair value of its interest rate, foreign exchange and
equity price sensitive instruments.
The following table sets forth the impact of a 1%
change in the value of all equity positions held by the
Company’s investment managers.
Effect on Effect onPretax Diluted EPS Income (after tax)
Equity price sensitive instruments
+1% movement $ 183,112 $ 0.00
-1% movement $(183,112) $(0.00)
Z E B R A T E C H N O L O G I E S C O R P O R A T I O N
Zebra Technologies Corporation 2002 Annual Report | 23

(Amounts in thousands, except share and per share data)December 31,
Assets
Liabilities and stockholders’ equity
See accompanying notes to consolidated financial statements.
Balance SheetsConsolidated Balance Sheets
2002 2001
Current assets:Cash and cash equivalents $ 18,418 $ 26,328 Investments and marketable securities 330,159 223,021 Accounts receivable, net of allowance of $1,236 in 2002 and $1,975 in 2001 71,299 67,160 Inventories 38,066 39,923 Deferred income taxes 4,107 4,295 Prepaid expenses 2,531 3,611
Total current assets 464,580 364,338
Property and equipment at cost, less accumulated depreciation and amortization 39,462 40,742
Deferred income taxes 1,722 902
Goodwill 54,455 32,735
Other intangibles 3,556 26,693
Other assets 9,313 14,146
Total assets $573,088 $479,556
Current liabilities:Accounts payable $ 15,447 $ 14,414 Accrued liabilities 17,661 14,993 Short-term note payable 275 221 Current portion of obligation under capital lease 145 79 Income taxes payable 3,376 4,121
Total current liabilities 36,904 33,828
Obligation under capital lease, less current portion 605 408
Deferred rent 416 313
Other long-term liability 1,008 —
Total liabilities 38,933 34,549
Stockholders’ equity:
Preferred stock, $.01 par value; 10,000,000 shares authorized, none outstanding — —
Class A Common Stock, $.01 par value; 50,000,000 shares authorized, 27,660,466 and 26,018,743 shares issued, and 27,282,087 and 25,256,380 shares outstanding in 2002 and 2001, respectively 276 260
Class B Common Stock, $.01 par value; 28,358,189 shares authorized, 3,886,050 and 5,527,773 shares issued and outstanding in 2002 and 2001, respectively 39 55
Additional paid-in capital 56,478 59,012
Treasure stock, at cost (378,379 shares and 762,363 shares, respectively) (16,760) (35,482)
Retained earnings 494,150 422,555
Accumulated other comprehensive loss (28) (1,393)
Total stockholders’ equity 534,155 445,007
Total liabilities and stockholders’ equity $573,088 $479,556
24 | Zebra Technologies Corporation 2002 Annual Report

(Amounts in thousands, except per share data)Year Ended December 31,
See accompanying notes to consolidated financial statements.
2002 2001 2000
Net sales $ 475,611 $ 450,008 $ 481,569
Cost of sales 244,864 240,115 249,141
Gross profit 230,747 209,893 232,428
Operating expenses:
Selling and marketing 56,176 49,688 48,306
Research and development 29,210 28,184 26,746
General and administrative 38,689 32,491 33,594
Amortization of intangible assets 1,494 5,233 4,046
Acquired in-process technology — — 5,953
Costs related to terminated acquisition 3,300 — —
Merger costs 73 1,838 5,113
Total operating expenses 128,942 117,434 123,758
Operating income 101,805 92,459 108,670
Operating income (expense):
Investment income 10,004 5,419 11,345
Interest expense (319) (231) (1,120)
Other, net (607) (1,508) (6,984)
Total other income 9,078 3,680 3,241
Income before income taxes 110,883 96,139 111,911
Income taxes 39,288 34,610 40,289
Net income $ 71,595 $ 61,529 $ 71,622
Basic earnings per share $ 2.31 $ 2.01 $ 2.33
Diluted earnings per share $ 2.29 $ 1.99 $ 2.30
Basic weighted average shares outstanding 30,983 30,645 30,790
Diluted weighted average and equivalent shares outstanding 31,265 30,881 31,155
EarningsConsolidated Statements of Earnings
Zebra Technologies Corporation 2002 Annual Report | 25
Z E B R A T E C H N O L O G I E S C O R P O R A T I O N
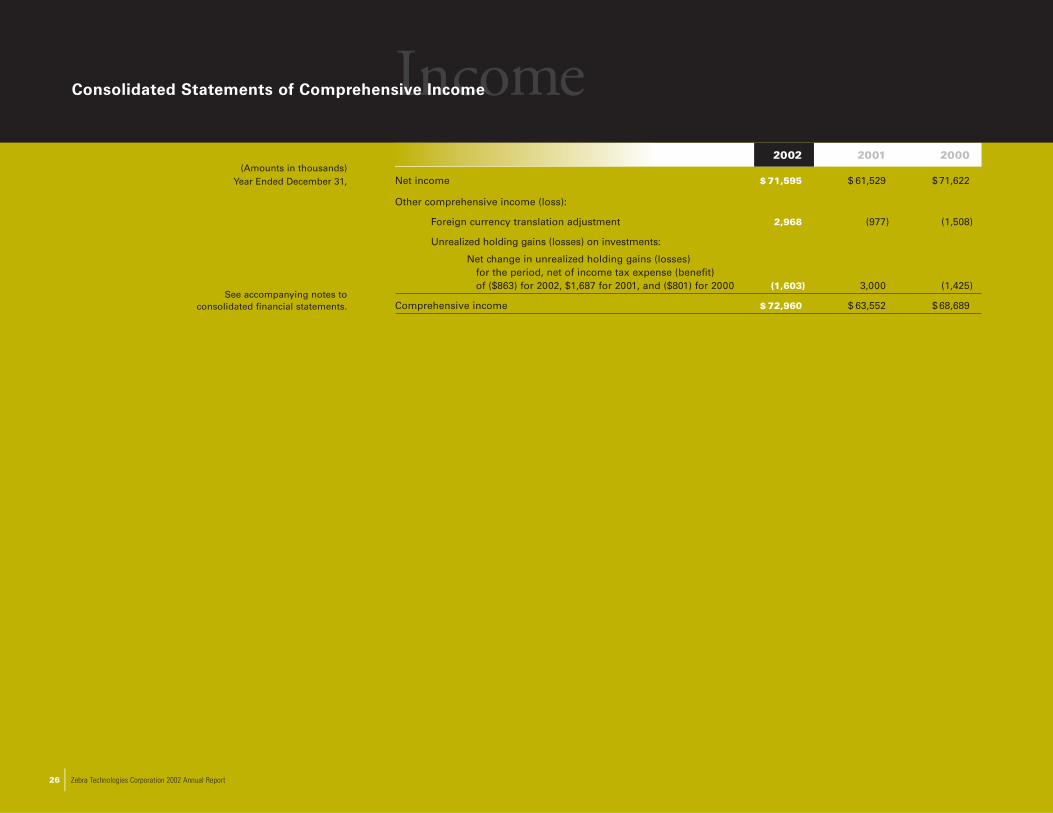
(Amounts in thousands)Year Ended December 31,
See accompanying notes to consolidated financial statements.
2002 2001 2000
Net income $ 71,595 $ 61,529 $ 71,622
Other comprehensive income (loss):
Foreign currency translation adjustment 2,968 (977) (1,508)
Unrealized holding gains (losses) on investments:
Net change in unrealized holding gains (losses) for the period, net of income tax expense (benefit) of ($863) for 2002, $1,687 for 2001, and ($801) for 2000 (1,603) 3,000 (1,425)
Comprehensive income $ 72,960 $ 63,552 $ 68,689
IncomeConsolidated Statements of Comprehensive Income
26 | Zebra Technologies Corporation 2002 Annual Report

Stockholders’ EquityConsolidated Statements of Stockholders’ Equity
Accumulated Other Comprehensive Income
Class A Class B Additional Unrealized CumulativeCommon Common Paid-in Retained Treasury Holding Gain (Loss) Translation
(Dollars in thousands) Stock Stock Capital Earnings Stock on Investments Adjustment Total
Balance at December 31, 1999 $ 249 $ 65 $ 60,072 $ 289,404 $ — $ — $ (483) $ 349,307
Issuance of 128,827 shares of Class A Common Stockupon exercise of stock options 1 — 3,227 — — — — 3,228
Conversion of 604,187 shares of Class B Common Stock to 604,187 shares of Class A Common Stock 6 (6) — — — — — —
Repurchase of 1,170,500 shares of Class A Common Stock — — — — (55,505) — — (55,505)
Reissuance of 111,747 treasury shares upon exercise of stock options and purchases under stock purchase plan — — (1,952) — 5,377 — — 3,425
Tax benefit resulting from exercise of options — — 1,505 — — — — 1,505
Gains on put options — — 639 — — — — 639
Net income — — — 71,622 — — — 71,622
Unrealized holding loss on investments (net of income taxes) — — — — — (1,425) — (1,425)
Foreign currency translation adjustment — — — — — — (1,508) (1,508)
Balance at December 31, 2000 256 59 63,491 361,026 (50,128) (1,425) (1,991) 371,288
Conversion of 408,228 shares of Class B Common Stock to 408,228 shares of Class A Common Stock 4 (4) — — — — — —
Reissuance of 296,390 treasury shares upon exercise of stock options and purchases under stock purchase plan — — (5,751) — 14,646 — — 8,895
Tax benefit resulting from exercise of options — — 1,273 — — — — 1,273
Loss on put options — — (1) — — — — (1)
Net income — — — 61,529 — — — 61,529
Unrealized holding gain on investments (net of income taxes) — — — — — 3,000 — 3,000
Foreign currency translation adjustment — — — — — — (977) (977)
Balance at December 31, 2001 260 55 59,012 422,555 (35,482) 1,575 (2,968) 445,007
Conversion of 1,641,723 shares of Class B Common Stock to 1,641,723 shares of Class A Common Stock 16 (16) — — — — — —
Reissuance of 383,984 treasury shares upon exercise of stock options and purchases under stock purchase plan — — (5,616) — 18,722 — — 13,106
Tax benefit resulting from exercise of options — — 3,082 — — — — 3,082
Net income — — — 71,595 — — — 71,595
Unrealized holding loss on investments (net of income taxes) — — — — — (1,603) — (1,603)
Foreign currency translation adjustment — — — — — — 2,968 2,968
Balance at December 31, 2002 $276 $39 $56,478 $494,150 $(16,760) $ (28) $ — $534,155
See accompanying notes to consolidated financial statements.
Zebra Technologies Corporation 2002 Annual Report | 27
Z E B R A T E C H N O L O G I E S C O R P O R A T I O N

(Amounts in thousands)Year Ended December 31,
See accompanying notes to consolidated financial statements.
Cash FlowsConsolidated Statements of Cash Flows
2002 2001 2000
Cash flows from operating activities:Net income $ 71,595 $ 61,529 $ 71,622
Adjustments to reconcile net income to net cash provided by (used in) operating activities:
Depreciation and amortization 12,259 15,691 14,383Tax benefit from exercise of options 3,082 1,273 1,505 Acquired in-process technology — — 5,953 Depreciation (appreciation) in market value
of investments and marketable securities 1,360 (1,209) 2,952 Write-down of long-term investment 193 2,242 — Deferred income taxes (616) 2,873 (6,076) Changes in assets and liabilities, net of businesses acquired:
Accounts receivable, net (1,629) 16,223 (7,106)Inventories 2,922 17,284 (7,179)Other assets 3,969 (7,895) (542)Accounts payable (939) (9,424) (6,064)Accrued liabilities 2,564 3,083 (810)Income taxes payable (896) (6,792) 3,372Other operating activities 1,241 (1,928) (305)Investments and marketable securities (108,498) (78,874) 60,860
Net cash provided by (used in) operating activities (13,393) 14,076 132,565Cash flows from investing activities:
Purchases of property and equipment (8,481) (9,613) (8,947)Acquisition of Comtec Information Systems, net of cash acquired — — (88,476)
Net cash used in investing activities (8,481) (9,613) (97,423) Cash flows from financing activities:
Purchase of treasury stock — — (55,505) Proceeds from exercise of stock options 13,106 8,895 6,653 Proceeds from (cost of) put options — (1) 639Issuance (repayment) of notes payable 43 72 (140) Payments for obligation under capital lease (117) (103) (322)
Net cash provided by (used in) financing activities 13,032 8,863 (48,675) Effect of exchange rate changes on cash 932 (774) (1,508) Net increase (decrease) in cash and cash equivalents (7,910) 12,552 (15,041) Cash and cash equivalents at beginning of year 26,328 13,776 28,817 Cash and cash equivalents at end of year $ 18,418 $ 26,328 $ 13,776Supplemental disclosures of cash flow information:
Interest paid $ 319 $ 231 $ 1,120Income taxes paid 33,840 38,604 44,736
Supplemental disclosures of non-cash transactions:Conversion of Class B Common Stock to Class A Common Stock 16 4 6 Assets under capital lease obligation 333 — —
28 | Zebra Technologies Corporation 2002 Annual Report

NotesNotes to Consolidated Financial Statements
Note 1 Description of Business
Zebra Technologies Corporation and its wholly-owned subsidiaries (the Company)
design, manufacture, sell and support a broad line of bar code label and receipt printers
and card printers, self-adhesive labeling materials, card supplies, thermal transfer ribbons
and bar code label design software. These products are used principally in automatic
identification (auto ID), data collection and personal identification applications and are
distributed world-wide through a network of resellers, distributors and end users
representing a wide cross-section of industrial, service and government organizations.
Note 2 Summary of Significant Accounting Policies
Principles of Consolidation.The accompanying financial statements have been
prepared on a consolidated basis to include the accounts of the Company and its
wholly owned subsidiaries. All significant inter-company accounts, transactions, and
unrealized profit have been eliminated in consolidation.
Use of Estimates.The preparation of consolidated financial statements in conformity
with accounting principles generally accepted in the United States requires management
to make estimates and assumptions that affect the reported amounts of assets and
liabilities and disclosure of contingent assets and liabilities at the date of the consoli-
dated financial statements and the reported amounts of revenues and expenses during
the reporting period. Actual results could differ from those estimates.
Cash and Cash Equivalents. Cash consists primarily of deposits with banks. In addition,
the Company considers highly liquid short-term investments with original maturities
of less than seven days to be cash equivalents.
Investments and Marketable Securities. Investments and marketable securities at
December 31, 2002, consisted of U.S. government securities, state and municipal
bonds, partnership interests and equity securities, which are held indirectly in
diversified funds actively managed by investment professionals. The Company
classifies its debt and marketable equity securities in one of three categories:
trading, available-for-sale or held-to-maturity. Trading securities are bought and
held principally for the purpose of selling them in the near term. Held-to-maturity
securities are those securities that the Company has the ability and intent to hold
until maturity. All securities not included in trading or held-to-maturity are classified
as available-for-sale.
Trading and available-for-sale securities are recorded at fair value. Held-to-maturity
securities are recorded at amortized cost, adjusted for the amortization or accretion
of discounts or premiums. Unrealized holding gains and losses on trading securities
are included in earnings. Unrealized holding gains and losses, net of the related tax
effect, on available-for-sale securities are excluded from earnings and are reported as
a separate component of stockholders’ equity until realized.
Inventories. Inventories are stated at the lower of cost or market, and cost is determined
by the first-in, first-out (FIFO) method.
Property and Equipment. Property and equipment is stated at cost. Depreciation and
amortization is computed primarily using the straight-line method over the estimated
useful lives of the various classes of property and equipment, which are 30 years for
buildings and range from 3 to 10 years for other property. Property and equipment
held under capital leases is amortized using the straight-line method over the shorter
of the lease term or estimated useful life of the asset.
Income Taxes.The Company accounts for income taxes under the asset and liability
method. Accordingly, deferred tax assets and liabilities are recognized for the future
tax consequences attributable to differences between the financial statement carrying
amounts of existing assets and liabilities and their respective tax bases. Deferred tax
assets and liabilities are measured using enacted tax rates expected to apply to taxable
income in the years in which those temporary differences are expected to be recovered
or settled. The effect on deferred tax assets and liabilities of a change in tax rates is
recognized in income in the period that includes the enactment date.
Intangible Assets. Goodwill represents the unamortized excess of the cost of acquiring
a business over the fair values of the net assets received at the date of acquisition.
Goodwill is no longer being amortized as required by SFAS No. 142, Goodwill and
Other Intangible Assets.
Z E B R A T E C H N O L O G I E S C O R P O R A T I O N
Zebra Technologies Corporation 2002 Annual Report | 29

Other intangible assets consist primarily of current technology. These assets are
recorded at cost and amortized on a straight-line basis over 5 years. Accumulated
amortization for these other intangible assets was $3,865,000 and $5,944,000 at
December 31, 2002 and 2001, respectively.
Revenue Recognition. Revenue is recognized at the time of shipping and includes
freight billed to customers.
Research and Development Costs. Research and development costs are expensed
as incurred.
Advertising. Advertising costs are expensed as incurred. Advertising expenses for
the years ended December 31, 2002, 2001 and 2000 totaled $3,965,000, $4,405,000
and $4,637,000, respectively.
Warranty.The Company provides warranty coverage of up to one year on printers
against defects in material and workmanship. A provision for warranty expense is
recorded at the time of shipment and adjusted quarterly based on historical warranty
experience. The following is a summary of the Company’s accrued warranty obligation
during the year ended December 31, 2002.
2002
Accrued warranty — beginning balance $ 1,021
Add: warranty expense 3,080
Deduct: warranty payments 2,426
Accrued warranty — ending balance $ 1,675
Financial instruments.The reported amounts of the Company’s financial instruments,
which include investments and marketable securities, trade accounts receivable,
accounts payable, accrued liabilities, income taxes payable and short-term notes
payable, approximate their fair values because of the contractual maturities and
short-term nature of these instruments.
Stock-based Compensation. At December 31, 2002, the Company has three stock-based
compensation plans, which are described more fully in Note 16. The Company accounts
for those plans under the recognition and measurement principles of APB Opinion No.
25, Accounting for Stock Issued to Employees, and related Interpretations. No stock-
based compensation cost is reflected in net income, as all options granted under those
plans had an exercise price equal to the market value of the underlying common stock
on the date of grant. The following table illustrates the effect on net income and earnings
per share if the Company had applied the fair value recognition provisions of FASB
No. 123, Accounting for Stock-based Compensation, to stock-based compensation.
2002 2001 2000
Net income, as reported $71,595 $61,529 $ 71,622
Deduct: Total stock-based employee compensation expense determined under fair value method for all awards, net of related tax effects (5,102) (3,558) (4,009)
Pro forma net income $66,493 $ 57,971 $ 67,613
Basic earnings per share:
As reported $ 2.31 $ 2.01 $ 2.33
Pro forma 2.15 1.89 2.20
Diluted earnings per share:
As reported $ 2.29 $ 1.99 $ 2.30
Pro forma 2.13 1.88 2.17
Deferred Compensation Plan. The Company has a deferred compensation plan that
permits management and highly compensated employees to defer portions of their
compensation and to select a method of investing these funds. The salaries that have
been deferred since the plan’s inception have been accrued and the only charges,
other than additional deferred salaries, related to this plan are the unrealized gain/loss
on the deferred amounts.
30 | Zebra Technologies Corporation 2002 Annual Report

Acquisition Costs. The Company periodically invests in potential acquisitions. Any
external costs incurred are recorded as prepaid expenses until such time as the
Company either completes the transaction or abandons the transaction. If the
transaction is completed, the costs are treated as part of the cost of the acquisition.
If the transaction is abandoned, the costs are expensed during the period in which it
is abandoned. During 2002, operating expenses include $3,300,000 of costs related
to such an abandonment. As of December 31, 2002, the balance sheet includes
$35,000 in prepaid expenses related to acquisitions.
Impairment of Long-Lived Assets and Long-Lived Assets to be Disposed of. The
Company accounts for long-lived assets in accordance with the provisions of SFAS
No. 144, Accounting for the Impairment or Disposal of Long-Lived Assets.The statement
requires that long-lived assets and certain identifiable intangibles be reviewed for
impairment whenever events or changes in circumstances indicate that the carrying
amount of an asset may not be recoverable. Recoverability of assets to be held and
used is measured by a comparison of the carrying amount of an asset to the sum
of the undiscounted cash flows expected to result from the use and the eventual
disposition of the asset. If such assets are considered to be impaired, the impairment
to be recognized is measured by the amount by which the carrying amount of the
assets exceeds the fair value of the assets. Assets to be disposed of are reported at
the lower of the carrying amount or fair value less costs to sell.
Recently Issued Accounting Pronouncements. In June 2001, the FASB issued SFAS
No. 143, Accounting for Asset Retirement Obligations. SFAS No. 143 addresses
financial accounting and reporting for obligations associated with the retirement of
tangible long-lived assets and for the associated asset retirement costs. SFAS No. 143
must be applied starting with fiscal years beginning after June 15, 2002. Management
is currently evaluating the impact that the adoption of SFAS No. 143 will have on the
consolidated financial statements.
Foreign Currency Translation.The consolidated balance sheets of the Company’s
foreign subsidiaries are translated into U.S. dollars using the year-end exchange
rate, and statement of earnings items are translated using the average exchange rate
for the year. The resulting translation gains or losses are recorded in stockholders’
equity as a cumulative translation adjustment, which is a component of accumulated
other comprehensive loss.
Capitalized Software.The Company’s investment in software development consists
primarily of enhancements to its existing E-commerce web-based application, which
will include the automation of current business activities. Specifically, the activities
include the processing of customer orders; the acknowledgement of customer orders
and delivery; and the financial invoicing for all of Zebra’s products and will aid in
enabling the Company to create new business efficiencies.
Costs associated with the planning and design phases of web-based development,
including coding and testing activities necessary to establish technological feasibility
of the functionality of the website, are charged to research and development as
incurred. Once technological feasibility has been determined, costs incurred in the
construction phase of software development including coding, testing, and product
quality assurance are capitalized.
Funded Engineering Arrangement. The Company was part of an arrangement with a
third party, whereby the Company was reimbursed for certain engineering services
performed on behalf of the third party. The arrangement had a term of three years. The
arrangement also provided that the Company would be the exclusive manufacturer
of the products resulting from the engineering agreement. The products would be
distributed under the third party’s brand name. During 2000 and 2001, the Company
incurred approximately $2,800,000 of reimbursable expenses under the agreement.
As of December 31, 2002, the Company had an accounts receivable of approximately
$2,100,000 related to this arrangement. A provision of $481,000 has been established
to cover estimated collection costs, which is included in accrued liabilities. The
arrangement was terminated in 2002.
Z E B R A T E C H N O L O G I E S C O R P O R A T I O N
Zebra Technologies Corporation 2002 Annual Report | 31

In April 2002, the FASB issued SFAS No. 145, Rescission of FASB Statements No. 4, 44,
and 64, Amendment of FASB Statement No. 13, and Technical Corrections. SFAS 145
requires that gains and losses from extinguishment of debt be classified as extraordi-
nary items only if they meet the criteria in Accounting Principles Board Opinion No. 30.
Applying the provisions of Opinion No. 30 will distinguish transactions that are part of
an entity’s recurring operations from those that are unusual and infrequent and meet
the criteria for classification as an extraordinary item. SFAS No. 145 is effective beginning
January 1, 2003. Management is currently evaluating the impact that the adoption of
SFAS No. 145 will have on the Company’s consolidated financial statements.
In July 2002, the FASB issued SFAS No. 146, Accounting for Costs Associated with Exit
or Disposal Activities.This standard requires companies to recognize costs associated
with exit or disposal activities when they are incurred rather than at the date of a
commitment to an exit or disposal plan. Examples of costs covered by the standard
include lease termination costs and certain employee severance costs that are associated
with a restructuring, discontinued operation, plant closing, or other exit or disposal
activity. This standard will be applied prospectively to exit or disposal activities initiated
after December 31, 2002. Management does not believe the adoption of SFAS No. 146
will have a significant impact on the Company’s consolidated financial statements.
Note 3 Business Combinations
Comtec Information Systems, Inc. On April 3, 2000, the Company acquired Comtec
Information Systems, Inc. (Comtec), by acquiring all of the outstanding capital stock
of Comtec for approximately $88,476,000 in cash. Located in Warwick, Rhode Island,
Comtec had been a privately held company. Comtec designs, manufactures and sup-
ports mobile printing systems. The acquisition was accounted for under the purchase
method. At the time of the acquisition, the purchase price was allocated to identifiable
tangible assets and intangible assets acquired and liabilities assumed based on their
estimated fair values. Estimated amounts allocated to acquired in-process technology
were expensed at the time of the acquisition. The consolidated statements of earnings
reflect the results of operations of Comtec since the effective date of the acquisition.
At the time of acquisition, the purchase price allocation for Comtec was as follows:
Amount (in thousands)
Net tangible assets $15,235
Acquired in-process technology 5,953
Intangible assets 31,786
Goodwill 35,502
Purchase price $88,476
The following summary presents information concerning the purchase price allocation
for the Comtec acquisition after the Company’s implementation of SFAS No. 142,
Goodwill and Other Intangible Assets, during the first quarter of 2002:
Amount (in thousands)
Net tangible assets $15,235
Acquired in-process technology 5,953
Current technology 6,494
Goodwill 60,794
Purchase price $88,476
Prior to the implementation of SFAS No. 142, goodwill was amortized on a straight-line
basis over the expected period of 20 years and other intangible assets were amortized
over periods up to 15 years. These amortization periods are reflective of the expense
amounts recorded in the Company’s 2001 and 2000 income statements. Subsequent
to the implementation of SFAS No. 142, the amount allocated to current technology
related to the Comtec acquisition is amortized over a period of five years and is included
as a component of other intangible assets on the balance sheet as of December 31,
2002. See Note 10 for a further discussion of the Company’s implementation of
SFAS No. 142.
Acquisition Termination Costs and Sale of Investment. In the first quarter of 2002, the
Company terminated the acquisition agreement and tender offer in which the Company
would acquire all outstanding shares of common stock (including associated rights
32 | Zebra Technologies Corporation 2002 Annual Report

Note 5 Investments and Marketable SecuritiesThe amortized cost, gross unrealized holding gains, gross unrealized holding losses
and aggregate fair value of investment securities at December 31, 2002, were as
follows (in thousands):Gross Gross
Amortized Unrealized UnrealizedCost Holding Gains Holding Losses Fair Value
Available for sale (included in other assets):
Equity securities $ 365 $ — $ (42) $ 323
Trading securities:
U.S. government and agency securities 96,195 207 (152) 96,250
State and municipal bonds 174,508 275 (1,565) 173,218
Corporate bonds 34,316 149 (196) 34,269
Partnership interests 15,676 3,139 (12) 18,803
Other 7,607 28 (16) 7,619
328,302 3,798 (1,941) 330,159
$ 328,667 $3,798 $ (1,983) $330,482
The amortized cost, gross unrealized holding gains, gross unrealized holding losses
and aggregate fair value of investment securities at December 31, 2001, were as
follows (in thousands): Gross Gross
Amortized Unrealized UnrealizedCost Holding Gains Holding Losses Fair Value
Available for sale (included in other assets):
Equity securities $ 1,804 $2,462 $ — $ 4,266
Trading securities:
U.S. government and agency securities 118,825 42 (53) 118,814
State and municipal bonds 76,576 286 (222) 76,640
Corporate bonds 5,077 89 — 5,166
Partnership interests 17,326 3,104 (29) 20,401
Other 2,000 — — 2,000
219,804 3,521 (304) 223,021
$ 221,608 $5,983 $(304) $ 227,287
to purchase preferred stock) of Fargo Electronics, Inc. for $7.25 per share in cash. In
connection with the termination, the Company recorded $3,300,000 in expenses for
capitalized acquisition costs and other acquisition costs that would otherwise have
been capitalized. Also during the quarter ended March 30, 2002, the Company sold
its investment in common stock of Fargo and realized a pre-tax gain of $1,953,000,
which is included in investment income.
Note 4 Earnings Per Share
For the years ended December 31, 2002, 2001, and 2000, earnings per share were
computed as follows (in thousands, except per-share amounts):
Year Ended December 31,2000 2002 2001 2000
Basic earnings per share:
Net income $71,595 $61,529 $71,622
Weighted average common shares outstanding 30,983 30,645 30,790
Per share amount $ 2.31 $ 2.01 $ 2.33
Diluted earnings per share:
Net income $71,595 $61,529 $71,622
Weighted average common shares outstanding 30,983 30,645 30,790
Add: Effect of dilutive securities – stock options 282 236 365
Diluted weighted average and equivalent shares outstanding 31,265 30,881 31,155
Per share amount $ 2.29 $ 1.99 $ 2.30
The potentially dilutive securities, which were excluded from the earnings per share
calculation, consisted of stock options for which the exercise price was greater than
the average market price of the Class A Common Stock. For the years ended
December 31, the shares amounted to 194,875 in 2002, 436,325 in 2001, and 267,500
in 2000.
Z E B R A T E C H N O L O G I E S C O R P O R A T I O N
Zebra Technologies Corporation 2002 Annual Report | 33
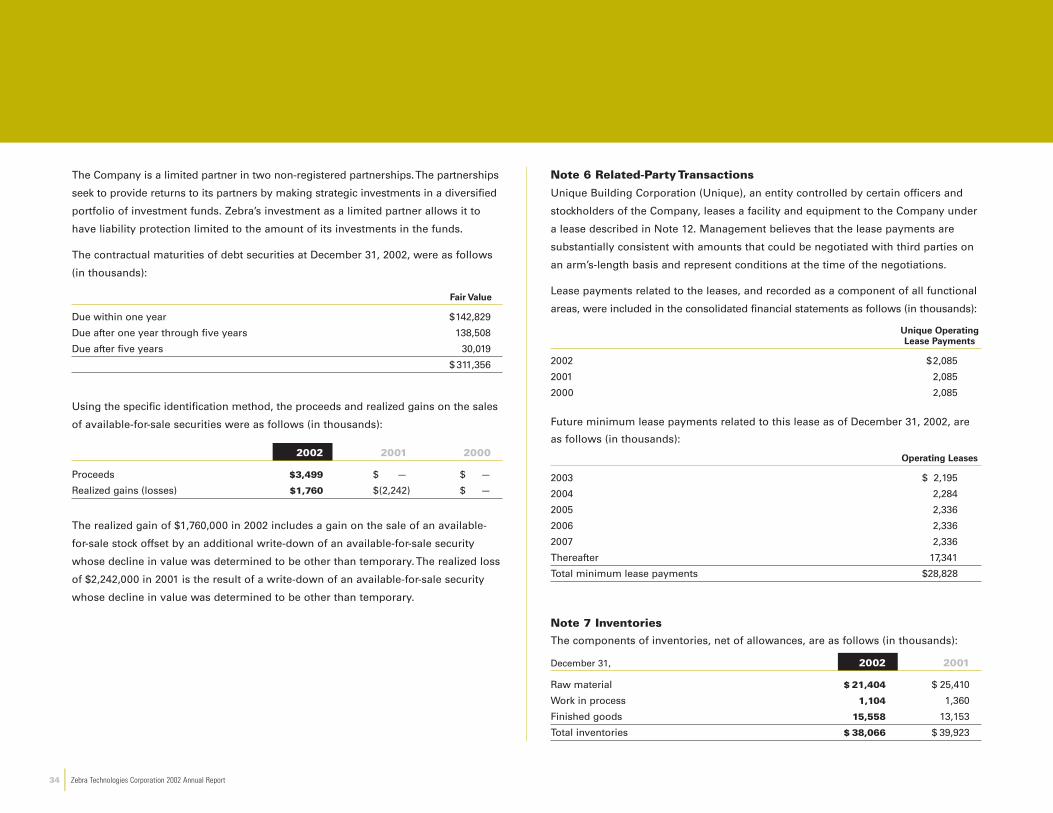
The Company is a limited partner in two non-registered partnerships. The partnerships
seek to provide returns to its partners by making strategic investments in a diversified
portfolio of investment funds. Zebra’s investment as a limited partner allows it to
have liability protection limited to the amount of its investments in the funds.
The contractual maturities of debt securities at December 31, 2002, were as follows
(in thousands):
Fair Value
Due within one year $142,829
Due after one year through five years 138,508
Due after five years 30,019
$ 311,356
Using the specific identification method, the proceeds and realized gains on the sales
of available-for-sale securities were as follows (in thousands):
2002 2001 2000
Proceeds $3,499 $ — $ —
Realized gains (losses) $1,760 $(2,242) $ —
The realized gain of $1,760,000 in 2002 includes a gain on the sale of an available-
for-sale stock offset by an additional write-down of an available-for-sale security
whose decline in value was determined to be other than temporary. The realized loss
of $2,242,000 in 2001 is the result of a write-down of an available-for-sale security
whose decline in value was determined to be other than temporary.
Note 6 Related-Party Transactions
Unique Building Corporation (Unique), an entity controlled by certain officers and
stockholders of the Company, leases a facility and equipment to the Company under
a lease described in Note 12. Management believes that the lease payments are
substantially consistent with amounts that could be negotiated with third parties on
an arm’s-length basis and represent conditions at the time of the negotiations.
Lease payments related to the leases, and recorded as a component of all functional
areas, were included in the consolidated financial statements as follows (in thousands):
Unique OperatingLease Payments
2002 $2,085
2001 2,085
2000 2,085
Future minimum lease payments related to this lease as of December 31, 2002, are
as follows (in thousands):
Operating Leases
2003 $ 2,195
2004 2,284
2005 2,336
2006 2,336
2007 2,336
Thereafter 17,341
Total minimum lease payments $28,828
Note 7 InventoriesThe components of inventories, net of allowances, are as follows (in thousands):
December 31, 2002 2001
Raw material $ 21,404 $ 25,410
Work in process 1,104 1,360
Finished goods 15,558 13,153
Total inventories $ 38,066 $ 39,923
34 | Zebra Technologies Corporation 2002 Annual Report

The Company does not provide for deferred income taxes on undistributed earnings
of foreign subsidiaries, which totaled approximately $11,600,000 at December 31,
2002 and $8,700,000 at December 31, 2001. Management expects such earnings to
be permanently reinvested in these companies. Should such earnings be remitted to
the Company, foreign tax credits would be available to substantially offset the U.S.
income taxes due upon repatriation.
The provision for income taxes consists of the following (in thousands):
2002 2001 2000
Current:
Federal $ 30,660 $ 25,998 $ 35,362
State 5,247 5,319 6,441
Foreign 3,254 2,107 3,761
Deferred:
Federal 296 1,132 (4,922)
State 40 152 (472)
Foreign (209) (98) 119
Total $ 39,288 $ 34,610 $ 40,289
The provision for income taxes differs from the amount computed by applying the
U.S. statutory Federal income tax rate of 35%. The reconciliation of statutory and
effective income taxes is presented below (in thousands):
2002 2001 2000
Provision computed at statutory rate $ 38,809 $ 33,649 $ 39,169
State income tax (net of Federal tax benefit) 3,634 3,556 3,880
Tax-exempt interest and dividend income (2,422) (1,524) (1,588)
Tax benefit of exempt foreign trade income (1,575) (1,438) (1,035)
Other 842 367 (137)
Provision for income taxes $ 39,288 $ 34,610 $ 40,289
Note 8 Property and Equipment
Property and equipment, which includes assets under capital leases, is comprised of
the following (in thousands):
December 31, 2002 2001
Buildings $ 11,499 $ 12,029
Land 1,910 1,910
Machinery, equipment and tooling 38,941 35,507
Machinery and equipment under capital leases 2,757 1,670
Furniture and office equipment 6,164 5,681
Computers and software 33,899 28,951
Automobiles 153 183
Leasehold improvements 4,012 2,997
Projects in progress 1,274 2,705
100,609 91,633
Less accumulated depreciation and amortization (61,147) (50,891)
Net property and equipment $ 39,462 $ 40,742
Amortization of capitalized software was $2,042,000 in 2002, $1,834,000 in 2001, and
$1,797,000 in 2000.
Note 9 Income Taxes
The geographical sources of earnings before income taxes were as follows
(in thousands):2002 2001 2000
United States $ 101,454 $ 90,272 $ 101,532
Outside United States 9,429 5,867 10,379
Total $ 110,883 $ 96,139 $ 111,911
Z E B R A T E C H N O L O G I E S C O R P O R A T I O N
Zebra Technologies Corporation 2002 Annual Report | 35
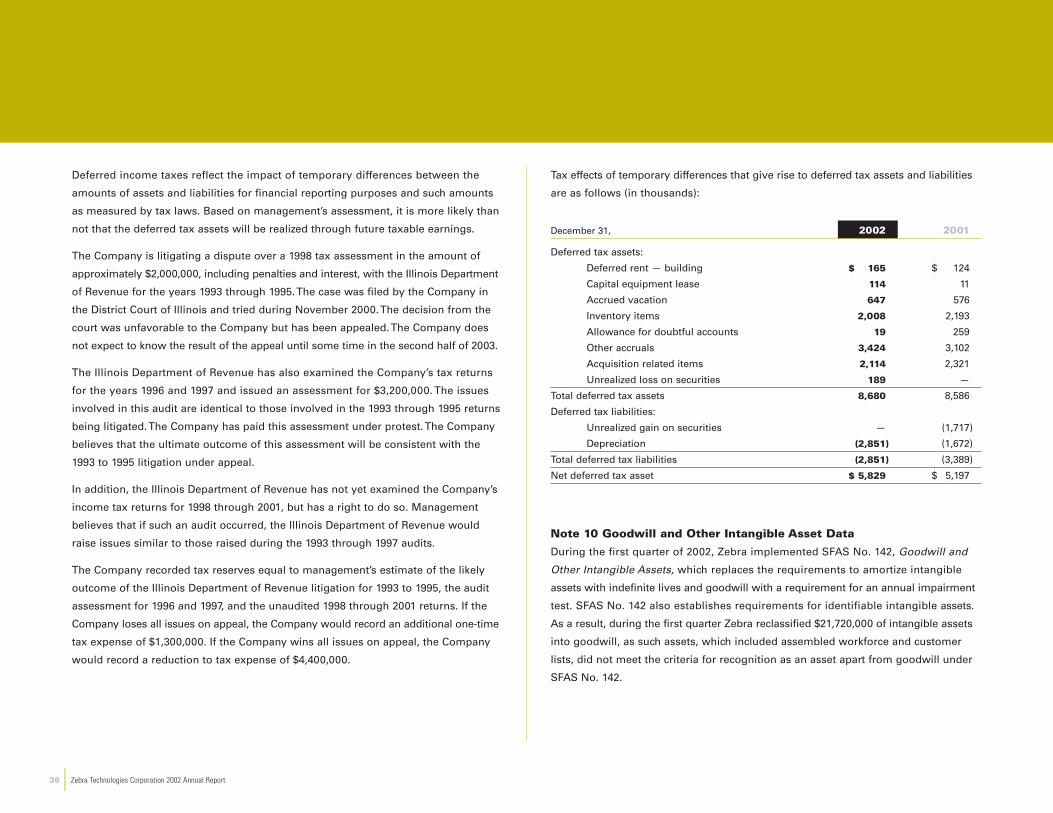
Tax effects of temporary differences that give rise to deferred tax assets and liabilities
are as follows (in thousands):
December 31, 2002 2001
Deferred tax assets:
Deferred rent — building $ 165 $ 124
Capital equipment lease 114 11
Accrued vacation 647 576
Inventory items 2,008 2,193
Allowance for doubtful accounts 19 259
Other accruals 3,424 3,102
Acquisition related items 2,114 2,321
Unrealized loss on securities 189 —
Total deferred tax assets 8,680 8,586
Deferred tax liabilities:
Unrealized gain on securities — (1,717)
Depreciation (2,851) (1,672)
Total deferred tax liabilities (2,851) (3,389)
Net deferred tax asset $ 5,829 $ 5,197
Note 10 Goodwill and Other Intangible Asset Data
During the first quarter of 2002, Zebra implemented SFAS No. 142, Goodwill and
Other Intangible Assets, which replaces the requirements to amortize intangible
assets with indefinite lives and goodwill with a requirement for an annual impairment
test. SFAS No. 142 also establishes requirements for identifiable intangible assets.
As a result, during the first quarter Zebra reclassified $21,720,000 of intangible assets
into goodwill, as such assets, which included assembled workforce and customer
lists, did not meet the criteria for recognition as an asset apart from goodwill under
SFAS No. 142.
Deferred income taxes reflect the impact of temporary differences between the
amounts of assets and liabilities for financial reporting purposes and such amounts
as measured by tax laws. Based on management’s assessment, it is more likely than
not that the deferred tax assets will be realized through future taxable earnings.
The Company is litigating a dispute over a 1998 tax assessment in the amount of
approximately $2,000,000, including penalties and interest, with the Illinois Department
of Revenue for the years 1993 through 1995. The case was filed by the Company in
the District Court of Illinois and tried during November 2000. The decision from the
court was unfavorable to the Company but has been appealed. The Company does
not expect to know the result of the appeal until some time in the second half of 2003.
The Illinois Department of Revenue has also examined the Company’s tax returns
for the years 1996 and 1997 and issued an assessment for $3,200,000. The issues
involved in this audit are identical to those involved in the 1993 through 1995 returns
being litigated. The Company has paid this assessment under protest. The Company
believes that the ultimate outcome of this assessment will be consistent with the
1993 to 1995 litigation under appeal.
In addition, the Illinois Department of Revenue has not yet examined the Company’s
income tax returns for 1998 through 2001, but has a right to do so. Management
believes that if such an audit occurred, the Illinois Department of Revenue would
raise issues similar to those raised during the 1993 through 1997 audits.
The Company recorded tax reserves equal to management’s estimate of the likely
outcome of the Illinois Department of Revenue litigation for 1993 to 1995, the audit
assessment for 1996 and 1997, and the unaudited 1998 through 2001 returns. If the
Company loses all issues on appeal, the Company would record an additional one-time
tax expense of $1,300,000. If the Company wins all issues on appeal, the Company
would record a reduction to tax expense of $4,400,000.
36 | Zebra Technologies Corporation 2002 Annual Report

Intangible asset data are as follows (in thousands):
As of December 31, 2002
Gross Carrying Accumulated
Amount Amortization
Amortized intangible assets
Current technology $ 7,421 $ (3,865)
Unamortized intangible assets
Goodwill $54,455
Aggregate amortization expense
For the year ended December 31, 2002 $ 1,494
Estimated amortization expense
For the year ended December 31, 2003 1,494
For the year ended December 31, 2004 1,494
For the year ended December 31, 2005 568
Operating income for 2001 and 2000 includes $3,835,000 and $2,876,000 respectively,
of amortization of goodwill and other intangible assets that are not included in 2002
results, because of the implementation of SFAS No. 142. If adjusted for the impact of
the implementation of SFAS No. 142 (i.e., if goodwill had not been amortized), net
income, basic earnings per share, and diluted earnings per share would have been
as follows:
Years Ended December 31, 2001 2000
Net income $ 63,983 $ 73,463
Basic earnings per share $ 2.09 $ 2.39
Diluted earning per share $ 2.07 $ 2.36
Note 11 401(k) Savings and Profit Sharing Plans
The Company has a Retirement Savings and Investment Plan (the 401(k) Plan), which
is intended to qualify under Section 401(k) of the Internal Revenue Code. Qualified
employees may participate in the Company’s 401(k) Plan by contributing up to 15% of
their gross earnings to the plan subject to certain Internal Revenue Service restrictions.
The Company matches each participant’s contribution of up to 6% of gross eligible
earnings at the rate of 50%. The Company may contribute additional amounts to the
401(k) Plan at the discretion of the Board of Directors, subject to certain legal limits.
The Company has a discretionary profit-sharing plan for qualified employees, to which
it contributed 1.9% of eligible earnings for 2002, 1.9% for 2001 and 3.1% for 2000.
Participants are not permitted to make contributions under the profit-sharing plan.
Company contributions to these plans, which were charged to operations, approximated
the following (in thousands):
2002 2001 2000
401(k) $ 1,452 $ 1,374 $ 1,287
Profit sharing 1,146 1,178 877
Total $ 2,598 $ 2,552 $ 2,164
Note 12 Commitments and Contingencies
Leases. In September 1989, the Company entered into a lease agreement for its
Vernon Hills facility and certain machinery, equipment, furniture and fixtures with
Unique Building Corporation. The facility portion of the lease is the only remaining
portion in existence as of December 31, 2002, and is treated as an operating lease.
An amendment to the lease dated July 1997 added 59,150 square feet and extended
the term of the existing lease through June 30, 2014. The lease agreement includes a
modification to the base monthly rental, which goes into effect if the prescribed rent
payment is less than the aggregate principal and interest payments required to be
made by Unique under an Industrial Revenue Bond (IRB).
Z E B R A T E C H N O L O G I E S C O R P O R A T I O N
Zebra Technologies Corporation 2002 Annual Report | 37

Minimum future obligations under noncancelable operating leases and future minimum
capital lease payments as of December 31, 2002, are as follows (in thousands):
Capital OperatingLease Leases
2003 $ 184 $ 4,198
2004 169 3,839
2005 169 3,331
2006 228 3,096
2007 28 3,031
Thereafter 97 21,352
Total minimum lease payments $ 875 $ 38,847
Less amount representing interest (125)
Present value of minimum payments 750
Less current portion of obligation under capital lease (145)
Long-term portion of obligation under capital lease $ 605
Rent expense for operating leases charged to operations for the years ended December
31, 2002, 2001, and 2000 was $5,699,000, $4,917,000, and $4,833,000, respectively.
Letter of credit. In connection with the lease agreements described above, the
Company has guaranteed Unique’s full and prompt payment under Unique’s letter
of credit agreement with a bank. The contingent liability of the Company under this
guaranty as of December 31, 2002, is $700,000, which is the limit of the Company’s
guaranty throughout the term of the IRB.
Derivative Instruments. In the normal course of business, portions of the Company’s
operations are subject to fluctuations in currency values. The Company addresses
these risks through a controlled program of risk management that includes the use
of derivative financial instruments.
The Company enters into foreign exchange forward contracts to manage exposure to
fluctuations in foreign exchange rates to the funding of its United Kingdom operations.
The Company accounts for such contracts by recording any unrealized gains or
losses in income each reporting period. The notional principal amounts of outstanding
forward contracts were €26,000,000 and £3,293,000 at December 31, 2002, and
€16,391,000 and £6,019,000 at December 31, 2001. The realized losses, included in
other, net expense, were $1,432,000 in 2002 and $661,000 in 2001.
Legal proceedings. On January 31, 2003, a Writ of Summons was filed in the Nantes
Commercial Court, Nantes, France, by Printherm, a French corporation, and several
of its shareholders (collectively, “Printherm”), against Zebra Technologies France, a
French corporation and wholly-owned subsidiary of the Company. Printherm seeks
damages in the amount €15,004,000 and additional unspecified damages in connection
with Zebra France’s termination of negotiations in December 2000 with respect to
the proposed acquisition by the Company of the capital stock of Printherm. The
Company believes that Printherm’s claims are without merit, and the Company will
vigorously defend the action.
Note 13 Segment Data and Export Sales
The Company operates in one industry segment. Information regarding the Company’s
operations by geographic area for the years ended December 31, 2002, 2001, and
2000 is contained in the following table. These amounts (in thousands) are reported
in the geographic area where the final sale originates.
United States United Kingdom Other Total
2002 Net sales $341,941 $133,670 $ — $ 475,611Long-lived assets 90,873 5,707 893 97,473
2001 Net sales $325,003 $ 111,577 $13,428 $450,008Long-lived assets 93,345 5,755 1,070 100,170
2000 Net sales $ 357,412 $100,988 $23,169 $481,569Long-lived assets 97,637 6,526 1,234 105,397
38 | Zebra Technologies Corporation 2002 Annual Report
Note 14 Stockholders’ Equity
Holders of Class A Common Stock are entitled to one vote per share. Holders of
Class B Common Stock are entitled to 10 votes per share. Holders of Class A and
Class B Common Stock vote together as a single class on all actions submitted to a
vote of stockholders, except in certain circumstances. If at any time the number of
outstanding shares of Class B Common Stock represents less than 10% of the total
number of outstanding shares of both classes of common stock, then at that time
such outstanding shares of Class B Common Stock will automatically convert into an
equal number of shares of Class A Common Stock.
Class A Common Stock has no conversion rights. A holder of Class B Common Stock
may convert the Class B Common Stock into Class A Common Stock, in whole or in
part, at any time and from time to time. Shares of Class B Common Stock convert
into shares of Class A Common stock on a share-for-share basis.
Holders of Class A and Class B Common Stock are entitled to receive cash dividends
equally on a per-share basis, if and when the Company’s Board of Directors declares
such dividends. In the case of any stock dividend paid, holders of Class A Common
Stock are entitled to receive the same percentage dividend (payable in shares of
Class A Common Stock) as the holders of Class B Common Stock receive (payable
in shares of Class B Common Stock).
Holders of Class A and Class B Common Stock share with each other on a ratable
basis as a single class in the net assets of the Company in the event of liquidation.
Note 15 Deferred Compensation Plan
Beginning January 1, 2002, the Company offered a deferred compensation plan that
permits management and highly compensated employees to defer portions of their
compensation and to select a method of investing these funds. The salaries that have
been deferred since the plan’s inception have been accrued and the only expense, other
than salaries, related to this plan is the unrealized gain/loss on the deferred amounts.
Investment income includes an unrealized loss of $16,000 for 2002 related to this plan.
The Company has included $1,008,000 in other long-term liabilities at December 31,
2002 to reflect its liability under this plan. To fund this plan, the Company purchases
corporate-owned whole-life insurance contracts on the related employees, of which the
Company is the beneficiary. Investments and marketable securities include the cash
surrender value of these policies aggregating $914,000 as of December 31, 2002.
Note 16 Stock Option and Purchase Plans
As of December 31, 2002, the Company had three active stock option and stock
purchase plans, described below.
The Board of Directors adopted the 1997 Stock Option Plan, effective February 11, 1997,
and 4,250,000 shares of Class A Common Stock were reserved for issuance under the
plan.The 1997 Stock Option Plan is a flexible plan that provides the committee that
administers the Plan broad discretion to fashion the terms of the awards to provide eligi-
ble participants with stock-based incentives, including: (i) nonqualified and incentive
stock options for the purchase of the Company’s Class A Common Stock and (ii) dividend
equivalents. The persons eligible to participate in the 1997 Stock Option Plan are direc-
tors, officers, and employees of the Company or any subsidiary of the Company who,
in the opinion of the committee administering the plan, are in a position to make contri-
butions to the growth, management, protection and success of the Company or its
subsidiaries. As of December 31, 2002, 1,377,587 shares were available under the plan.
The options granted under the 1997 Stock Option Plan have an exercise price equal
to the closing market price of the Company’s stock on the date of grant. The options
generally vest over two- to five-year periods and have a legal life of ten years from
the date of grant. The Board of Directors administers the plan.
The Company’s Board of Directors adopted the 1997 Director Plan, effective February 11,
1997. The 1997 Director Plan provides for the issuance of options to purchase up to
77,000 shares of Class A Common Stock, which shares are reserved and available for
purchase upon the exercise of options granted under the 1997 Director Plan. Only
directors who are not employees or officers of the Company are eligible to participate
in the 1997 Director Plan. Under the 1997 Director Plan, each non-employee director
was granted, on the effective date of the plan, an option to purchase 15,000 shares
Z E B R A T E C H N O L O G I E S C O R P O R A T I O N
Zebra Technologies Corporation 2002 Annual Report | 39

of Class A Common Stock, and each non-employee director subsequently elected to
the Board will be granted an option to purchase shares of Class A Common Stock on
the date of his or her election. Options granted under the 1997 Director Plan provide
for the purchase of Class A Common Stock at a price equal to the fair market value on
the date of grant. If there are not sufficient shares remaining and available to all non-
employee directors eligible for an automatic grant at the time at which an automatic
grant would otherwise be made, then each eligible non-employee director shall
receive an option to purchase a pro rata number of shares. Unless otherwise provided
in an option agreement, options granted under the 1997 Director Plan shall become
exercisable in five equal increments beginning on the date of the grant and on each
of the first four anniversaries thereof. All options expire on the earlier of (a) ten years
following the grant date or (b) the second anniversary of the termination of the non-
employee director’s directorship for any reason other than due to death or disability
(as defined in the 1997 Director Plan). A total of 52,500 shares were issued under this
plan, which was terminated February 1, 2002. At December 31, 2002, 9,000 options
issued under the 1997 Director Plan remained outstanding and unexercised.
The Board of Directors and stockholders adopted the 2001 Stock Purchase Plan and
reserved 500,000 shares of Class A Common Stock for issuance thereunder. Under this
plan, employees who work a minimum of 20 hours per week may elect to withhold
up to 10% of their cash compensation through regular payroll deductions to purchase
shares of Class A Common Stock from the Company over a period not to exceed 12
months at a purchase price per share equal to the lesser of: (1) 85% of the fair market
value of the shares as of the date of the grant, or (2) 85% of the fair market value of
the shares as of the date of purchase. As of December 31, 2002, 68,905 shares have
been purchased under the plan.
The Company’s Board of Directors adopted the 2002 Director Plan, effective February 1,
2002. The 2002 Director Plan provides for the issuance of options to purchase up to
160,000 shares of Class A Common Stock, which shares are reserved and available for
purchase upon the exercise of options granted under the 2002 Director Plan. Only
directors who are not employees or officers of the Company are eligible to participate
in the 2002 Director Plan. Under the 2002 Director Plan, each non-employee director
was granted, on the effective date of the plan, an option to purchase 20,000 shares of
Class A Common Stock, and each non-employee director subsequently elected to the
Board will be granted an option to purchase shares of Class A Common Stock on the
date of his or her election. Options granted under the 2002 Director Plan provide for
the purchase of Class A Common Stock at a price equal to the fair market value on
the date of grant. If there are not sufficient shares remaining and available to all non-
employee directors eligible for an automatic grant at the time at which an automatic
grant would otherwise be made, then each eligible non-employee director shall
receive an option to purchase a pro rata number of shares. As of December 31, 2002,
100,000 shares were available under the plan. Unless otherwise provided in an option
agreement, options granted under the 2002 Director Plan shall become exercisable in
five equal increments beginning on the date of the grant and on each of the first four
anniversaries thereof. All options expire on the earlier of (a) ten years following the
grant date, (b) the first anniversary of the termination of the non-employee director’s
directorship for any reason other than those listed in clause (c) below, or (c) the termi-
nation of the non-employee director’s directorship by the Company’s stockholders for
cause, or resignation for cause, in each case as defined in the option agreement.
For purposes of calculating the compensation cost consistent with SFAS No. 123, the
fair value of each stock option grant is estimated on the date of grant using the Black-
Scholes option-pricing model with the following weighted-average assumptions used
for stock option grants in 2002, 2001, and 2000, respectively: expected dividend yield
of 0% for each period; expected volatility of 53%, 59%, and 58%; risk free interest rate
of 4.55%, 4.38%, and 5.05%; and expected weighted-average life of six years, five
years, and five years. The fair value of options granted was $35,234,000 in 2002,
$11,930,000 in 2001 and $24,290,000 in 2000.
The fair value of the employees’ purchase rights pursuant to the Stock Purchase Plan
are estimated using the Black-Scholes option-pricing model with the following
weighted-average assumptions used for purchase rights granted in 2002, 2001, and
2000, respectively: fair market value of $51.14, $38.18, and $44.62; option price of
$43.47, $32.45, and $37.92; expected dividend yield of 0% for each period; expected
volatility of 40%, 54%, and 71%; risk-free interest rate of 1.32%, 2.17%, and 5.85%;
and expected lives of three months to one year.
40 | Zebra Technologies Corporation 2002 Annual Report

Stock option activity for the years ended December 31, 2002, 2001, and 2000 was as follows:
2002 2001 2000
Weighted-Average Weighted-Average Weighted-AverageFixed Options Shares Exercise Price Shares Exercise Price Shares Exercise Price
Outstanding at beginning of year 1,413,385 $38.38 1,487,277 $36.08 1,390,588 $27.88
Granted 718,750 49.02 287,500 41.49 440,000 55.29
Exercised (342,001) 32.09 (247,838) 28.38 (195,369) 23.76
Canceled (124,739) 48.45 (113,554) 38.02 (147,942) 31.57
Outstanding at end of year 1,665,395 43.51 1,413,385 38.38 1,487,277 36.10
Options exercisable at end of year 385,201 34.87 477,385 31.22 417,570 27.82
The following table summarizes information about fixed stock options outstanding at December 31, 2002:
Options Outstanding Options Exercisable
Number Weighted-Average Weighted-Average Number Weighted-AverageRange of Exercise Prices of Shares Remaining Contractual Life Exercise Price of Shares Exercise Price
$ 4.31 4,500 1.52 years $ 4.31 4,500 $ 4.31
$17.38 – $26.56 350,198 5.63 years $26.02 214,567 $ 25.68
$29.25 – $40.88 298,959 7.46 years $39.39 73,510 $ 36.47
$43.13 – $54.69 816,863 8.82 years $48.64 30,397 $ 47.68
$60.63 194,875 7.13 years $60.63 62,227 $ 60.63
1,665,395 385,201
Z E B R A T E C H N O L O G I E S C O R P O R A T I O N
Zebra Technologies Corporation 2002 Annual Report | 41
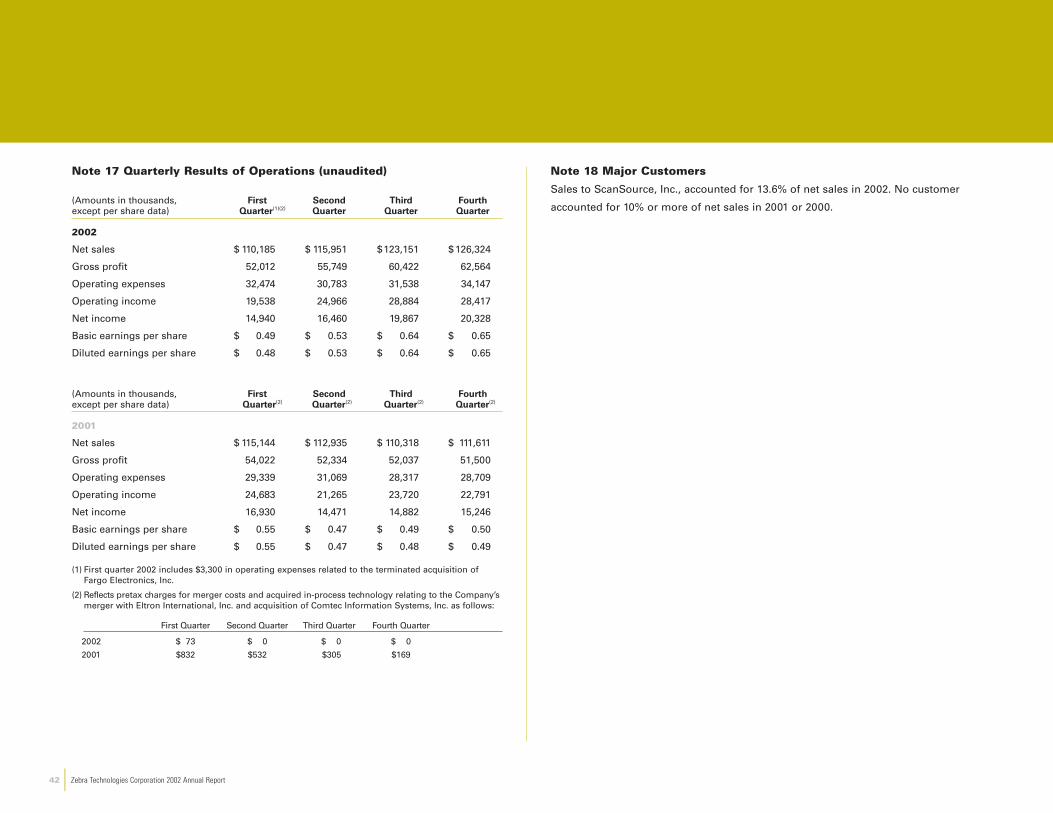
Note 17 Quarterly Results of Operations (unaudited)
(Amounts in thousands, First Second Third Fourthexcept per share data) Quarter(1)(2) Quarter Quarter Quarter
2002
Net sales $ 110,185 $ 115,951 $123,151 $ 126,324
Gross profit 52,012 55,749 60,422 62,564
Operating expenses 32,474 30,783 31,538 34,147
Operating income 19,538 24,966 28,884 28,417
Net income 14,940 16,460 19,867 20,328
Basic earnings per share $ 0.49 $ 0.53 $ 0.64 $ 0.65
Diluted earnings per share $ 0.48 $ 0.53 $ 0.64 $ 0.65
(Amounts in thousands, First Second Third Fourthexcept per share data) Quarter(2) Quarter(2) Quarter(2) Quarter(2)
2001
Net sales $ 115,144 $ 112,935 $ 110,318 $ 111,611
Gross profit 54,022 52,334 52,037 51,500
Operating expenses 29,339 31,069 28,317 28,709
Operating income 24,683 21,265 23,720 22,791
Net income 16,930 14,471 14,882 15,246
Basic earnings per share $ 0.55 $ 0.47 $ 0.49 $ 0.50
Diluted earnings per share $ 0.55 $ 0.47 $ 0.48 $ 0.49
(1) First quarter 2002 includes $3,300 in operating expenses related to the terminated acquisition ofFargo Electronics, Inc.
(2) Reflects pretax charges for merger costs and acquired in-process technology relating to the Company’smerger with Eltron International, Inc. and acquisition of Comtec Information Systems, Inc. as follows:
First Quarter Second Quarter Third Quarter Fourth Quarter
2002 $ 73 $ 0 $ 0 $ 0
2001 $832 $532 $305 $169
Note 18 Major Customers
Sales to ScanSource, Inc., accounted for 13.6% of net sales in 2002. No customer
accounted for 10% or more of net sales in 2001 or 2000.
42 | Zebra Technologies Corporation 2002 Annual Report

The Board of Directors and Stockholders
Zebra Technologies Corporation:
We have audited the accompanying consolidated balance sheets of Zebra Technologies
Corporation and Subsidiaries as of December 31, 2002 and 2001, and the related
consolidated statements of earnings, comprehensive income, stockholders’ equity,
and cash flows for each of the years in the three-year period ended December 31,
2002. In connection with our audits of the consolidated financial statements, we also
have audited the consolidated financial statement schedule of valuation and qualifying
accounts. These consolidated financial statements and the consolidated financial
statement schedule are the responsibility of the Company’s management. Our
responsibility is to express an opinion on these consolidated financial statements
and the consolidated financial statement schedule based on our audits.
We conducted our audits in accordance with auditing standards generally accepted
in the United States of America. Those standards require that we plan and perform
the audit to obtain reasonable assurance about whether the financial statements are
free of material misstatement. An audit includes examining, on a test basis, evidence
supporting the amounts and disclosures in the financial statements. An audit also
includes assessing the accounting principles used and significant estimates made by
management, as well as evaluating the overall financial statement presentation. We
believe that our audits provide a reasonable basis for our opinion.
In our opinion, the consolidated financial statements referred to above present fairly,
in all material respects, the financial position of Zebra Technologies Corporation and
Subsidiaries as of December 31, 2002 and 2001, and the results of their operations and
their cash flows for each of the years in the three-year period ended December 31,
2002, in conformity with accounting principles generally accepted in the United States
of America. Also, in our opinion, the related consolidated financial statement schedule,
when considered in relation to the basic consolidated financial statements taken as
a whole, presents fairly, in all material respects, the information set forth therein.
Chicago, Illinois
February 11, 2003
Z E B R A T E C H N O L O G I E S C O R P O R A T I O NAuditors’ ReportIndependent Auditors’ Report
Zebra Technologies Corporation 2002 Annual Report | 43

StockholderStockholder Information
Corporate HeadquartersZebra Technologies Corporation
333 Corporate Woods Parkway
Vernon Hills, Illinois 60061-3109 U.S.A.
Phone: 847-634-6700
Fax: 847-913-8766
Annual MeetingZebra’s Annual Meeting of Stockholders will be held on May 20, 2003, 10:30 A.M.
(Central Time), at the Hilton Northbrook, 2855 North Milwaukee Avenue,
Northbrook, Illinois.
Independent AuditorsKPMG LLP
Chicago, Illinois
Corporate CounselKatten Muchin Zavis Rosenman
Chicago, Illinois
Transfer Agent and RegistrarMellon Investor Services
85 Challenger Road
Ridgefield, New Jersey 07660
Phone: 877-870-2368
www.mellon-investor.com
Investor RelationsFor corporate or product information, please contact the Corporate Headquarters.
Form 10-K ReportYou may receive a free copy of the Zebra Technologies Corporation Form 10-K Report
filed with the Securities and Exchange Commission by contacting the Investor
Relations Department at the Corporate Headquarters.
Web SiteInvestors are invited to learn more about Zebra Technologies Corporation by
accessing the Company’s web site at www.zebra.com
Equal Employment Opportunity/Affirmative ActionIt is the policy of Zebra Technologies Corporation to provide equal opportunity and
affirmative action in all areas of its employment practices without regard to race,
religion, national origin, sex, age, ancestry, citizenship, disability, veteran status,
marital status, sexual orientation or any other reason prohibited by law.
Stock Information: Price Range and Common StockThe Company’s Class A Common Stock is traded on the Nasdaq Stock Market under
the symbol ZBRA. The following table shows the high and low trade prices for each
quarter in 2002 and 2001, as reported by the Nasdaq Stock Market. No market exists
for the Company’s Class B Common Stock. The shares of Class B Common Stock are
convertible on a one-for-one basis into shares of Class A Common Stock at the
option of the holder.
2002 High Low
First Quarter $58.99 $47.27Second Quarter 60.15 47.37Third Quarter 57.94 45.12Fourth Quarter 68.60 48.50
2001 High Low
First Quarter $57.00 $35.50Second Quarter 52.06 34.13Third Quarter 49.95 35.15Fourth Quarter 56.50 36.00Source: The Nasdaq Stock Market
At February 25, 2003, the last reported price for the Class A Common Stock was$62.01 per share, and there were 412 registered stockholders of record for theCompany’s Class A Common Stock and 31 registered stockholders of record forthe Company’s Class B Common Stock.
Dividend PolicySince the Company’s initial public offering in 1991, the Company has not declaredany cash dividends or distributions on its capital stock. The Company intends toretain its earnings to finance future growth and therefore does not anticipate payingany cash dividends in the foreseeable future.
Number of EmployeesThe Company had approximately 2,000 associates as of February 28, 2003.
44 | Zebra Technologies Corporation 2002 Annual Report

Board of Directors
Edward KaplanChairman and Chief Executive OfficerZebra Technologies Corporation
Gerhard ClessExecutive Vice President and SecretaryZebra Technologies Corporation
Christopher Knowles(1)(2)(3)
Retired Chief Executive OfficerInsurance Auto Auctions, Inc.
John PaxtonPresident, Bar Code Business UnitZebra Technologies Corporation
David Riley(1)(2)(3)
Retired President and Chief Executive OfficerThe Middleby Corporation
Michael Smith(1)(3)
Chairman and Chief Executive OfficerFireVision, L.L.C.
(1) Member of Audit Committee(2) Member of Compensation Committee(3) Member of Nominating Committee
Officers
Edward KaplanChairman and Chief Executive Officer
Gerhard ClessExecutive Vice President and Secretary
Veraje AnjargolianVice President, General ManagerCard Printer Business Unit
Michael EdicolaVice President, Human Resources
Noel ElfantVice President and General Counsel
John KindsvaterSenior Vice President, Corporate Development
Todd NaughtonVice President, Controller
John PaxtonPresident, Bar Code Business Unit
Charles WhitchurchChief Financial Officer and Treasurer

Zebra Technologies Corporation
International Headquarters
333 Corporate Woods Parkway | Vernon Hills, IL | 60061-3109 U.S.A.
847-634-6700 | www.zebra.com
Top Related