


Languages
Pages
Legal


Tennessee
Industry and Occupational
Employment Projections
2012 – 2022
Tennessee Department of Labor and Workforce Development Employment Security Division Labor Market Information Section Occupational Employment Projections Unit 220 French Landing Drive Nashville, Tennessee 37243 (615) 741-2284

2
Tennessee Industry and Occupational Employment Projections
2012 – 2022
Contents:
I. Introduction........................................................................................................................ 2
II. Industry Employment Analysis
a. Overview................................................................................................................ 2
b. Fastest Growing and Declining Industries............................................................. 6
III. Occupational Employment Analysis
a. Overview................................................................................................................ 7
b. Fastest Growing and Declining Occupations......................................................... 8
c. Job Requirements Projections................................................................................10
IV. U.S. Projections Analysis................................................................................................. 14
3
Introduction
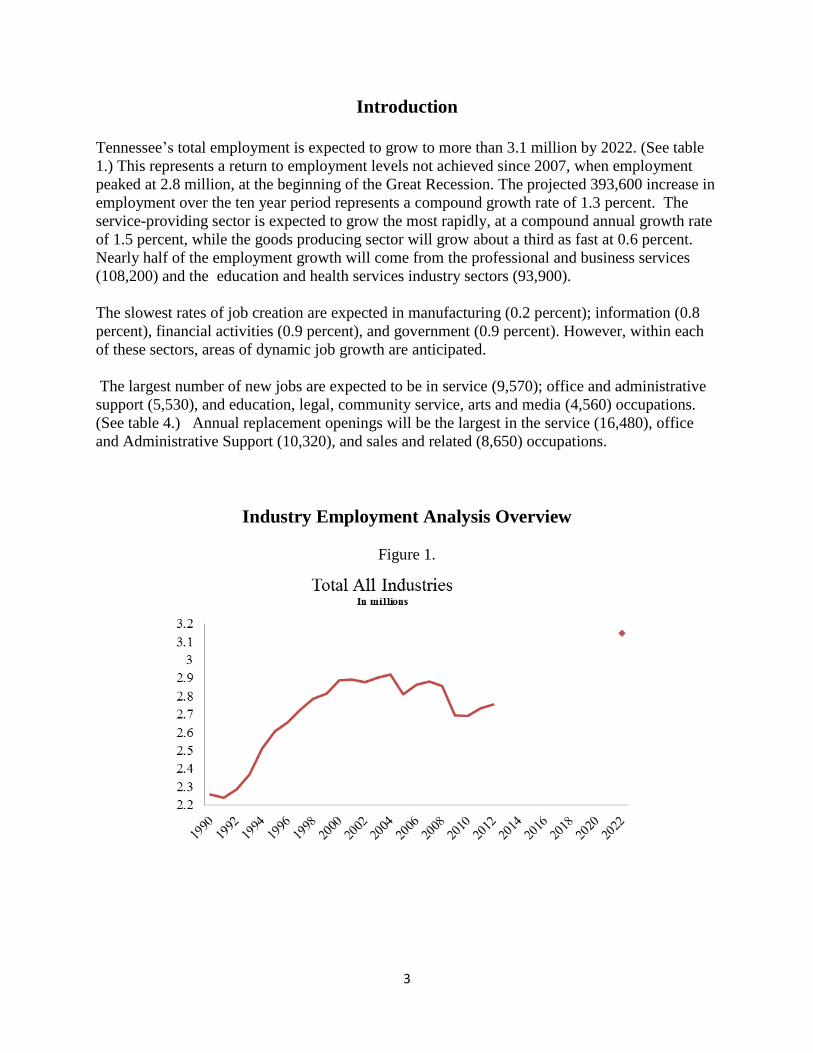
Tennessee’s total employment is expected to grow to more than 3.1 million by 2022. (See table
1.) This represents a return to employment levels not achieved since 2007, when employment
peaked at 2.8 million, at the beginning of the Great Recession. The projected 393,600 increase in
employment over the ten year period represents a compound growth rate of 1.3 percent. The
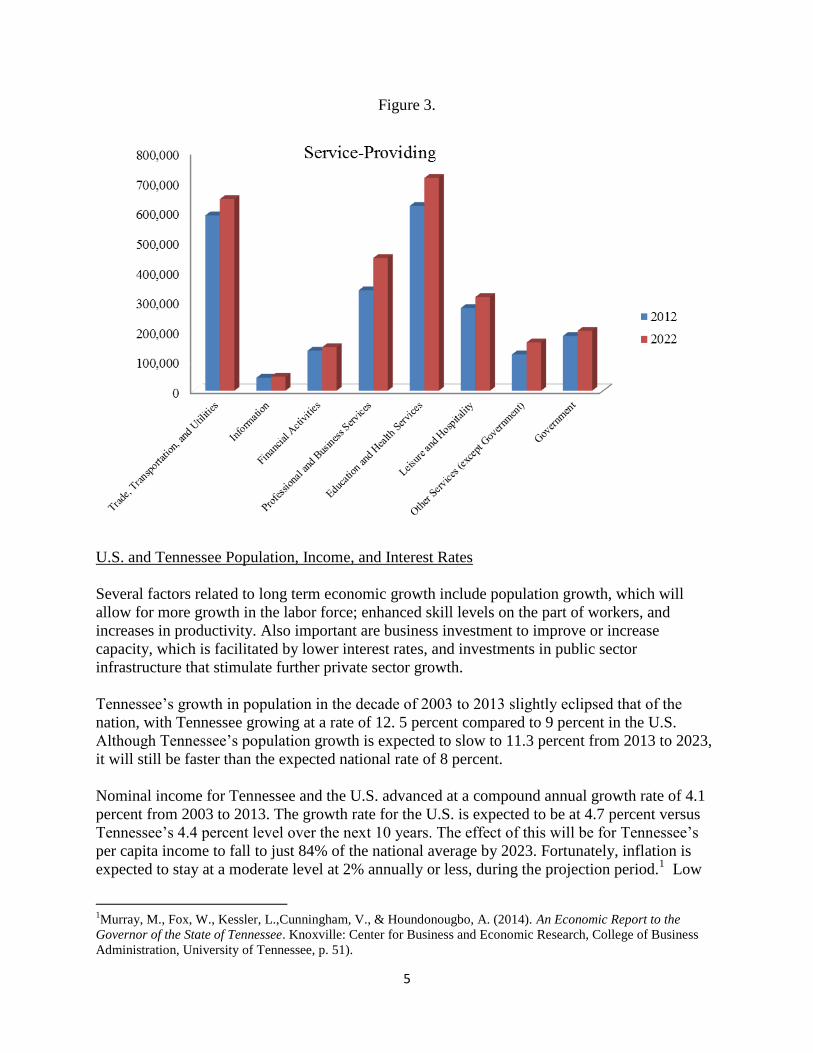
service-providing sector is expected to grow the most rapidly, at a compound annual growth rate
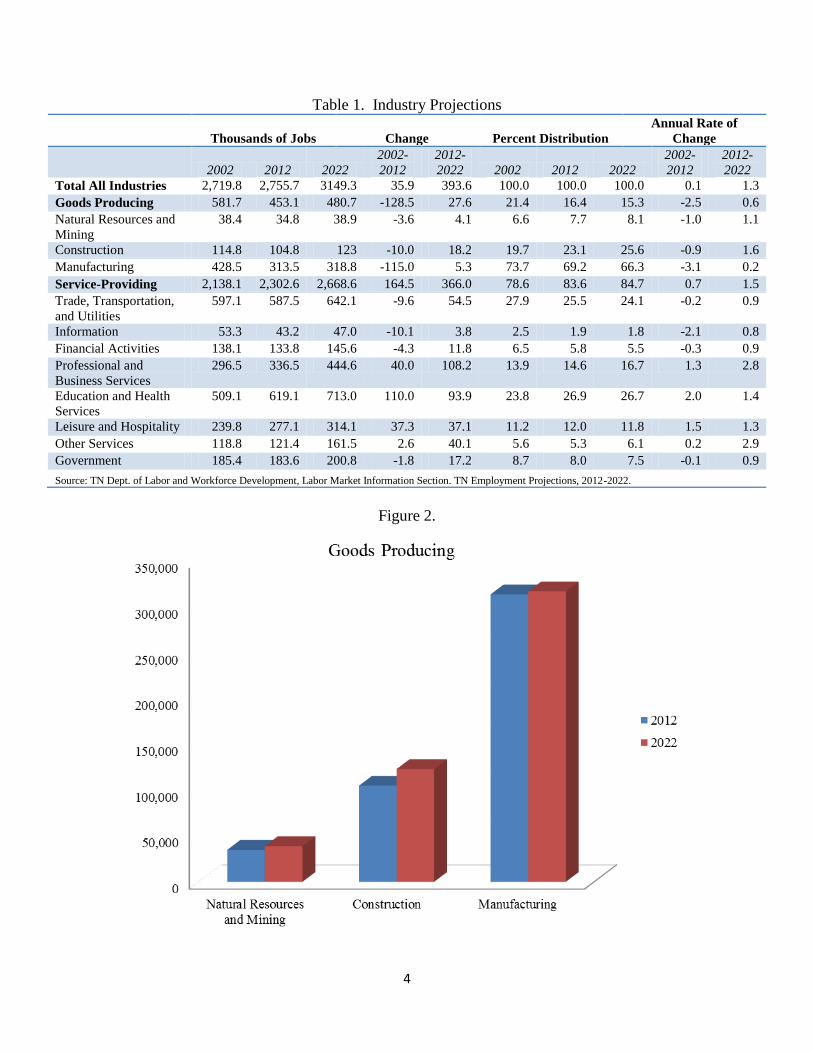
of 1.5 percent, while the goods producing sector will grow about a third as fast at 0.6 percent.
Nearly half of the employment growth will come from the professional and business services
(108,200) and the education and health services industry sectors (93,900).
The slowest rates of job creation are expected in manufacturing (0.2 percent); information (0.8
percent), financial activities (0.9 percent), and government (0.9 percent). However, within each
of these sectors, areas of dynamic job growth are anticipated.
The largest number of new jobs are expected to be in service (9,570); office and administrative
support (5,530), and education, legal, community service, arts and media (4,560) occupations.
(See table 4.) Annual replacement openings will be the largest in the service (16,480), office
and Administrative Support (10,320), and sales and related (8,650) occupations.
Industry Employment Analysis Overview
Figure 1.
4
Table 1. Industry Projections
Thousands of Jobs Change Percent Distribution
Annual Rate of
Change
2002 2012 2022
2002-
2012
2012-
2022 2002 2012 2022
2002-
2012
2012-
2022
Total All Industries 2,719.8 2,755.7 3149.3 35.9 393.6 100.0 100.0 100.0 0.1 1.3
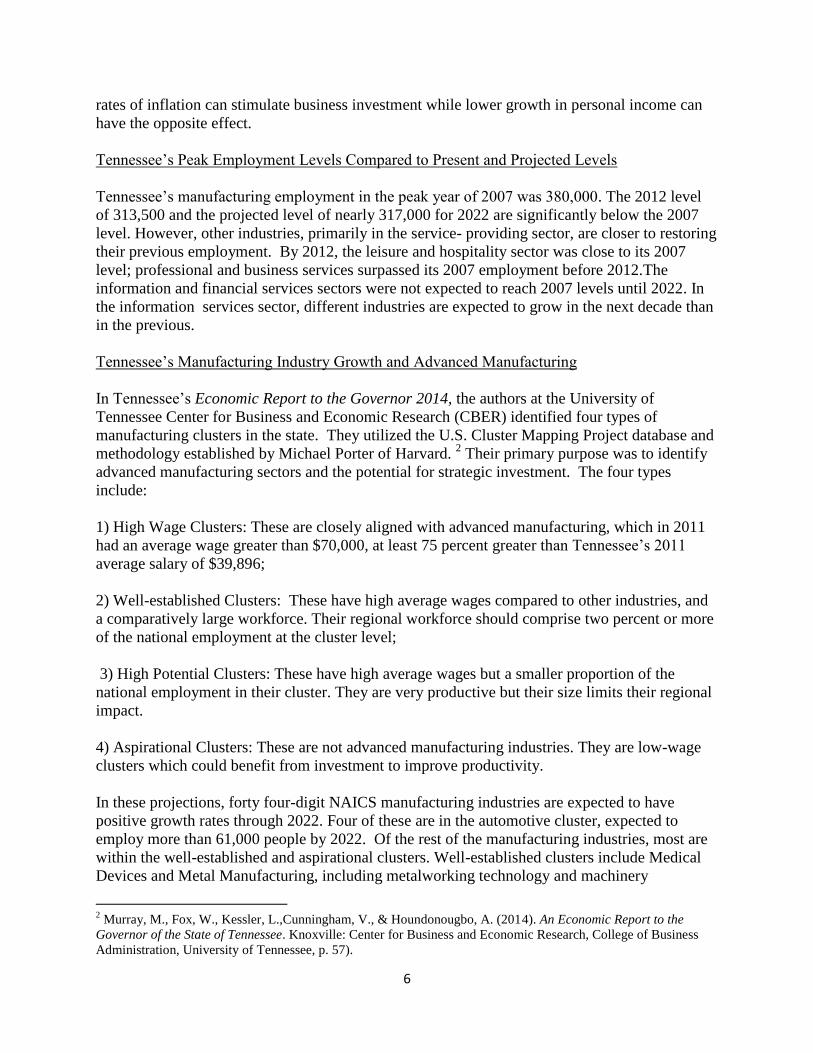
Goods Producing 581.7 453.1 480.7 -128.5 27.6 21.4 16.4 15.3 -2.5 0.6
Natural Resources and
Mining
38.4 34.8 38.9 -3.6 4.1 6.6 7.7 8.1 -1.0 1.1
Construction 114.8 104.8 123 -10.0 18.2 19.7 23.1 25.6 -0.9 1.6
Manufacturing 428.5 313.5 318.8 -115.0 5.3 73.7 69.2 66.3 -3.1 0.2
Service-Providing 2,138.1 2,302.6 2,668.6 164.5 366.0 78.6 83.6 84.7 0.7 1.5
Trade, Transportation,
and Utilities
597.1 587.5 642.1 -9.6 54.5 27.9 25.5 24.1 -0.2 0.9
Information 53.3 43.2 47.0 -10.1 3.8 2.5 1.9 1.8 -2.1 0.8
Financial Activities 138.1 133.8 145.6 -4.3 11.8 6.5 5.8 5.5 -0.3 0.9
Professional and
Business Services
296.5 336.5 444.6 40.0 108.2 13.9 14.6 16.7 1.3 2.8
Education and Health
Services
509.1 619.1 713.0 110.0 93.9 23.8 26.9 26.7 2.0 1.4
Leisure and Hospitality 239.8 277.1 314.1 37.3 37.1 11.2 12.0 11.8 1.5 1.3
Other Services 118.8 121.4 161.5 2.6 40.1 5.6 5.3 6.1 0.2 2.9
Government 185.4 183.6 200.8 -1.8 17.2 8.7 8.0 7.5 -0.1 0.9
Source: TN Dept. of Labor and Workforce Development, Labor Market Information Section. TN Employment Projections, 2012-2022.
Figure 2.
5
Figure 3.
U.S. and Tennessee Population, Income, and Interest Rates
Several factors related to long term economic growth include population growth, which will
allow for more growth in the labor force; enhanced skill levels on the part of workers, and
increases in productivity. Also important are business investment to improve or increase
capacity, which is facilitated by lower interest rates, and investments in public sector
infrastructure that stimulate further private sector growth.
Tennessee’s growth in population in the decade of 2003 to 2013 slightly eclipsed that of the
nation, with Tennessee growing at a rate of 12. 5 percent compared to 9 percent in the U.S.
Although Tennessee’s population growth is expected to slow to 11.3 percent from 2013 to 2023,
it will still be faster than the expected national rate of 8 percent.
Nominal income for Tennessee and the U.S. advanced at a compound annual growth rate of 4.1
percent from 2003 to 2013. The growth rate for the U.S. is expected to be at 4.7 percent versus
Tennessee’s 4.4 percent level over the next 10 years. The effect of this will be for Tennessee’s
per capita income to fall to just 84% of the national average by 2023. Fortunately, inflation is
expected to stay at a moderate level at 2% annually or less, during the projection period.1 Low
1Murray, M., Fox, W., Kessler, L.,Cunningham, V., & Houndonougbo, A. (2014). An Economic Report to the
Governor of the State of Tennessee. Knoxville: Center for Business and Economic Research, College of Business
Administration, University of Tennessee, p. 51).
6
rates of inflation can stimulate business investment while lower growth in personal income can
have the opposite effect.
Tennessee’s Peak Employment Levels Compared to Present and Projected Levels
Tennessee’s manufacturing employment in the peak year of 2007 was 380,000. The 2012 level
of 313,500 and the projected level of nearly 317,000 for 2022 are significantly below the 2007
level. However, other industries, primarily in the service- providing sector, are closer to restoring
their previous employment. By 2012, the leisure and hospitality sector was close to its 2007
level; professional and business services surpassed its 2007 employment before 2012.The
information and financial services sectors were not expected to reach 2007 levels until 2022. In
the information services sector, different industries are expected to grow in the next decade than
in the previous.
Tennessee’s Manufacturing Industry Growth and Advanced Manufacturing
In Tennessee’s Economic Report to the Governor 2014, the authors at the University of
Tennessee Center for Business and Economic Research (CBER) identified four types of
manufacturing clusters in the state. They utilized the U.S. Cluster Mapping Project database and
methodology established by Michael Porter of Harvard. 2 Their primary purpose was to identify
advanced manufacturing sectors and the potential for strategic investment. The four types
include:
1) High Wage Clusters: These are closely aligned with advanced manufacturing, which in 2011
had an average wage greater than $70,000, at least 75 percent greater than Tennessee’s 2011
average salary of $39,896;
2) Well-established Clusters: These have high average wages compared to other industries, and
a comparatively large workforce. Their regional workforce should comprise two percent or more
of the national employment at the cluster level;
3) High Potential Clusters: These have high average wages but a smaller proportion of the
national employment in their cluster. They are very productive but their size limits their regional
impact.
4) Aspirational Clusters: These are not advanced manufacturing industries. They are low-wage
clusters which could benefit from investment to improve productivity.
In these projections, forty four-digit NAICS manufacturing industries are expected to have
positive growth rates through 2022. Four of these are in the automotive cluster, expected to
employ more than 61,000 people by 2022. Of the rest of the manufacturing industries, most are
within the well-established and aspirational clusters. Well-established clusters include Medical
Devices and Metal Manufacturing, including metalworking technology and machinery
2 Murray, M., Fox, W., Kessler, L.,Cunningham, V., & Houndonougbo, A. (2014). An Economic Report to the
Governor of the State of Tennessee. Knoxville: Center for Business and Economic Research, College of Business
Administration, University of Tennessee, p. 57).

7
manufacturing. Aspirational clusters and sub-clusters include Apparel, Leather and Leather
Products, Wood Products, Construction Products and Services, and Furniture. As mentioned
above, these industries may be able to improve their productivity with targeted capital or
workforce investments.
Fastest Growing and Declining Industries
The projected increases in Tennessee’s healthcare industries mirror those of the U.S. An aging
population (17.3% of the population is projected to be 65 years or older by 2022) will in part
drive demand for health services. The Bureau of Labor Statistics notes that “increasing cost
pressures are expected to shift demand from hospitals and inpatient physician services to lower
cost home health services, outpatient health services, and clinical services.”3 The outpatient care
centers industry is expected to be one of the fastest growing industries in the state.
Other areas of top growth are professional and business services industries. Nationally, the
management of companies and enterprises industry is expected to grow because of businesses’
increasing need of consultants due to regulatory changes, technological advances, and new
management techniques.4 Similarly, increasing demand for these services and subsequent
industry employment growth is expected in Tennessee.
Table 2. Fastest Growing Industries
Industry Industry Title 2012 2022
Annual
Rate of
Change
562100 Waste Collection 2,100 4,110 6.9
336200 Motor Vehicle Body and Trailer Manufacturing 6,360 11,290 5.9
813300 Social Advocacy Organizations 2,660 4,130 4.5
485900 Other Transit and Ground Passenger Transportation 1,460 2,240 4.4
813200 Grantmaking and Giving Services 2,100 3,090 3.9
424600 Chemical and Allied Products Merchant Wholesalers 2,330 3,390 3.8
621900 Other Ambulatory Health Care Services 6,720 9,760 3.8
551100 Management of Companies and Enterprises 32,280 46,440 3.7
621400 Outpatient Care Centers 15,570 22,360 3.7
541100 Legal Services 13,980 20,000 3.6
493100 Warehousing and Storage 18,620 26,490 3.6
561600 Investigation and Security Services 19,360 27,480 3.6
424800 Beer, Wine, and Distilled Alcoholic Beverage Merchant Wholesalers 3,010 4,270 3.6
541600 Management, Scientific, and Technical Consulting Services 15,940 22,380 3.5
236100 Residential Building Construction 9,250 12,970 3.4
332300 Architectural and Structural Metals Manufacturing 8,120 11,280 3.3
423900 Miscellaneous Durable Goods Merchant Wholesalers 6,140 8,400 3.2
238900 Other Specialty Trade Contractors 8,780 11,950 3.1
561300 Employment Services 87,800 118,600 3.1
523900 Other Financial Investment Activities 3,390 4,560 3.0
3 Henderson, Richard. “Industry Employment and Output Projections to 2022.” Monthly Labor Review. Dec. 2013.
US Department of Labor: Bureau of Labor Statistics.
4 Ibid.
8
561100 Office Administrative Services 8,760 11,780 3.0 Source: TN Dept. of Labor and Workforce Development, Labor Market Information Section. TN Employment Projections, 2012-2022.
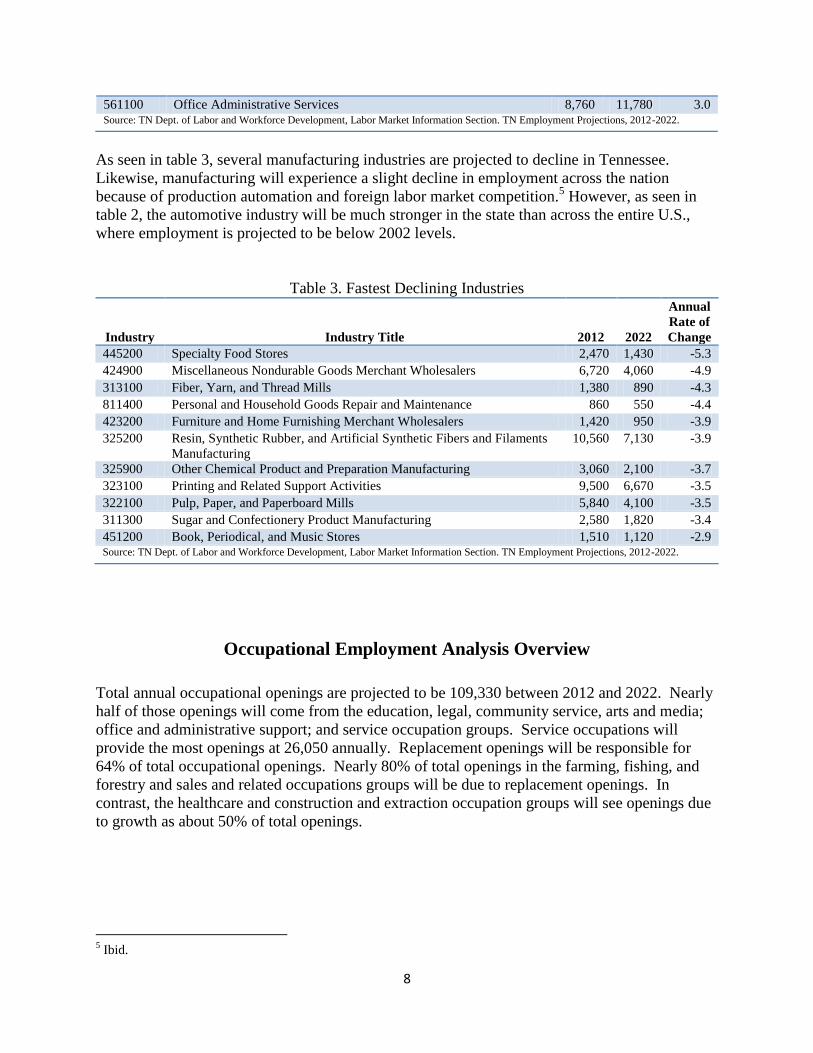
As seen in table 3, several manufacturing industries are projected to decline in Tennessee.
Likewise, manufacturing will experience a slight decline in employment across the nation
because of production automation and foreign labor market competition.5 However, as seen in
table 2, the automotive industry will be much stronger in the state than across the entire U.S.,
where employment is projected to be below 2002 levels.
Table 3. Fastest Declining Industries
Industry Industry Title 2012 2022
Annual
Rate of
Change
445200 Specialty Food Stores 2,470 1,430 -5.3
424900 Miscellaneous Nondurable Goods Merchant Wholesalers 6,720 4,060 -4.9
313100 Fiber, Yarn, and Thread Mills 1,380 890 -4.3
811400 Personal and Household Goods Repair and Maintenance 860 550 -4.4
423200 Furniture and Home Furnishing Merchant Wholesalers 1,420 950 -3.9
325200 Resin, Synthetic Rubber, and Artificial Synthetic Fibers and Filaments
Manufacturing
10,560 7,130 -3.9
325900 Other Chemical Product and Preparation Manufacturing 3,060 2,100 -3.7
323100 Printing and Related Support Activities 9,500 6,670 -3.5
322100 Pulp, Paper, and Paperboard Mills 5,840 4,100 -3.5
311300 Sugar and Confectionery Product Manufacturing 2,580 1,820 -3.4
451200 Book, Periodical, and Music Stores 1,510 1,120 -2.9 Source: TN Dept. of Labor and Workforce Development, Labor Market Information Section. TN Employment Projections, 2012-2022.
Occupational Employment Analysis Overview
Total annual occupational openings are projected to be 109,330 between 2012 and 2022. Nearly
half of those openings will come from the education, legal, community service, arts and media;
office and administrative support; and service occupation groups. Service occupations will
provide the most openings at 26,050 annually. Replacement openings will be responsible for
64% of total occupational openings. Nearly 80% of total openings in the farming, fishing, and
forestry and sales and related occupations groups will be due to replacement openings. In
contrast, the healthcare and construction and extraction occupation groups will see openings due
to growth as about 50% of total openings.
5 Ibid.

9
Table 4. Openings by Occupational Group
Fastest Growing and Declining Occupations
The fastest growing and declining occupations are ranked by their projected compound annual
growth rates for each of the two tables. The rankings are limited to occupations with a base year
employment level greater than 450.
Table 5. Fastest Growing Occupations
Occupation 2012 2022
Annual
Openings
Annual
Replace-
ments
Growth
Rate
Computer Numerically Controlled Machine Tool
Programmers, Metal and Plastic
490 740 20 10 4.2
Paralegals and Legal Assistants 4,820 7,170 240 80 4.1
Skincare Specialists 560 830 30 10 4.0
Physician Assistants 1,300 1,880 60 20 3.8
Interpreters and Translators 690 1,000 30 10 3.8
Diagnostic Medical Sonographers 1,450 2,060 60 20 3.6
Meeting, Convention, and Event Planners 1,180 1,670 50 20 3.5
Veterinary Technologists and Technicians 1,620 2,250 60 20 3.3
Welding, Soldering, and Brazing Machine Setters,
Operators, and Tenders
1,740 2,380 70 40 3.2
Occupation Group 2012 2022 Change
Annual
Growth
Openings
Annual
Replace-
ments
Total
Annual
Openings
Computer, Engineering, and
Science Occupations
101,930 116,320 14,390 1,480 2,200 3,680
Construction and Extraction
Occupations
105,140 120,000 14,860 1,490 1,800 3,290
Education, Legal, Community
Service, Arts, and Media
Occupations
265,580 310,930 45,350 4,560 5,730 10,280
Farming, Fishing, and Forestry
Occupations
23,220 24,840 1,620 180 660 840
Healthcare Occupations 186,820 222,440 35,610 3,570 3,830 7,400
Installation, Maintenance, and
Repair Occupations
116,090 129,210 13,130 1,330 2,690 4,020
Management, Business, and
Financial Occupations
297,610 337,860 40,250 4,170 6,020 10,190
Office and Administrative
Support Occupations
463,120 516,310 53,190 5,530 10,320 15,850
Production Occupations 254,000 277,120 23,130 2,810 5,060 7,870
Sales and Related Occupations 284,620 306,330 21,710 2,210 8,650 10,860
Service Occupations 596,980 692,290 95,310 9,570 16,480 26,050
Transportation and Material
Moving Occupations
253,960 283,870 29,910 3,000 6,010 9,010
Total 2,949,070 3,337,520 388,450 39,900 69,430 109,330 Source: TN Dept. of Labor and Workforce Development, Labor Market Information Section. TN Employment Projections, 2012-2022.

10
Market Research Analysts and Marketing Specialists 5,560 7,620 210 80 3.2
Ophthalmic Medical Technicians 460 620 20 - 3.1
Nurse Practitioners 4,100 5,560 150 80 3.1
Brickmasons and Blockmasons 930 1,260 30 10 3.0
Information Security Analysts 800 1,080 30 10 3.0
Medical Equipment Repairers 1,030 1,370 30 30 2.9
Operations Research Analysts 1,100 1,460 40 30 2.9
Security Guards 22,050 29,280 720 340 2.9
Computer-Controlled Machine Tool Operators, Metal
and Plastic
2,620 3,470 90 70 2.8
Surgeons 1,150 1,520 40 30 2.8
Nurse Anesthetists 2,100 2,770 70 40 2.8 Source: TN Dept. of Labor and Workforce Development, Labor Market Information Section. TN Employment Projections, 2012-2022.
Table 6. Fastest Declining Occupations
Occupation 2012 2022
Annual
Openings
Annual
Replace-
ments
Growth
Rate
Chemical Plant and System Operators 1,540 1,090 - 60 -3.4
Textile Winding, Twisting, and Drawing Out
Machine Setters, Operators, and Tenders
1,130 810 - 20
-3.3
Print Binding and Finishing Workers 1,180 900 - 20 -2.7
Extruding and Forming Machine Setters, Operators,
and Tenders, Synthetic and Glass Fibers
600 460 - 10
-2.6
Prepress Technicians and Workers 880 690 - 20 -2.4
Door-to-Door Sales Workers, News and Street
Vendors, and Related Workers
1,220 960 - 10
-2.4
Data Entry Keyers 4,170 3,320 - 50 -2.3
Paper Goods Machine Setters, Operators, and
Tenders
2,940 2,360 - 30
-2.2
Travel Agents 760 620 - 10 -2.0
Cutting and Slicing Machine Setters, Operators, and
Tenders
2,070 1,690 - 40
-2.0
Psychiatric Aides 2,150 1,780 - 40 -1.9
Chemical Equipment Operators and Tenders 1,690 1,400 - 60 -1.9
Chemical Engineers 760 630 - 20 -1.9
Word Processors and Typists 640 540 - - -1.7
Printing Press Operators 4,390 3,710 - 80 -1.7
Tire Builders 590 510 - 10 -1.4
Source: TN Dept. of Labor and Workforce Development, Labor Market Information Section. TN Employment Projections, 2012-2022.

11
Job Requirements Projections
Table 7. Openings by Education Level
Occupation Group and Education Level
Annual
Total
Openings
Percent
Distri-
bution
Computer, Engineering, and Science Occupations 3,680
Doctoral or professional degree 120 3.3
Master's degree 80 2.2
Bachelor's degree 2,560 69.6
Associate's degree 620 16.8
Some college, no degree 250 6.8
High school diploma or equivalent 50 1.4
Construction and Extraction Occupations 3,290
High school diploma or equivalent 1,960 59.6
Less than high school 1,340 40.7
Education, Legal, Community Service, Arts, and Media Occupations 10,280
Doctoral or professional degree 1,060 10.3
Master's degree 830 8.1
Bachelor's degree 5,740 55.8
Associate's degree 830 8.1
Some college, no degree 790 7.7
Postsecondary non-degree award 170 1.7
High school diploma or equivalent 870 8.5
Farming, Fishing, and Forestry Occupations 840
Bachelor's degree 10 1.2
High school diploma or equivalent 70 8.3
Less than high school 760 90.5
Healthcare Practitioners and Technical Occupations 7,390
Doctoral or professional degree 1,250 16.9
Master's degree 560 7.6
Bachelor's degree 410 5.5
Associate's degree 2,930 39.6
Postsecondary non-degree award 1,740 23.5
High school diploma or equivalent 500 6.8
Installation, Maintenance, and Repair Occupations 4,010
Associate's degree 80 2.0
Some college, no degree 60 1.5
Postsecondary non-degree award 580 14.5
High school diploma or equivalent 3,300 82.3
Management, Business, and Financial Occupations 10,190
Master's degree 320 3.1
Bachelor's degree 7,610 74.7
Associate's degree 10 0.1
High school diploma or equivalent 2,250 22.1
Office and Administrative Support Occupations 15,850
Bachelor's degree 10 0.1
Associate's degree 10 0.1
High school diploma or equivalent 14,250 89.9
Less than high school 1,580 10.0
12
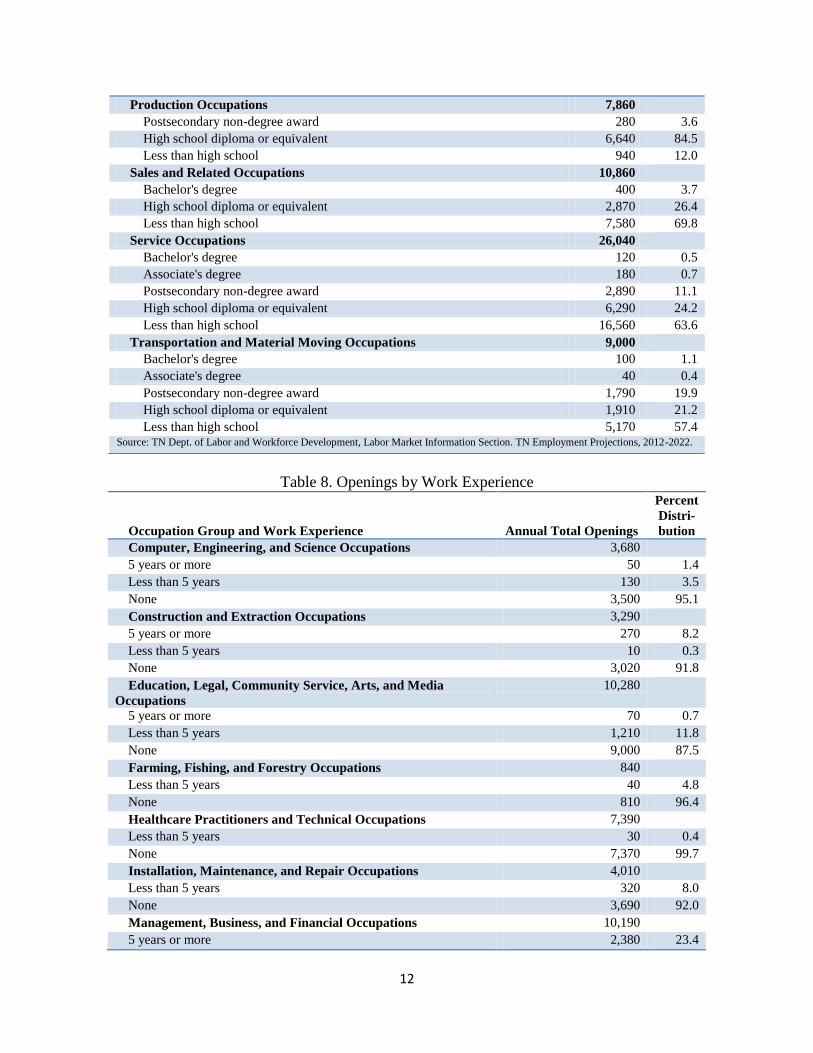
Table 8. Openings by Work Experience
Occupation Group and Work Experience Annual Total Openings
Percent
Distri-
bution
Computer, Engineering, and Science Occupations 3,680
5 years or more 50 1.4
Less than 5 years 130 3.5
None 3,500 95.1
Construction and Extraction Occupations 3,290
5 years or more 270 8.2
Less than 5 years 10 0.3
None 3,020 91.8
Education, Legal, Community Service, Arts, and Media
Occupations
10,280
5 years or more 70 0.7
Less than 5 years 1,210 11.8
None 9,000 87.5
Farming, Fishing, and Forestry Occupations 840
Less than 5 years 40 4.8
None 810 96.4
Healthcare Practitioners and Technical Occupations 7,390
Less than 5 years 30 0.4
None 7,370 99.7
Installation, Maintenance, and Repair Occupations 4,010
Less than 5 years 320 8.0
None 3,690 92.0
Management, Business, and Financial Occupations 10,190
5 years or more 2,380 23.4
Production Occupations 7,860
Postsecondary non-degree award 280 3.6
High school diploma or equivalent 6,640 84.5
Less than high school 940 12.0
Sales and Related Occupations 10,860
Bachelor's degree 400 3.7
High school diploma or equivalent 2,870 26.4
Less than high school 7,580 69.8
Service Occupations 26,040
Bachelor's degree 120 0.5
Associate's degree 180 0.7
Postsecondary non-degree award 2,890 11.1
High school diploma or equivalent 6,290 24.2
Less than high school 16,560 63.6
Transportation and Material Moving Occupations 9,000
Bachelor's degree 100 1.1
Associate's degree 40 0.4
Postsecondary non-degree award 1,790 19.9
High school diploma or equivalent 1,910 21.2
Less than high school 5,170 57.4 Source: TN Dept. of Labor and Workforce Development, Labor Market Information Section. TN Employment Projections, 2012-2022.

13
Less than 5 years 3,700 36.3
None 4,110 40.3
Office and Administrative Support Occupations 15,850
Less than 5 years 1,500 9.5
None 14,350 90.5
Production Occupations 7,860
Less than 5 years 260 3.3
None 7,600 96.7
Sales and Related Occupations 10,860
Less than 5 years 1,120 10.3
None 9,740 89.7
Service Occupations 26,040
5 years or more 80 0.3
Less than 5 years 2,450 9.4
None 23,510 90.3
Transportation and Material Moving Occupations 9,000
Less than 5 years 580 6.4
None 8,430 93.7 Source: TN Dept. of Labor and Workforce Development, Labor Market Information Section. TN Employment Projections, 2012-2022.
Table 9. Openings by Job Training
Occupation Group and Job Training Annual Total Openings
Percent
Distri-
bution
Computer, Engineering, and Science Occupations 3,680
Internship/residency 150 4.1
Long-term on-the-job training 20 0.5
Moderate-term on-the-job training 390 10.6
None 3,120 84.8
Construction and Extraction Occupations 3,290
Apprenticeship 1,170 35.6
Long-term on-the-job training 20 0.6
Moderate-term on-the-job training 750 22.8
Short-term on-the-job training 1,140 34.7
None 210 6.4
Education, Legal, Community Service, Arts, and Media
Occupations
10,280
Internship/residency 3,540 34.4
Long-term on-the-job training 450 4.4
Moderate-term on-the-job training 830 8.1
Short-term on-the-job training 400 3.9
None 5,070 49.3
Farming, Fishing, and Forestry Occupations 840
Moderate-term on-the-job training 50 6.0
Short-term on-the-job training 770 91.7
None 30 3.6
Healthcare Practitioners and Technical Occupations 7,390
Internship/residency 620 8.4
Long-term on-the-job training 40 0.5
Moderate-term on-the-job training 450 6.1

14
Short-term on-the-job training 60 0.8
None 6,230 84.3
Installation, Maintenance, and Repair Occupations 4,010
Apprenticeship 40 1.0
Long-term on-the-job training 2,540 63.3
Moderate-term on-the-job training 790 19.7
Short-term on-the-job training 160 4.0
None 490 12.2
Management, Business, and Financial Occupations 10,190
Long-term on-the-job training 380 3.7
Moderate-term on-the-job training 850 8.3
None 8,960 87.9
Office and Administrative Support Occupations 15,850
Moderate-term on-the-job training 3,090 19.5
Short-term on-the-job training 11,250 71.0
None 1,510 9.5
Production Occupations 7,860
Long-term on-the-job training 870 11.1
Moderate-term on-the-job training 5,720 72.8
Short-term on-the-job training 990 12.6
None 280 3.6
Sales and Related Occupations 10,860
Long-term on-the-job training 40 0.4
Moderate-term on-the-job training 1,560 14.4
Short-term on-the-job training 8,030 73.9
None 1,220 11.2
Service Occupations 26,040
Long-term on-the-job training 220 0.8
Moderate-term on-the-job training 2,390 9.2
Short-term on-the-job training 18,460 70.9
None 4,970 19.1
Transportation and Material Moving Occupations 9,000
Long-term on-the-job training 50 0.6
Moderate-term on-the-job training 460 5.1
Short-term on-the-job training 7,990 88.8
None 510 5.7 Source: TN Dept. of Labor and Workforce Development, Labor Market Information Section. TN Employment Projections, 2012-2022.
15
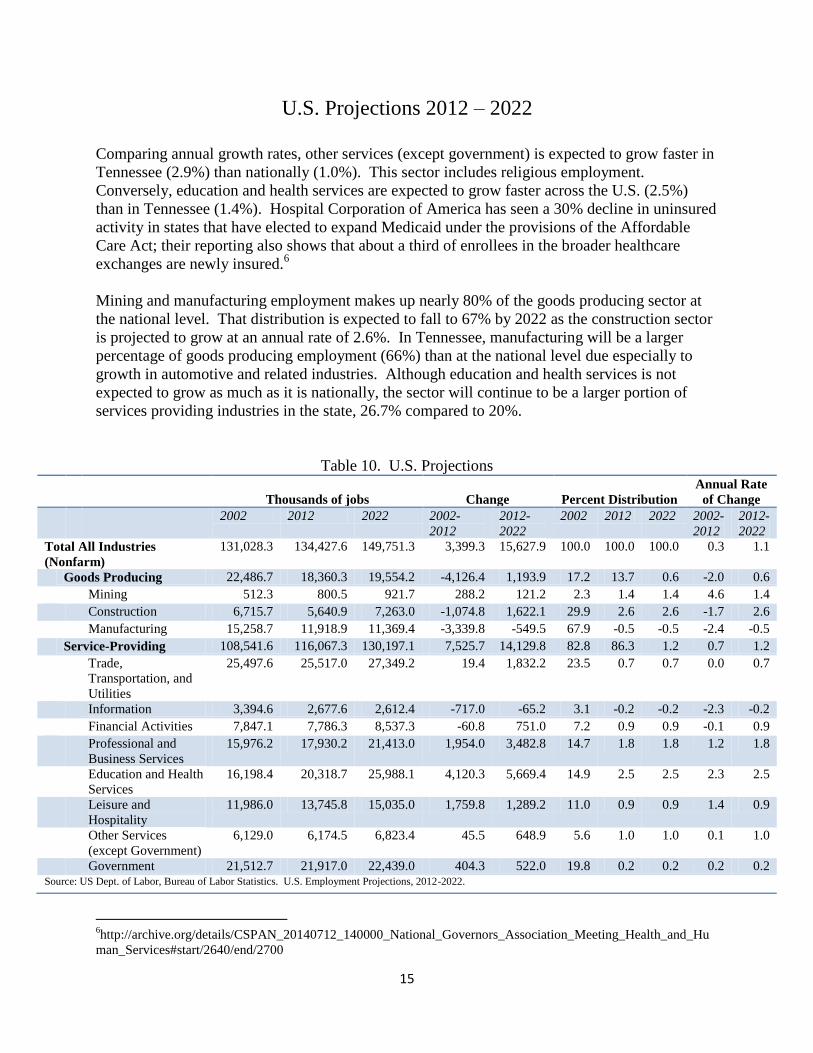
U.S. Projections 2012 – 2022
Comparing annual growth rates, other services (except government) is expected to grow faster in
Tennessee (2.9%) than nationally (1.0%). This sector includes religious employment.
Conversely, education and health services are expected to grow faster across the U.S. (2.5%)
than in Tennessee (1.4%). Hospital Corporation of America has seen a 30% decline in uninsured
activity in states that have elected to expand Medicaid under the provisions of the Affordable
Care Act; their reporting also shows that about a third of enrollees in the broader healthcare
exchanges are newly insured.6
Mining and manufacturing employment makes up nearly 80% of the goods producing sector at
the national level. That distribution is expected to fall to 67% by 2022 as the construction sector
is projected to grow at an annual rate of 2.6%. In Tennessee, manufacturing will be a larger
percentage of goods producing employment (66%) than at the national level due especially to
growth in automotive and related industries. Although education and health services is not
expected to grow as much as it is nationally, the sector will continue to be a larger portion of
services providing industries in the state, 26.7% compared to 20%.
Table 10. U.S. Projections
Thousands of jobs Change Percent Distribution
Annual Rate
of Change
2002 2012 2022 2002-
2012
2012-
2022
2002 2012 2022 2002-
2012
2012-
2022
Total All Industries
(Nonfarm)
131,028.3 134,427.6 149,751.3 3,399.3 15,627.9 100.0 100.0 100.0 0.3 1.1
Goods Producing 22,486.7 18,360.3 19,554.2 -4,126.4 1,193.9 17.2 13.7 0.6 -2.0 0.6
Mining 512.3 800.5 921.7 288.2 121.2 2.3 1.4 1.4 4.6 1.4
Construction 6,715.7 5,640.9 7,263.0 -1,074.8 1,622.1 29.9 2.6 2.6 -1.7 2.6
Manufacturing 15,258.7 11,918.9 11,369.4 -3,339.8 -549.5 67.9 -0.5 -0.5 -2.4 -0.5
Service-Providing 108,541.6 116,067.3 130,197.1 7,525.7 14,129.8 82.8 86.3 1.2 0.7 1.2
Trade,
Transportation, and
Utilities
25,497.6 25,517.0 27,349.2 19.4 1,832.2 23.5 0.7 0.7 0.0 0.7
Information 3,394.6 2,677.6 2,612.4 -717.0 -65.2 3.1 -0.2 -0.2 -2.3 -0.2
Financial Activities 7,847.1 7,786.3 8,537.3 -60.8 751.0 7.2 0.9 0.9 -0.1 0.9
Professional and
Business Services
15,976.2 17,930.2 21,413.0 1,954.0 3,482.8 14.7 1.8 1.8 1.2 1.8
Education and Health
Services
16,198.4 20,318.7 25,988.1 4,120.3 5,669.4 14.9 2.5 2.5 2.3 2.5
Leisure and
Hospitality
11,986.0 13,745.8 15,035.0 1,759.8 1,289.2 11.0 0.9 0.9 1.4 0.9
Other Services
(except Government)
6,129.0 6,174.5 6,823.4 45.5 648.9 5.6 1.0 1.0 0.1 1.0
Government 21,512.7 21,917.0 22,439.0 404.3 522.0 19.8 0.2 0.2 0.2 0.2 Source: US Dept. of Labor, Bureau of Labor Statistics. U.S. Employment Projections, 2012-2022.
6http://archive.org/details/CSPAN_20140712_140000_National_Governors_Association_Meeting_Health_and_Hu
man_Services#start/2640/end/2700

Explanatory Note: Every two years, the Tennessee Department of Labor and Workforce Development prepares a
set of long term industry and occupational employment projections for the state after these have been developed at
the national level by the U.S. Bureau of Labor Statistics (BLS). Some Tennessee industries are expected to follow
national trends; when that is not expected to be true, more localized forecasting models are used. Tennessee’s
projections are developed for most four digit NAICS industries and matched with the state occupational staffing
patterns for these industries from the Occupational Employment Survey (OES). Occupational projections are then
enhanced based on expected national long term trends, if applicable. Job openings include openings due to growth
and job separations . The BLS national projections for 2012 to 2022 assume recovery from the Great Recession and
a full-employment economy by 2022.
Top Related