


Languages
Pages
Legal

Telefónica, S.AInvestor Relations

Telefónica, S.AInvestor Relations
Telefónica, S.AInvestor Relations
DisclaimerThis document contains statements that constitute forward looking statements about the Company including financial projections and estimates and their underlying assumptions, statements regarding plans, objectives and expectations which refer to the intent, belief or current prospects of the customer base, estimates regarding, among others, future growth in the different business lines and the global business, market share, financial results and other aspects of the activity and situation relating to the Company. The forward-looking statements in this document can be identified, in some instances, by the use of words such as "expects", "anticipates", "intends", "believes", and similar language or the negative thereof or by forward-looking nature of discussions of strategy, plans or intentions.Such forward-looking statements, by their nature, are not guarantees of future performance and involve risks and uncertainties, and other important factors that could cause actual developments or results to differ from those
expressed in our forward looking statements. These risks and uncertainties include those discussed or identified in fuller disclosure documents filed by Telefónica with the relevant Securities Markets Regulators, and in particular, with the Spanish Market Regulator.Analysts and investors, and any other person or entity that may need to take decisions, or prepare or release opinions about the securities issued by the Company, are cautioned not to place undue reliance on those forward looking statements, which speak only as of the date of this presentation. Except as required by applicable law, Telefónica undertakes no obligation to release publicly the results of
any revisions to these forward looking statements which may be made to reflect events and circumstances
after the date of this presentation, including, without limitation, changes in Telefónica’s
business or acquisition strategy or to reflect the occurrence of unanticipated events.Neither this presentation nor any of the information contained herein constitutes an offer of purchase, sale or exchange, nor a request for an offer of purchase, sale or exchange of securities, or any advice or recommendation with respect to such securities.Finally, this document may contain summarized information or information that has not been audited. In this sense, this information is subject to, and must be read in conjunction with, all other publicly available information, including if it is necessary, any fuller disclosure document published by Telefónica.
1
Telefónica, S.AInvestor Relations
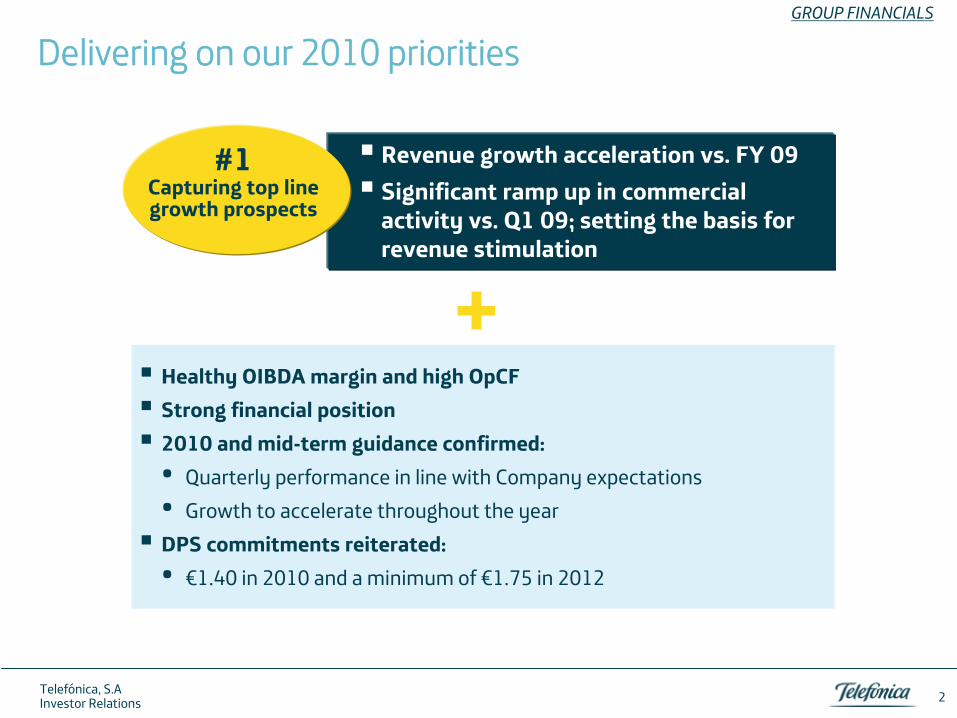
Delivering on our 2010 priorities GROUP FINANCIALS
Revenue growth acceleration vs. FY 09
Significant ramp up in commercial activity vs. Q1 09; setting the basis for revenue stimulation
#1Capturing top line growth prospects
Healthy OIBDA margin and high OpCF
Strong financial position
2010 and mid-term guidance confirmed:•
Quarterly performance in line with Company expectations
•
Growth to accelerate throughout the year
DPS commitments reiterated: •
€1.40 in 2010 and a minimum of €1.75 in 2012
2
Telefónica, S.AInvestor Relations
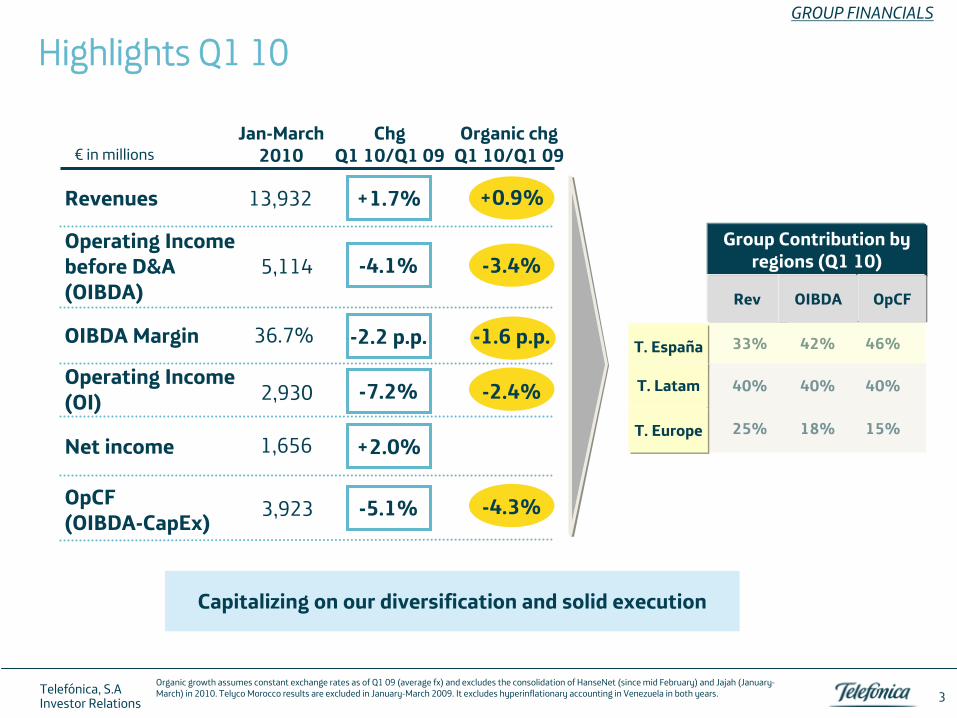
Highlights Q1 10GROUP FINANCIALS
Organic growth assumes constant exchange rates as of Q1 09 (average fx) and excludes the consolidation of HanseNet
(since mid February) and Jajah
(January-
March) in 2010. Telyco
Morocco results are excluded in January-March 2009. It excludes hyperinflationary accounting in Venezuela in both years.
Jan-March2010
Revenues
Operating Income(OI)
ChgQ1 10/Q1 09
Net income
+1.7%
-7.2%
€
in millions
Operating Incomebefore D&A (OIBDA)
-4.1%
+2.0%
-5.1%
OIBDA Margin -2.2 p.p.
Organic chgQ1 10/Q1 09
OpCF(OIBDA-CapEx)
13,932
5,114
2,930
1,656
3,923
36.7%
+0.9%
-3.4%
-1.6 p.p.
-2.4%
-4.3%
Group Contribution by regions (Q1 10)
Rev OIBDA OpCF
33%
42%
46%
40%
40%
40%
25%
18%
15%
Capitalizing on our diversification and solid execution
T. España
T. Latam
T. Europe
3
Telefónica, S.AInvestor Relations
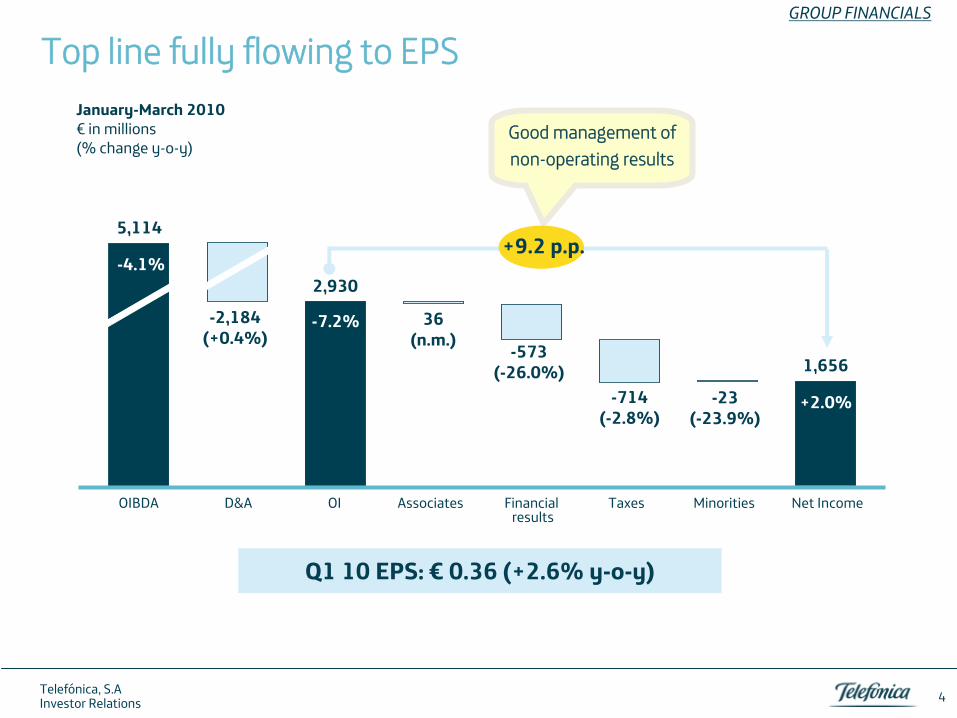
Top line fully flowing to EPSGROUP FINANCIALS
Q1 10 EPS: €
0.36 (+2.6% y-o-y)
January-March 2010€
in millions (% change y-o-y)
36(n.m.)
-573(-26.0%)
-714(-2.8%)
-23(-23.9%)
2,930
1,656
OI Associates Financialresults
Taxes Minorities Net Income
5,114
-2,184(+0.4%)
D&AOIBDA
-4.1%
-7.2%
+2.0%
+9.2 p.p.
Good management of non-operating results
4
Telefónica, S.AInvestor Relations
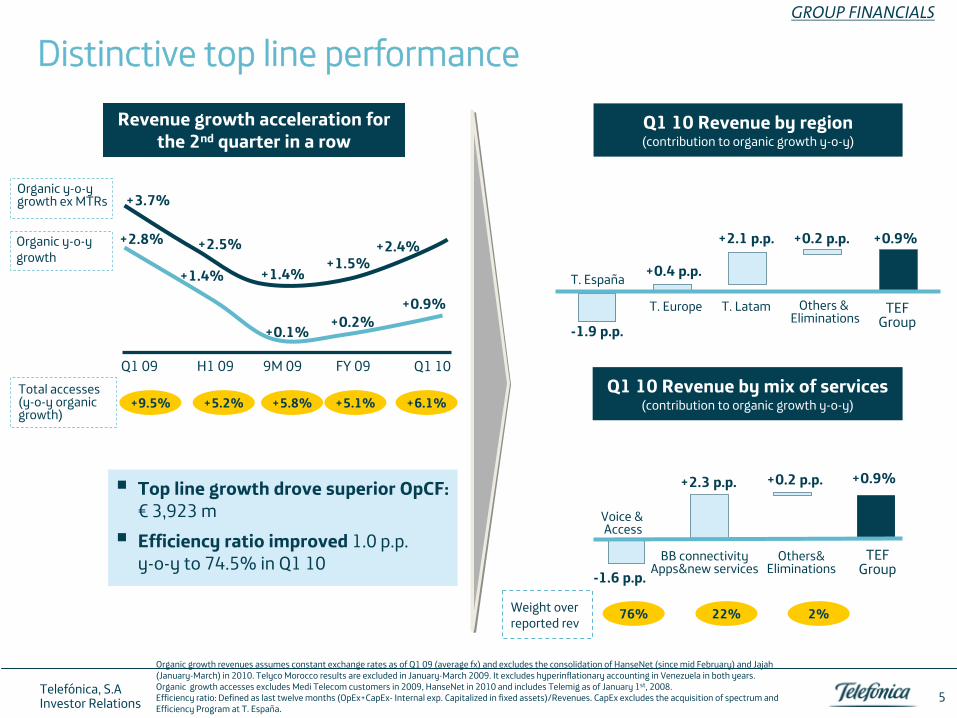
Distinctive top line performanceGROUP FINANCIALS
H1 09 9M 09Q1 09 FY 09 Q1 10
+3.7%
+2.5%
+1.4%+1.5%
+2.4%+2.8%
+1.4%
+0.1%+0.2%
+0.9%
Revenue growth acceleration for the 2nd
quarter in a row
Organic y-o-ygrowth ex MTRs
Total accesses (y-o-y
organic growth)
+9.5% +5.2% +5.8% +5.1% +6.1%
Q1 10 Revenue by region(contribution to organic growth y-o-y)
Q1 10 Revenue by mix of services (contribution to organic growth y-o-y)
Top line growth drove superior OpCF:
€
3,923 m
Efficiency ratio improved
1.0 p.p. y-o-y
to 74.5% in Q1 10
Organic y-o-ygrowth
Organic growth revenues assumes constant exchange rates as of Q1
09 (average fx) and excludes the consolidation of HanseNet
(since mid February) and Jajah
(January-March) in 2010. Telyco
Morocco results are excluded in January-March 2009. It excludes hyperinflationary accounting in Venezuela in both years. Organic growth accesses excludes Medi
Telecom customers in 2009, HanseNet
in 2010 and includes Telemig
as of January 1st, 2008.Efficiency ratio: Defined as last twelve months (OpEx+CapEx-
Internal exp. Capitalized in fixed assets)/Revenues. CapEx excludes the acquisition of spectrum and Efficiency Program at T. España.
+2.3
p.p.
-1.6 p.p.
Voice
&Access
BB connectivity
Apps&new
services
+0.9%
TEF Group
Weight
over
reported
rev76% 22%
5
+2.1 p.p.
+0.4
p.p.
-1.9 p.p.
T. España
T. Europe T. Latam
+0.9%
TEF Group
+0.2 p.p.
Others
& Eliminations
Others&Eliminations
+0.2 p.p.
2%
Telefónica, S.AInvestor Relations
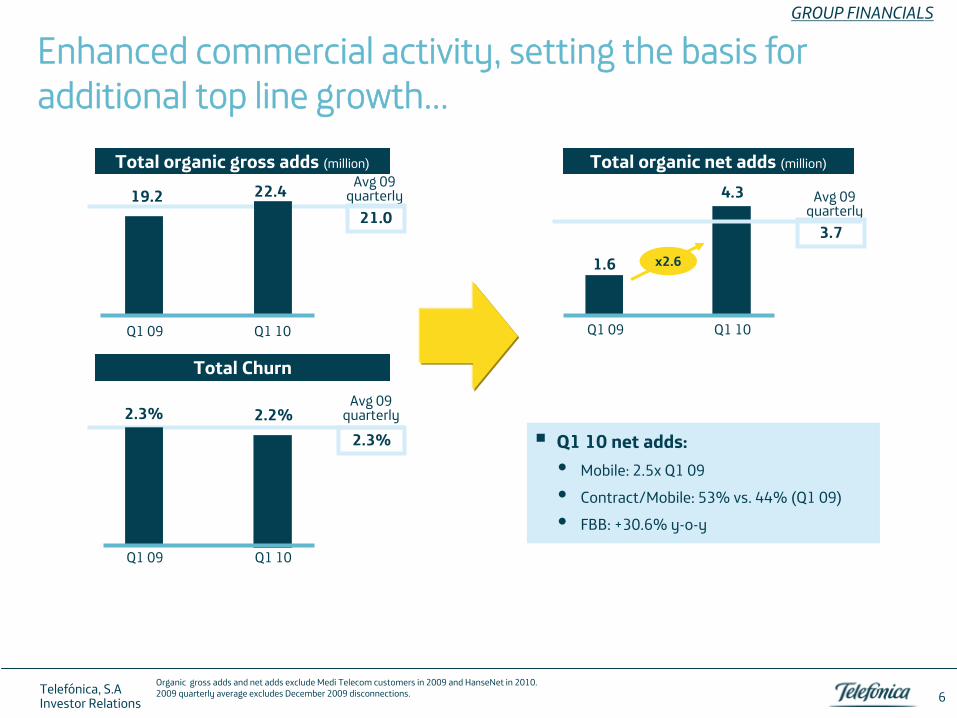
Enhanced commercial activity, setting the basis for additional top line growth…
GROUP FINANCIALS
Organic gross adds and net adds exclude Medi
Telecom customers in 2009 and HanseNet
in 2010.2009 quarterly average excludes December 2009 disconnections.
Q1 10 net adds:
Mobile: 2.5x Q1 09
Contract/Mobile: 53% vs. 44% (Q1 09)
FBB: +30.6% y-o-y
Total organic gross adds (million)
Total Churn
Q1 09 Q1 10
Avg
09 quarterly
2.3%2.2%2.3%
Total organic net adds (million)
Q1 09 Q1 10
Avg
09 quarterly
21.022.419.2 4.3
Q1 09 Q1 10
Avg
09 quarterly
3.7
1.6 x2.6
6
Telefónica, S.AInvestor Relations
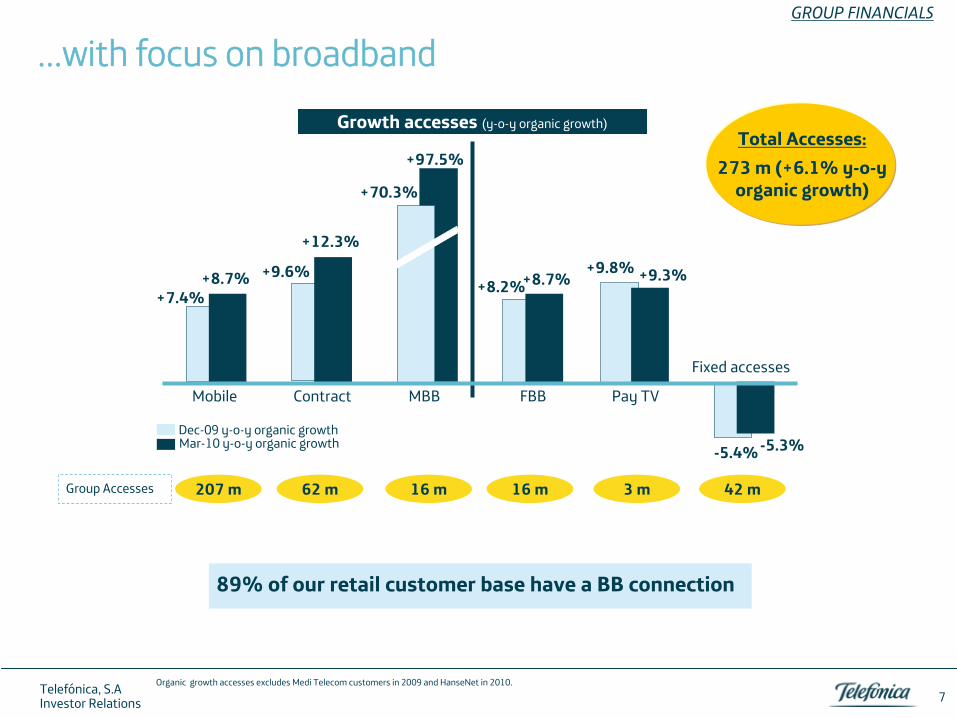
…with focus on broadband GROUP
FINANCIALS
Growth accesses (y-o-y
organic growth)
Organic growth accesses excludes Medi
Telecom customers in 2009 and HanseNet
in 2010.
MBB FBB Pay TV
Fixed accesses
-5.3%
207 m 62 m 16 m 16 m 42 m3 m
89% of our retail customer base have a BB connection
+9.6%
Mobile
+8.7%
+12.3%
Contract
+7.4%
+97.5%
+8.7% +9.3%+8.2%
+9.8%
-5.4%Mar-10 y-o-y
organic growthDec-09 y-o-y
organic growth
7
Total Accesses:273 m (+6.1% y-o-y
organic growth)
Group Accesses
+70.3%
Telefónica, S.AInvestor Relations
-0.2 p.p.+2.6 p.p.+1.3 p.p.-0.5 p.p. -0.1 p.p.
GROUP FINANCIALS
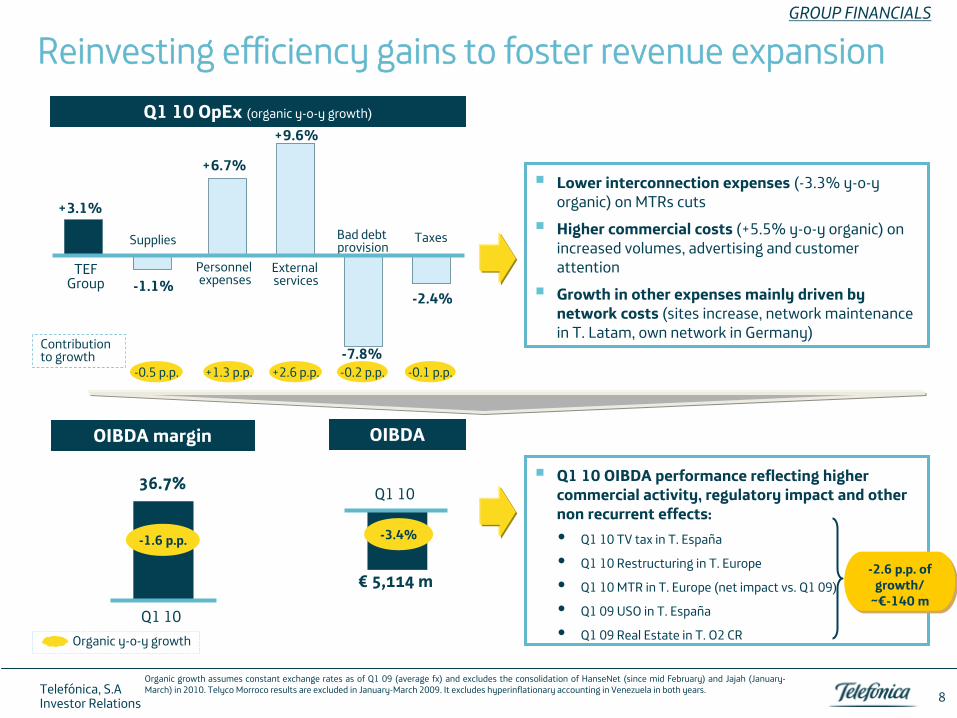
Reinvesting efficiency gains to foster revenue expansion
Organic growth assumes constant exchange rates as of Q1 09 (average fx) and excludes the consolidation of HanseNet
(since mid February) and Jajah
(January-
March) in 2010. Telyco
Morroco
results are excluded in January-March 2009. It excludes hyperinflationary accounting in Venezuela in both years.
Q1 10
36.7%
-1.6 p.p.
OIBDA margin
Q1 10 OpEx
(organic y-o-y
growth)
Organic y-o-y
growth
+9.6%
Lower interconnection expenses (-3.3% y-o-y
organic) on MTRs
cuts
Higher commercial costs
(+5.5% y-o-y
organic) on increased volumes, advertising and customer attention
Growth in other expenses mainly driven by network costs
(sites increase, network maintenance in T. Latam, own network in Germany)
OIBDA
Q1 10
€
5,114 m
Q1 10 OIBDA performance reflecting higher commercial activity, regulatory impact and other non recurrent effects:
Q1 10 TV tax in T. España
Q1 10 Restructuring in T. Europe
Q1 10 MTR in T. Europe (net impact vs. Q1 09)
Q1 09 USO in T. España
Q1 09 Real Estate in T. O2 CR
Supplies
External services
+3.1%
TEF Group
Contribution to growth
-1.1%
+6.7%
Personnelexpenses
Bad debt provision
-7.8%
-2.4%
Taxes
-2.6 p.p. of growth/
~€-140 m
8
-3.4%
Telefónica, S.AInvestor Relations
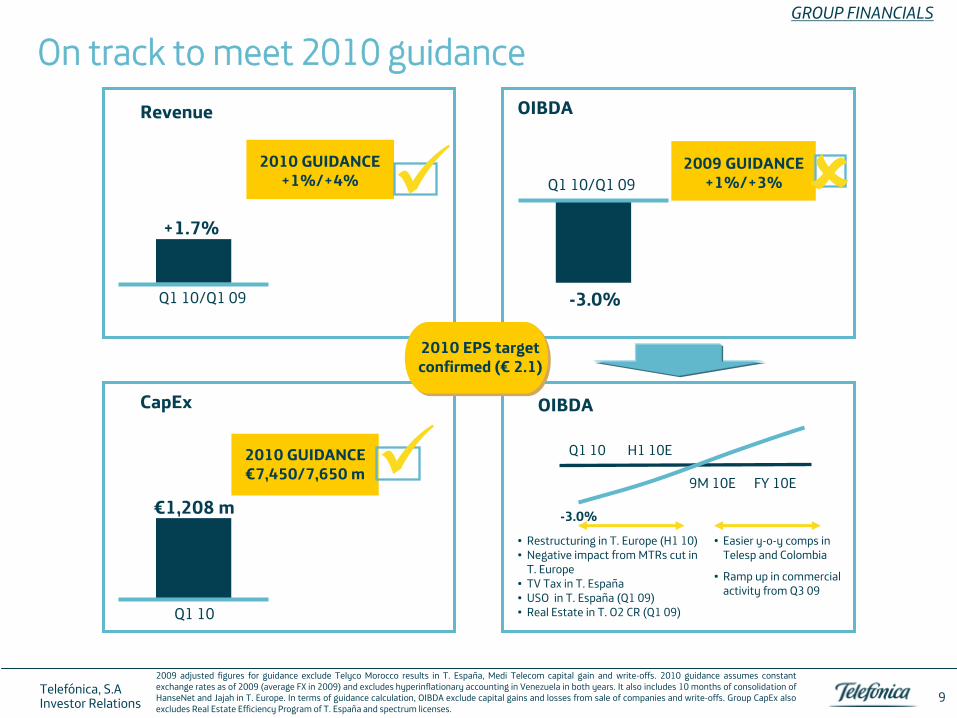
On track to meet 2010 guidanceGROUP FINANCIALS
OIBDA
CapEx
€1,208 m
Q1 10
Revenue
Q1 10/Q1 09 -3.0%
Q1 10/Q1 09 2009 GUIDANCE
+1%/+3%
2010 GUIDANCE€7,450/7,650 m
2010 GUIDANCE+1%/+4%
+1.7%
2010 EPS targetconfirmed
(€
2.1)
H1 10E
9M 10E
Q1 10
FY 10E
-3.0%
•
Restructuring in T. Europe (H1 10)•
Negative impact from MTRs
cut in T. Europe
•
TV Tax in T. España•
USO in T. España (Q1 09)•
Real Estate in T. O2 CR (Q1 09)
•
Easier y-o-y
comps in Telesp
and Colombia
•
Ramp up in commercial activity from Q3 09
2009 adjusted figures for guidance exclude Telyco
Morocco results in T. España, Medi
Telecom capital gain and write-offs. 2010 guidance assumes constant
exchange rates as of 2009 (average FX in 2009) and excludes hyperinflationary accounting in Venezuela in both years. It also includes 10 months of consolidation of HanseNet
and Jajah
in T. Europe. In terms of guidance calculation, OIBDA exclude capital gains and losses from sale of companies and write-offs. Group CapEx also excludes Real Estate Efficiency Program of T. España and spectrum licenses.
9
OIBDA
Telefónica, S.AInvestor Relations
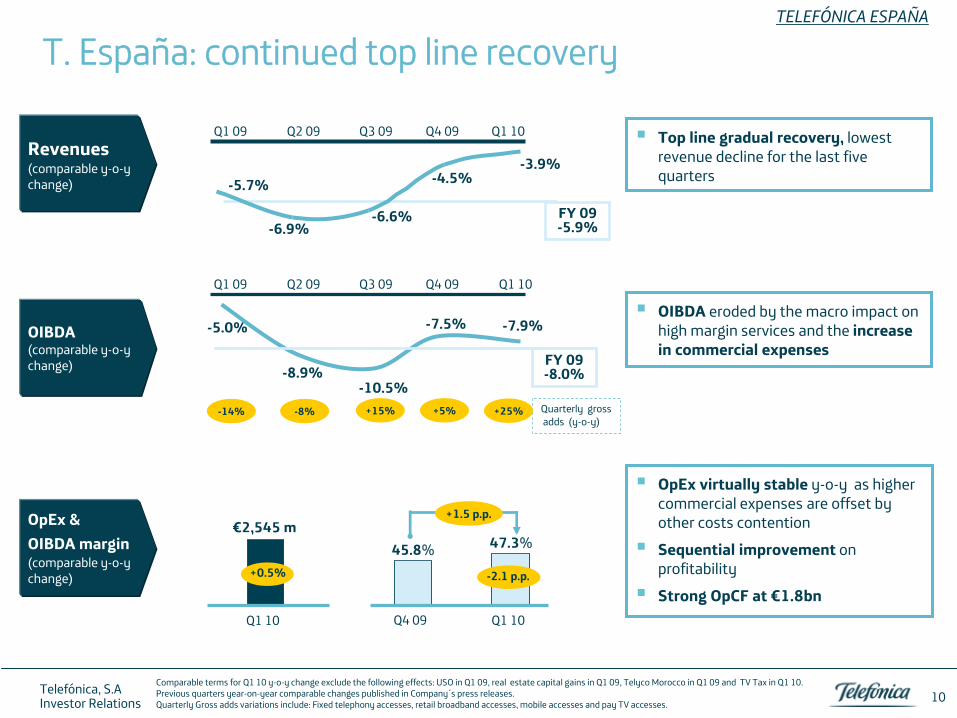
T. España: continued top line recoveryTELEFÓNICA ESPAÑA
Comparable terms for Q1 10 y-o-y
change exclude the following effects: USO in Q1 09, real estate capital gains in Q1 09, Telyco
Morocco in Q1 09 and TV Tax in Q1 10. Previous quarters year-on-year comparable changes published in Company´s
press releases. Quarterly Gross adds variations include: Fixed telephony accesses, retail broadband accesses, mobile accesses and pay TV accesses.
Revenues
(comparable y-o-y change)
Top line gradual recovery,
lowest revenue decline for the last five quarters
-8.9%-10.5%
-7.5%-5.0% -7.9%
Q2 09 Q3 09 Q4 09Q1 09 Q1 10
FY 09 -8.0%
Quarterly grossadds (y-o-y)
-14% -8% +15% +5% +25%
OIBDA (comparable y-o-y change)
OpEx
& OIBDA margin
(comparable y-o-y change)
OIBDA
eroded by the macro impact on high margin services and the increase in commercial expenses
10
+0.5% -2.1 p.p.
€2,545 m47.3%
Q1 10
OpEx
virtually stable
y-o-y
as higher commercial expenses
are offset by
other costs contention
Sequential improvement
on profitability
Strong OpCF
at €1.8bnQ1 10
45.8%
Q4 09
+1.5 p.p.
-6.9%-6.6%
-4.5%-5.7%-3.9%
Q2 09 Q3 09 Q4 09Q1 09 Q1 10
FY 09 -5.9%
Telefónica, S.AInvestor Relations
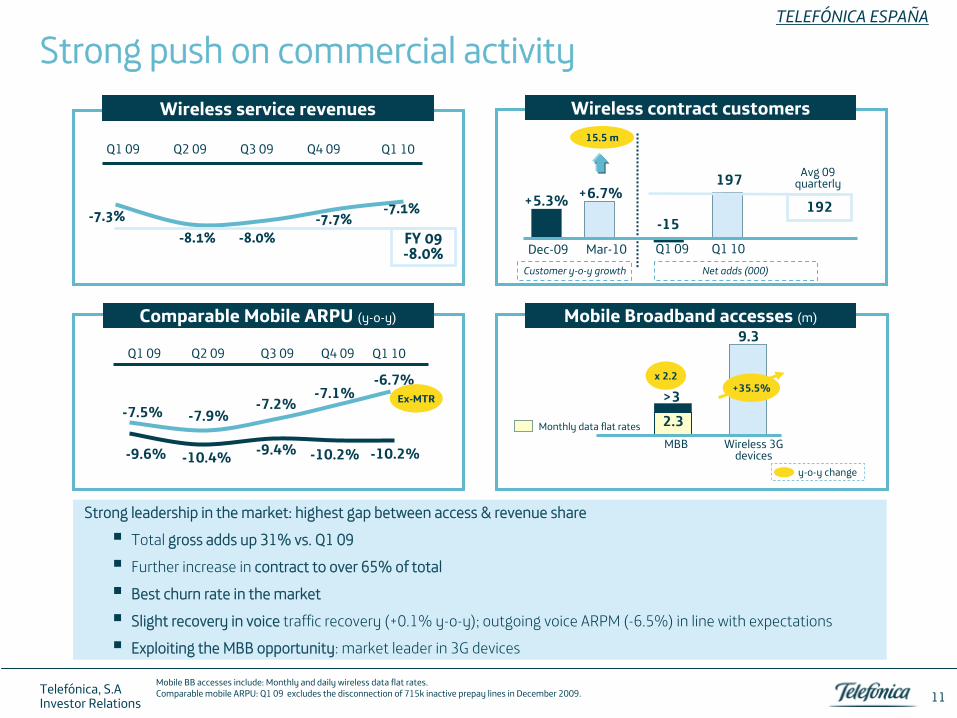
Strong push on commercial activityTELEFÓNICA ESPAÑA
Comparable Mobile ARPU (y-o-y)
Wireless service revenues
9.3Mobile Broadband accesses (m)
Wireless contract customers
-9.6% -10.4% -9.4%
-7.5% -7.9%-7.2%
Q1 09 Q2 09 Q3 09 Q4 09
-10.2%
-7.1%-6.7%
Q1 10
-10.2%
-7.7%-8.1% -8.0%
-7.3% -7.1%
FY 09 -8.0%
Strong leadership in the market: highest gap between access & revenue share
Total gross adds up 31% vs. Q1 09
Further increase in contract to over 65% of total
Best churn rate in the market
Slight recovery in voice
traffic recovery (+0.1% y-o-y); outgoing voice ARPM (-6.5%) in line with expectations
Exploiting the MBB opportunity: market leader in 3G devices
Net adds (000)Customer y-o-y
growth
-15Q1 09
15.5 m
Dec-09 Mar-10
+6.7%+5.3%
Q1 10
197 Avg
09 quarterly
192
Q1 09 Q2 09 Q3 09 Q4 09 Q1 10
y-o-y
change
Wireless 3G devices
x 2.2+35.5%>3
MBB
Mobile BB accesses include: Monthly and daily wireless data flat
rates. Comparable mobile ARPU: Q1 09 excludes the disconnection of 715k inactive prepay lines in December 2009.
Ex-MTR
11
2.3Monthly data flat rates
Telefónica, S.AInvestor Relations
Stepping up commercial momentumTELEFÓNICA ESPAÑA
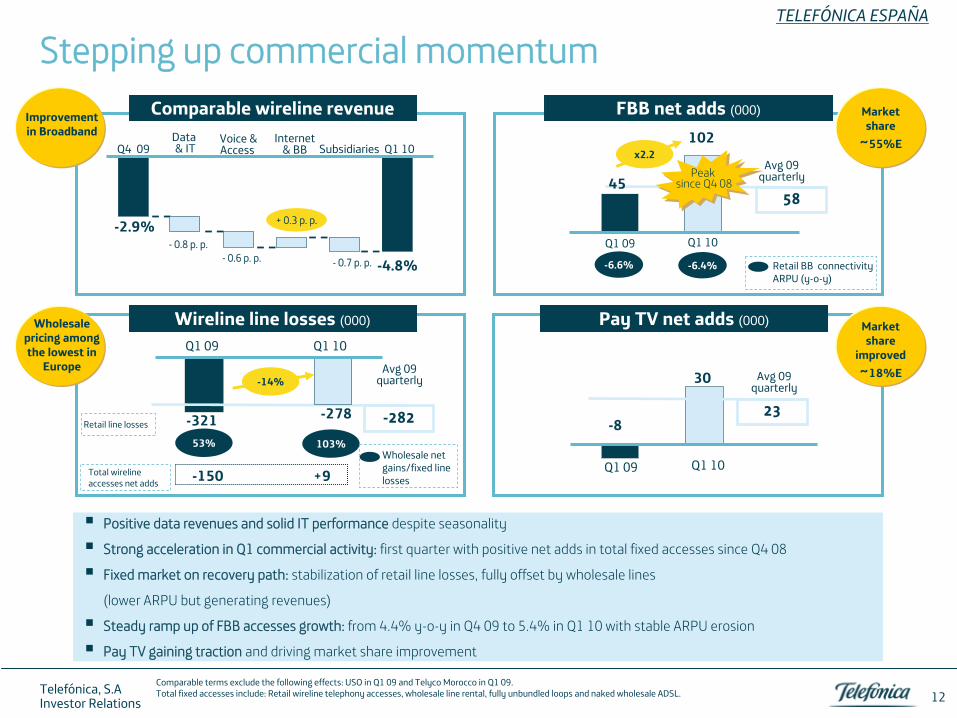
Positive data revenues and solid IT performance despite seasonality
Strong acceleration in Q1 commercial activity: first quarter with positive net adds in total fixed accesses since Q4 08
Fixed market on recovery path: stabilization of retail line losses, fully offset by wholesale lines
(lower ARPU but generating revenues)
Steady ramp up of FBB accesses growth: from 4.4% y-o-y
in Q4 09 to 5.4% in Q1 10 with stable ARPU erosion
Pay TV gaining traction and driving market share improvement
Comparable terms exclude the following effects: USO in Q1 09 and
Telyco
Morocco in Q1 09.Total fixed accesses include: Retail wireline
telephony accesses, wholesale line rental, fully unbundled loops and naked wholesale ADSL.
Wireline
line losses (000) Pay TV net adds (000)
Q1 09 Q1 10
-321
Q1 09 Q1 10Avg
09 quarterly
-282
-14%
Peak since Q4 08
Peak since Q4 08
58
Avg
09 quarterly45
102x2.2
53% 103%Wholesale net gains/fixed line losses
-6.6% -6.4% Retail BB connectivity ARPU (y-o-y)
-2.9%
Q4 09 Q1 10Data& IT Subsidiaries
Voice & Access
-4.8%-
0.8 p. p.-
0.6 p. p. -
0.7 p. p.
Internet & BB
+ 0.3 p. p.
Comparable wireline
revenue FBB net adds (000)
-150 +9Total wireline
accesses net adds
-278
Q1 09 Q1 10
-8
30
23
Avg
09 quarterly
Improvement in Broadband
Wholesale pricing among the lowest in
Europe
Market share
improved ~18%E
12
Market share
~55%E
Retail line losses
Telefónica, S.AInvestor Relations
TELEFÓNICA LATAM
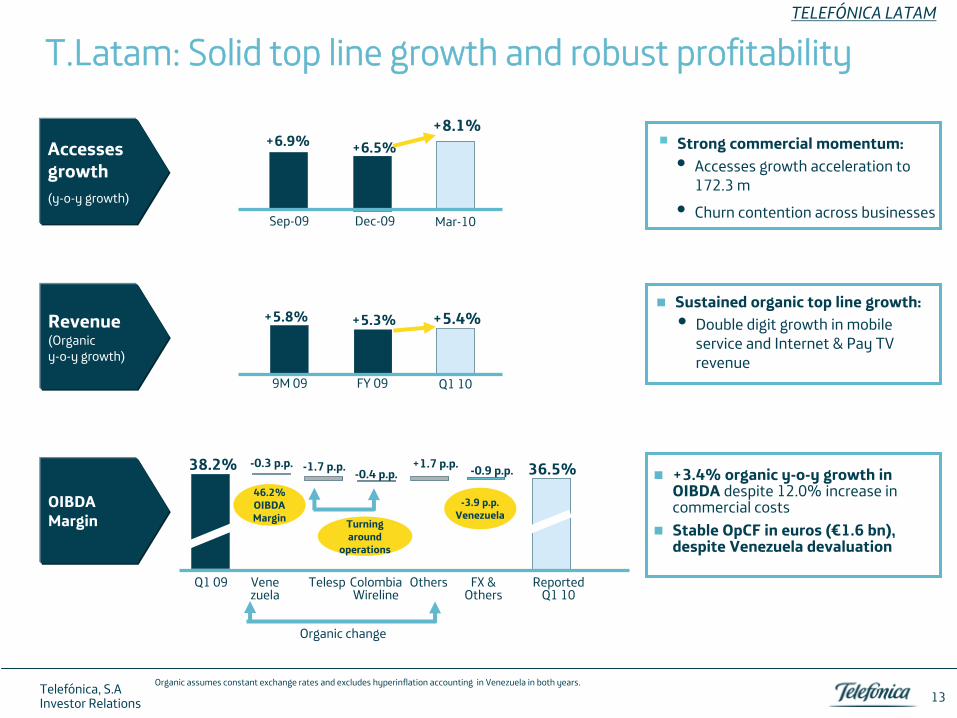
T.Latam: Solid top line growth and robust profitability
Organic assumes constant exchange rates and excludes hyperinflation accounting in Venezuela in both years.
OIBDA Margin
+3.4% organic y-o-y
growth in OIBDA despite 12.0%
increase in commercial costs
Stable OpCF
in euros (€1.6 bn), despite Venezuela devaluation
Accesses growth (y-o-y
growth)
+6.9% +6.5%+8.1%
Sep-09 Dec-09 Mar-10
Revenue(Organicy-o-y growth)
+5.8% +5.3% +5.4%
9M 09 FY 09 Q1 10
38.2% -0.3 p.p. 36.5%
Q1 09 Vene
zuelaReported
Q1 10
-1.7 p.p.
Telesp
-0.4 p.p.
Colombia Wireline
-0.9 p.p.
FX &Others
Others
+1.7 p.p.
-3.9 p.p. Venezuela
Turning around
operations
46.2% OIBDA Margin
13
Strong commercial momentum:
Accesses growth acceleration to 172.3 m
Churn contention across businesses
Sustained organic top line growth:
Double digit growth in mobile service and Internet & Pay TV revenue
Organic change
Telefónica, S.AInvestor Relations
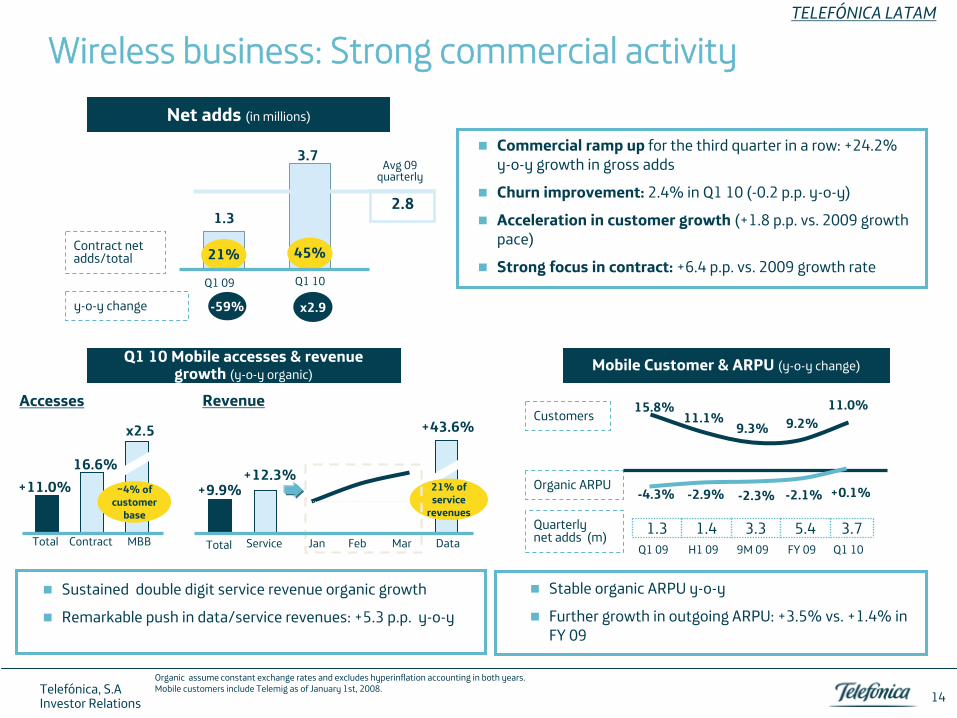
2.8
Wireless business: Strong commercial activityTELEFÓNICA LATAM
Organic assume constant exchange rates and excludes hyperinflation accounting in both years.Mobile customers include Telemig
as of January 1st, 2008.
Commercial ramp up
for the third quarter in a row: +24.2% y-o-y
growth in gross adds
Churn improvement: 2.4% in Q1 10 (-0.2 p.p. y-o-y)
Acceleration in customer growth (+1.8 p.p. vs. 2009 growth pace)
Strong focus in contract: +6.4 p.p. vs. 2009 growth rateQ1 09
-59%
1.3
Q1 10
3.7Avg
09 quarterly
x2.9
45%21%
Net adds (in millions)
Sustained double digit service revenue organic growth
Remarkable push in data/service revenues: +5.3 p.p. y-o-y
DataTotal Service
+9.9%+12.3%
+43.6%
21% of service
revenues
MBBTotal Contract
+11.0%16.6%
x2.5
~4% of customer
base
RevenueAccesses
Jan Feb Mar
Q1 10 Mobile accesses & revenuegrowth (y-o-y
organic)
Organic ARPU
Q1 09 9M 09H1 09 FY 09
15.8%11.1%
9.3% 9.2%
Q1 10
11.0%
-4.3% -2.9% -2.3% -2.1% +0.1%
Customers
Stable organic ARPU y-o-y
Further growth in outgoing ARPU: +3.5% vs. +1.4% in FY 09
Quarterly net adds (m) 1.3 1.4 3.3 5.4 3.7
Mobile Customer & ARPU (y-o-y
change)
y-o-y
change
14
Contract net adds/total
Telefónica, S.AInvestor Relations
TELEFÓNICA LATAM
Q4 09 wireline
net adds and growth rates exclude the disconnection of fixed telephony accesses in Colombia. 2009 quarterly average excludes December 2009 disconnections.
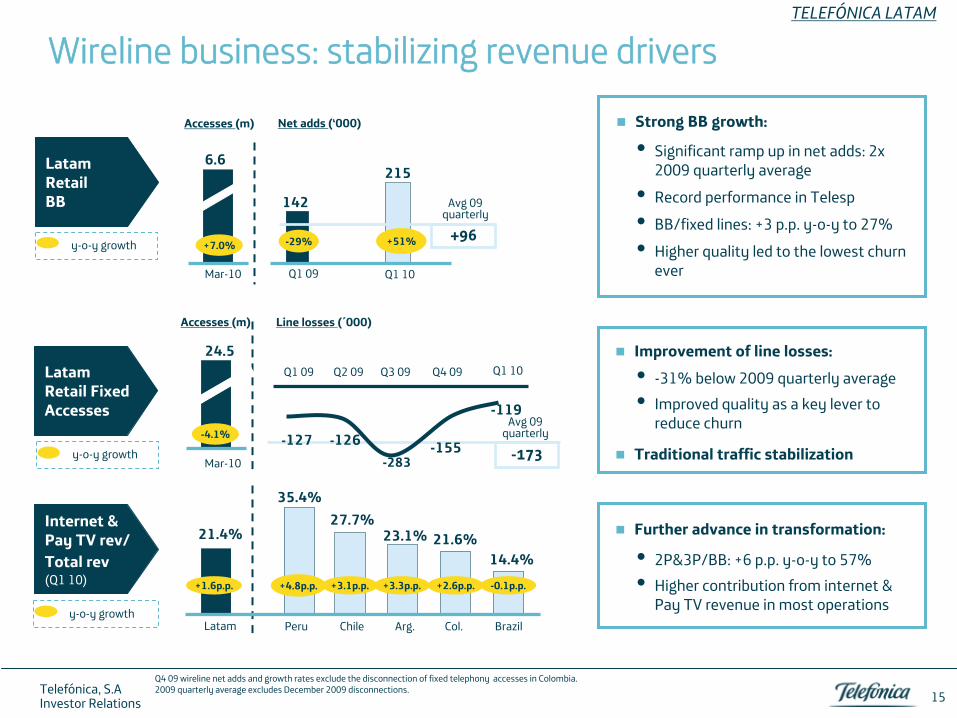
Wireline
business: stabilizing revenue drivers
Strong BB growth:
Latam
21.4%
Brazil
14.4%-0.1p.p.
Arg.
23.1%
+3.3p.p.
Chile
27.7%
+3.1p.p.
Peru
35.4%
+4.8p.p.+1.6p.p.
Col.
21.6%
+2.6p.p.
6.6
Mar-10
+7.0%
Q1 09
-29%
Net adds (‘000)
142
Accesses (m)
LatamRetailBB
y-o-y
growth
Internet & Pay TV rev/ Total rev (Q1 10)
Q1 10
+51%
215
Avg
09 quarterly
+96
-283Mar-10
24.5
-4.1%
Q1 09 Q3 09Q2 09 Q4 09
-127 -126
Line losses (´000)Accesses (m)
LatamRetail Fixed Accesses
Q1 10
-119Avg
09 quarterly
-173-155
15
Significant ramp up in net adds: 2x 2009 quarterly average
Record performance in Telesp
BB/fixed lines: +3 p.p. y-o-y
to 27%
Higher quality led to the lowest churn ever
Improvement of line losses:
Traditional traffic stabilization
-31% below 2009 quarterly average
Improved quality as a key lever to reduce churn
Further advance in transformation:
2P&3P/BB: +6 p.p. y-o-y
to 57%
Higher contribution from internet & Pay TV revenue in most operations
y-o-y
growth
y-o-y
growth
Telefónica, S.AInvestor Relations
TELEFÓNICA LATAM
Telesp
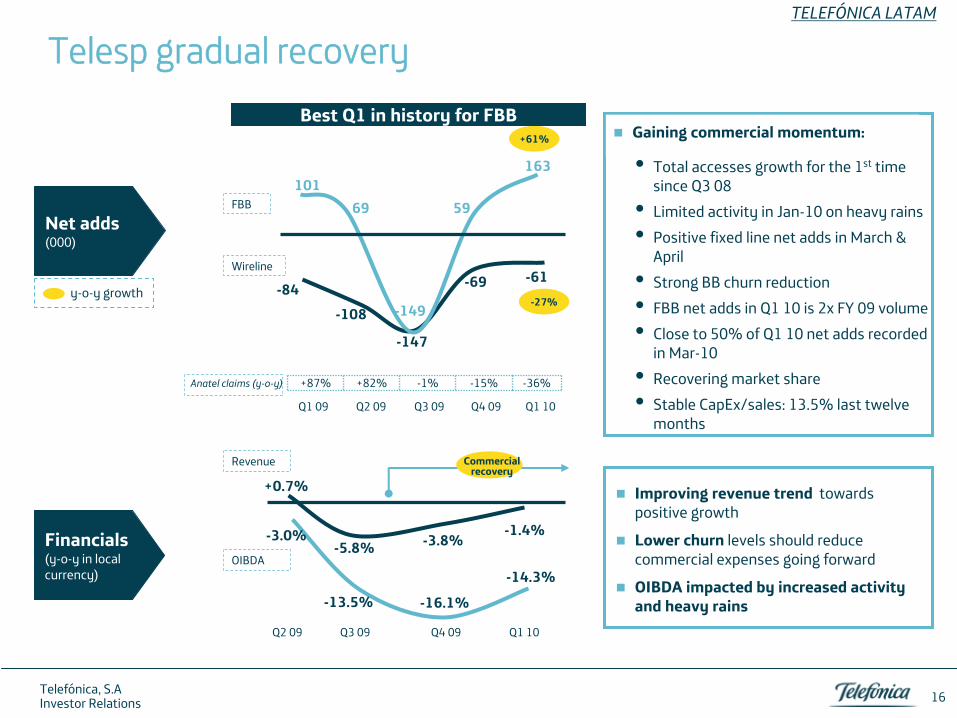
gradual recovery
Total accesses growth for the 1st
time since Q3 08
Limited activity in Jan-10 on heavy rains
Positive fixed line net adds in March & April
Strong BB churn reduction
FBB net adds in Q1 10 is 2x FY 09 volume
Close to 50% of Q1 10 net adds recorded in Mar-10
Recovering market share
Stable CapEx/sales: 13.5% last twelve months
-84 -69
Net adds
(000)
-27%
-61
-147
Financials(y-o-y
in local currency)
Q3 09 Q4 09 Q1 10
-13.5% -16.1%
-14.3%
-5.8% -3.8%-1.4%
Commercial recovery
Q2 09
+0.7%
-3.0%
Improving revenue trend
towards positive growth
Lower churn
levels should reduce commercial expenses going forward
OIBDA impacted by increased activity and heavy rains
-108
Q1 09 Q4 09 Q1 10Q3 09Q2 09
+61%
10159
163
-149
69
Anatel
claims (y-o-y) +87% +82% -1% -15% -36%
Best Q1 in history for FBB
16
y-o-y
growth
Gaining commercial momentum:
FBB
Wireline
Revenue
OIBDA
Telefónica, S.AInvestor Relations
TELEFÓNICA LATAM
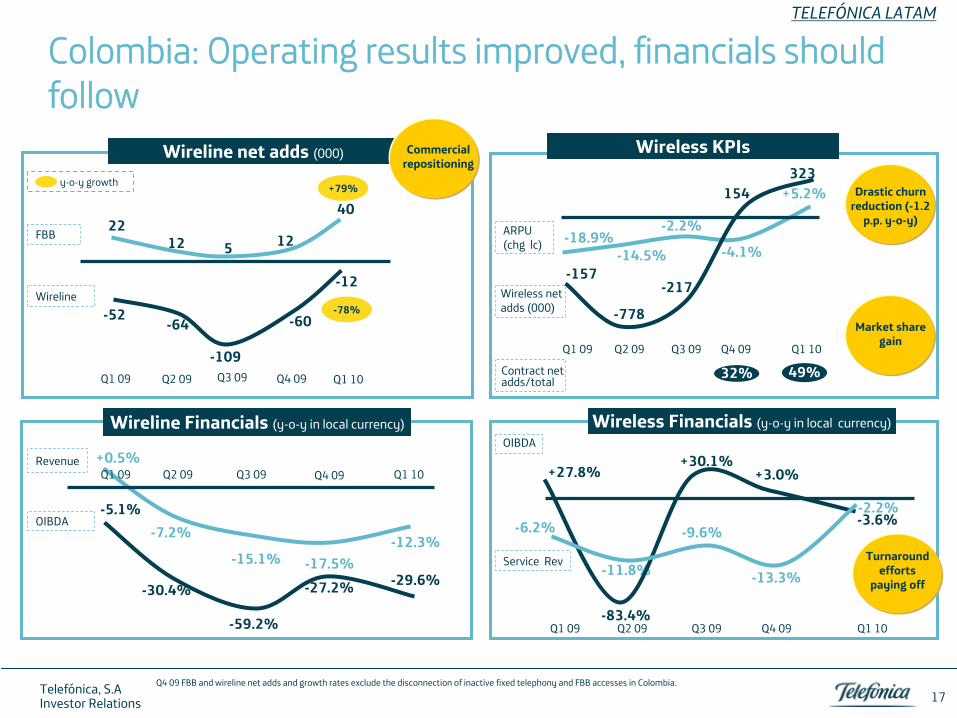
Colombia: Operating results improved, financials should follow
Q3 09 Q4 09 Q1 10
-59.2%
-27.2% -29.6%-15.1% -17.5%
-12.3%
Q2 09
-7.2%
-30.4%
+0.5%
-5.1%
Wireline
Financials (y-o-y
in local currency)
Wireless KPIs
Contract net adds/total
49%32%
+30.1%+3.0%
-2.2%-9.6%
-13.3%
-3.6%
-11.8%
-83.4%Q3 09 Q4 09 Q1 10Q2 09 Q1 09
-6.2%
+27.8%
Wireless Financials (y-o-y
in local currency)OIBDA
y-o-y
growth
-52 -60-78%
-12
Q1 09 Q4 09 Q1 10Q3 09-109
Wireline
net adds (000)
2212
40+79%
5
Q2 09
-64
12-2.2%
-4.1%-14.5%
Q3 09 Q4 09 Q1 10Q2 09 Q1 09
-18.9%
+5.2%
Wireless net adds (000)
-217
154
-778
-157
323
17
Commercial repositioning
Turnaround efforts
paying off
Drastic churn reduction (-1.2
p.p. y-o-y)
Market share gain
Q1 09
FBB
Wireline
Revenue
OIBDA
Service
Rev
ARPU (chg lc)
Q4 09 FBB and wireline
net adds and growth rates exclude the disconnection of inactive
fixed telephony and FBB accesses in Colombia.
Telefónica, S.AInvestor Relations
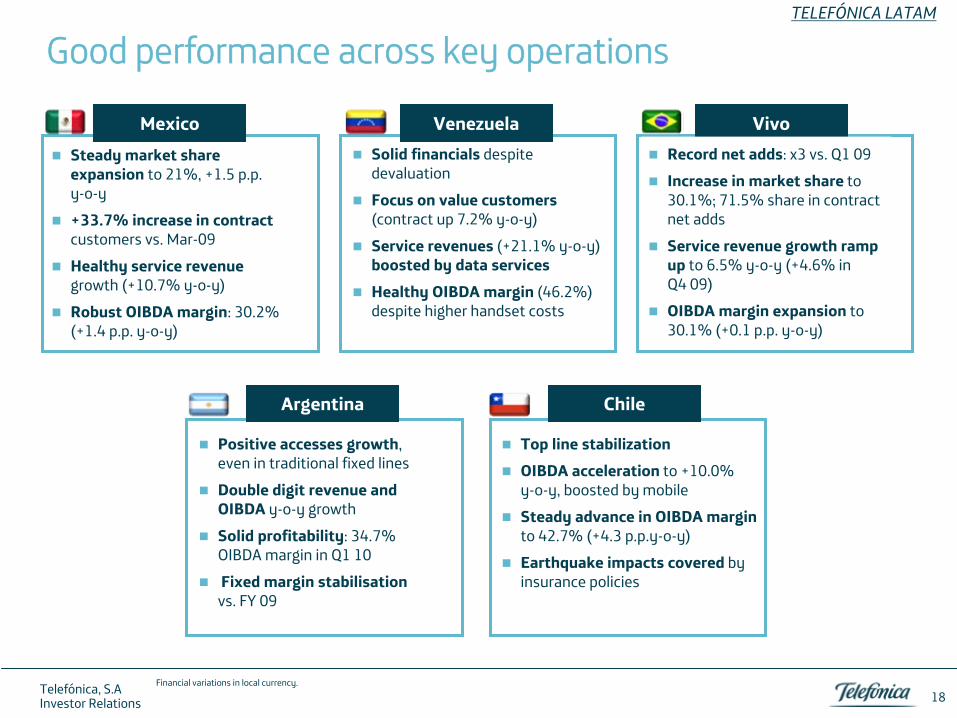
Good performance across key operations
Mexico
Steady market share expansion
to 21%, +1.5 p.p. y-o-y
+33.7% increase in contract
customers vs. Mar-09
Healthy service revenue
growth (+10.7% y-o-y)
Robust OIBDA margin: 30.2% (+1.4 p.p. y-o-y)
Venezuela
Solid financials
despite devaluation
Focus on value customers
(contract up 7.2% y-o-y)
Service revenues
(+21.1% y-o-y) boosted by data services
Healthy OIBDA margin
(46.2%) despite higher handset costs
Vivo
Record net adds: x3 vs. Q1 09
Increase in market share
to 30.1%; 71.5% share in contract net adds
Service revenue growth ramp
up
to 6.5% y-o-y
(+4.6% in Q4 09)
OIBDA margin expansion
to 30.1% (+0.1 p.p. y-o-y)
Top line stabilization
OIBDA acceleration
to +10.0% y-o-y, boosted by mobile
Steady advance in OIBDA margin
to 42.7% (+4.3 p.p.y-o-y)
Earthquake impacts covered
by insurance policies
Positive accesses growth, even in traditional fixed lines
Double digit revenue and OIBDA
y-o-y
growth
Solid profitability: 34.7% OIBDA margin in Q1 10
Fixed margin stabilisation
vs. FY 09
Argentina Chile
18
TELEFÓNICA LATAM
Financial variations in local currency.
Telefónica, S.AInvestor Relations
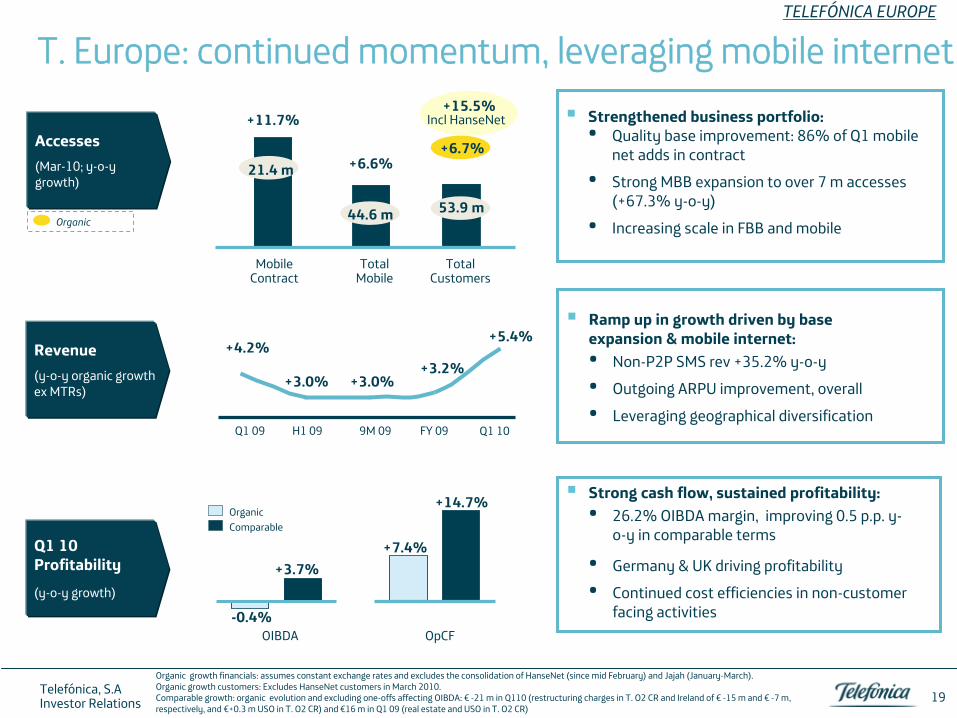
T. Europe: continued momentum, leveraging mobile internet
Revenue(y-o-y organic
growth
ex MTRs)
Accesses(Mar-10; y-o-y
growth)
Q1 10 Profitability(y-o-y growth)
OIBDA
Strong cash flow, sustained profitability:•
26.2% OIBDA margin, improving 0.5 p.p. y-
o-y
in comparable terms
•
Germany & UK driving profitability•
Continued cost efficiencies in non-customer facing activities
Organic growth financials: assumes constant exchange rates and excludes the consolidation of HanseNet
(since mid February) and Jajah
(January-March).Organic growth customers: Excludes HanseNet
customers in March 2010. Comparable growth: organic evolution and excluding one-offs affecting OIBDA: €
-21 m in Q110 (restructuring charges in T. O2 CR and Ireland of €
-15 m and €
-7 m, respectively, and €+0.3 m USO in T. O2 CR) and €16 m in Q1 09 (real estate and USO in T. O2 CR)
+4.2%
+3.0% +3.0%
Q1 09 H1 09 9M 09 FY 09
+3.2%
Q1 10
+5.4%
-0.4%
+3.7%
OpCF
+14.7%
+7.4%
Strengthened business portfolio:•
Quality base improvement: 86% of Q1 mobile net adds in contract
•
Strong MBB expansion to over 7 m accesses (+67.3% y-o-y)
•
Increasing scale in FBB and mobile
Ramp up in growth driven by base expansion & mobile internet:•
Non-P2P SMS rev +35.2% y-o-y
•
Outgoing ARPU improvement, overall•
Leveraging geographical diversification
TELEFÓNICA EUROPE
OrganicComparable
+15.5%
+6.7%
Total Customers
Incl
HanseNet
Total Mobile
+6.6%
Mobile Contract
+11.7%
21.4 m
19
44.6 m 53.9 mOrganic
Telefónica, S.AInvestor Relations
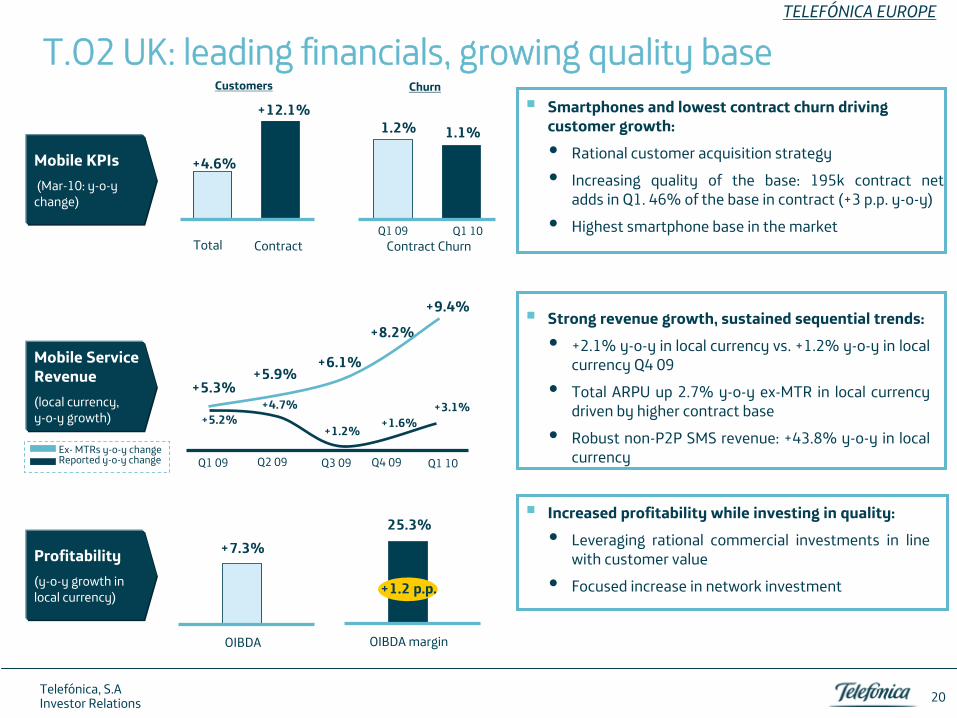
T.O2
UK: leading
financials, growing
quality
base
Mobile Service
Revenue(local currency, y-o-y growth)
Mobile KPIs(Mar-10: y-o-y
change)
Smartphones and lowest contract churn driving customer growth:
Rational customer acquisition strategy
Increasing quality of the base: 195k contract net adds in Q1. 46% of the base in contract (+3 p.p. y-o-y)
Highest smartphone
base in the marketContract Churn
1.2% 1.1%
Q1 09 Q1 10
Q2 09
+5.3%
Q3 09Q1 09 Q4 09
+5.9%+6.1%
+8.2%
+4.7%
+1.2% +1.6%+5.2%
Q1 10
+9.4%
+3.1%
Profitability(y-o-y growth
in local currency)
OIBDA
+7.3%
Strong revenue growth, sustained sequential trends:
+2.1% y-o-y
in local currency vs. +1.2% y-o-y
in local currency Q4 09
Total ARPU up 2.7% y-o-y
ex-MTR in local currency driven by higher contract base
Robust non-P2P SMS revenue: +43.8% y-o-y
in local currency
Increased profitability while investing in quality:
Leveraging rational commercial investments in line
with customer value
Focused increase in network investment
ContractTotal
+4.6%
+12.1%
20
OIBDA margin
25.3%
+1.2 p.p.
ChurnCustomers
Ex-
MTRs
y-o-y
change Reported y-o-y
change
TELEFÓNICA EUROPE
Telefónica, S.AInvestor Relations
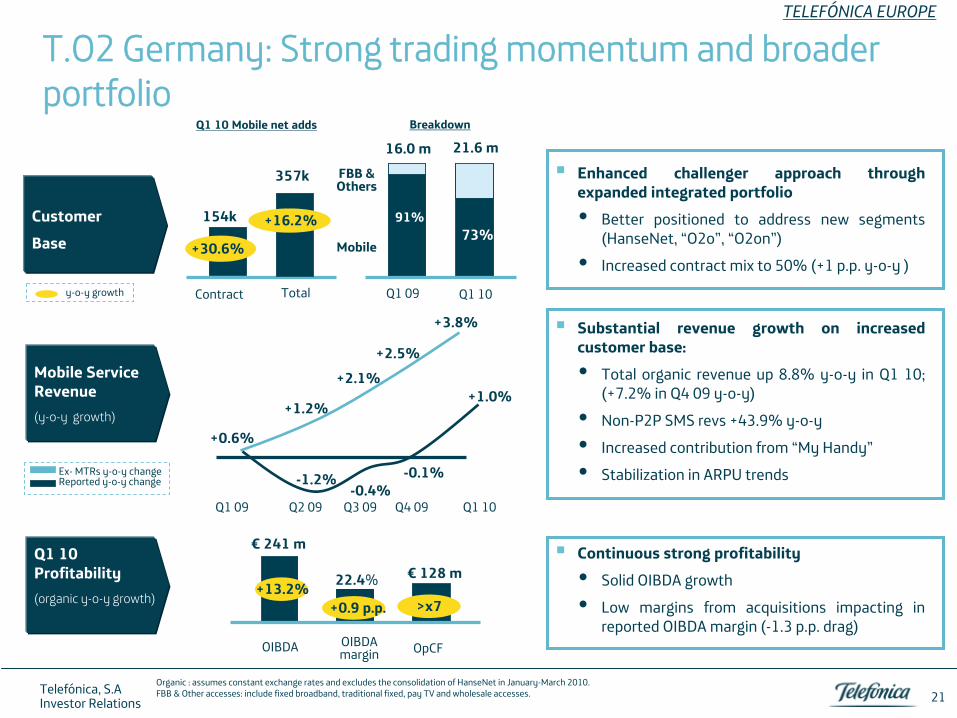
T.O2
Germany: Strong
trading
momentum
and
broader portfolio
Breakdown
Q1 10 Profitability(organic
y-o-y growth)
OIBDA OIBDA margin OpCF
+13.2%+0.9 p.p. >x7
€ 241 m
22.4% €
128 m
Enhanced challenger approach through expanded integrated portfolio
Better positioned to address new segments
(HanseNet, “O2o”, “O2on”)
Increased contract mix to 50% (+1 p.p. y-o-y
)
Mobile Service
Revenue(y-o-y growth)
Ex-
MTRs
y-o-y
change Reported y-o-y
change
+0.6%
+1.2%
+2.1%+2.5%
-1.2%-0.4%
-0.1%
Q2 09 Q3 09Q1 09 Q4 09
+1.0%
Q1 10
+3.8%
CustomerBase
Q1
10
Mobile
net
adds
y-o-y
growth
Continuous strong profitability
Solid OIBDA growth
Low margins from acquisitions impacting in
reported OIBDA margin (-1.3 p.p. drag)
Substantial revenue growth on increased customer base:
Total organic revenue up 8.8% y-o-y
in Q1 10; (+7.2% in Q4 09 y-o-y)
Non-P2P SMS revs +43.9% y-o-y
Increased contribution from “My Handy”
Stabilization in ARPU trends
Organic : assumes constant exchange rates and excludes the consolidation of HanseNet
in January-March 2010.FBB & Other accesses: include fixed broadband, traditional fixed, pay TV and wholesale accesses. 21
Q1 09 Q1 10
16.0 m 21.6 m
91%73%
Mobile
FBB & Others
357k
Total Contract
+30.6%
154k +16.2%
TELEFÓNICA EUROPE
Telefónica, S.AInvestor Relations
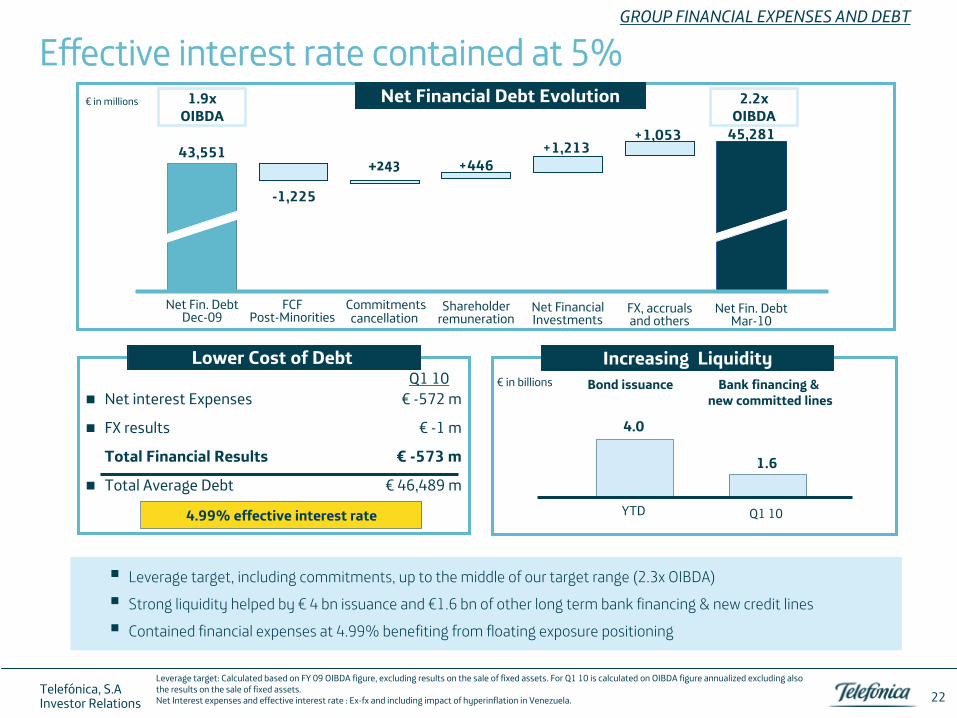
Effective interest rate contained at 5%GROUP FINANCIAL EXPENSES AND DEBT
Lower Cost of Debt
Net Financial Debt Evolution
Increasing Liquidity
Leverage target, including commitments, up to the middle of our target range (2.3x OIBDA)
Strong liquidity helped by €
4 bn
issuance and €1.6 bn
of other long term bank financing & new credit
lines
Contained financial expenses at 4.99% benefiting from floating exposure positioning
Leverage target: Calculated based on FY 09 OIBDA figure, excluding results on the sale of fixed assets. For Q1 10 is calculated on OIBDA figure annualized excluding also the results on the sale of fixed assets.Net Interest expenses and effective interest rate : Ex-fx
and including impact of hyperinflation in Venezuela.
€
in millions
FCF Post-Minorities
45,28143,551 +1,213
+446+243
-1,225
Net Fin. DebtDec-09
Commitmentscancellation
Shareholder remuneration
Net FinancialInvestments
FX, accrualsand others
+1,053
Net Fin. DebtMar-10
2.2xOIBDA
Net interest Expenses €
-572 m
FX results
€
-1 m
Total Financial Results
€
-573 m
Total Average Debt
€
46,489 m
Q1 10
4.99% effective interest rate YTD
4.0
Q1 10
€
in billions
1.9xOIBDA
Bank financing &new committed lines
Bond issuance
22
1.6
Telefónica, S.AInvestor Relations
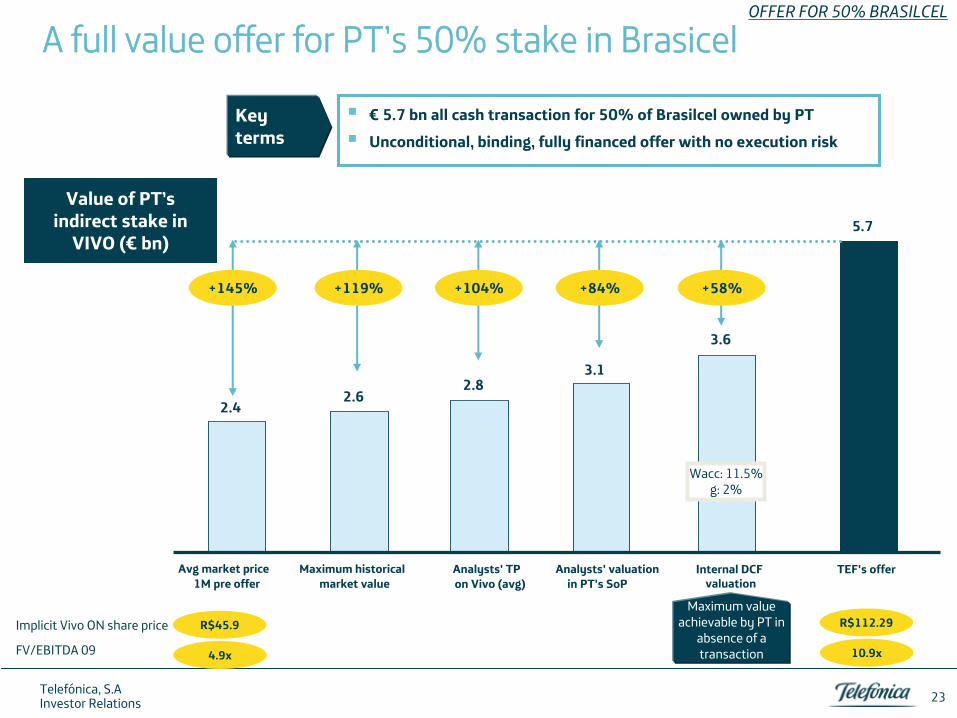
A full value offer for PT’s
50% stake in Brasicel
€
5.7 bn
all cash transaction for 50% of Brasilcel owned by PT
Unconditional, binding, fully financed offer with no execution risk
23
2.42.6
2.83.1
3.6
5.7
Avg
market price1M pre offer
Maximum historicalmarket value
Analysts' TPon Vivo (avg)
Analysts' valuationin PT's
SoPInternal DCF
valuationTEF's
offer
+145% +119% +104% +84% +58%
3.6
Value of PT’s
indirect stake in
VIVO (€
bn)
Implicit Vivo ON share price R$45.9
4.9x
R$112.29
10.9xFV/EBITDA 09
Wacc: 11.5%g: 2%
Maximum value achievable by PT in
absence of a transaction
Key terms
OFFER FOR 50% BRASILCEL
Telefónica, S.AInvestor Relations
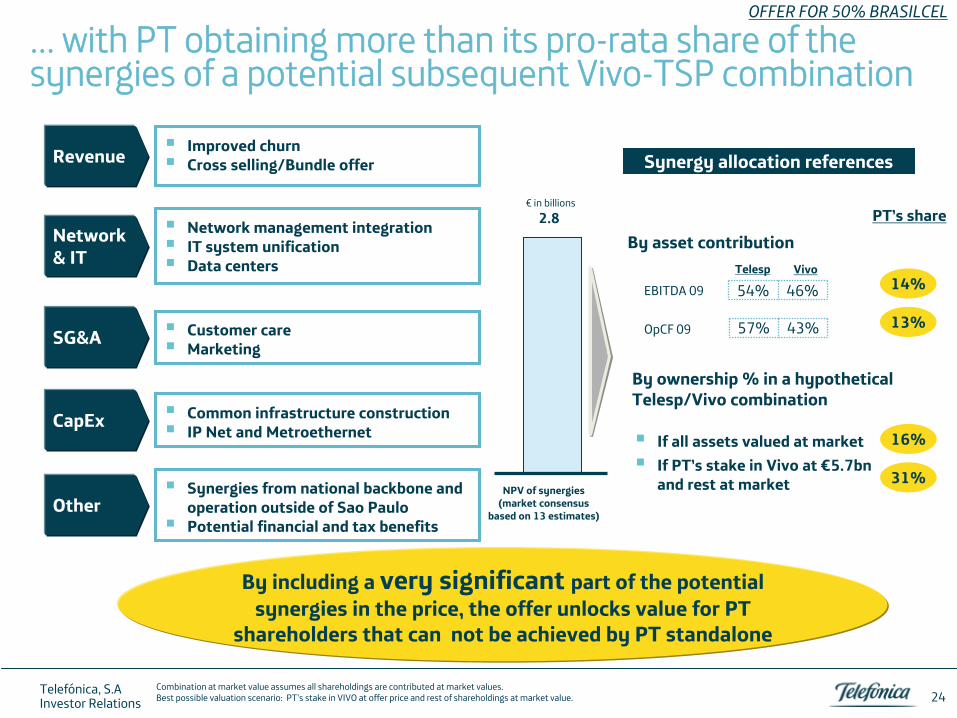
… with PT obtaining more than its pro-rata share of the synergies of a potential subsequent Vivo-TSP combination
Improved churn
Cross selling/Bundle offer
24
Revenue
Network management integration
IT system unification
Data centers
Network & IT
Customer care
Marketing
Common infrastructure construction
IP Net and Metroethernet
Synergies from national backbone and operation outside of Sao Paulo
Potential financial and tax benefits
SG&A
CapEx
Other
By including a very significant part of the potential synergies in the price, the offer unlocks value for PT
shareholders that can not be achieved by PT standalone
Combination at market value assumes all shareholdings are contributed at market values. Best possible valuation scenario: PT’s
stake in VIVO at offer price and rest of shareholdings at market value.
OFFER FOR 50% BRASILCEL
2.8
NPV of synergies (market consensus
based on 13 estimates)
€
in billions
Synergy allocation references
By asset contribution
By ownership % in a hypothetical Telesp/Vivo combination
If all assets valued at market
If PT’s
stake in Vivo at €5.7bn and rest at market 31%
16%
EBITDA 09
OpCF
09
PT’s
share
13%
14%54% 46%
57% 43%
Telesp Vivo
Telefónica, S.AInvestor Relations
Closing remarksGROUP FINANCIALS
Boosting top line growth, leveraging a well diversified portfolio
Sharp increase in commercial activity across regions, setting the base for additional revenue growth
Retaining top quality profitability and high OpCF
Robust financial position
2010 and mid term guidance reiterated
Growing dividend policy confirmed
Strong results, delivering our
2010 priorities
25
Telefónica, S.AInvestor Relations
Top Related