


Languages
Pages
Legal

TechnoMetrica Auto Demand IndexSeptember 2016
70 Hilltop Road, Ramsey, NJ 07446Pho:201-986-1288 | Fax:201-986-0119
www.technometrica.com

TechnoMetrica Auto Demand Index – September 2016 Page 2
Table Of ContentsI. Methodology 3
II. Auto Demand Index 4-15A. Auto Demand Index (Overall)B. By RegionC. By Area TypeD. By AgeE. By Gender/Marital StatusF. By Parental Status and Race/EthnicityG. By Household IncomeH. Auto Sales ProgressionI. Slow Stochastic IndexJ. Auto Sales Channel (2011-2016)
III. Demand For New Autos 16-20A. Vehicle Purchase/Lease Plans: OverallB. Vehicle Purchase Plans: Purchase Likelihood Over TimeC. New Vehicle Purchase/Lease Time FrameD. Vehicle Types MomentumE. Preferred Vehicle Types 3SMA
IV. Brand Preferences 21-26A. Top Ten Brands Consumers Would Buy Today 3 SMAB. Brand Preferences Over Time 3 SMA (Top Ten Brands)
V. Contact Information 28
TechnoMetrica Auto Demand Index – September 2016 Page 3
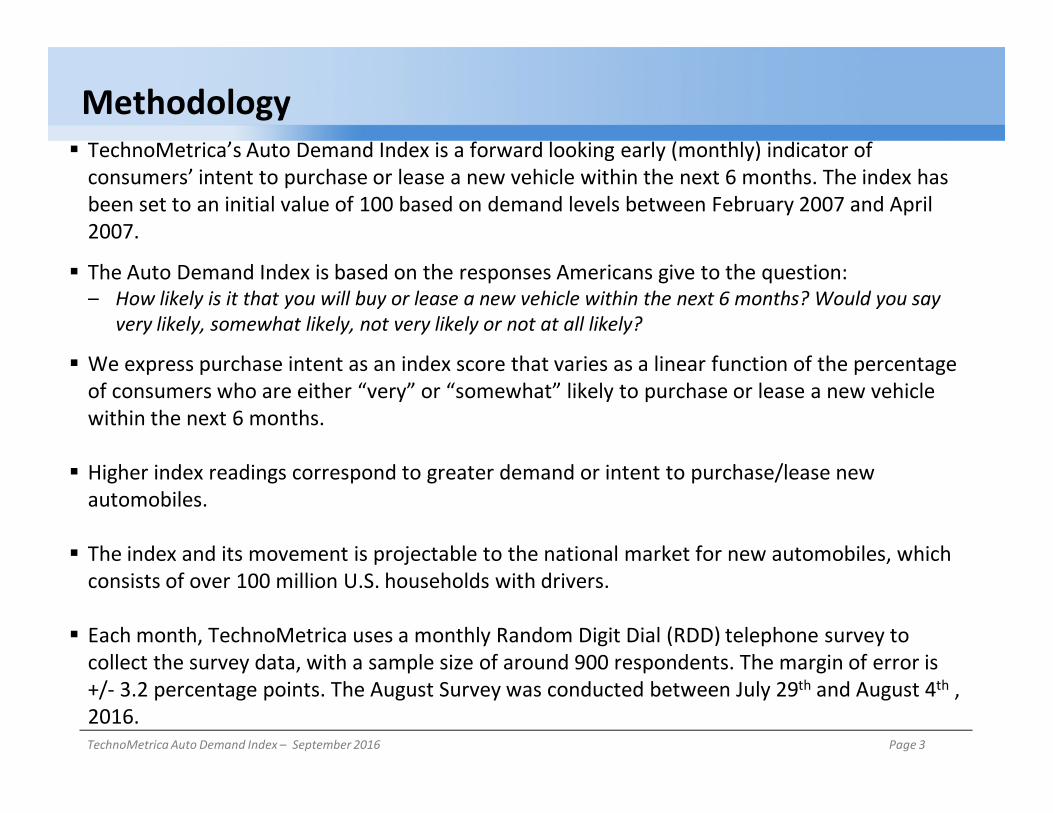
Methodology TechnoMetrica’s Auto Demand Index is a forward looking early (monthly) indicator of
consumers’ intent to purchase or lease a new vehicle within the next 6 months. The index has been set to an initial value of 100 based on demand levels between February 2007 and April 2007.
The Auto Demand Index is based on the responses Americans give to the question: – How likely is it that you will buy or lease a new vehicle within the next 6 months? Would you say
very likely, somewhat likely, not very likely or not at all likely?
We express purchase intent as an index score that varies as a linear function of the percentage of consumers who are either “very” or “somewhat” likely to purchase or lease a new vehicle within the next 6 months.
Higher index readings correspond to greater demand or intent to purchase/lease new automobiles.
The index and its movement is projectable to the national market for new automobiles, which consists of over 100 million U.S. households with drivers.
Each month, TechnoMetrica uses a monthly Random Digit Dial (RDD) telephone survey to collect the survey data, with a sample size of around 900 respondents. The margin of error is +/- 3.2 percentage points. The August Survey was conducted between July 29th and August 4th , 2016.

TechnoMetrica Auto Demand Index – September 2016 Page 4
0
20
40
60
80
100
120
140
Sep
-14
Oct
-14
No
v-14
De
c-14
Jan
-15
Feb
-15
Mar
-15
Ap
r-15
May
-15
Jun
-15
Jul-
15
Au
g-15
Sep
-15
Oct
-15
No
v-15
De
c-15
Jan
-16
Feb
-16
Mar
-16
Ap
r-16
May
-16
Jun
-16
Jul-
16
Au
g-16
Sep
-16
Au
to D
em
and
In
de
x (A
DI)
Auto Demand Index (ADI) 3SMA
Auto Demand Index (Overall)Although Americans’ intent to acquire new vehicles slowed somewhat in September, vehicle purchase intent remains relatively strong among consumers. After gaining 41 points in August, the Auto Demand Index level declined by 15 points this month, registering an overall score of 108. As a result, we anticipate that consumers will continue to display relatively high levels of purchase intent in the near future, though not as strong as last year’s robust performance.
High Low
2010 97 56
2011 94 49
2012 105 49
2013 86 64
2014 88 73
2015 129 64
2016 123 82
Base = All Respondents
3SMA= Three Months Simple Moving Average

TechnoMetrica Auto Demand Index – September 2016 Page 5
Auto Demand Index Moving AveragesBase = All Respondents
50
60
70
80
90
100
110
120
Sep-
14
Oct-1
4
Nov-
14
Dec-1
4
Jan-
15
Feb-
15
Mar
-15
Apr-1
5
May
-15
Jun-
15
Jul-1
5
Aug-
15
Sep-
15
Oct-1
5
Nov-
15
Dec-1
5
Jan-
16
Feb-
16
Mar
-16
Apr-1
6
May
-16
Jun-
16
Jul-1
6
Aug-
16
Sep-
16
3SMA 6SMA 12SMA
3SMA= Three Months Simple Moving Average
6SMA = Six Months Simple Moving Average
12SMA = Twelve Months Simple Moving Average
In further indication that vehicle purchase intent will remain strong in the near future, this month’s Auto Demand Index score registered above all three of its moving averages. September’s ADI topped both its 12-month and 6-month moving averages (101) by 6 points, while surpassing its 3-month (105) average by three points. Meanwhile, the 3-month moving average increased by four points in September, marking the second straight month of growth in the Index.
Auto
Dem
and
Inde
x (A
DI)
TechnoMetrica Auto Demand Index – September 2016 Page 6
10
11
12
13
14
15
16
17
18
-10.0
-6.0
-2.0
2.0
6.0
10.0
AutoSales
(Millions)
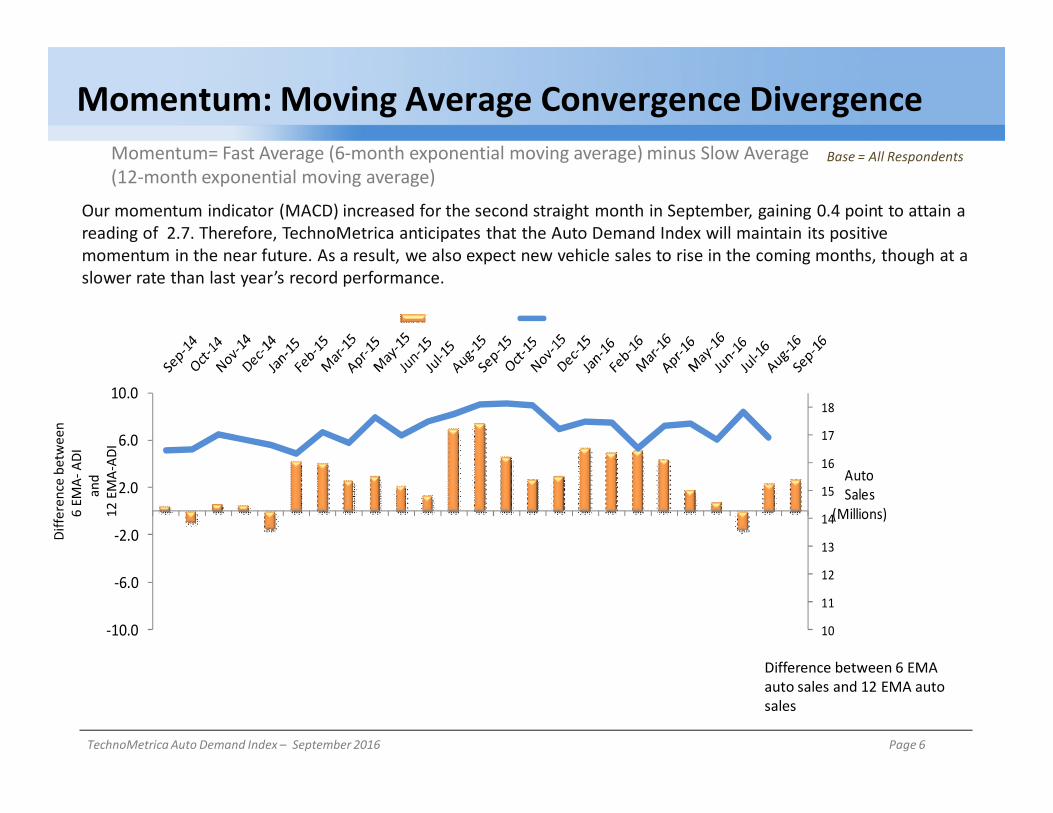
Momentum: Moving Average Convergence DivergenceMomentum= Fast Average (6-month exponential moving average) minus Slow Average (12-month exponential moving average)
Base = All Respondents
Our momentum indicator (MACD) increased for the second straight month in September, gaining 0.4 point to attain a reading of 2.7. Therefore, TechnoMetrica anticipates that the Auto Demand Index will maintain its positive momentum in the near future. As a result, we also expect new vehicle sales to rise in the coming months, though at a slower rate than last year’s record performance.
Diffe
renc
e be
twee
n 6
EMA-
ADI
and
12 E
MA-
ADI
Difference between 6 EMA auto sales and 12 EMA auto sales

TechnoMetrica Auto Demand Index – September 2016 Page 7
By Region 3 SMABase = All Respondents
Q. How likely is it that you will buy or lease a new vehicle within the next 6 months?
116104 103 101 100
113 121
0
25
50
75
100
125
150
M-16 A-16 M-16 J-16 J-16 A-16 S-16
South
120106
8779 79
89 86
0
25
50
75
100
125
150
M-16 A-16 M-16 J-16 J-16 A-16 S-16
Northeast
125135
127
97
7588
108
0
25
50
75
100
125
150
M-16 A-16 M-16 J-16 J-16 A-16 S-16
Midwest
84 89 90108
95 10390
0
25
50
75
100
125
150
M-16 A-16 M-16 J-16 J-16 A-16 S-16
West12 SMA = 9012 SMA = 109
12 SMA = 10712 SMA = 94
TechnoMetrica Auto Demand Index – September 2016 Page 8
103 101 10599
7991
107
0
25
50
75
100
125
150
M-16 A-16 M-16 J-16 J-16 A-16 S-16
Rural
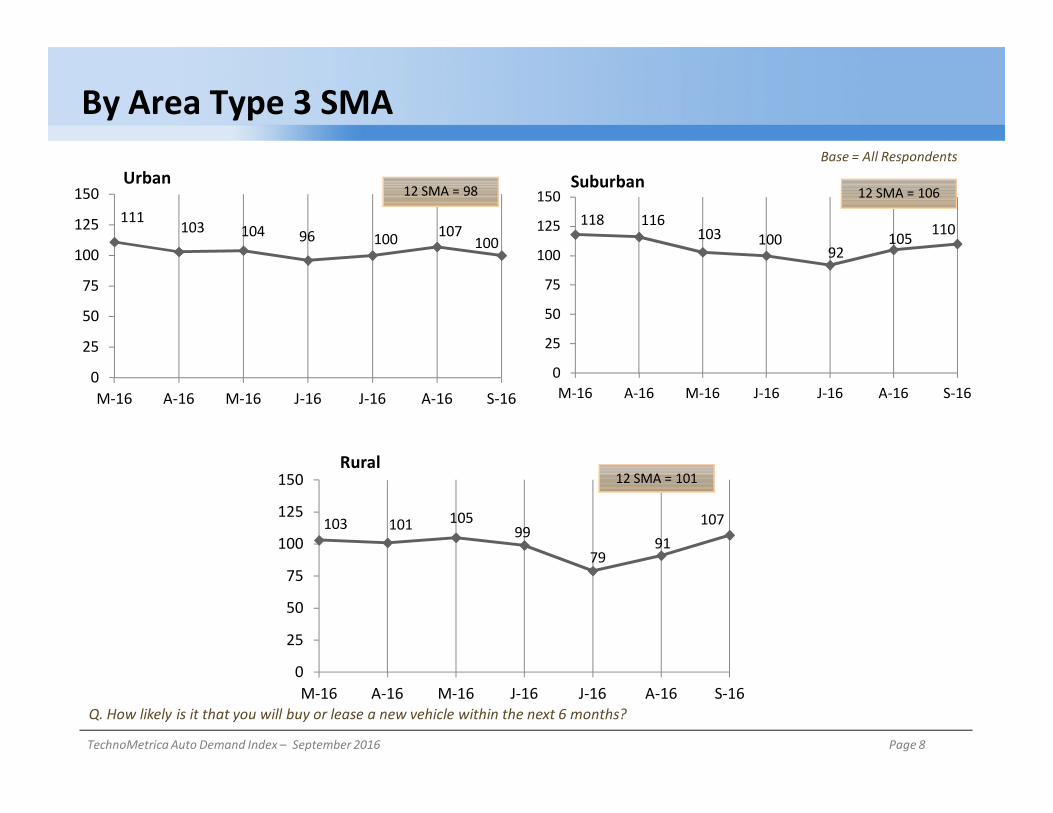
By Area Type 3 SMABase = All Respondents
Q. How likely is it that you will buy or lease a new vehicle within the next 6 months?
118 116103 100
92105 110
0
25
50
75
100
125
150
M-16 A-16 M-16 J-16 J-16 A-16 S-16
Suburban
111103 104 96 100 107
100
0
25
50
75
100
125
150
M-16 A-16 M-16 J-16 J-16 A-16 S-16
Urban12 SMA = 98
12 SMA = 101
12 SMA = 106

TechnoMetrica Auto Demand Index – September 2016 Page 9
By Age 3 SMABase = All Respondents
Q. How likely is it that you will buy or lease a new vehicle within the next 6 months?
138 143126 114 100
126109
0255075
100125150175200225
M-16 A-16 M-16 J-16 J-16 A-16 S-16
18-24
108 105101
9079
9199
0
25
50
75
100
125
150
M-16 A-16 M-16 J-16 J-16 A-16 S-16
45-64
122115 121 118 111 113 125
0255075
100125150175200
M-16 A-16 M-16 J-16 J-16 A-16 S-16
25-44
87 8067
71 7281 75
0
25
50
75
100
125
150
M-16 A-16 M-16 J-16 J-16 A-16 S-16
65+
12 SMA = 141
12 SMA = 7412 SMA = 96
12 SMA = 114

TechnoMetrica Auto Demand Index – September 2016 Page 10
117105 111 105 102 98 103
0
25
50
75
100
125
150
M-16 A-16 M-16 J-16 J-16 A-16 S-16
Male
By Gender and Marital Status 3 SMABase = All Respondents
Q. How likely is it that you will buy or lease a new vehicle within the next 6 months?
106 11096 91
79
103 106
0
25
50
75
100
125
150
M-16 A-16 M-16 J-16 J-16 A-16 S-16
Female
113 109108 103
95110 112
0
25
50
75
100
125
150
M-16 A-16 M-16 J-16 J-16 A-16 S-16
Married
112 108101
9385
92 99
0
25
50
75
100
125
150
M-16 A-16 M-16 J-16 J-16 A-16 S-16
Single
12 SMA = 104
12 SMA = 10612 SMA = 99
12 SMA = 99

TechnoMetrica Auto Demand Index – September 2016 Page 11
By Parental Status and Race/Ethnicity 3 SMABase = All Respondents
Q. How likely is it that you will buy or lease a new vehicle within the next 6 months?
134 145 151133
126138
159
0255075
100125150175200
M-16 A-16 M-16 J-16 J-16 A-16 S-16
Parents
10595
88 8779
90 88
0
25
50
75
100
125
150
M-16 A-16 M-16 J-16 J-16 A-16 S-16
Non-Parents
137 137128 126
112125 138
0
25
50
75
100
125
150
175
M-16 A-16 M-16 J-16 J-16 A-16 S-16
Black/Hispanic
103 100 96 8980
91 96
0
25
50
75
100
125
150
M-16 A-16 M-16 J-16 J-16 A-16 S-16
White
12 SMA = 134
12 SMA = 12812 SMA = 95
12 SMA = 92
TechnoMetrica Auto Demand Index – September 2016 Page 12
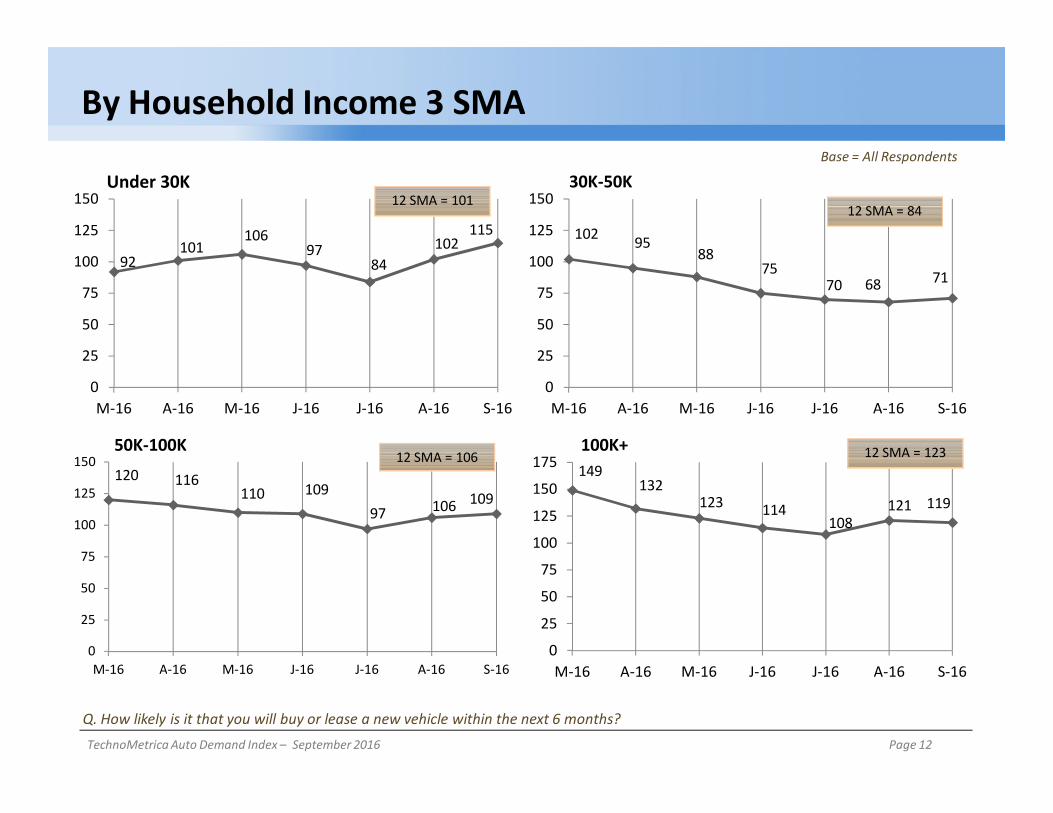
By Household Income 3 SMABase = All Respondents
Q. How likely is it that you will buy or lease a new vehicle within the next 6 months?
149132
123 114108
121 119
0
25
50
75
100
125
150
175
M-16 A-16 M-16 J-16 J-16 A-16 S-16
100K+
120 116110 109
97 106 109
0
25
50
75
100
125
150
M-16 A-16 M-16 J-16 J-16 A-16 S-16
50K-100K
102 9588
7570 68 71
0
25
50
75
100
125
150
M-16 A-16 M-16 J-16 J-16 A-16 S-16
30K-50K
92101
10697
84102
115
0
25
50
75
100
125
150
M-16 A-16 M-16 J-16 J-16 A-16 S-16
Under 30K12 SMA = 101
12 SMA = 12312 SMA = 106
12 SMA = 84
TechnoMetrica Auto Demand Index – September 2016 Page 13
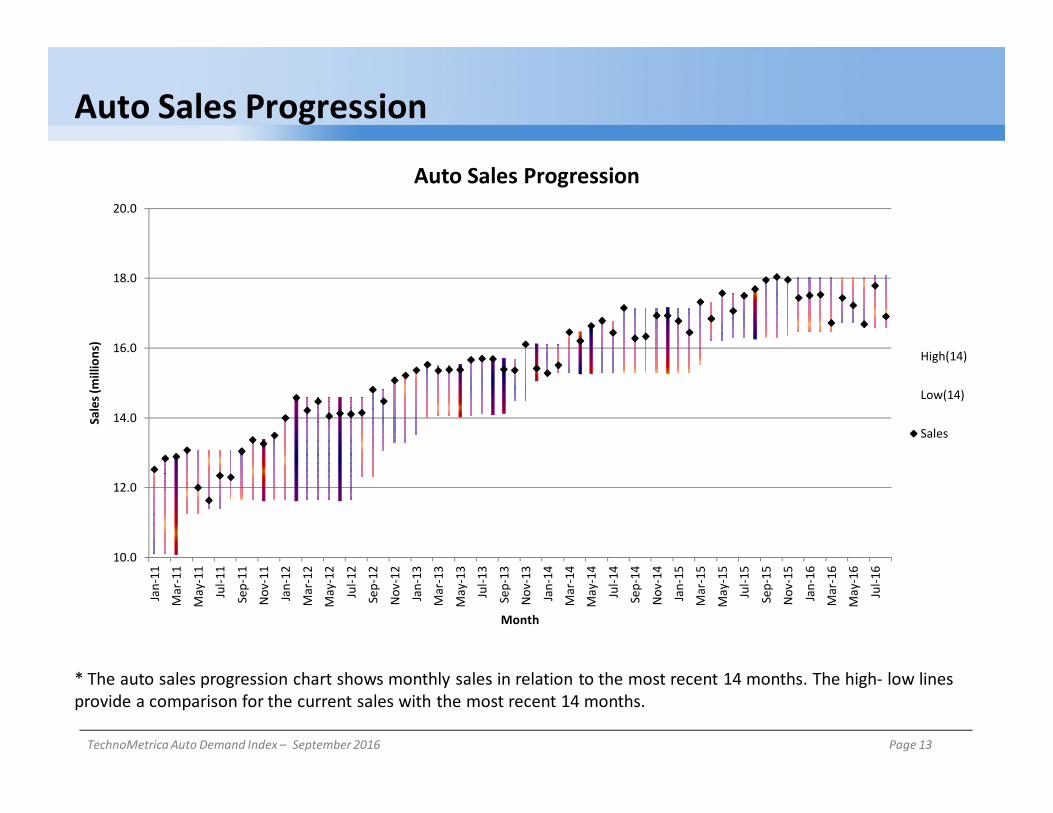
* The auto sales progression chart shows monthly sales in relation to the most recent 14 months. The high- low lines provide a comparison for the current sales with the most recent 14 months.
Auto Sales Progression
10.0
12.0
14.0
16.0
18.0
20.0
Jan-
11
Mar
-11
May
-11
Jul-1
1
Sep-
11
Nov
-11
Jan-
12
Mar
-12
May
-12
Jul-1
2
Sep-
12
Nov
-12
Jan-
13
Mar
-13
May
-13
Jul-1
3
Sep-
13
Nov
-13
Jan-
14
Mar
-14
May
-14
Jul-1
4
Sep-
14
Nov
-14
Jan-
15
Mar
-15
May
-15
Jul-1
5
Sep-
15
Nov
-15
Jan-
16
Mar
-16
May
-16
Jul-1
6
Sale
s (m
illio
ns)
Month
Auto Sales Progression
High(14)
Low(14)
Sales

TechnoMetrica Auto Demand Index – September 2016 Page 14
Slow Stochastic Index
* The Slow Stochastic Index aids in identifying the tops and bottoms of auto sales.
After displaying two straight months of growth, momentum for the Slow Stochastic Index slowed slightly last month, to a reading of 38.15.
%D
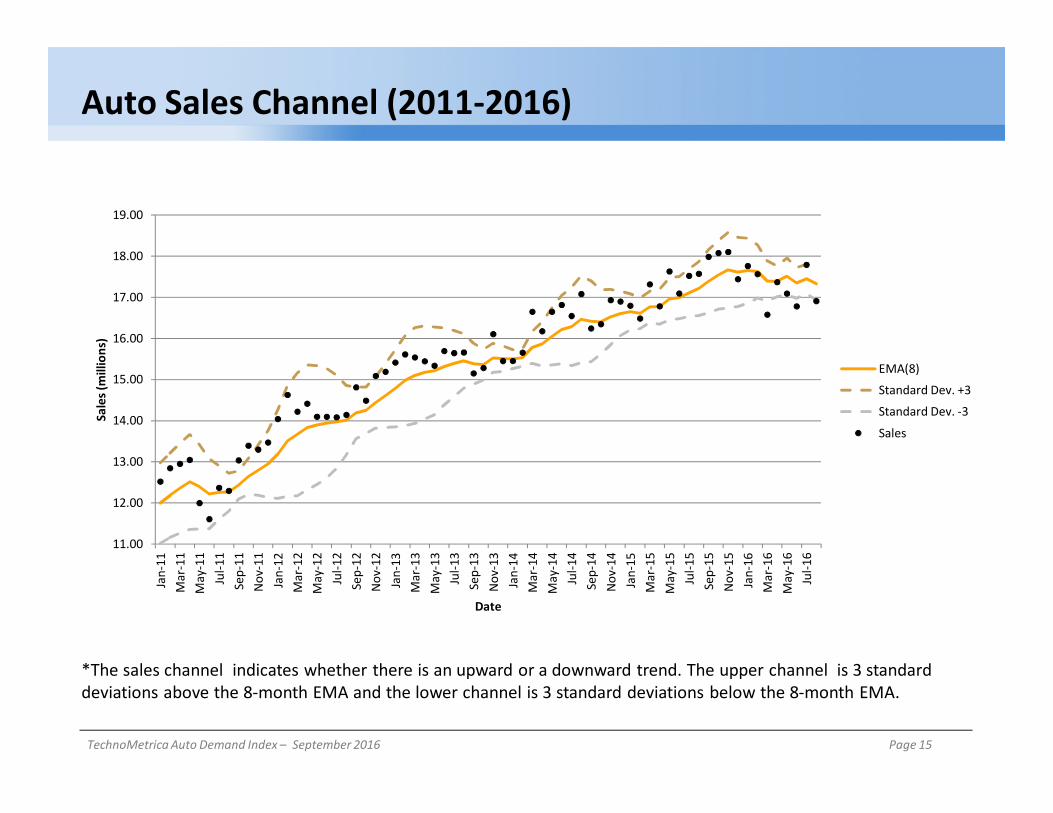
TechnoMetrica Auto Demand Index – September 2016 Page 15
*The sales channel indicates whether there is an upward or a downward trend. The upper channel is 3 standard deviations above the 8-month EMA and the lower channel is 3 standard deviations below the 8-month EMA.
11.00
12.00
13.00
14.00
15.00
16.00
17.00
18.00
19.00
Jan-
11M
ar-1
1M
ay-1
1Ju
l-11
Sep-
11N
ov-1
1Ja
n-12
Mar
-12
May
-12
Jul-1
2Se
p-12
Nov
-12
Jan-
13M
ar-1
3M
ay-1
3Ju
l-13
Sep-
13N
ov-1
3Ja
n-14
Mar
-14
May
-14
Jul-1
4Se
p-14
Nov
-14
Jan-
15M
ar-1
5M
ay-1
5Ju
l-15
Sep-
15N
ov-1
5Ja
n-16
Mar
-16
May
-16
Jul-1
6
Sale
s (m
illio
ns)
Date
EMA(8)
Standard Dev. +3
Standard Dev. -3
Sales
Auto Sales Channel (2011-2016)
TechnoMetrica Auto Demand Index – September 2016 Page 16
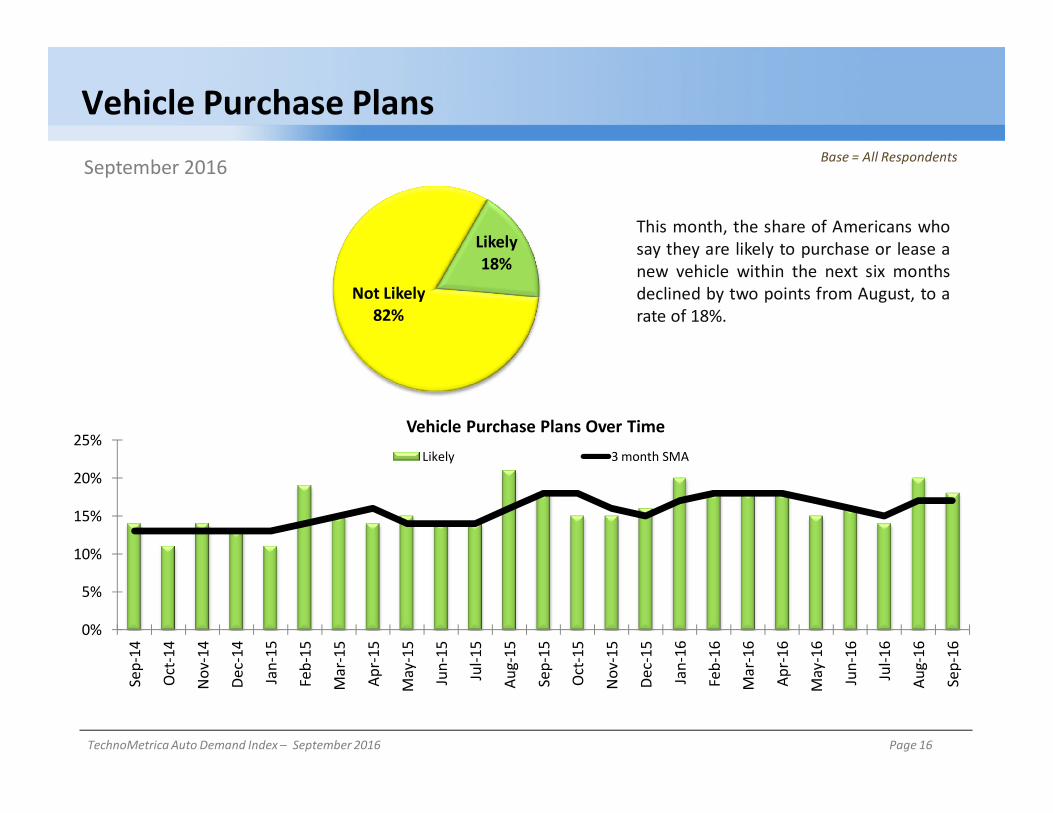
Likely18%
Not Likely82%
Vehicle Purchase PlansBase = All Respondents
0%
5%
10%
15%
20%
25%
Sep-
14
Oct
-14
Nov
-14
Dec-
14
Jan-
15
Feb-
15
Mar
-15
Apr-
15
May
-15
Jun-
15
Jul-1
5
Aug-
15
Sep-
15
Oct
-15
Nov
-15
Dec-
15
Jan-
16
Feb-
16
Mar
-16
Apr-
16
May
-16
Jun-
16
Jul-1
6
Aug-
16
Sep-
16
Likely 3 month SMA
September 2016
This month, the share of Americans whosay they are likely to purchase or lease anew vehicle within the next six monthsdeclined by two points from August, to arate of 18%.
Vehicle Purchase Plans Over Time
TechnoMetrica Auto Demand Index – September 2016 Page 17
0%
10%
20%
30%
40%
50%
60%
70%
80%
90%
100%
M-16 A-16 M-16 J-16 J-16 A-16 S-16
Within 1 Month Between 2 and 3 Months Between 4 and 6 Months Not sure
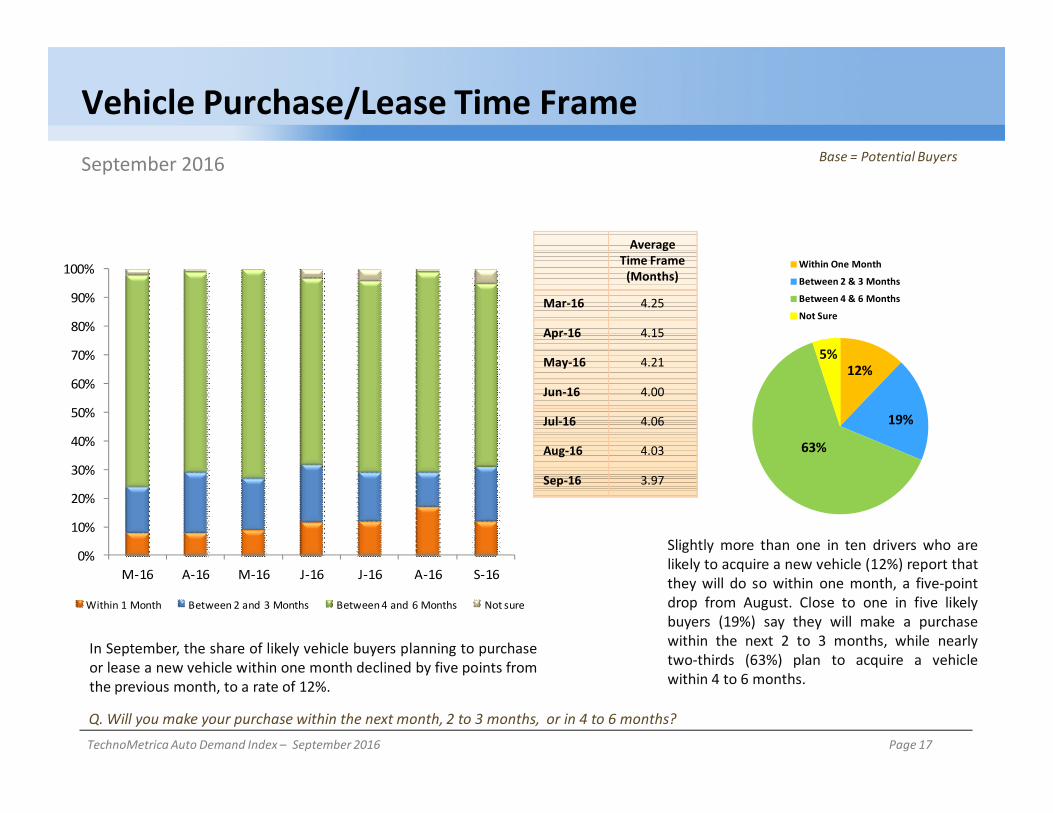
Vehicle Purchase/Lease Time FrameSeptember 2016 Base = Potential Buyers
Slightly more than one in ten drivers who arelikely to acquire a new vehicle (12%) report thatthey will do so within one month, a five-pointdrop from August. Close to one in five likelybuyers (19%) say they will make a purchasewithin the next 2 to 3 months, while nearlytwo-thirds (63%) plan to acquire a vehiclewithin 4 to 6 months.
Q. Will you make your purchase within the next month, 2 to 3 months, or in 4 to 6 months?
In September, the share of likely vehicle buyers planning to purchaseor lease a new vehicle within one month declined by five points fromthe previous month, to a rate of 12%.
Average Time Frame
(Months)
Mar-16 4.25
Apr-16 4.15
May-16 4.21
Jun-16 4.00
Jul-16 4.06
Aug-16 4.03
Sep-16 3.97
12%
19%
63%
Within One Month
Between 2 & 3 Months
Between 4 & 6 Months
Not Sure
5%
TechnoMetrica Auto Demand Index – September 2016 Page 18
Negative Change Positive Change
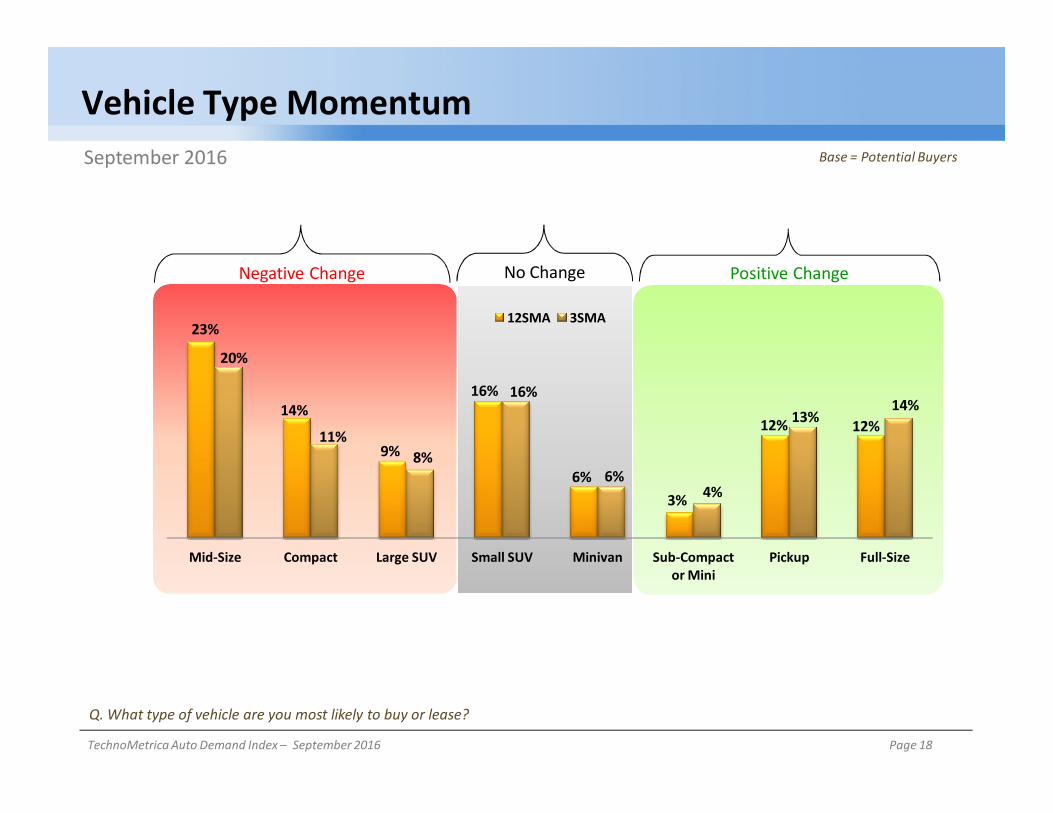
Vehicle Type MomentumSeptember 2016 Base = Potential Buyers
Q. What type of vehicle are you most likely to buy or lease?
No Change
23%
14%
9%
16%
6%3%
12% 12%
20%
11%8%
16%
6%4%
13%14%
Mid-Size Compact Large SUV Small SUV Minivan Sub-Compact or Mini
Pickup Full-Size
12SMA 3SMA

TechnoMetrica Auto Demand Index – September 2016 Page 19
13% 13%13%
13%11% 11% 11%
0%
10%
20%
30%
40%
M-16 A-16 M-16 J-16 J-16 A-16 S-16
Compact
Preferred Vehicle Types Over Time - 3 SMABase = Potential Buyers
2%3% 3% 3% 3% 3% 4%
0%
10%
20%
30%
40%
M-16 A-16 M-16 J-16 J-16 A-16 S-16
Subcompact/Mini
23% 23% 21% 21% 20% 21%20%
0%
10%
20%
30%
40%
M-16 A-16 M-16 J-16 J-16 A-16 S-16
Mid-Size
11%13% 13% 12% 13% 14% 14%
0%
10%
20%
30%
40%
M-16 A-16 M-16 J-16 J-16 A-16 S-16
Full-Size
12 SMA = 3 12 SMA = 14
12 SMA = 1212 SMA = 23
TechnoMetrica Auto Demand Index – September 2016 Page 20
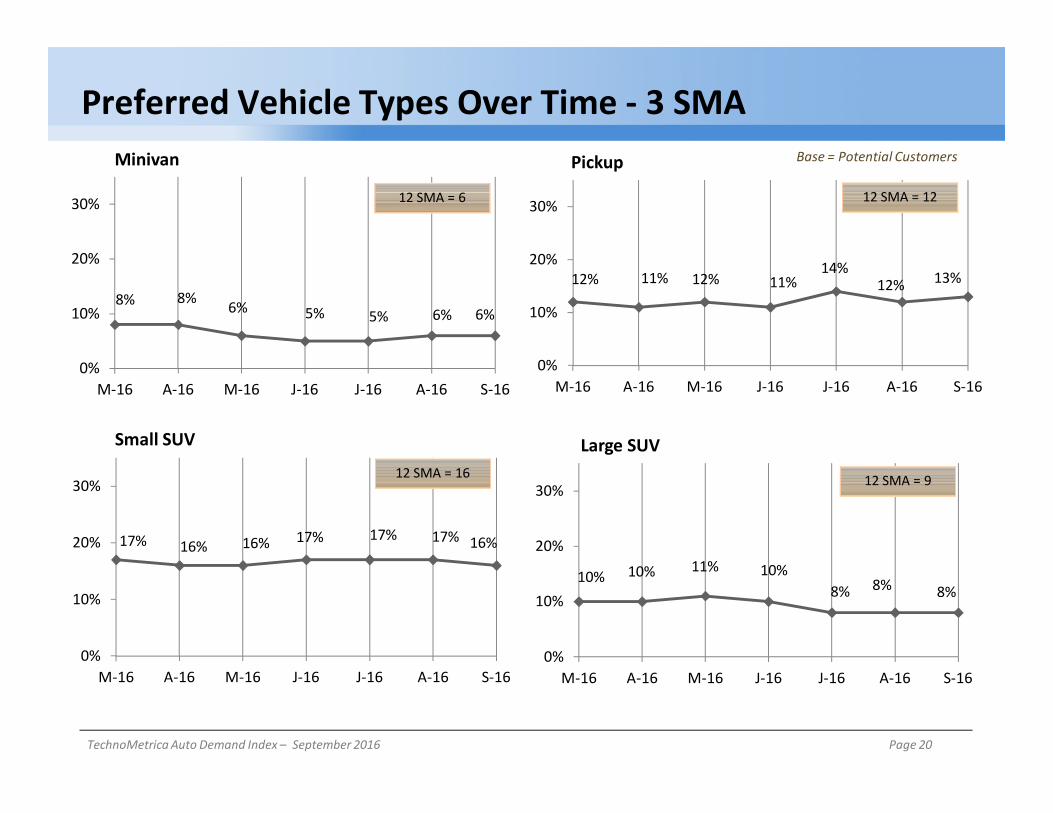
Base = Potential Customers
8% 8% 6% 5% 5% 6% 6%
0%
10%
20%
30%
M-16 A-16 M-16 J-16 J-16 A-16 S-16
Minivan
12% 11% 12% 11%14%
12% 13%
0%
10%
20%
30%
M-16 A-16 M-16 J-16 J-16 A-16 S-16
Pickup
17% 16% 16% 17% 17% 17% 16%
0%
10%
20%
30%
M-16 A-16 M-16 J-16 J-16 A-16 S-16
Small SUV
10% 10% 11% 10%8% 8% 8%
0%
10%
20%
30%
M-16 A-16 M-16 J-16 J-16 A-16 S-16
Large SUV
12 SMA = 6 12 SMA = 12
12 SMA = 912 SMA = 16
Preferred Vehicle Types Over Time - 3 SMA
TechnoMetrica Auto Demand Index – September 2016 Page 21
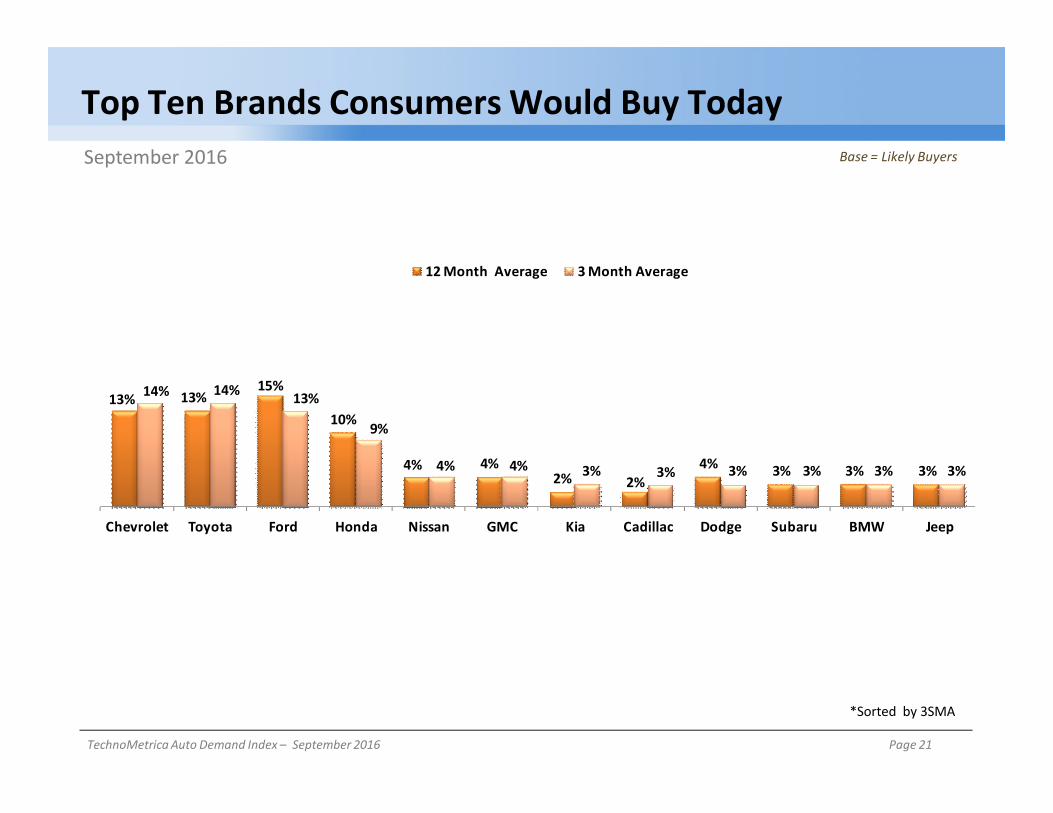
Top Ten Brands Consumers Would Buy TodaySeptember 2016 Base = Likely Buyers
*Sorted by 3SMA
13% 13%15%
10%
4% 4%2% 2%
4% 3% 3% 3%
14% 14% 13%
9%
4% 4% 3% 3% 3% 3% 3% 3%
Chevrolet Toyota Ford Honda Nissan GMC Kia Cadillac Dodge Subaru BMW Jeep
12 Month Average 3 Month Average

TechnoMetrica Auto Demand Index – September 2016 Page 22
11% 13% 12%14% 15% 15% 14%
0%
10%
20%
30%
M-16 A-16 M-16 J-16 J-16 A-16 S-16
Toyota
10% 11%9% 9% 8% 9% 9%
0%
10%
20%
30%
M-16 A-16 M-16 J-16 J-16 A-16 S-16
Honda
12% 11%13% 12%
15%11%
14%
0%
10%
20%
30%
M-16 A-16 M-16 J-16 J-16 A-16 S-16
Brand Preference Over Time 3 SMA (Top 4 Brands)Base = Likely Buyers
16% 15% 15% 14%12% 12% 13%
0%
10%
20%
30%
M-16 A-16 M-16 J-16 J-16 A-16 S-16
Ford
12 SMA = 13
12 SMA = 1012 SMA = 15
Chevrolet12 SMA = 13

TechnoMetrica Auto Demand Index – September 2016 Page 23
2% 1% 2% 2% 2% 3% 3%
0%
10%
20%
30%
M-16 A-16 M-16 J-16 J-16 A-16 S-16
Kia
2% 2% 1% 1% 2% 3% 3%
0%
10%
20%
30%
M-16 A-16 M-16 J-16 J-16 A-16 S-16
Cadillac
4% 4% 3% 4% 3% 4% 4%
0%
10%
20%
30%
M-16 A-16 M-16 J-16 J-16 A-16 S-16
GMC
4% 4% 4% 4% 4% 5% 4%
0%
10%
20%
30%
M-16 A-16 M-16 J-16 J-16 A-16 S-16
Nissan
Brand Preference Over Time 3 SMA (Brands 5 to 8)Base = Likely Buyers
12 SMA = 4 12 SMA = 4
12 SMA = 2 12 SMA = 2
TechnoMetrica Auto Demand Index – September 2016 Page 24
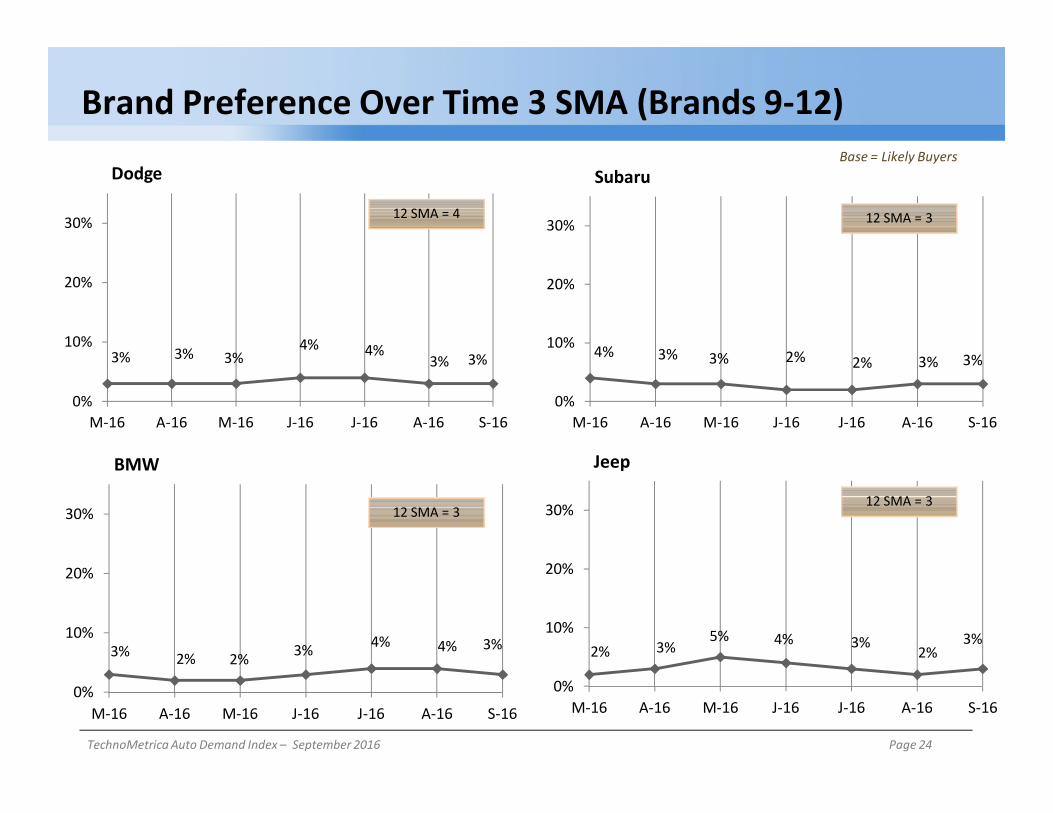
3% 2% 2% 3% 4% 4% 3%
0%
10%
20%
30%
M-16 A-16 M-16 J-16 J-16 A-16 S-16
BMW
3% 3% 3%4% 4%
3% 3%
0%
10%
20%
30%
M-16 A-16 M-16 J-16 J-16 A-16 S-16
Dodge
2% 3%5% 4% 3%
2%3%
0%
10%
20%
30%
M-16 A-16 M-16 J-16 J-16 A-16 S-16
Jeep
4% 3% 3% 2% 2% 3% 3%
0%
10%
20%
30%
M-16 A-16 M-16 J-16 J-16 A-16 S-16
Subaru
Brand Preference Over Time 3 SMA (Brands 9-12)Base = Likely Buyers
12 SMA = 4 12 SMA = 3
12 SMA = 312 SMA = 3
TechnoMetrica Auto Demand Index – September 2016 Page 25
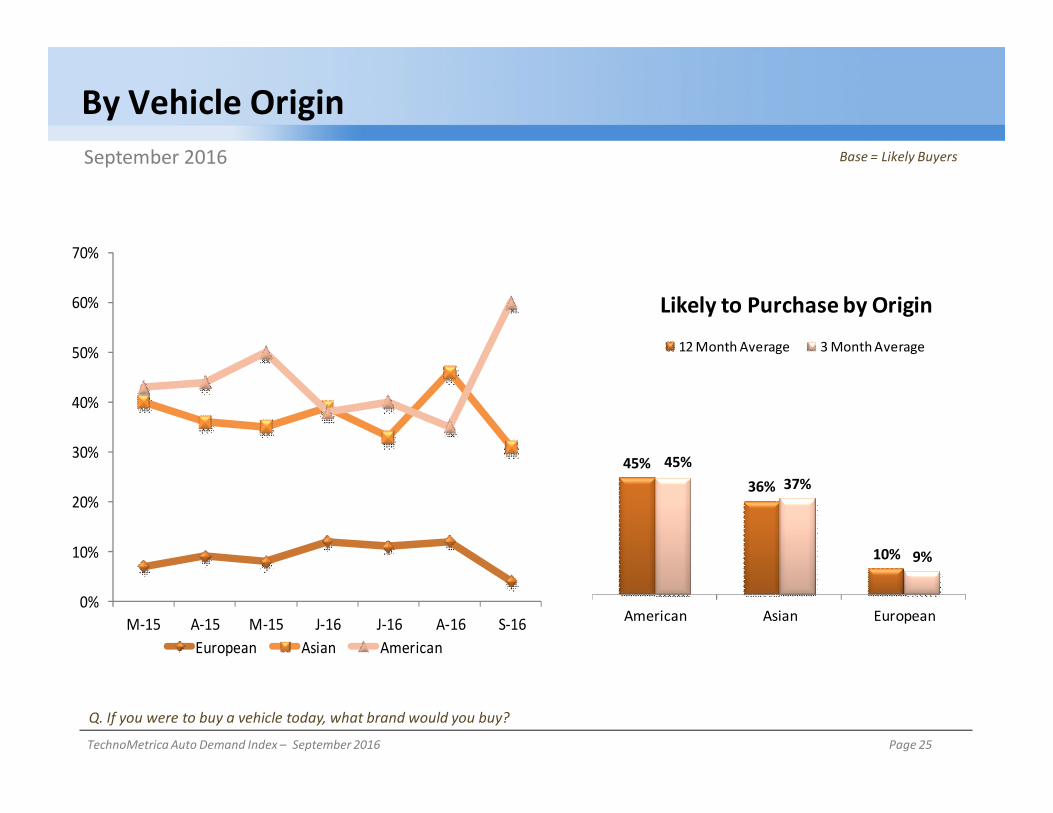
By Vehicle OriginSeptember 2016 Base = Likely Buyers
Q. If you were to buy a vehicle today, what brand would you buy?
45%36%
10%
45%37%
9%
American Asian European
Likely to Purchase by Origin
12 Month Average 3 Month Average
0%
10%
20%
30%
40%
50%
60%
70%
M-15 A-15 M-15 J-16 J-16 A-16 S-16European Asian American
TechnoMetrica Auto Demand Index – September 2016 Page 26
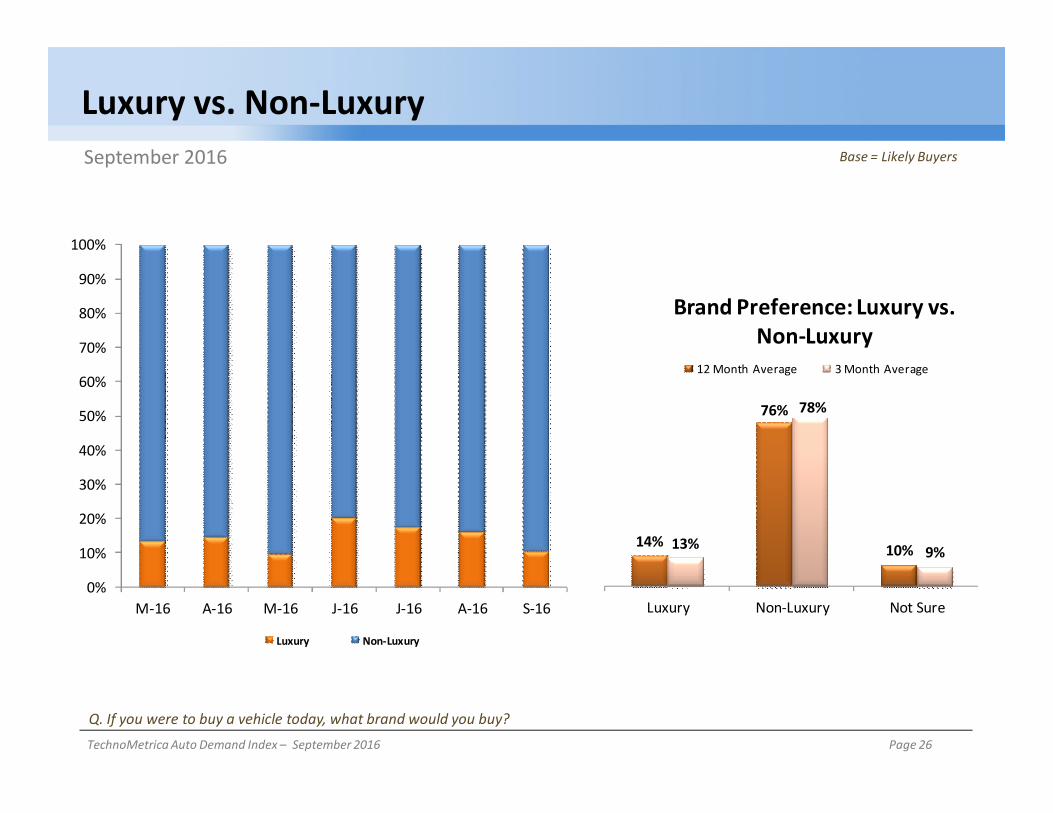
Luxury vs. Non-LuxurySeptember 2016 Base = Likely Buyers
Q. If you were to buy a vehicle today, what brand would you buy?
0%
10%
20%
30%
40%
50%
60%
70%
80%
90%
100%
M-16 A-16 M-16 J-16 J-16 A-16 S-16
Luxury Non-Luxury
14%
76%
10%13%
78%
9%
Luxury Non-Luxury Not Sure
Brand Preference: Luxury vs. Non-Luxury
12 Month Average 3 Month Average
TechnoMetrica Auto Demand Index – September 2016 Page 27
Conclusions Although consumers’ intent to acquire new vehicles slowed somewhat in September, due to persistent concerns regarding the outlook for
the overall economy, vehicle purchase intent remains relatively strong among Americans. After gaining 41 points in August, the Auto Demand Index level declined by 15 points this month, registering an overall score of 108. Relatively low gas prices, rising personal income, and the luring power of deals are among the key factors driving the high level of purchase intent among consumers.
September’s Auto Demand Index score registered above all three of its moving averages. The Index level topped both its 12-month and 6-month moving averages (101) by 6 points, while surpassing its 3-month (105) average by three points. Meanwhile, the 3-month moving average gained four points in September, marking the second straight month of growth in the reading.
Thus, we anticipate that vehicle purchase intent will remain strong in the near future, although it may not reach the levels of last year’s robust performance.
For the second month in a row, our momentum indicator (MACD) increased in September, rising 0.4 point to a reading of 2.7. As a result, TechnoMetrica anticipates that the Auto Demand Index will maintain its positive momentum in the coming months. Therefore, we also expect new vehicle sales to rise somewhat in the coming months, fueled by the easy availability of credit and rising incentives. However, at the same time, auto sales, which may have already reached peak performance, will grow at a slower rate than last year’s record pace.
In terms of demographics, purchase intent improved among 16 of the twenty-three segments that TechnoMetrica tracks on a monthly basis. The most significant growth in purchase intent was displayed among parents and Midwestern Americans, whose ADI scores increased by 21 points and 20 points, respectively. Americans living in rural areas also showed strong improvement in intention to acquire a vehicle, as the segment’s Index score climbed 16 points. On the other hand, Millennials between the ages of 18 and 24 displayed the greatest weakening in purchase intent, with the ADI score of the group posting a 17-point decline.
Nearly one in five consumers (18%) indicated that they were likely to acquire a new vehicle in the next six months, compared to 20% in August. Regarding consumers’ vehicle preference, mid-size vehicles, the choice of one in five likely buyers (20%), remain the most desired vehicle type, followed by small SUVs, at 16%. Also, preference for full-size vehicles continues to display positive growth among consumers.
The Auto Demand Index also allows us to gain insight into brand preferences among prospective buyers. This month, Chevrolet, which placed third in August, tied Toyota for the top spot in brand choice. Both brands garnered a 14% share of likely buyers. Meanwhile, Ford, preferred by 13% of prospective buyers, dropped one position to take third place. Nearly one in ten consumers (9%) chose Honda as the brand they plan to purchase next, while Nissan and GMC were both desired by 4% of likely buyers. Regarding the land of origin of the vehicles that consumers intend to purchase, preference for American-made vehicles climbed 25 points, to a share of 60%, its highest level since January 2012. Meanwhile, nearly one-third of likely buyers (31%) intend to acquire Asian brands.

TechnoMetrica Auto Demand Index – September 2016 Page 28
Contact Information
To request a full data set or for any questions, please contact us.
Contact: Raghavan Mayur
Address: 70 Hilltop Road, Suite 1001Ramsey, NJ 07446
Phone: 800-328-TECH (8324)201-986-1288
Fax: 201-986-0119
Email: [email protected]
Web: www.technometrica.com
Top Related