


Languages
Pages
Legal

IMM Manuscript 08-455
1
Technological, marketing and complementary competencies as antecedents
of innovative performance
Tanja Rajkovic, University of Ljubljana Janez Prasnikar, University of Ljubljana
Abstract: In the paper we present a model of technological, marketing and complementary
competencies in relation to firms’ innovative performance. The model is based on a cross-
industry survey and tested on a sample of 65 product lines belonging to 50 established
Slovenian middle-sized and large manufacturing firms by applying the partial least squares
structural modeling tool SmartPLS. We confirm the positive links between the constructs,
however we argue that the competencies differ according to the innovative strategy pursued
by the firms. For this purpose we introduce models of incremental innovation, radical
innovation and the model assuming for the trend-setting strategy. We further prove that
innovative performance has a positive effect on firm’s business performance. The
implications of our findings are valuable to the firms aligning their competencies with their
strategy, as well as to policy makers in technology following countries,
Keywords: technological, marketing and complementary competencies, innovative
performance, incremental innovation, radical innovation, innovation policy.

IMM Manuscript 08-455
2
1 Introduction
In the last decades competence based view gained considerable attention in the
literature on competitive advantage (Prahalad and Hamel 1990; Hamel and Heene 1994;
Sanchez, Heene and Thomas 1996; Hafeez Zhang and Malak 2002; Sanchez 2004; and
Hafeez, Malak and Zhang 2007). It is also claimed that a combination of technological and
marketing capabilities and competencies can create such competitive advantage (Chang 1996;
Dutta, Narasimhan and Rajiv 1999; and Song, Droge, Hanvanich and Calantone 2005). A firm
with strong technological competencies is capable of using scientific knowledge to promptly
develop products and processes that offer new benefits and create value for customers
(McEvily, Eisenhardt and Prescott 2004). A firm with strong marketing competencies is able
to use its deep understanding of customer needs to foster development of new products and
organize marketing activities that provide a unique value to consumers (Day 1994; and
Vorhies 1998). In addition to each of the direct effects discussed above, technological and
marketing capabilities operate also in an integrated manner (Chang 1996; Dutta, Narasimhan
and Rajiv 1999; and Song, Droge, Hanvanich and Calantone 2005).
Competencies influence firm performance by affecting the rate and success of
innovation (Tidd and Bodley 2002). The knowledge represented by these competencies
contributes to speed and flexibility of the development process and results in competitive
products. As proposed by Swink and Song (2007) there is substantial impact of both
marketing and technological capabilities in each stage of product development which in turn
is associated with higher project return on investment. Competencies not only influence
product competitive advantage but also project lead times.

IMM Manuscript 08-455
3
Since competition is becoming increasingly innovation based (Teece, Pisano and
Shuen 1997) and studies confirm positive effects of innovation on productivity (Mairesse and
Sassenou 1991; and Wakelin 2001) the market value of firms (Blundell, Griffith and Van
Reenen 1999; Hall 1999; and Nagaoka 2006) as well as a positive effect of innovativeness on
business performance (Hult, Hurley and Knight 2004), it is of interest to determine more
precise relations among different sets of competencies, innovative performance and firm
performance. In our paper we investigate these relations.
The main contributions of the paper are twofold. Firstly, based on data from Slovenian
manufacturing companies we determined the most important constituents of technological,
marketing and complementary competencies across industries and how they influence
innovative performance of firms. Using different indicators of innovative performance we
differentiate between competencies employed in new product development activities relating
to incremental innovations captured in improved products and radical innovations captured in
new generations of products. Competencies were also evaluated by taking into account the
position that a company assumes by setting trends in the industry. Secondly, few studies
(Wang, Lo and Yang 2004; Song, Droge, Hanvanich and Calantone 2005; and Hagedoorn and
Cloodt 2007) have attempted to differentiate the various sources of superior firm performance
in terms of different elements of core competencies and thus provide an insight into
underlying determinants of innovation and consequently innovative performance. We
measured relations among technological, marketing and complementary competencies,
innovative performance and firm performance simultaneously.
The paper is organized as follows. A brief review of the concepts is given and the
operational model is presented in section 2. The research methodology employed is explained
in section 3. In section 4 we present the results of the study. Discussion follows in section 5.

IMM Manuscript 08-455
4
2 A model of the antecedents of innovative performance and its impact on business
performance
Competencies as such refer to the ability to utilize resources that spread across
multiple functions, products and markets in a sustainable and synchronized manner. They
differ from company to company, yet represent a broader, more general perspective on
strategy and are not strictly industry specific. Their main constituents are capabilities, a
portfolio of capabilities, respectively. Capabilities are repeatable patterns of actions in the use
of assets to create, produce and/or offer products to a market (Grant 1991). Only those key
capabilities that are relatively unique and common to various business functions, products and
business units are likely to form competencies of a company (Sanchez 2004). These are
industry specific and can be identified by using internal and external knowledge of experts
(managers) (Hafeez, Malak and Zhang 2007; and Prašnikar, Lisjak, Rejc Buhovac and
Štembergar 2008).
Technological competencies incorporate practical and theoretical know-how, as well
as the methods, experience and equipment necessary for developing new products (Wang, Lo
and Yang 2004). They encompass a portfolio of technological capabilities concerning the
capacity of the company to utilize scientific and technical knowledge for research and
development of products and processes, which leads toward greater innovativeness and
performance (McEvily, Eisenhardt and Prescott 2004). According to Swink and Song (2007)
technological competencies influence all four stages of the new product development process.
At the first stage of business/market analysis technological competencies help address the
technical feasibility of products in question. Technical development stage incorporates
product and process engineering studies and continues with establishing product designs and
specifications, prototyping the product and approving final designs. In all of these tasks
technological competencies have a central position. During the third stage of product testing

IMM Manuscript 08-455
5
technological competencies are of secondary importance, still, they influence the design of
consumer tests and interpretation of the results. At the last stage of product commercialization
they are key for production plans and production ramp-up.
Companies with well developed marketing competencies are well aware of customer
needs and are capable of value creation on all elements of a product or service that are
relevant to the customers (Day 1994). Constituent marketing capabilities are therefore an
interwoven system based on knowledge and skills that allow the company to generate
customer value and also facilitate timely and effective response to the marketing challenges
(Vorhies 1998; Vorhies and Harker 2000; and Song, Droge, Hanvanich and Calantone 2005).
At the business/market analysis stage marketing competencies provide an evaluation of
market impacts of product feature options (Kuhurana and Rosenthal 1997) as the aim is to
understand the competitive positioning of the future product. During the technical
development stage marketing competencies facilitate product feature decisions. Marketing
usually takes a leading role in product testing which encompasses selection of key customers
and sites, testing of markets and result analysis. Marketing plans, product promotion and
distribution are tasks that require marketing competencies for product launch at the product
commercialization stage (Paul and Peter 1994; and Swink and Song 2007).
Some authors treat complementary capabilities and competencies* as an interaction
between technological and marketing capabilities and competencies (Song, Droge, Hanvanich
and Calantone 2005), however, various studies have now identified them as an independent
group. Complementary competencies reflect the degree of fit between the two groups. They
should be treated as a distinct network of capabilities and a failure to value them properly can
lead to a deficient identification of key capabilities. The role of complementary competencies
according to Wang et al. (2004) is to: 1) integrate different technological specialties; 2) * Complementary capabilities and competencies are referred to in literature also as integrative, integration or combinative capabilities and competencies.
IMM Manuscript 08-455
6
combine different functional specialties; 3) exploit synergies across business units; 4)
combine in-house resources with external capabilities required and 5) integrate the dynamic
competence building process for superior performance. To align the new product features
(technological aspect) with potential customers’ needs (marketing aspect) is the role of
complementary competencies at the first stage of new product development. They are also
employed in the assessment of the needed investment and accompanying risks (Swink and
Song 2007). Similar complementarity of technological and marketing knowledge is also key
during the second stage of technical development. At the same time it proves to be positively
related to translating testing results into product and process design modifications (Song,
Thieme and Xie 1998) during the product testing. Integration of both streams of competencies
contributes to better coordination of production planning and demand management activities
during product commercialization.
Firms' new product portfolios balance between new products based on incremental
innovation and fundamental innovation (Schewe 1996; and Ali, Kalwani and Kovenock
1993). Development of new generation products based on radical innovations and
development of products shaping new industry trends draws from substantially different and
novel technologies. In the case of incremental modifications of products “market pull”
provides the information on customers’ preferences, while “technology push” prevails with
completely new technologies that address customers’ latent needs (Tidd and Bodley 2002).
Since consumers buy products for the benefits they gain from them, “technology push” still
has to observe customer needs. Therefore, customer and market analysis are crucial also for
technologically more novel innovations (Bacon, Beckman, Mowery and Wilson 1994).
A successful new product development process contributes to financial success of the
product and consequently to overall business success of a firm via two paths (Brown and
Eisendart 1995). A productive process lowers costs and enables lower and more competitive

IMM Manuscript 08-455
7
prices. A faster process further ensures strategic flexibility and shorter lead times. Product
effectiveness, on the other hand, is demonstrated through product characteristics, among them
low-cost, unique benefits and fit with firm competencies. Products with these characteristics
are also more appealing to the consumers (Zirger and Maidique 1990). Empirical studies
provide evidence that both radical and incremental innovations contribute to firm’s survival,
growth and profitability (Varadarajan 2008).
On the basis of the conceptual framework on the influence of technological, marketing
and complementary competencies on the innovative performance and business performance,
the following operational model can be constructed (see Figure 1).
Figure 1
3 Research methodology
Sample and data collection
The study is based on a cross-industry survey carried out among medium sized and
large manufacturing firms in Slovenia. The population targeted in the survey was obtained
from the database of legal entities registered in Slovenia. Included were firms that have not
been registered later than by the years 2002 and have been operating through the whole period
2002-2006. The target population of companies thus consisted of 382 companies. In total 53
companies returned valid questionnaires yielding a 13,8% response rate. Respondents were
management level employees in charge of company R&D. The questionnaire was initially
tested in 12 firms.
The main segments of the questionnaire referred to firm competencies, innovative
performance and business performance. Firms were asked to provide data for individual
product lines where applicable. Nine companies gave responses for more than one product

IMM Manuscript 08-455
8
line thus providing a sample of 70 observations. In further analysis were excluded 3
companies with 5 product lines in total as outliers.
The interviewees evaluated their competencies on a five-point scale relative to their
main competitors and thus estimated the competitiveness of their individual competencies
within the industry (Song, Droge, Hanvanich and Calantone 2005). The time frame for data
gathering (data for competencies, innovations and R&D activities) is a three-year period from
2004 to 2006†.
Variables
Variables to simulate the proposed theoretical concepts were selected on the basis of
economic, organization and management literature. In devising indicators of competencies we
predominantly relied on surveys used in related studies (Chang, 1996; Fisher and Maltz 1997;
and Wang, Lo and Yang 2004). The selected indicators of the concepts included in the model,
enable a multi-industry analysis of the manufacturing sector.
Research shows that technological competencies (TC) usually encompass three
categories: 1) how advanced research and development is (RD_ADVAN); 2) number of
available technological capabilities inside the firm or through strategic partnerships
(TECH_CAP_NQ), and 3) how good the company is at predicting technological trends
(TECH_TREND_F) (Eisenhardt and Martin 2000; and Wang, Lo and Yang 2004).
Marketing competencies (MC) capture marketing research as well as other marketing
activities (Paul and Peter 1994). To include marketing research and forecast competencies, the
indicator "obtaining information about changes of customer preferences and needs"
(INFO_CUST) was applied. The competitors' patterns of activities are illustrated with
"acquisition of real time information about competitors" (INFO_COMP), customer
† This is in compliance with OECD classification innovation activity methodology (OECD 1997).

IMM Manuscript 08-455
9
relationship management with "establishing and managing long-term customer relations"
(CUST_RELAT) and supplier relations using an indicator "establishing and managing long-
term relations with suppliers" (SUPP_RELAT). Selected indicators to some degree reflect
Porter's competitive forces.
Complementary competencies (CC) represent the congruence between technological
and marketing competencies. The internal environment is measured with "good transfer of
technological and marketing knowledge among business units" (TECH_MRKT_KN).
Indicator "the intensity, quality and extent of research and development knowledge transfer in
co-operation with strategic partners" (RD_STP) evaluates dynamic perspective and
competence acquisition through strategic partnerships. The efficiency of economic utilization
of technological and marketing resources engaged in the product development is evaluated
through "product development is cost efficient" (RD_COST_EFF). Organizational focus is
measured with indicator "activities of the business units in the corporate strategy of our firm
are clearly defined" (ACT_STRAT).
The general extent of innovative performance (IP) was measured by “number of
modified, improved and new products” (NO_CH_PROD) representing new product variety or
level of innovation. Technical performance was added and included by variable “quality of
products” (QUAL_PROD). A number of studies in the operations management literature,
namely, confirm the relations between product development and product innovation and
quality, whereby high levels of innovation are associated with high levels of product quality
(Clark and Fujimoto 1991; Dumaine 1989; and Koufteros and Marcoulides 2006). While
product innovation as such refers to competence responsible for introducing new products and
features, product quality or technical performance stands for respective competence of a firm
to produce products that would satisfy customer needs for quality and performance (Kim,
Wong and Eng 2005; and Hall, Johnson and Turney 1991).

IMM Manuscript 08-455
10
The indicator "time needed to develop an improved product" (TIME_IMPR) was
applied to determine effectiveness of improving existing products (incremental innovation).
Time refers to the development project lead time and not to the array of products developed as
with general indicator NO_CH_PROD. Similarly, the effectiveness of new product
development referring to radical innovation is measured by "time needed to develop a
completely new product" (TIME_NEW)‡. The role of innovativeness of the firm in the
industry was represented by indicator "firm’s substantial contribution to world trends in the
industry« (TRENDS). With indicator TRENDS we assume for the market pioneers with
innovations their competitors find worth imitating.
Measures ROA and ROE are included as indicators of profitability and thus integrated
business performance (BP). Actual financial statements data were used. Business performance
is measured in our model by average ROA and ROE during the three year period between
years 2004-2006, which is the same period for which the firms were asked to evaluate their
innovative performance. ROA measures management’s ability and efficiency in issuing firm’s
assets to generate profits (White, Sondhi and Fried 2003). ROE on the other hand reports on
return on total stockholder’s equity.
Empirical method
To test the model, we employed the Partial Least Squares (PLS) approach to structural
modeling. The method poses minimal demands on measurement scales, sample size and
residual distributions. Unlike factor-based covariance fitting approaches for latent structural
modeling, PLS is component based. Therefore, it avoids the problems of inadmissible solution
and factor indeterminacy (Fornell and Bookstein 1982). It assumes that all the measured
variance in useful variance to be explained. Latent variables are estimated as exact linear ‡ Indicators correspond to the strategic factors applied by the Strategic Planning Institute in the PIMS database (Chang 1996).

IMM Manuscript 08-455
11
combinations of the observed measures. By avoiding the indeterminacy problem it provides
an exact definition of component scores (Chin, Marcolin and Newsted 1996).
To assess the measurement model, the type of relationship between the latent constructs
and the indicators has to be specified first. The reflective approach was applied since the
manifest variables or indicators in the model are considered to reflect their latent variables
(Tenenhaus, Esposito Vinzi, Chatelin and Lauro 2005). We used SmartPLS 2.0 (beta)
software (Ringle, Wende and Will 2005) to perform the PLS analysis of structural models.
4 Empirical results
We began our analysis by partially analyzing the constituents of innovative
performance. We propose four distinct ways of measuring the latent variable innovative
performance, thus, obtaining fours distinct models.
The baseline model measures IP with indicators NO_CH_PROD and QUAL_PROD.
New product variety as a result of firm’s innovative activity is accounted for by variable
NO_CH_PROD. Technical dimension of new product performance is measured by
QUAL_PROD. In order to analyze the differences between competencies relating to superiority
in the R&D activities regarding incremental innovation captured in improved products and
radical innovation captured in new generations of products, we have substituted accordingly the
general indicator of the construct innovative performance. To account for incremental
innovation we included as a replacement indicator TIME_IMPR, for radical innovation
indicator TIME_NEW, and for the trend setting role of a firm in the industry, indicator
TRENDS. All indicators and their corresponding latent variables are listed in Table 1.
Table 1

IMM Manuscript 08-455
12
We first checked the different models of innovative performance for internal consistency
reliability, convergent validity and discriminant validity to establish the adequacy of latent
variables in capturing their corresponding manifest variables as proposed by Anderson and
Gerbing (1988). The proposed model was assessed for the sample of 65 product lines of 50
firms. Internal consistency reliability was confirmed since the values of composite reliability
for all constructs in all four models exceed the threshold of 0,70.
The values of cross loadings for proposed indicators in the observed models were
above the cut-off point 0,60 (Hatcher 1994). All latent variables are well correlated with their
indicators. Thus, indicators do a good job at describing their latent variables which are this
way validated demonstrating the convergent validity. Further, the values of average variance
extracted (AVE) were above 0,50 for each construct. This criterion guarantees that in the
measurement of a construct there is more valid variance explained than error.
Fornell and Cha (1994) provided the criterion for discriminant validity according to
which the square root of AVE of each latent variable should be higher than all of its
correlations with other latent variables in the model. This requirement was also satisfied, what
indicates that the latent variables in the proposed models are both conceptually and
empirically distinct from each other.
Since PLS does not make any distributional assumptions, a bootstrapping method of
resampling with replacement was applied and standard errors were computed on the basis of
500 bootstrapping runs and 65 cases, corresponding to the number of observation units as
proposed by Andrews and Buchinsky (2000).
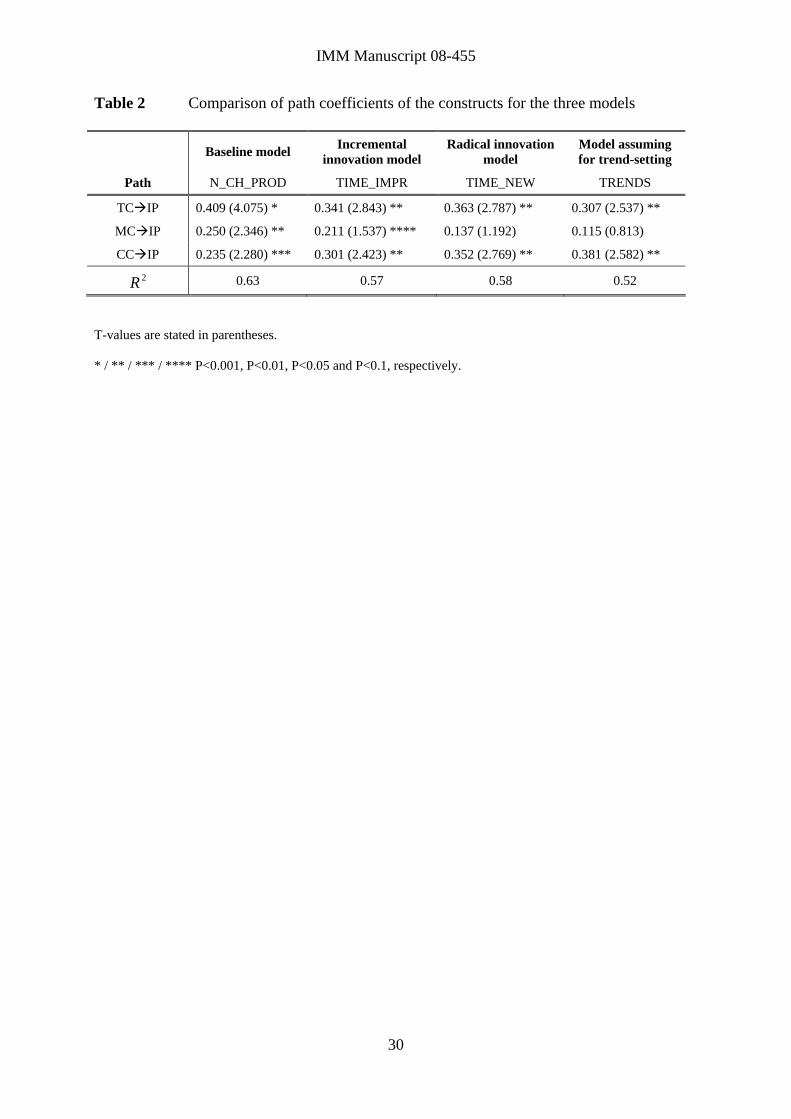
Results for path coefficients of the baseline model (see Table 2) show that
technological competencies have the highest path coefficient and this biggest impact on
innovative performance, followed by marketing competencies and complementary
competencies. This finding is similar to Jeong, Pae and Zhou (2006) who claim that
IMM Manuscript 08-455
13
technological orientation of firms has a greater impact on technical performance and
profitability than customer orientation, however, the latter is more crucial from the viewpoint
of customer acceptance of new products. In order to facilitate the coordination of both groups
of competencies, complementary competencies are necessary.
By comparing path coefficients of the four models, we observe that the incremental
innovation model with indicator TIME_IMPR yields pretty much the same results as the
baseline model with the exception being that complementary competencies play a more
important role than marketing competencies. This result shows that the efficiency of new
product development processes relies to a greater extent on competencies of technological
nature than marketing ones. This result is in line with the finding of Swink and Song (2007)
that integration of technological and marketing knowledge can prolong technological
development stage of new product development process. This is even more evident in
technologically more demanding development endeavors. These are, namely, development of
new generation products (TIME_NEW) and setting trends (TRENDS). In these two cases the
path coefficients for marketing competencies are not significant. However, this does not mean
that market knowledge does not play any role in technologically more complex projects. We
can clearly see that complementary competencies as an integrator of both technological and
marketing knowledge are statistically significant in all of the models. Further, in the model
assuming for trend-setting complementary competencies outperform the technological
competencies.
Table 2
In Table 3 are listed the weights of specific indicators with respect to their
corresponding latent variables for each of the four models that enable us to take a more
IMM Manuscript 08-455
14
detailed look at the competencies. In the baseline model of innovative performance, indicator
TECH_CAP_NQ has the largest influence on the construct of technological competencies.
Availability of different quality technological capabilities benefits new product variety. It is
interesting to note that advancement of R&D (RD_ADVAN) comes last even after
technological trend forecasting (TECH_TREND_F). Firms wishing to accelerate new product
development should combine both radical and incremental innovation capabilities (Zahra and
Ellor 1993), what makes advanced R&D capabilities indispensable in the process. However,
performance of higher novelty development process is in turn more uncertain and riskier,
although these projects tend to yield high returns if successfully commercialized (Mansfield
and Wagner 1975). What causes the uncertainty are technically infeasible project goals and
insufficient market demand. Therefore, R&D activities may not necessarily be as effective
when measured with innovative performance. While the weight of variable TECH_CAP_NQ
remains the highest of technological competencies indicators in all four models, it has the
lowest value in the model of radical innovation. The indicator that simultaneously appears to
gain the most weight in this same model is RD_ADVAN. Technological novelty and
superiority are prerequisites for the development of completely new products.
The importance of customer orientation is confirmed through marketing competencies.
INFO_CUST and CUST_RELAT are the two key marketing competencies in all of the
models. In the model of incremental innovation some of the weight of INFO_CUST is lost
relative to INFO_COMP. As incremental innovations tend to be closely connected to
imitation (Schewe 1996), information about competitors’ activities can be an important
guideline in the formulation of R&D strategy and new products. Relative importance of
INFO_COMP increases also in the last two models, however, they are only limitedly
conclusive since the relation between marketing competencies and innovative performance is
not statistically significant.

IMM Manuscript 08-455
15
Table 3
In the group of complementary competencies for the baseline model stand out the
indicators ACT_STRAT and RD_STP. It can be concluded that innovation strategy not only
has to be a clearly stated strategy of a firm but also well defined. RD_STP can be viewed as
an extension of the technological competencies indicator TECH_CAP_NQ by including the
external environment of the firm. While developing new technological capabilities in-house
can prove to be very costly both financially and time wise, cooperation in R&D with external
partners offers an alternative especially to those companies that could otherwise not afford it
(Hagedoorn 2002). Early and extensive involvement of suppliers in product design can reduce
the complexity of the design project, resulting in faster and more productive R&D process
(Gupta and Wileman 1990). Customer involvement also importantly improves the
effectiveness of the product concept (Zirger and Maidique 1990). Cost efficiency of R&D
(RD_COST_EFF) contributes the least out of complementary competencies. Although
integration of technological and marketing knowledge can positively influence the efficiency
of the development processes, it is also possible that due to the complexity arising from
coordination the processes become lengthier and more costly.
The model of incremental innovation importantly differentiates itself from the baseline
model by variable TECH_MRKT_KN being of primary importance. This finding very much
represents what incremental innovations are about, namely addressing different market needs
by producing a variety of products within the same product family. Since incremental
innovations are less technologically demanding and costly, it is also expected that
RD_COST_EFF has gained some importance relative to other indicators.

IMM Manuscript 08-455
16
RD_STP is the indicator with the highest weight among complementary competencies
for the third model – model of new generation products. With the growing knowledge base a
firm has to be proficient at in order to develop the most advanced products, strategic
partnerships appear to importantly facilitate the R&D activities. Access to technological
capabilities may especially prove to be a problem in a small economy, the likes of Slovenia.
The companies are relatively small compared to their international counterparts and have
smaller funds available to finance their R&D. Strategic partnerships are a way to gain access
to additional capabilities by much smaller investments. The result is in line with the finding
by Tidd and Bodley (2002) who confirmed for the case of customer and user partnerships to
be more effective for high novelty projects than for low novelty ones.
It is interesting to note that variable ACT_STRAT is the main driver of
complementary competencies for the trend setting model. It implies that clear strategic
orientation is key when pursuing this position in the industry. The next most important
variable in this model is TECH_MRKT_KN, stressing the importance of the integration of
both technological and marketing capabilities. Understanding the market nevertheless appears
to be key. The small relative weight is assigned to RD_COST_EFF. The strategy of being an
industry leader proves to be incompatible with building a competency based on cost
efficiency in R&D.
Extension of the baseline model for business performance
To analyze how innovative performance contributes to business performance of a firm,
we test the whole operational model as presented in Figure 1, by including the general
construct of innovative performance from the baseline morel, measured by NO_CH_PROD
and PROD_QUAL. The proposed model was assessed for the weighted sample of 50 firms,
since business performance measure were collected for firms as a whole. Weighted were
IMM Manuscript 08-455
17
responses regarding competencies in innovative performance measures of those firms that
reported multiple product lines. Weights assigned corresponded to the share of a specific
product line in total sales.
The validity of the model was checked in the same way as already described. Internal
consistency reliability was confirmed. Values of composite reliability for all constructs
exceed the threshold of 0,70, the minimum value being 0,7912 (see Table 4).
Table 4
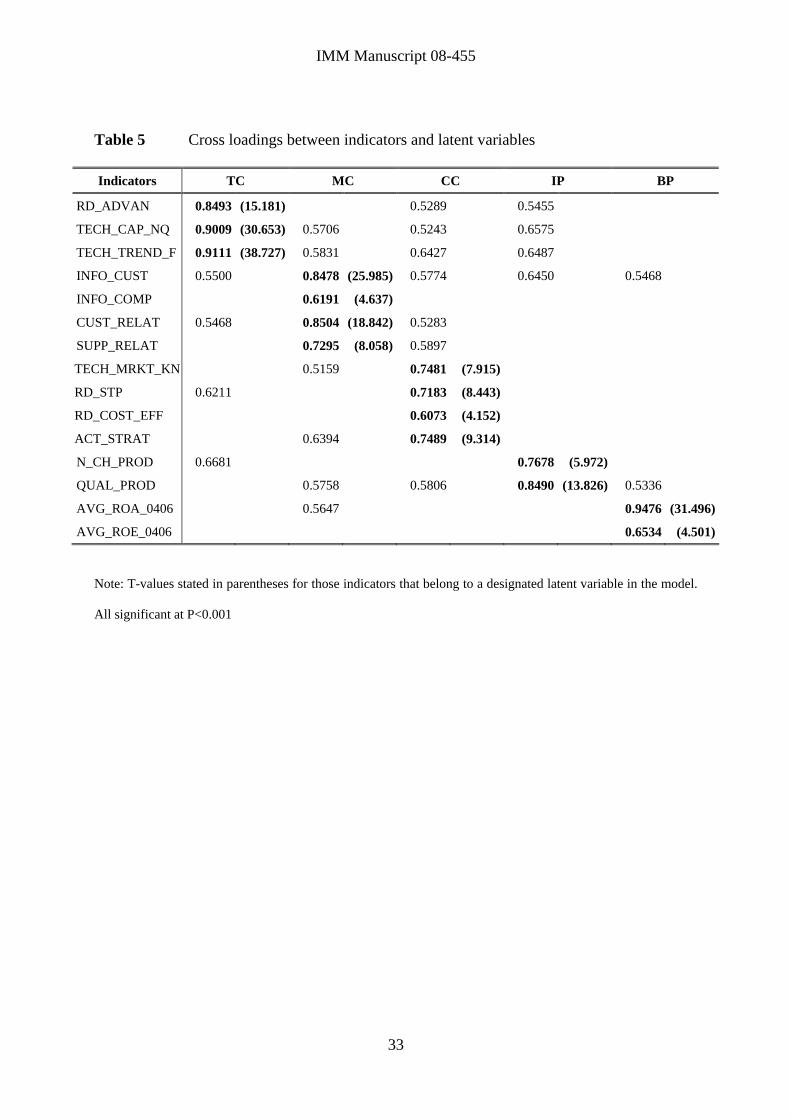
In Table 5 are shown only cross loadings with values larger than the mean of the
absolute values which is 0,5113. The minimum value of cross loadings for proposed
indicators in the observed model is 0,6073, above the 0,60 threshold. All latent variables are
again well correlated with their own indicators. AVE for each construct is higher than 0,50
(Table 4). Square root of AVE for each construct is stated in the diagonal in Table 4. They are
all higher than the correlation coefficients below them. This confirms discriminant validity.
Standard errors were computed on the basis of 500 bootstrapping runs and 50 cases.
Table 5
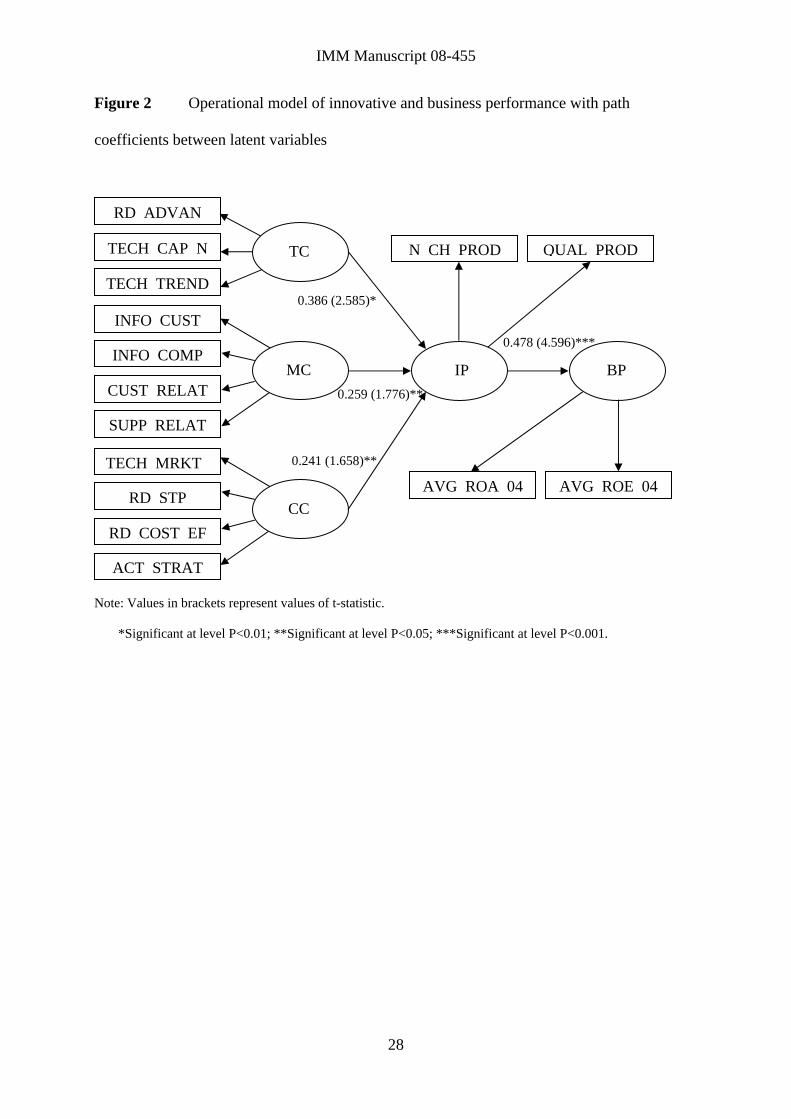
As seen in Figure 2, technological competencies have the largest influence on the
innovative performance ( 386,0=β , significant at P<0,01), followed by marketing and
complementary competencies (values of correlations 259,0=β and 241,0=β respectively;
both significant at P<0,05). The path coefficients are aligned with the findings of the partial
general model of innovative performance already explained (Table 2). The model also
confirms the influence of innovative performance on business performance with the path

IMM Manuscript 08-455
18
coefficient being 0,478 (significant at P<0,001). Value of R2 for innovative performance is
60,0% and 23,0% for business performance.
Figure 2
5 Discussion
In our research we confirm a positive impact of technological, marketing and
complementary competencies on innovative performance as well a positive correlation
between innovative and business performance. These results clearly imply that firms with
better developed competencies create for themselves competitive advantage in their respective
industries.
We further set to establish what competencies firms develop and employ when
pursuing different innovation strategies. Our findings suggest that companies trying to
improve their innovative performance should foremost focus on technological competencies.
Availability of various quality technological capabilities was recognized as the most decisive
dimension contributing to the new product variety. However, marketing and complementary
competencies should by no means be overlooked. From the viewpoint of the marketing
competencies the most of the attention should be given to customer related competencies that
guide the new product development process towards best addressing customer needs. Among
complementary competencies, companies should especially make sure they have a clear
strategic direction. Strategic technological partnerships are another key factor that facilitates
firms in expanding access to different technological capabilities. It is also worth noting that a
clear and well defined strategy can help firms recognize their core competencies to make a
well informed strategic management decision in outsourcing non-core competencies (Hafeez,
Malak and Zhang 2007).

IMM Manuscript 08-455
19
Studies on the state of R&D in Slovenian firms show that the economy falls into the
category of a technology follower country (Stanovnik and Kos 2005; and Prašnikar 2006). For
technology follower countries technological competencies may be costly and time consuming
to acquire. Yet marketing and complementary competencies can successfully facilitate the
process of catching up via incremental innovation. Firms can thus choose imitation as a
strategy for developing technological capabilities and bridging the gap to a certain extent.
Furthermore, novel technologies require advanced R&D. Entering strategic technological
partnerships proves to be almost an imperative in achieving this by enabling access to
additional technological and marketing capabilities. Moreover, firms directing trends in their
industries and acting as market leaders build their competitive advantage foremost on
complementary competencies, followed by technological competencies. Market leaders
complement and support their technological competencies by a solid strategy, by integrating
both technological and marketing knowledge, and by expanding their access to capabilities
through strategic technological partnerships.

IMM Manuscript 08-455
20
References and Notes
Ali, A., Kalwani, M.U. and Kovenock, D. (1993) ‘Selecting product development projects:
Pioneering versus incremental innovation strategies’, Management Science, Vol. 39,
No. 3, pp. 255-274.
Anderson, J.C. and Gerbing, D.W. (1988) ‘Structural equation modeling in practice; A review
and recommended two-step approach’, Psychological Bulletin, Vol. 103, No. 3, pp. 411-
423.
Andrews, D.W.K. and Buchinsky, M. (2000) ‘Three-step method for choosing the number of
bootstrap repetitions’, Econometrica, Vol. 68, No. 1, pp. 23-51.
Bacon, G., Beckman, S., Mowery, D. and Wilson, E. (1994) ‘Managing product definition in
high-technology industries’, California Management Review, Vol. 36, No. 3, pp. 32-56.
Blundell, R., Griffith, R. and Van Reenen, J. (1999) ‘Market share, market value and
innovation in a panel of British manufacturing firms’, Review of Economic Studies,
Vol. 66, pp. 529-554.
Brown, S.L. and Eisenhardt, K.M. (1995) ‘Product development: Past research, present
findings, and future directions’, Academy of Management Review, Vo.> 20, No. 2, pp.
343-378.
Chang, T. (1996) ‘Cultivating global experience curve advantage on technology and
marketing capabilities’, International Marketing Review, Vol. 13, pp. 22-42.
Chin, W. W., Marcolin, B. L. and Newsted, P. R. (1996) ‘A partial least squares latent
variable modeling approach for measuring interaction effects: Results from a Monte
Carlo simulation study and voice mail emotion/adoption study’, in DeGross, J.I.,
Jarvenpaa, S. and Srinivasan, A. (Eds.) Proceedings of the Seventeenth International
Conference on Information Systems, pp. 21-41.

IMM Manuscript 08-455
21
Clark, K.B. and Fujimoto, T. (1991) ‘Product development performance’, Harvard Business
School Press: Boston.
Day, G.S. (1994) ‘The capabilities of market-driven organizations’, Journal of Marketing,
Vol. 58, pp. 37-52.
Dumaine, B. (1989) ‘How managers can succeed through speed’, Fortune, Iss. 13, pp. 54-59.
Dutta, S., Narasimhan, O. and Rajiv, S. (1999) ‘Success in high-technology markets: Is
marketing capability critical?’, Marketing Science, Vol. 18, pp. 547-568.
Eisenhardt, K.M. and Martin, J.A. (2000) ‘Dynamic capabilities: What are they?’ Strategic
Management Journal, Vol. 21, pp. 1105-1121.
Fisher, R.J. and Maltz, E. (1997) ‘Enhancing communication between marketing and
engineering: The moderating role of relative’, Journal of Marketing, Vol. 61, No. 3, pp.
54-70.
Fornell, C. and Bookstein, F. L. (1982) ‘Two structural equation models: LISREL and PLS
applied to consumer exit-voice theory’, Journal of Marketing Research, Vol. 19, No. 4,
pp. 440-452.
Fornell, C. and Cha, J. (1994) ‘Partial least squares’, in Bagozzi, R.P. (Ed.) Advanced
Methods of Marketing Research, Blackwell: Cambridge.
Grant, R.M. (1991) ‘The resource-based theory of competitive advantage: Implications for
strategy’, California Management Review, Vol. 22, pp. 114-135.
Gupta, A.K. and Wileman, D.L. (1990) ‘Accelerating the development of technology-based
new products’, California Management Review, Vol. 32, No. 2, pp. 24-44.
Hafeez, K., Malak N. and Zhang, Y.B. (2007) ‘Outsourcing non-core assets and
competences of a firm using analytic hierarchy process’, Computers & Operations
Research, Vol. 34, pp. 3592-3608.

IMM Manuscript 08-455
22
Hafeez, K., Zhang, Y.B. and Malak N. (2002) ‘Core competence for sustainable
competitive advantage: A structured methodology for identifying core competence’, IEEE
Transaction on Engineering Management, Vol. 49, No. 1, pp. 28-35.
Hagedoorn, J. (2002) ‘Inter-firm R&D partnerships: An overview of major trends and patterns
since 1960’, research Policy, Vol. 31, pp. 477-492.
Hagedoorn, J.and Cloodt, M. (2007) ‘Measuring innovative performance: is there an
advantage in using multiple indicators?’, Research Policy, Vol. 32, pp. 1365-1379.
Hall, B.H. (1999) Innovation and market value. NBER Working Paper Series, [URL:
http://www.nber.org/papers/W6984.pdf].
Hall, R.W., Johnson, H.T. and Turney, P.B.B. (1991) ‘Measuring up: Charting pathways to
manufacturing excellence’, Business One Irwin: Homewood.
Hamel, G. and Heene, A. (eds) (1994) ‘Competence-based competition, John Wiley:
Chichester.
Hatcher, L. (1994) ‘A step-by-step approach to using the SAS system for factor analysis and
structural equation modeling’, SAS Institute: Cary.
Hult, G.T.M., Hurley, R.F. and Knight, G.A. (2004) ‘Innovativeness: Its antecedents and
impact on business performance’, Industrial Marketing Management, Vol. 33, pp. 429-
438.
Jeong, I., Pae, J.H. and Zhou, D. (2006) ‘Antecedents and consequences of the strategic
orientations in new product development: The case of Chinese manufacturers’,
Industrial Marketing Management, Vol. 35, pp. 348-358.
Kim, J.Y., Wong, V. and Eng, T.Y. (2005) ‘Product variety strategy for improving new
product development proficiencies’, Technovation, Vol. 25, pp. 1001-1015.

IMM Manuscript 08-455
23
Koufteros, X. and Marcoulides, G.A. (2006) ‘Product development practices and
performance: A structural equation modeling-based multi-group analysis’, International
Journal of Production Economics, Vol. 103, pp. 286-307.
Kuhurana, A. and Rosenthal, S.R. (1997) ‘Integrating the fuzzy end of new product
development’, MIT Sloan Management Review, Vol. 38, No. 2, pp. 103-120.
Mairesse, J. and Sassenou, M. (1991) ‘R&D productivity: A survey of econometric studies at
the firm level’, NBER Working Paper Series, [URL:
http://www.nber.org/papers/w3666.pdf].
Mansfield, E. and Wagner, S. (1975) ‘Organizational and strategic factors associated with
probabilities of success in industrial R&D’, The Journal of Business, Vol. 48, pp. 179-
198.
McEvily, S.K., Eisenhardt, K.M. and Prescott, J.E. (2004) ‘The global acquisition, leverage,
and protection of technological competencies’, Strategic Management Journal, Vol. 25,
No. 8-9, pp. 713-722.
Nagaoka, S. (2006) ‘R&D and market value of Japanese firms in the 1990s’, Journal of the
Japanese and International Economies, Vol. 20, pp. 155-176.
OECD (1997) ‘Revision of high technology sector and product’, OECD: Paris.
Paul, J.V. and Peter, J.W. (1994) ‘Core competencies, competitive advantage and market
analysis: Forging the links’, in Hamel, G. and Heene, A. (Eds.) Competencies-Based
Competition, Wiley: New York.
Prahalad, C.K. and Hamel, G. (1990) ‘The core competence of the corporation’, Harvard
Business Review, Vol. 86, No. 3, pp. 79-91.
Prašnikar, J. (2006) ‘From Lisbon to "Lisbon"’, in Prašnikar J. (Ed.) Competitiveness, social
responsibility and economic growth, Nova Science: NY.

IMM Manuscript 08-455
24
Prašnikar, J., Lisjak, M., Rejc Buhovac, A., Štembergar, M. (2008) ‘Indentifying and
explointing the inter relationships between technological and marketing capabilities’,
Long Range Planning, Article in Press.
Ringle, C.M., Wende, S. and Will, A. (2005) ‘SmartPLS 2.0 (beta)’, Hamburg:
[http://www.smartpls.de].
Rothaermel, F.T. (2001) ‘Incumbent’s advantage through exploiting complementary assets
via interfirm cooperation’, Strategic Management Journal, Vol. 22, pp. 687-699.
Sanchez, R. (2004) ‘Understanding competence-based management Identifying and
managing five modes of competence’, Journal of Business research, Vol. 57, pp. 518-532.
Sanchez, R., Heene, A. and Thomas, H. (1996) ‘Towards the theory and practice of
competence-based cometition’, in Sanchez, R., Heene, A. and Thomas, H. (Eds.)
Dynamics of competence-based competition: theory and practice in the new strategic
management, London: Elsevier.
Schewe, G. (1996) ‘Imitation as a strategic option for external acquisition of technology’,
Journal of Engineering and Technology Management, Vol. 13, pp. 55-82.
Song, M., Droge, C., Hanvanich, S. and Calantone, R. (2005) ‘Marketing and technology
resource complementarity: an analysis of their interaction effect in two environmental
contexts’, Strategic Management Journal, Vol. 26, pp. 259-276.
Song, X.M., Thieme, R.J., and Xie, J. (1998) ‘The impact of cross-functional integration
across product development stages: An exploratory study’, Journal of Product
Innovation Management, Vo. 15, No. 4, pp. 289-303.
Stanovnik, P. and Kos, M. (2005) ‘Technology foresight in Slovenia’, Institute for Economic
Research: Ljubljana.

IMM Manuscript 08-455
25
Swink, M. and Song, M. (2007) ‘Effects of marketing-manufacturing integration on new
product development time and competitive advantage’, Journal of Operations
Management, Vol. 25, pp. 203-217.
Teece, D.J., Pisano, G. and Shuen, A. (1997) ‘Dynamic capabilities and strategic
management’, Strategic Management Journal, Vol. 18, pp. 509-533.
Tenenhaus, M., Esposito Vinzi V., Chatelin Y.M. and Lauro C. (2005) ‘PLS path modeling’,
Computational Statistics and Data Analysis, Vol. 48, pp. 159–205.
Tidd, J. and Bodley, K. (2002) ‘The influence of project novelty on the new product
development process’, R&D Management, Vol. 32, No. 2, pp. 127-138.
Varadarajan, R. (2008) ‘Fortune at the bottom of the innovation pyramid: the strategic logic
of incremental innovations’, Business Horizons, Article in Press.
Vorhies, D.W. (1998) ‘An investigation of the factors leading to the development of
marketing capabilities and organizational effectiveness’, Journal of Strategic Marketing,
Vol. 6, No. 1, pp. 3-23.
Vorhies, D.W. and Harker, M. (2000) ‘The capabilities and performance advantages of
market-driven firms: An empirical investigation’, Australian Journal of Marketing, Vol.
25, No. 2 pp. 145-173.
Wakelin, K. (2001) ‘Productivity growth and R&D expenditure in UK manufacturing firms’,
Research Policy, Vol. 30, pp. 1079-1090.
Wang, Y., Lo, H.P. and Yang, Y. (2004) ‘The constituents of core competencies and firm
performance: Evidence from high-technology firms in China, Journal of Engineering
and Technology Management, Vol. 21, pp. 249-280.
White, G.I., Sondhi, A.C. and Fried, D. (2003) ‘The analysis and use of financial statements’,
John Wiley & Sons, Inc.: Hoboken.

IMM Manuscript 08-455
26
Zahra, S.A. and Ellor, D. (1993) ‘Accelerating new product development and successful
market introduction’, SAM Academy of Management Journal, Vol. 58, No. 1, pp. 9-15.
Zirger, B.J. and Maidique, M. (1990) ‘A model of new product development: An empirical
test’, Management Science, Vol. 36, pp. 867-883.

IMM Manuscript 08-455
27
Tables and Figures
Figure 1 Operational model on the influence of technological, marketing and
complementary competencies on innovative performance and business
performance
Technological competencies
Marketing competencies
Complementary competencies
Innovative performance
Business performance
IMM Manuscript 08-455
28
Figure 2 Operational model of innovative and business performance with path
coefficients between latent variables
Note: Values in brackets represent values of t-statistic.
*Significant at level P<0.01; **Significant at level P<0.05; ***Significant at level P<0.001.
BP
N CH PROD QUAL PROD
AVG ROA 04 AVG ROE 04
IP
TC
RD ADVAN
TECH CAP N
TECH TREND
INFO CUST
INFO COMP
CUST RELAT
TECH MRKT
RD STP
RD COST EF
SUPP RELAT
ACT STRAT
MC
CC
0.386 (2.585)*
0.259 (1.776)**
0.241 (1.658)**
0.478 (4.596)***

IMM Manuscript 08-455
29
Table 1 Latent variables and their indicators
Indicator Indicator label Mean St. Dev. Latent variable
Advancement of R&D RD_ADVAN 3.22 0.932
Number of quality technological capabilities inside the firm or through strategic partnerships TECH_CAP_NQ 3.32 0.935
Prediction of technological trends TECH_TREND_F 3.18 0.896
Technological competencies
(TC)
Obtaining information about changes of customer preferences and needs INFO_CUST 3.74 0.828
Acquisition of real time information about competitors INFO_COMP 3.20 0.670
Establishing and managing long-term customer relations CUST_RELAT 3.40 0.857
Establishing and managing long-term relations with suppliers SUPP_RELAT 3.36 0.722
Marketing competencies
(MC)
Good transfer of technological and marketing knowledge among business units TECH_MRKT_KN 3.20 0.756
The intensity, quality and extent of research and development knowledge transfer in co-operation with strategic partners
RD_STP 2.98 1.059
Cost efficiency of product development RD_COST_EFF 3.24 0.797
Clearly defined activities of business units in the corporate strategy of our firm ACT_STRAT 3.28 0.809
Complementary competencies
(CC)
Number of modified, improved and completely new products in period 2004-2006 N_CH_PROD 3.36 0.921
Time needed to develop an improved product TIME_IMPR 3.30 0.839
Time needed to develop a new generation product TIME_NEW 3.00 1.069
Contribution of the firm to industry trends TRENDS 2.82 1.063
Quality of products QUAL_PROD 3.70 0.707
Innovative performance
(IP)
IMM Manuscript 08-455
30
Table 2 Comparison of path coefficients of the constructs for the three models
Baseline model Incremental innovation model
Radical innovation model
Model assuming for trend-setting
Path N_CH_PROD TIME_IMPR TIME_NEW TRENDS
TC IP 0.409 (4.075) * 0.341 (2.843) ** 0.363 (2.787) ** 0.307 (2.537) **
MC IP 0.250 (2.346) ** 0.211 (1.537) **** 0.137 (1.192) 0.115 (0.813)
CC IP 0.235 (2.280) *** 0.301 (2.423) ** 0.352 (2.769) ** 0.381 (2.582) **
2R 0.63 0.57 0.58 0.52
T-values are stated in parentheses.
* / ** / *** / **** P<0.001, P<0.01, P<0.05 and P<0.1, respectively.

IMM Manuscript 08-455
31
Table 3 Weights of manifest variables for the four models
Baseline model Incremental innovation model
Radical innovation model
Model assuming for trend-setting
Indicator N_CH_PROD TIME_IMPR TIME_NEW TRENDS
RD_ADVAN 0.3257 0.3371 0.3551 0.3237
TECH_CAP_NQ 0.4074 0.4234 0.3984 0.4181
TECH_TREND_F 0.3874 0.3608 0.3688 0.3786
INFO_CUST 0.4289 0.4007 0.4020 0.4012
INFO_COMP 0.2203 0.2752 0.2960 0.2662
CUST_RELAT 0.3490 0.3368 0.3262 0.3396
SUPP_RELAT 0.2897 0.2893 0.2808 0.2936
TECH_MRKT_KN 0.3390 0.3507 0.3306 0.3334
RD_STP 0.3524 0.3405 0.3772 0.3284
RD_COST_EFF 0.2852 0.3067 0.2962 0.2728
ACT_STRAT 0.3571 0.3391 0.3323 0.3948

IMM Manuscript 08-455
32
Table 4 Composite reliability, correlation matrix and the square roots of AVE
Composite reliability TC MC CC IP BP
TC 0.9175 0.8875
MC 0.8497 0.6138 0.7677
CC 0.7998 0.6377 0.6776 0.7080
IP 0.7912 0.6988 0.6595 0.6628 0.8094
BP 0.7916 0.2628 0.5506 0.4025 0.4784 0.8139
Note: The square roots of AVE are in the diagonal in italics. Below the diagonal are correlation coefficients.
IMM Manuscript 08-455
33
Table 5 Cross loadings between indicators and latent variables
Indicators TC MC CC IP BP
RD_ADVAN 0.8493 (15.181) 0.5289 0.5455
TECH_CAP_NQ 0.9009 (30.653) 0.5706 0.5243 0.6575
TECH_TREND_F 0.9111 (38.727) 0.5831 0.6427 0.6487
INFO_CUST 0.5500 0.8478 (25.985) 0.5774 0.6450 0.5468
INFO_COMP 0.6191 (4.637)
CUST_RELAT 0.5468 0.8504 (18.842) 0.5283
SUPP_RELAT 0.7295 (8.058) 0.5897
TECH_MRKT_KN 0.5159 0.7481 (7.915)
RD_STP 0.6211 0.7183 (8.443)
RD_COST_EFF 0.6073 (4.152)
ACT_STRAT 0.6394 0.7489 (9.314)
N_CH_PROD 0.6681 0.7678 (5.972)
QUAL_PROD 0.5758 0.5806 0.8490 (13.826) 0.5336
AVG_ROA_0406 0.5647 0.9476 (31.496)
AVG_ROE_0406 0.6534 (4.501)
Note: T-values stated in parentheses for those indicators that belong to a designated latent variable in the model.
All significant at P<0.001
Top Related