


Languages
Pages
Legal


NHS Breast Screening Programme Equipment Report
Technical evaluation of IMS Giotto Class digital breast tomosynthesis system
October 2018
Availa
ble fro
m the N
ation
al Co-o
rdina
ting C
entre
for th
e Phy
sics o
f Mam
mograp
hy (N
CCPM)

Technical evaluation of IMS Giotto Class digital breast tomosynthesis system
2
About Public Health England
Public Health England exists to protect and improve the nation’s health and wellbeing,
and reduce health inequalities. We do this through world-leading science, knowledge and
intelligence, advocacy, partnerships and the delivery of specialist public health services.
We are an executive agency of the Department of Health and Social Care, and a distinct
delivery organisation with operational autonomy. We provide government, local government,
the NHS, Parliament, industry and the public with evidence-based professional, scientific
and delivery expertise and support.
Public Health England, Wellington House, 133-155 Waterloo Road, London SE1 8UG
Tel: 020 7654 8000 www.gov.uk/phe
Twitter: @PHE_uk Facebook: www.facebook.com/PublicHealthEngland
About PHE Screening
Screening identifies apparently healthy people who may be at increased risk of a disease
or condition, enabling earlier treatment or better informed decisions. National population
screening programmes are implemented in the NHS on the advice of the UK National
Screening Committee (UK NSC), which makes independent, evidence-based
recommendations to ministers in the four UK countries. The Screening Quality Assurance
Service ensures programmes are safe and effective by checking that national standards
are met. PHE leads the NHS Screening Programmes and hosts the UK NSC secretariat.
www.gov.uk/topic/population-screening-programmes
Twitter: @PHE_Screening Blog: phescreening.blog.gov.uk
Prepared by: KC Young, JM Oduko and LM Warren
For queries relating to this document, please contact: [email protected]
© Crown copyright 2018
You may re-use this information (excluding logos) free of charge in any format or medium,
under the terms of the Open Government Licence v3.0. To view this licence, visit OGL. Where
we have identified any third party copyright information you will need to obtain permission from
the copyright holders concerned.
Published October 2018
PHE publications PHE supports the UN
gateway number: 2018566 Sustainable Development Goals
Availa
ble fro
m the N
ation
al Co-o
rdina
ting C
entre
for th
e Phy
sics o
f Mam
mograp
hy (N
CCPM)

Technical evaluation of IMS Giotto Class digital breast tomosynthesis system
3
Contents
About Public Health England 2
Contents 3
Executive summary 4
1. Introduction 5
2. Methods 6
3. Results 13
4. Discussion 22
5. Conclusions 24
References 25
Availa
ble fro
m the N
ation
al Co-o
rdina
ting C
entre
for th
e Phy
sics o
f Mam
mograp
hy (N
CCPM)

Technical evaluation of IMS Giotto Class digital breast tomosynthesis system
4
Executive summary
The technical performance of the IMS Giotto Class digital breast tomosynthesis system was
tested in tomosynthesis mode. The evaluation of the performance in the 2D imaging mode will
be published as a separate report.
The mean glandular dose (MGD) to the standard breast in tomosynthesis mode was found to
be 1.58mGy, which is below the dose limiting value of 2.5mGy in the European Reference
Organisation for Quality Assured Breast Screening and Diagnostic Services (EUREF) protocol.
Technical performance of this equipment was found to be satisfactory, so that the system
could proceed to practical evaluation in a screening centre. This report provides baseline
measurements of the equipment performance, including:
radiation dose
contrast detail detection
contrast-to-noise ratio (CNR)
reconstruction artefacts
z-resolution
detector response
local dense area response
Availa
ble fro
m the N
ation
al Co-o
rdina
ting C
entre
for th
e Phy
sics o
f Mam
mograp
hy (N
CCPM)
Technical evaluation of IMS Giotto Class digital breast tomosynthesis system
5
1. Introduction
Testing procedures and performance standards for digital mammography
This report is one of a series1,2,3,4 evaluating commercially available mammography systems on
behalf of the NHS Breast Screening Programme (NHSBSP). The testing methods and
standards applied are those of the relevant NHSBSP protocols, which are published as
NHSBSP Equipment Reports. Report 14075 describes the testing of digital breast
tomosynthesis systems.
The NHSBSP protocol is similar to the EUREF protocol,6 but the latter also provides additional
or more detailed tests and standards, some of which are included in this evaluation.
Objectives
The aim of the evaluation was to measure the technical performance of the Giotto Class
system in tomosynthesis mode.
Availa
ble fro
m the N
ation
al Co-o
rdina
ting C
entre
for th
e Phy
sics o
f Mam
mograp
hy (N
CCPM)
Technical evaluation of IMS Giotto Class digital breast tomosynthesis system
6
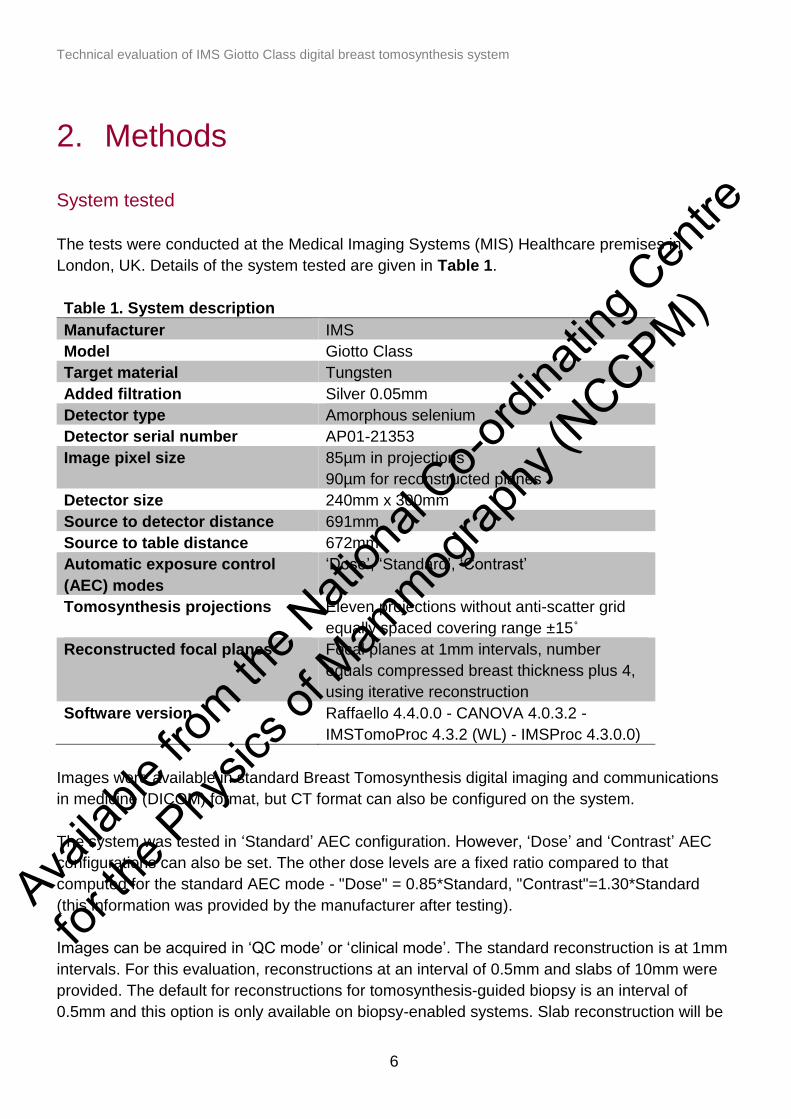
2. Methods
System tested
The tests were conducted at the Medical Imaging Systems (MIS) Healthcare premises in
London, UK. Details of the system tested are given in Table 1.
Table 1. System description
Manufacturer IMS
Model Giotto Class
Target material Tungsten
Added filtration Silver 0.05mm
Detector type Amorphous selenium
Detector serial number AP01-21353
Image pixel size 85µm in projections
90µm for reconstructed planes
Detector size 240mm x 300mm
Source to detector distance 691mm
Source to table distance 672mm
Automatic exposure control
(AEC) modes
‘Dose’, ‘Standard’, ‘Contrast’
Tomosynthesis projections Eleven projections without anti-scatter grid
equally spaced covering range ±15˚
Reconstructed focal planes Focal planes at 1mm intervals, number
equals compressed breast thickness plus 4,
using iterative reconstruction
Software version Raffaello 4.4.0.0 - CANOVA 4.0.3.2 -
IMSTomoProc 4.3.2 (WL) - IMSProc 4.3.0.0)
Images were available in standard Breast Tomosynthesis digital imaging and communications
in medicine (DICOM) format, but CT format can also be configured on the system.
The system was tested in ‘Standard’ AEC configuration. However, ‘Dose’ and ‘Contrast’ AEC
configurations can also be set. The other dose levels are a fixed ratio compared to that
computed for the standard AEC mode - "Dose" = 0.85*Standard, "Contrast"=1.30*Standard
(this information was provided by the manufacturer after testing).
Images can be acquired in ‘QC mode’ or ‘clinical mode’. The standard reconstruction is at 1mm
intervals. For this evaluation, reconstructions at an interval of 0.5mm and slabs of 10mm were
provided. The default for reconstructions for tomosynthesis-guided biopsy is an interval of
0.5mm and this option is only available on biopsy-enabled systems. Slab reconstruction will be
Availa
ble fro
m the N
ation
al Co-o
rdina
ting C
entre
for th
e Phy
sics o
f Mam
mograp
hy (N
CCPM)
Technical evaluation of IMS Giotto Class digital breast tomosynthesis system
7
available on clinical units, and the slab thickness can be customised between 2mm and 10mm
according to customer needs.
There is a facility available to carry out a combination exposure, in which 2D and tomosynthesis
exposures are performed within a single compression.
Approximate files sizes given in Table 2 were taken from the CDMAM images in QC mode, with
a compressed breast thickness of 46mm. Note that the file size will vary depending on breast
thickness and field size.
Table 2. Image file sizes for 46mm compressed breast thickness
Image Type Plane interval Approximate file size
Projections N/A 216MB (total for 11
projections)
Reconstructed planes 1mm spacing 638MB
Reconstructed planes 0.5mm spacing 1300MB
Reconstructed planes 10mm spacing 129MB
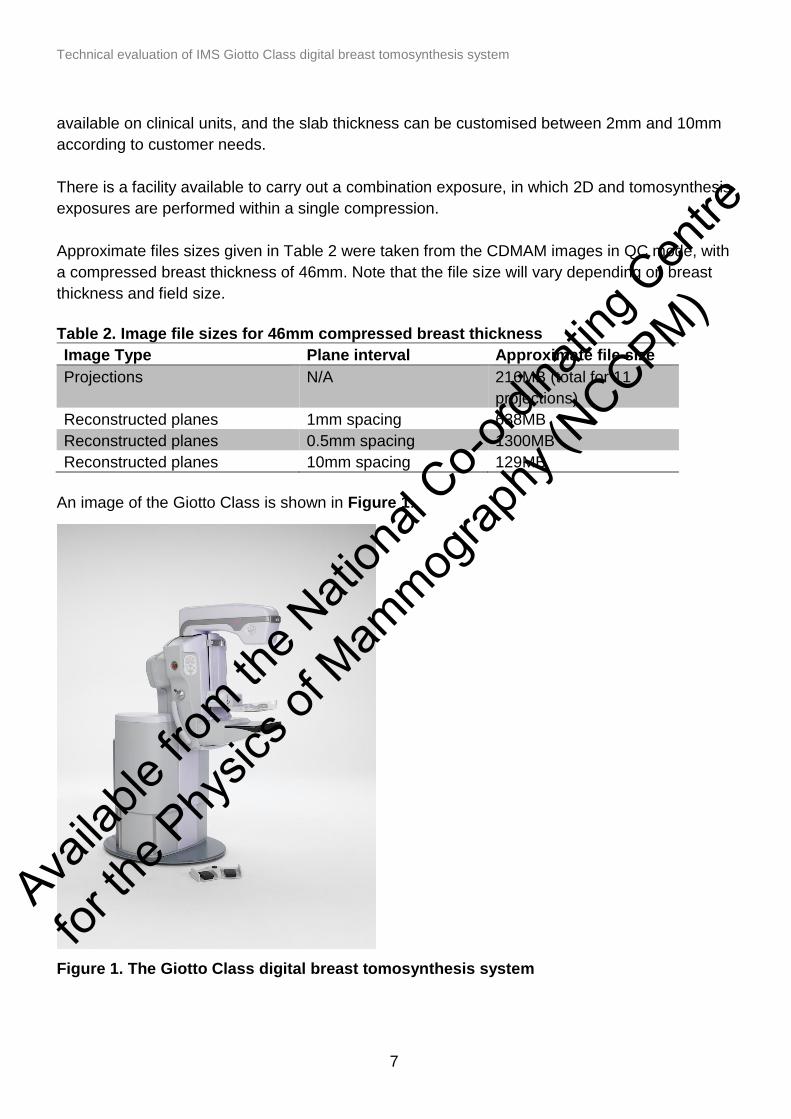
An image of the Giotto Class is shown in Figure 1.
Figure 1. The Giotto Class digital breast tomosynthesis system
Availa
ble fro
m the N
ation
al Co-o
rdina
ting C
entre
for th
e Phy
sics o
f Mam
mograp
hy (N
CCPM)
Technical evaluation of IMS Giotto Class digital breast tomosynthesis system
8
Dose and contrast-to-noise ratio under AEC
Dose measurement
To calculate the MGD to the standard breast, measurements were made of half-value layer
(HVL) and tube output, across the clinically relevant range of kV and filter combinations. The
output measurements were made on the midline at the standard position of 40mm from the
chest wall edge (CWE) of the breast support platform. The stationary exposure option was
selected for these measurements.
In tomosynthesis mode, exposures of a range of thicknesses of polymethyl methacrylate
(PMMA) were made using AEC. For each measurement the height of the paddle was set to
match the indicated thickness to the equivalent breast thickness for that thickness of PMMA.
The method described in the UK protocols5 for measuring MGD requires the incident air kerma
to be measured with the compression paddle well above the ion chamber. Here the method
described by Dance et al7 was used, in which the incident air kerma is measured with the
compression paddle in contact with the ion chamber. Measurements on other systems 1, 2
show that this variation increases the air kerma measurement by 3% to 5%.
The equation used to calculate tomosynthesis MGD is shown in Equation 1
D=KgcsT (1)
Where D is the MGD, K is the air kerma measured at the entrance surface of the breast, g, c
and s are dose correction factors for 2D mammography and T is a correction factor for
tomosynthesis.
Contrast-to-noise ratio
For contrast-to-noise ratio (CNR) measurements a 10mm x 10mm square of 0.2mm thick
aluminium foil was included in the PMMA phantom, positioned 10mm above the table on the
midline, 60mm from the CWE.
CNR was assessed using 5mm x 5mm return on investments (ROIs) positioned in the centre of
the aluminium square and two background positions, to the chest wall and nipple sides of the
square, as shown in Figure 2. The CNR was measured in the focal plane in which the
aluminium square was brought into focus. CNR was also assessed in the unprocessed
tomosynthesis projections acquired for the above images, using a 5mm x 5mm ROI.
Variation of CNR with dose was assessed in the reconstructed focal planes for a simulated
standard breast thickness of 53mm (45mm PMMA). The variation in central projection CNR
with breast thickness and the variation in projection CNR with projection angle for a 53mm
breast were also assessed.
Availa
ble fro
m the N
ation
al Co-o
rdina
ting C
entre
for th
e Phy
sics o
f Mam
mograp
hy (N
CCPM)

Technical evaluation of IMS Giotto Class digital breast tomosynthesis system
9
(a) (b) Figure 2. Location of 5mm x 5mm ROIs for assessment of CNR. The chest wall edge is to the right of each image (a) Central projection (b) Reconstructed plane
Image quality measurements
In the absence of a more suitable test object for assessing tomosynthesis imaging
performance, images of the CDMAM phantom were acquired in tomosynthesis mode. The
CDMAM phantom (version 3.4, serial number 1022) was sandwiched between 2 blocks of
PMMA, each of which was 20 mm thick. The exposure factors used were the same as would be
selected by the AEC for an equivalent breast thickness of 60mm. A set of 16 images was
acquired at the AEC selected dose level, in QC mode. Two further sets of 8 images at double
and half the AEC selected dose level were acquired in QC mode. A further set of 8 images
were acquired at the AEC selected dose level, in clinical mode.
For the AEC selected dose level, in addition to the typical 1mm spacing, reconstructed images
were provided after testing at a spacing of 0.5mm and slabs of thickness 10mm.
The focal plane corresponding to the vertical position of the CDMAM phantom within the image
was extracted from each reconstructed stack of images. The sets of CDMAM images were read
and analysed using 2 software tools: CDCOM version 1.6 (www.euref.org/downloads) and
CDMAM Analysis version 2.1 from the National Coordinating Centre for the Physics of
Mammography (NCCPM), Guildford (https://medphys.royalsurrey.nhs.uk/nccpm/?s=cdmam-
analysis). This was repeated for 2 focal planes immediately above and below the expected
plane of best focus to ensure that the threshold gold thickness quoted corresponded to the best
image quality obtained (in plane in best focus).
2.4 Geometric distortion and reconstruction artefacts
The relationship between reconstructed tomosynthesis focal planes and the physical geometry
of the volume that they represent was assessed. This was done by imaging a geometric test
phantom consisting of a rectangular array of 1mm diameter aluminium balls at 50mm intervals
in the middle of a 5mm thick sheet of PMMA. The phantom was placed with the balls at various
heights (7.5mm, 27.5mm, and 52.5mm) above the breast support table within a 60mm stack of
plain sheets of PMMA. Reconstructed tomosynthesis planes were analysed to find the height of
the focal plane in which each ball was best in focus, the position of the centre of the ball within
Availa
ble fro
m the N
ation
al Co-o
rdina
ting C
entre
for th
e Phy
sics o
f Mam
mograp
hy (N
CCPM)

Technical evaluation of IMS Giotto Class digital breast tomosynthesis system
10
that plane, and the number of adjacent planes in which the ball was also seen. The variation in
appearance of the ball between focal planes was quantified.
This analysis was automated using a software tool developed at NCCPM for this purpose.
(https://medphys.royalsurrey.nhs.uk/nccpm/?s=tomosynthesisqctools). This software is in the
form of a plug-in for use in conjunction with ImageJ (http://rsb.info.nih.gov/ij/).
2.4.1 Height of best focus
For each ball, the height of the focal plane in which it was best in focus was identified. Results
were compared for all balls within each image to judge whether there was any variation,
indicating possible tilt of the test phantom relative to the reconstructed planes or any vertical
distortion of the focal planes within the image.
2.4.2 Positional accuracy within focal plane
The x and y co-ordinates within the image were found for each ball (x and y are perpendicular
and parallel to the CWE, respectively). The mean distances between adjacent balls were
calculated, using the pixel spacing quoted in the DICOM image header. This was compared to
the physical separation of balls within the phantom, to assess the scaling accuracy in the x and
y directions. The maximum deviations from the mean x and y separations were calculated, to
indicate whether there was any discernible distortion of the image within the focal plane.
2.4.3 Appearance of the ball in adjacent focal planes
Changes to the appearance of balls between focal planes were assessed visually and are
described in the results section of this report.
To quantify the extent of reconstruction artefacts in focal planes adjacent to those containing
the image of the balls, the reconstructed image was treated as though it were a true 3-
dimensional volume. The software tool was used to find the z-dimension of a cuboid around
each ball which would enclose all pixels with values exceeding 50% of the maximum pixel
value. The method used was to re-slice the image vertically and create a composite x-z image
using the maximum pixel values from all re-sliced x-z focal planes. A composite z line was then
created using the maximum pixel from each column of the x-z composite plane, and a full width
at half maximum (FWHM) measurement in the z-direction was made by fitting a polynomial
spline. All pixel values were background subtracted using the mean pixel value from around the
ball in the plane of best focus. The composite z-FWHM thus calculated (which depends on the
size of the imaged ball) was used as a measure of the inter-plane resolution, or z-resolution.
Availa
ble fro
m the N
ation
al Co-o
rdina
ting C
entre
for th
e Phy
sics o
f Mam
mograp
hy (N
CCPM)

Technical evaluation of IMS Giotto Class digital breast tomosynthesis system
11
2.5 Alignment
Alignment measurements were carried out for reconstructed tomosynthesis images.
The alignment of the X-ray beam to the focal plane at the surface of the breast support table
was assessed. Self-developing film and graduated markers were positioned at the edges of the
X-ray beam. Because the light beam indicated a large penumbra, the front collimator position
was adjusted several times in an attempt to avoid both overshoot of the X-ray beam, and
under-coverage of the detector. Measurement at the front edge was later repeated after a
modification of the collimator position in the tube head.
The alignment of the imaged volume to the compressed volume was also assessed. Small
high-contrast markers were placed on the breast support table and on the underside of the
compression paddle to assess vertical alignment. The image planes were then inspected to
check whether all markers were brought into focus within the reconstructed tomosynthesis
volume. This was performed with a flat paddle and also with a 2mm spacer at the chest wall
edge to give some tilt.
2.6 Repeatability and image uniformity
The repeatability of the tomosynthesis exposures was tested by acquiring a series of 5 images
of a 45mm thick block of PMMA under AEC. The exposure factors selected by the AEC for
each image were obtained from the DICOM header for each image.
The set of 16 tomosynthesis CDMAM images was used to test the repeatability of the
reconstructed tomosynthesis images. The signal-to-noise ratio (SNR) was calculated just
outside the CDMAM grid, in the same position in the in-focus plane, from each reconstructed
image.
A combination exposure was carried out to test whether the exposure factors matched those for
separate 2D and tomosynthesis exposures.
Tomosynthesis images of 45mm PMMA were assessed for uniformity.
2.7 Detector response
The detector response was measured as described in the NHSBSP protocol, but with a 2mm
thick aluminium filter at the tube head, and beam quality as for a 90mm thick compressed
breast. Images were acquired with zero degrees tomosynthesis acquisition.
Using a 10mm x 10mm ROI positioned on the midline 60mm from the chest wall edge of the
central projection image, measurements were made of the mean pixel value, which was plotted
against air kerma incident at the detector.
Availa
ble fro
m the N
ation
al Co-o
rdina
ting C
entre
for th
e Phy
sics o
f Mam
mograp
hy (N
CCPM)
Technical evaluation of IMS Giotto Class digital breast tomosynthesis system
12
2.8 Timings
Using a stopwatch image timings were measured whilst imaging a 53mm equivalent breast,
simulated using 45mm PMMA, under AEC. Scan times were measured, from when the
exposure button was pressed until the compression paddle was released. Also measured was
the time from decompression until the reconstructed tomosynthesis view was displayed on the
acquisition workstation.
2.9 Local dense area
The local dense area test was carried out as described in the EUREF protocol. 6 A 40mm
thickness of PMMA was placed on the breast support table and the compression paddle was
positioned at a height of 40mm. Additional small pieces of PMMA (20mm x 40mm) were placed
on top of the paddle, on the midline at 50mm from the chest wall edge, to create an additional
thickness of up to 14mm. For each thickness exposure factors were recorded under AEC
control.
In the simulated local dense area, the mean pixel value and standard deviation for a 10mm x
10mm ROI were measured and the signal-to-noise ratios (SNRs) were calculated for the
projection images.
2.10 Test for radiation safety
The AEC back-up timer was tested.
Availa
ble fro
m the N
ation
al Co-o
rdina
ting C
entre
for th
e Phy
sics o
f Mam
mograp
hy (N
CCPM)
Technical evaluation of IMS Giotto Class digital breast tomosynthesis system
13
3. Results
3.1 Dose and contrast to noise ratio using AEC
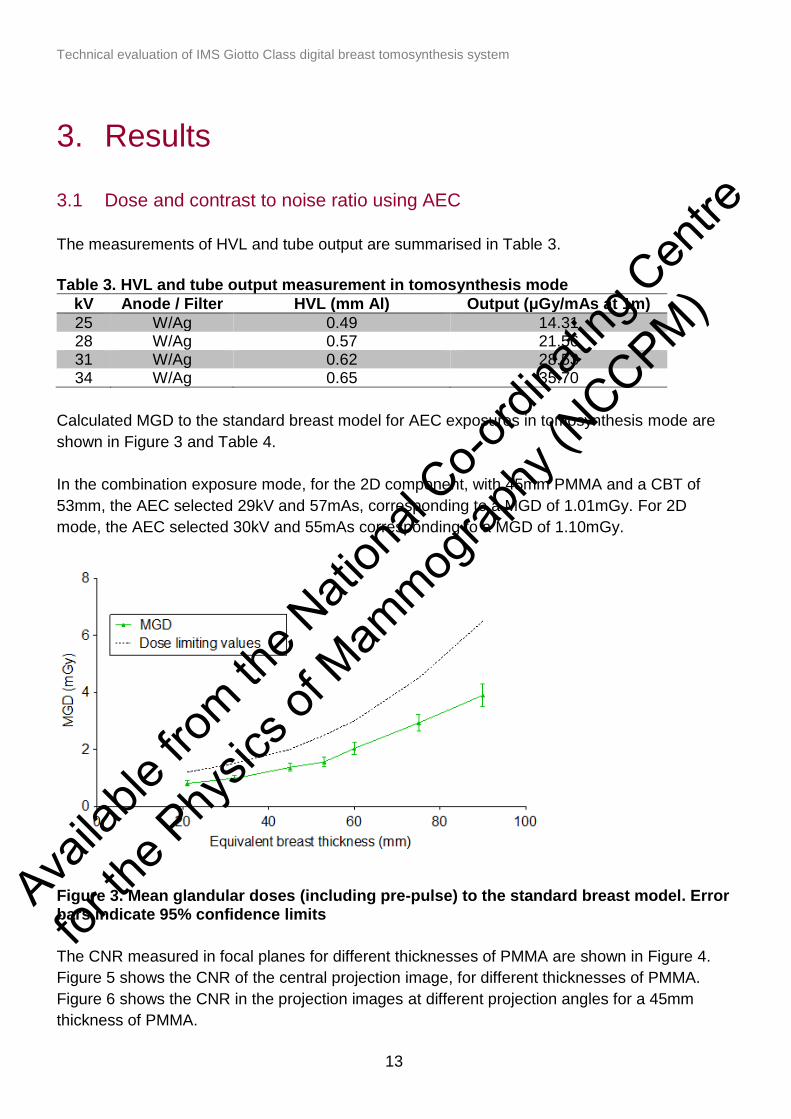
The measurements of HVL and tube output are summarised in Table 3.
Table 3. HVL and tube output measurement in tomosynthesis mode
kV Anode / Filter HVL (mm Al) Output (μGy/mAs at 1m)
25 W/Ag 0.49 14.31 28 W/Ag 0.57 21.56 31 W/Ag 0.62 28.53 34 W/Ag 0.65 35.70
Calculated MGD to the standard breast model for AEC exposures in tomosynthesis mode are
shown in Figure 3 and Table 4.
In the combination exposure mode, for the 2D component, with 45mm PMMA and a CBT of
53mm, the AEC selected 29kV and 57mAs, corresponding to a MGD of 1.01mGy. For 2D
mode, the AEC selected 30kV and 55mAs corresponding to a MGD of 1.10mGy.
Figure 3. Mean glandular doses (including pre-pulse) to the standard breast model. Error bars indicate 95% confidence limits
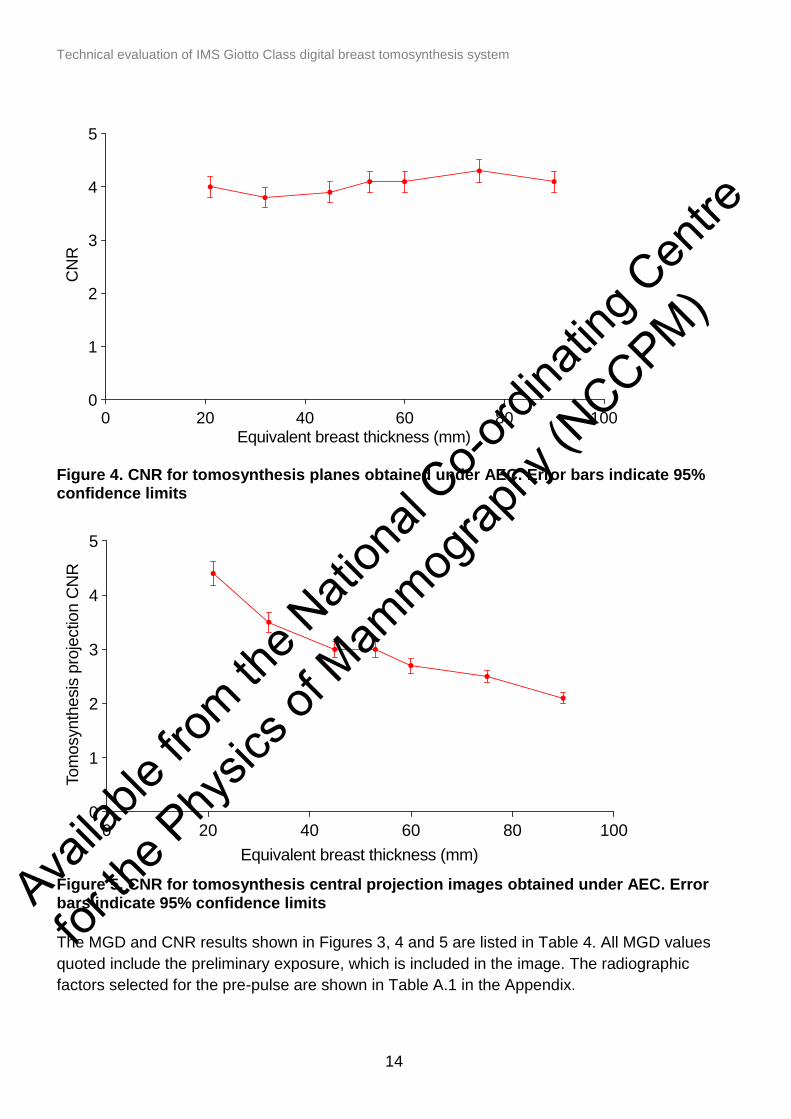
The CNR measured in focal planes for different thicknesses of PMMA are shown in Figure 4.
Figure 5 shows the CNR of the central projection image, for different thicknesses of PMMA.
Figure 6 shows the CNR in the projection images at different projection angles for a 45mm
thickness of PMMA.
Availa
ble fro
m the N
ation
al Co-o
rdina
ting C
entre
for th
e Phy
sics o
f Mam
mograp
hy (N
CCPM)
Technical evaluation of IMS Giotto Class digital breast tomosynthesis system
14
Figure 4. CNR for tomosynthesis planes obtained under AEC. Error bars indicate 95% confidence limits
Figure 5. CNR for tomosynthesis central projection images obtained under AEC. Error bars indicate 95% confidence limits
The MGD and CNR results shown in Figures 3, 4 and 5 are listed in Table 4. All MGD values
quoted include the preliminary exposure, which is included in the image. The radiographic
factors selected for the pre-pulse are shown in Table A.1 in the Appendix.
0 20 40 60 80 1000
1
2
3
4
5
Equivalent breast thickness (mm)
CN
R
0 20 40 60 80 1000
1
2
3
4
5
Equivalent breast thickness (mm)
Tom
osynth
esis
pro
jectio
n C
NR
Availa
ble fro
m the N
ation
al Co-o
rdina
ting C
entre
for th
e Phy
sics o
f Mam
mograp
hy (N
CCPM)
Technical evaluation of IMS Giotto Class digital breast tomosynthesis system
15
Table 4. Dose and CNR for tomosynthesis images under AEC
PMMA thickness
(mm)
Equivalent breast
thickness (mm)
kV Target/ filter
mAs MGD (mGy)
CNR projections
CNR planes
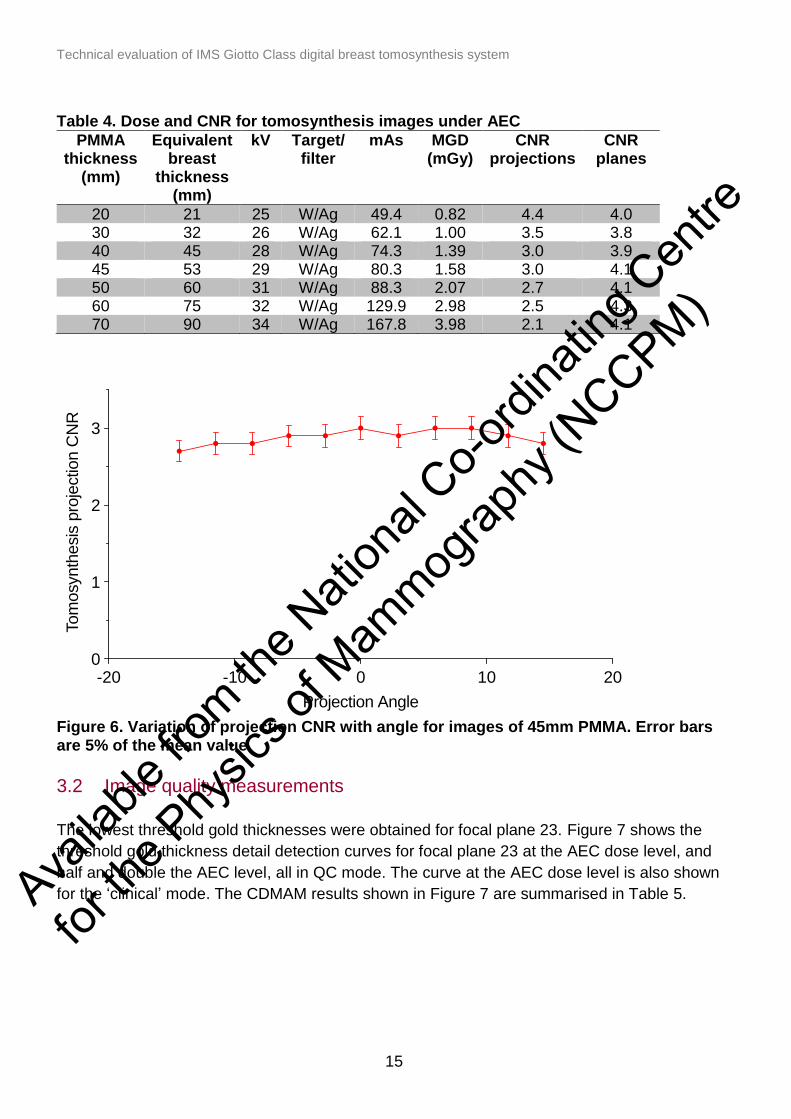
20 21 25 W/Ag 49.4 0.82 4.4 4.0 30 32 26 W/Ag 62.1 1.00 3.5 3.8 40 45 28 W/Ag 74.3 1.39 3.0 3.9 45 53 29 W/Ag 80.3 1.58 3.0 4.1 50 60 31 W/Ag 88.3 2.07 2.7 4.1 60 75 32 W/Ag 129.9 2.98 2.5 4.3 70 90 34 W/Ag 167.8 3.98 2.1 4.1
Figure 6. Variation of projection CNR with angle for images of 45mm PMMA. Error bars are 5% of the mean value
3.2 Image quality measurements
The lowest threshold gold thicknesses were obtained for focal plane 23. Figure 7 shows the
threshold gold thickness detail detection curves for focal plane 23 at the AEC dose level, and
half and double the AEC level, all in QC mode. The curve at the AEC dose level is also shown
for the ‘clinical’ mode. The CDMAM results shown in Figure 7 are summarised in Table 5.
-20 -10 0 10 200
1
2
3
Projection Angle
Tom
osynth
esis
pro
jection C
NR
Availa
ble fro
m the N
ation
al Co-o
rdina
ting C
entre
for th
e Phy
sics o
f Mam
mograp
hy (N
CCPM)
Technical evaluation of IMS Giotto Class digital breast tomosynthesis system
16
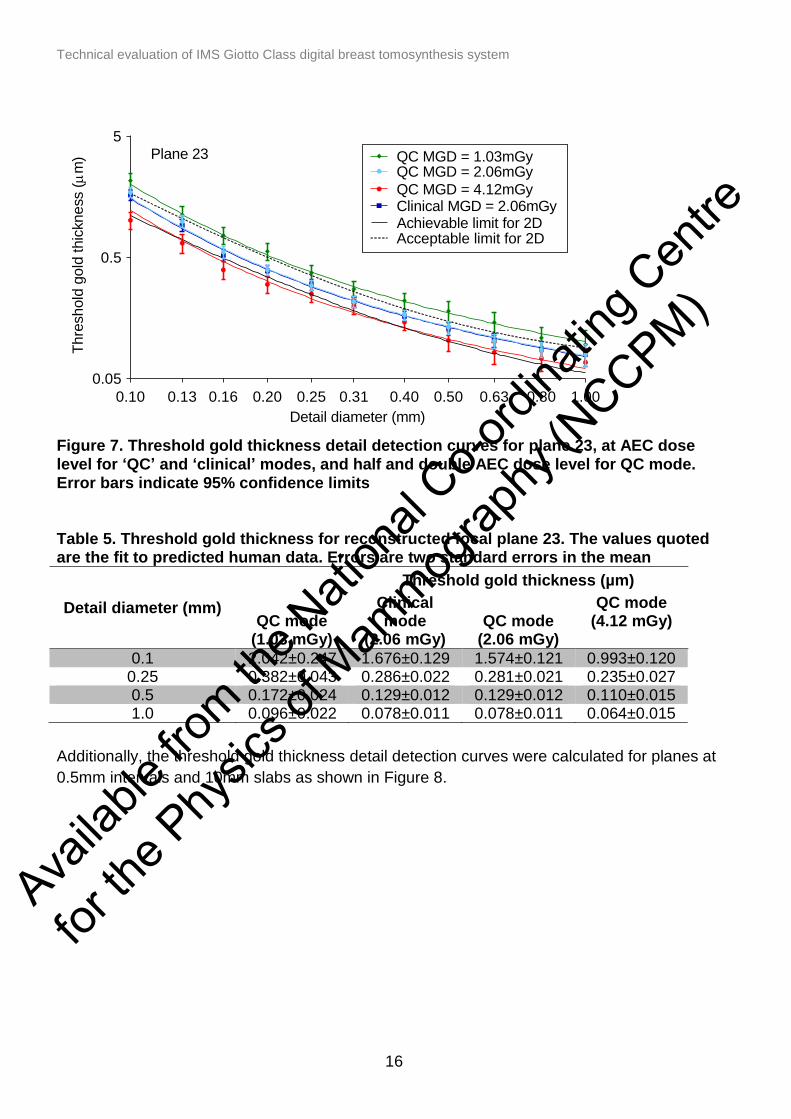
Figure 7. Threshold gold thickness detail detection curves for plane 23, at AEC dose level for ‘QC’ and ‘clinical’ modes, and half and double AEC dose level for QC mode. Error bars indicate 95% confidence limits
Table 5. Threshold gold thickness for reconstructed focal plane 23. The values quoted are the fit to predicted human data. Errors are two standard errors in the mean
Detail diameter (mm)
Threshold gold thickness (µm)
QC mode (1.03 mGy)
Clinical mode
(2.06 mGy) QC mode
(2.06 mGy)
QC mode (4.12 mGy)
0.1 2.042±0.247 1.676±0.129 1.574±0.121 0.993±0.120 0.25 0.382±0.043 0.286±0.022 0.281±0.021 0.235±0.027 0.5 0.172±0.024 0.129±0.012 0.129±0.012 0.110±0.015 1.0 0.096±0.022 0.078±0.011 0.078±0.011 0.064±0.015
Additionally, the threshold gold thickness detail detection curves were calculated for planes at
0.5mm intervals and 10mm slabs as shown in Figure 8.
0.10 0.13 0.16 0.20 0.25 0.31 0.40 0.50 0.63 0.80 1.00
Detail diameter (mm)
5
0.05
0.5
Thre
shold
gold
thic
kness (
m)
Achievable limit for 2D
Plane 23
QC MGD = 2.06mGy
Acceptable limit for 2D
QC MGD = 4.12mGy
QC MGD = 1.03mGy
Clinical MGD = 2.06mGy
Availa
ble fro
m the N
ation
al Co-o
rdina
ting C
entre
for th
e Phy
sics o
f Mam
mograp
hy (N
CCPM)
Technical evaluation of IMS Giotto Class digital breast tomosynthesis system
17
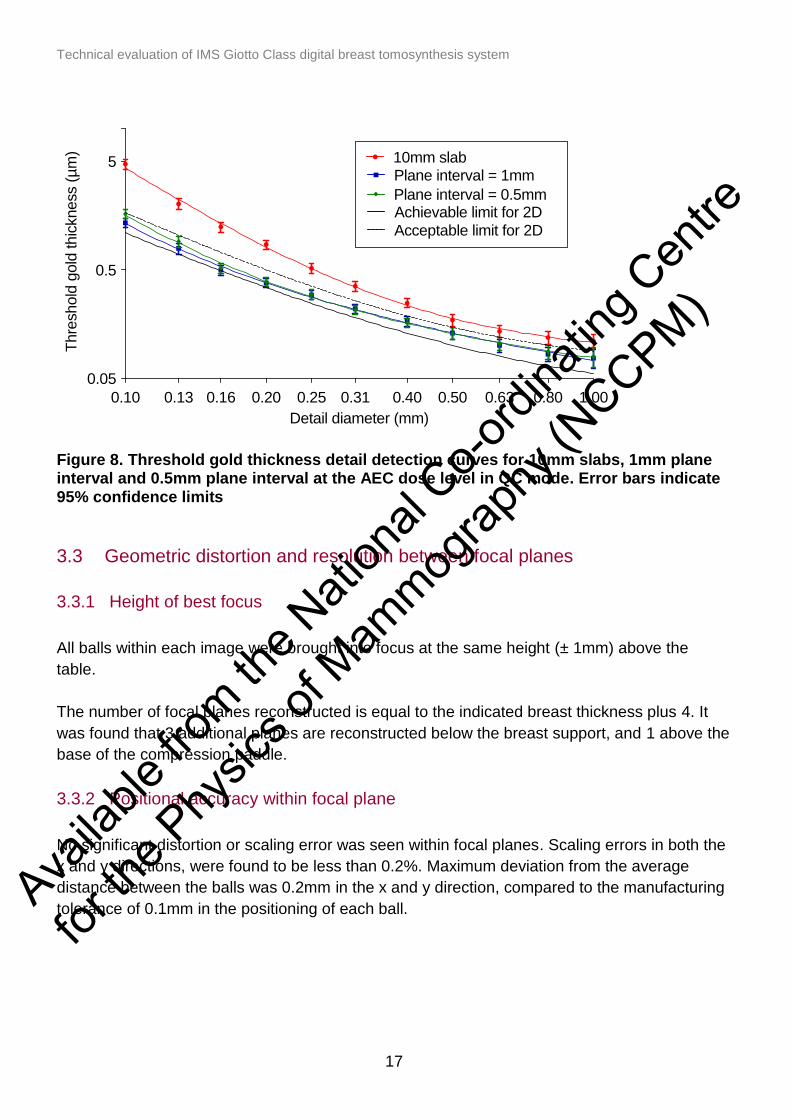
Figure 8. Threshold gold thickness detail detection curves for 10mm slabs, 1mm plane interval and 0.5mm plane interval at the AEC dose level in QC mode. Error bars indicate 95% confidence limits
3.3 Geometric distortion and resolution between focal planes
3.3.1 Height of best focus
All balls within each image were brought into focus at the same height (± 1mm) above the
table.
The number of focal planes reconstructed is equal to the indicated breast thickness plus 4. It
was found that 3 additional planes are reconstructed below the breast support, and 1 above the
base of the compression paddle.
3.3.2 Positional accuracy within focal plane
No significant distortion or scaling error was seen within focal planes. Scaling errors in both the
x and y directions, were found to be less than 0.2%. Maximum deviation from the average
distance between the balls was 0.2mm in the x and y direction, compared to the manufacturing
tolerance of 0.1mm in the positioning of each ball.
0.10 0.13 0.16 0.20 0.25 0.31 0.40 0.50 0.63 0.80 1.00
5
0.05
0.5
Detail diameter (mm)
Thre
shold
gold
thic
kness (
mm
)
Achievable limit for 2D
Acceptable limit for 2D
10mm slab
Plane interval = 0.5mm
Plane interval = 1mm
Availa
ble fro
m the N
ation
al Co-o
rdina
ting C
entre
for th
e Phy
sics o
f Mam
mograp
hy (N
CCPM)
Technical evaluation of IMS Giotto Class digital breast tomosynthesis system
18
3.3.3 Appearance of the ball in adjacent focal planes
In the plane of best focus the balls appeared well defined and circular. Dark areas (reduced
pixel value) were seen to the lateral sides of the ball, an effect which is common in
tomosynthesis images of this test object and thought to be due to the presence of contrast
which exceeds the clinical range. When viewing successive planes, moving away from the
plane of best focus, the images of the balls persisted brightly through several focal planes,
whilst stretching in the direction parallel to the chest wall edge of the image, forming a faint line
which gradually resolved into a row of thirteen spots interspersed with dark patches which
persisted through the image. Moving up through the series of focal planes the balls appeared to
shift slightly toward the centre of the chest wall edge, as would be expected due to
magnification effects. The changing appearance of one of the aluminium balls through
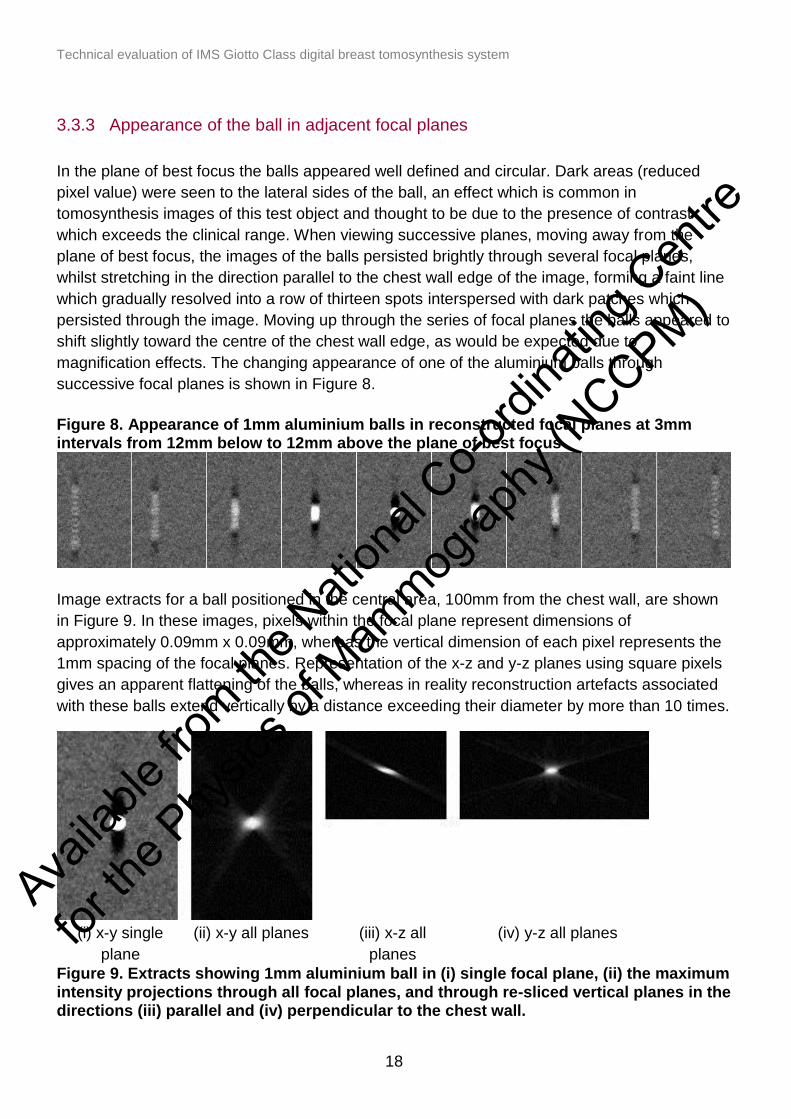
successive focal planes is shown in Figure 8.
Figure 8. Appearance of 1mm aluminium balls in reconstructed focal planes at 3mm intervals from 12mm below to 12mm above the plane of best focus
Image extracts for a ball positioned in the central area, 100mm from the chest wall, are shown
in Figure 9. In these images, pixels within the focal plane represent dimensions of
approximately 0.09mm x 0.09mm, whereas the vertical dimension of each pixel represents the
1mm spacing of the focal planes. Representation of the x-z and y-z planes using square pixels
gives an apparent flattening of the balls, whereas in reality reconstruction artefacts associated
with these balls extend vertically by a distance exceeding their diameter by more than 10 times.
(i) x-y single
plane
(ii) x-y all planes (iii) x-z all
planes
(iv) y-z all planes
Figure 9. Extracts showing 1mm aluminium ball in (i) single focal plane, (ii) the maximum intensity projections through all focal planes, and through re-sliced vertical planes in the directions (iii) parallel and (iv) perpendicular to the chest wall.
Availa
ble fro
m the N
ation
al Co-o
rdina
ting C
entre
for th
e Phy
sics o
f Mam
mograp
hy (N
CCPM)
Technical evaluation of IMS Giotto Class digital breast tomosynthesis system
19
The average z-FWHM of the reconstruction artefact associated with each ball for images of
balls at heights of 7.5mm, 27.5mm and 52.5mm above the breast support table was 5.75mm
(5.52mm-6.21mm).
3.4 Alignment
Alignment at the lateral edges was difficult to measure because the movement of the tube
during the scan causes the lateral edges of the X-ray beam to move between projections.
Initially the X-ray beam was found to overlap the front edge of the breast support table, or not
extend far enough to cover the whole detector. Later, after a modification to the front collimator,
it was found to be satisfactory.
There was no missed tissue at the bottom or top of the reconstructed volume, both with a flat
paddle, and with the use of 2mm spacer at the chest wall edge to give some tilt.
3.5 Image uniformity and repeatability
Five exposures were made under AEC in tomosynthesis modes at the start of testing and a
repeat exposure was made on the second day of testing.
The mAs deviated from the mean value by a maximum of 2.5% for tomosynthesis exposures,
within the 5% limiting value in the EUREF protocol.6
To test the stability of the reconstruction the SNR was measured just outside the CDMAM grid
in the same position in the in-focus plane from 16 reconstructed images of the CDMAM
phantom. The SNR deviated from the mean by no more than 2.3%.
The reconstructed images of 45mm PMMA was uniform with no visible artefacts.
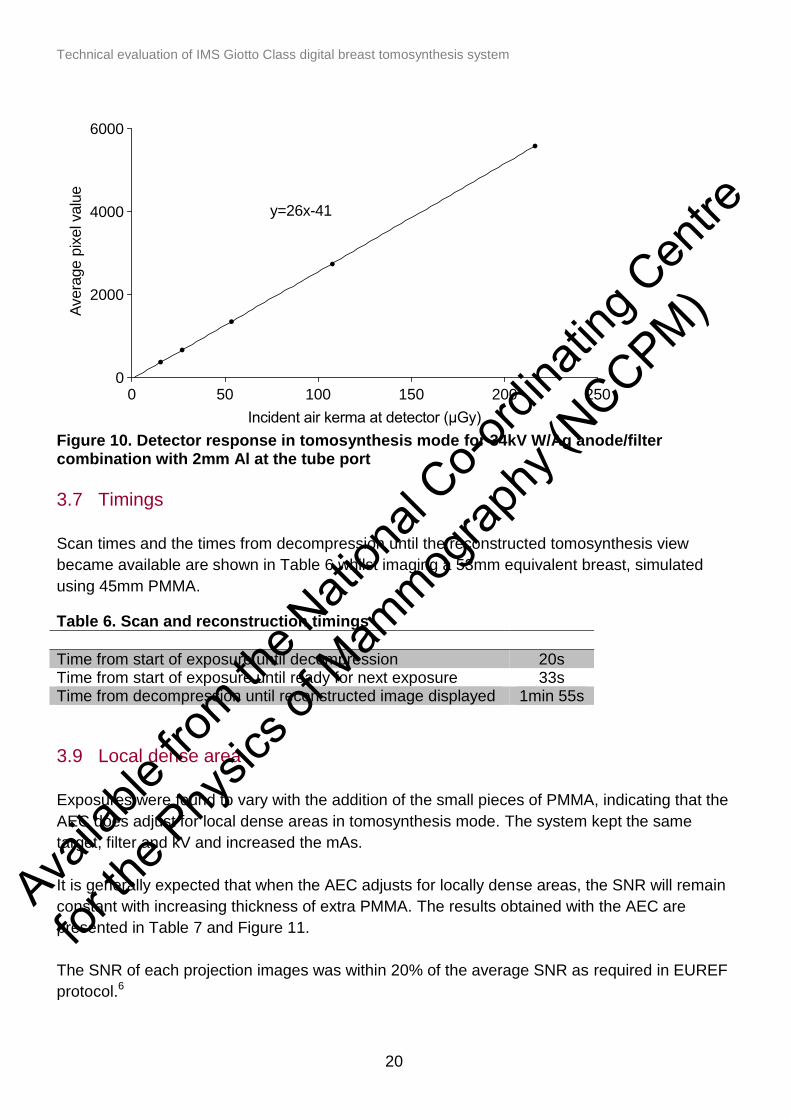
3.6 Detector response
The detector response for the central projection of the tomosynthesis images acquired at 34kV
W/Ag is shown in Figure 10. The incident air kerma at the detector is per projection and
therefore one eleventh of the total exposure for the tomosynthesis scan.
Availa
ble fro
m the N
ation
al Co-o
rdina
ting C
entre
for th
e Phy
sics o
f Mam
mograp
hy (N
CCPM)
Technical evaluation of IMS Giotto Class digital breast tomosynthesis system
20
Figure 10. Detector response in tomosynthesis mode for 34kV W/Ag anode/filter combination with 2mm Al at the tube port
3.7 Timings
Scan times and the times from decompression until the reconstructed tomosynthesis view
became available are shown in Table 6 whilst imaging a 53mm equivalent breast, simulated
using 45mm PMMA.
Table 6. Scan and reconstruction timings
3.9 Local dense area
Exposures were found to vary with the addition of the small pieces of PMMA, indicating that the
AEC does adjust for local dense areas in tomosynthesis mode. The system kept the same
target, filter and kV and increased the mAs.
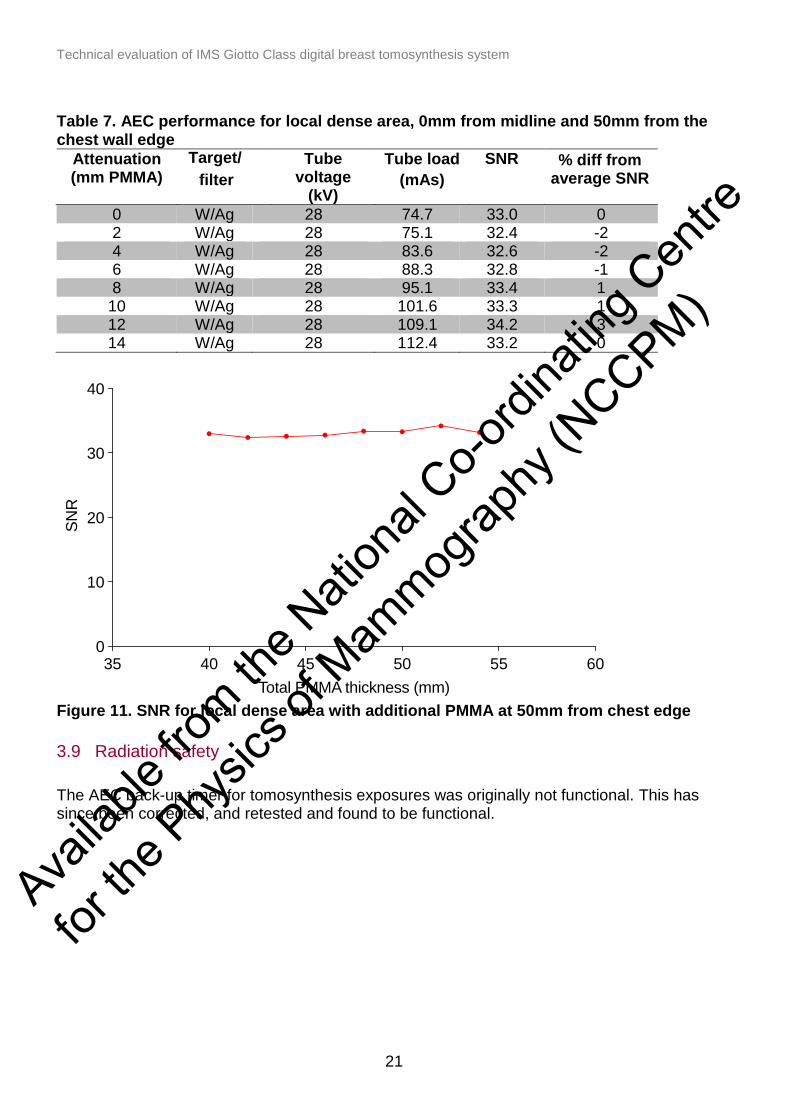
It is generally expected that when the AEC adjusts for locally dense areas, the SNR will remain
constant with increasing thickness of extra PMMA. The results obtained with the AEC are
presented in Table 7 and Figure 11.
The SNR of each projection images was within 20% of the average SNR as required in EUREF
protocol.6
0 50 100 150 200 2500
2000
4000
6000
Incident air kerma at detector (µGy)
Avera
ge p
ixel valu
e
y=26x-41
Time from start of exposure until decompression 20s Time from start of exposure until ready for next exposure 33s Time from decompression until reconstructed image displayed 1min 55s
Availa
ble fro
m the N
ation
al Co-o
rdina
ting C
entre
for th
e Phy
sics o
f Mam
mograp
hy (N
CCPM)
Technical evaluation of IMS Giotto Class digital breast tomosynthesis system
21
Table 7. AEC performance for local dense area, 0mm from midline and 50mm from the chest wall edge
Attenuation (mm PMMA)
Target/
filter
Tube voltage
(kV)
Tube load
(mAs)
SNR % diff from average SNR
0 W/Ag 28 74.7 33.0 0 2 W/Ag 28 75.1 32.4 -24 W/Ag 28 83.6 32.6 -26 W/Ag 28 88.3 32.8 -18 W/Ag 28 95.1 33.4 1
10 W/Ag 28 101.6 33.3 112 W/Ag 28 109.1 34.2 314 W/Ag 28 112.4 33.2 0
Figure 11. SNR for local dense area with additional PMMA at 50mm from chest edge
3.9 Radiation safety
The AEC back-up timer for tomosynthesis exposures was originally not functional. This has since been corrected, and retested and found to be functional.
35 40 45 50 55 600
10
20
30
40
Total PMMA thickness (mm)
SN
R
Availa
ble fro
m the N
ation
al Co-o
rdina
ting C
entre
for th
e Phy
sics o
f Mam
mograp
hy (N
CCPM)

Technical evaluation of IMS Giotto Class digital breast tomosynthesis system
22
4. Discussion
4.1 Dose and contrast-to-noise ratio
Tomosynthesis doses were within the limiting values for MGD for tomosynthesis systems in the
EUREF protocol.6 CNR measurements in tomosynthesis projection images showed a
decreasing CNR with increasing breast thickness. For tomosynthesis planes the CNR showed
little variation with breast thickness.
4.2 Image quality
There was no significant difference in threshold gold thickness between ‘clinical’ and ‘QC’
modes at normal AEC dose level. At normal dose level the curve of threshold gold thickness
with diameter is between the minimum acceptable and achievable levels. At half dose level the
threshold gold thickness with diameter is worse than the minimum acceptable level. At double
dose, the threshold gold thickness is at the achievable level.
These results take no account of the ability of tomosynthesis to remove the obscuring effects of
overlying tissue in a clinical image, and the degree of this effect is expected to vary between
tomosynthesis systems.
There is as yet no standard test object that would allow a realistic and quantitative comparison
of tomosynthesis image quality between systems or between 2D and tomosynthesis modes is
not yet available. A suitable test object would need to incorporate simulated breast tissue to
show the benefit of removing overlying breast structure in tomosynthesis imaging, as compared
to 2D imaging.
4.3 Geometric distortion and reconstruction artefacts
Assessment of geometric distortion images demonstrated that the reconstructed tomosynthesis
focal planes were flat and parallel to the surface of the breast support table. No vertical or in-
plane distortion was seen and there were no significant scaling errors.
The mean inter-plane resolution (z-FWHM) for the 1mm diameter balls was 5.75mm.
4.4 Alignment
Initially the large penumbra of the X-ray field made it impossible to find a suitable position for
the front collimator. After a modification, the edge of the field was sharp and alignment was
satisfactory.
Availa
ble fro
m the N
ation
al Co-o
rdina
ting C
entre
for th
e Phy
sics o
f Mam
mograp
hy (N
CCPM)
Technical evaluation of IMS Giotto Class digital breast tomosynthesis system
23
4.5 Image uniformity and repeatability
The repeatability of tomosynthesis AEC exposures and tomosynthesis reconstructions were
found to be satisfactory. The tomosynthesis reconstructions were uniform.
In the combination exposure mode under AEC, the 2D exposure settings selected differed from
those selected when using the AEC in 2D mode. This corresponded to around 8% difference in
MGD for an equivalent breast thickness of 53mm.
4.6 Reconstruction time
The time from decompression until the reconstructed image displayed was relatively long at
1min 55secs. The reconstruction time was measured using a 45mm thick rectangular phantom
of 18x24cm PMMA with 8mm spacers. The reconstruction time for real breasts may be different
due to differences in the area and shape.
Availa
ble fro
m the N
ation
al Co-o
rdina
ting C
entre
for th
e Phy
sics o
f Mam
mograp
hy (N
CCPM)
Technical evaluation of IMS Giotto Class digital breast tomosynthesis system
24
5. Conclusions
The technical performance of the IMS Giotto Class digital breast tomosynthesis system was
tested. Performance was found to be satisfactory, though image quality standards have not yet
been established for digital breast tomosynthesis systems.
The MGD to the standard breast, in tomosynthesis mode, was found to be 1.58mGy, within the
limiting values for digital breast tomosynthesis.
The back-up timer was functional after correction.
Beam alignment at the chest wall edge was satisfactory after a modification was made to the
collimator.
Availa
ble fro
m the N
ation
al Co-o
rdina
ting C
entre
for th
e Phy
sics o
f Mam
mograp
hy (N
CCPM)
Technical evaluation of IMS Giotto Class digital breast tomosynthesis system
25
References
1. Strudley CJ, Looney P, Young KC. Technical evaluation of Hologic Selenia Dimensions
digital breast tomosynthesis system (NHSBSP Equipment Report 1307 Version 2).
Sheffield: NHS Cancer Screening Programmes, 2014
2. Strudley CJ, Warren LM, Young KC. Technical evaluation of Siemens Mammomat
Inspiration digital breast tomosynthesis system (NHSBSP Equipment Report 1306 Version
2). Sheffield: NHS Cancer Screening Programmes, 2015
3. Strudley CJ, Hadjipanteli A, Oduko JM, Young KC. Technical evaluation of Fujifilm
AMULET Innovality digital breast tomosynthesis system (NHSBSP Equipment Report).
Sheffield: NHS Cancer Screening Programmes, 2018
4. Strudley CJ, Oduko JM, Young KC. Technical evaluation of GE Healthcare SenoClaire
digital breast tomosynthesis system (NHSBSP Equipment Report 1404). London: Public
Health England, 2016
5. Burch A, Loader R, Rowberry B et al. Routine quality control tests for breast tomosynthesis
(physicists) (NHSBSP Equipment Report 1407). London: Public Health England, 2015
6. van Engen RE, Bosmans H, Bouwman RW et al. Protocol for the Quality Control of the
Physical and Technical Aspects of Digital Breast Tomosynthesis Systems. Version 1.03
www.euref.org
7. Dance DR, Young KC, van Engen RE. Estimation of mean glandular dose for breast
tomosynthesis: factors for use with the UK, European and IAEA breast dosimetry protocols.
Physics in Medicine and Biology, 2011, 56: 453-471
Availa
ble fro
m the N
ation
al Co-o
rdina
ting C
entre
for th
e Phy
sics o
f Mam
mograp
hy (N
CCPM)
Top Related