


Languages
Pages
Legal


Teaching Dossier Clinic
Learning & Teaching Office and Friends
Consider
a) What does one learn from a dossier? b) What should be included? c) What shows the quality of teaching?

In Most a) The dossier is organized, formatted, in sections and
has a table of contents b) Typical dossiers are 5 to 10 pages with approximately
30 pages of appendices c) Dossiers are succinct and usually written for a
particular audience d) Personal beliefs about teaching backed up by solid
research e) Evidence provided to support claims made in the
teaching philosophy is given f) Usually evidence that the faculty member’s teaching
has improved over time
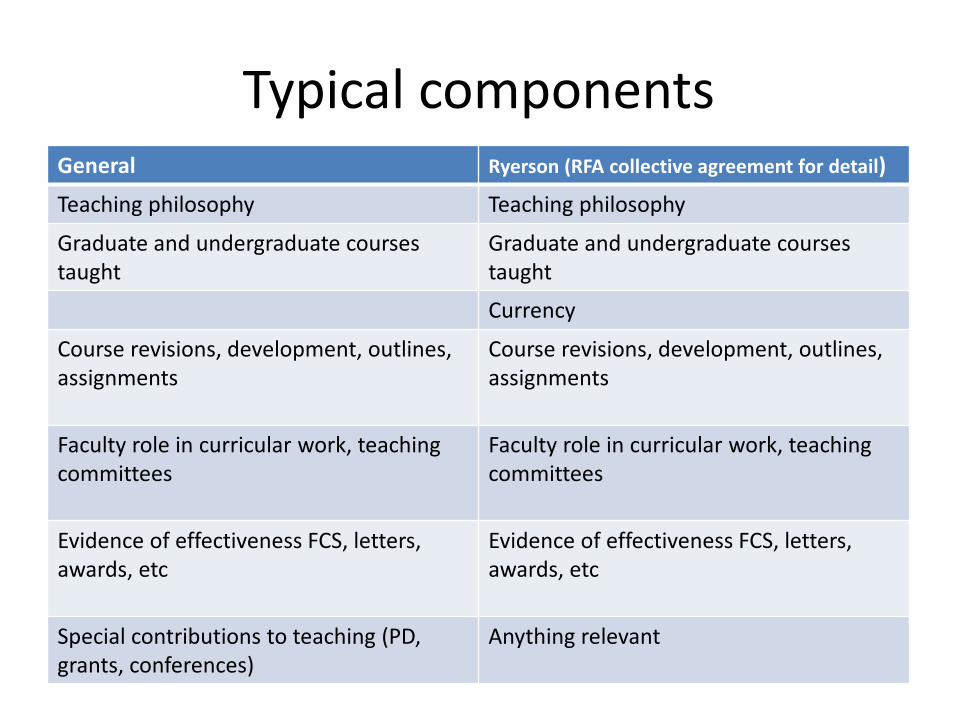
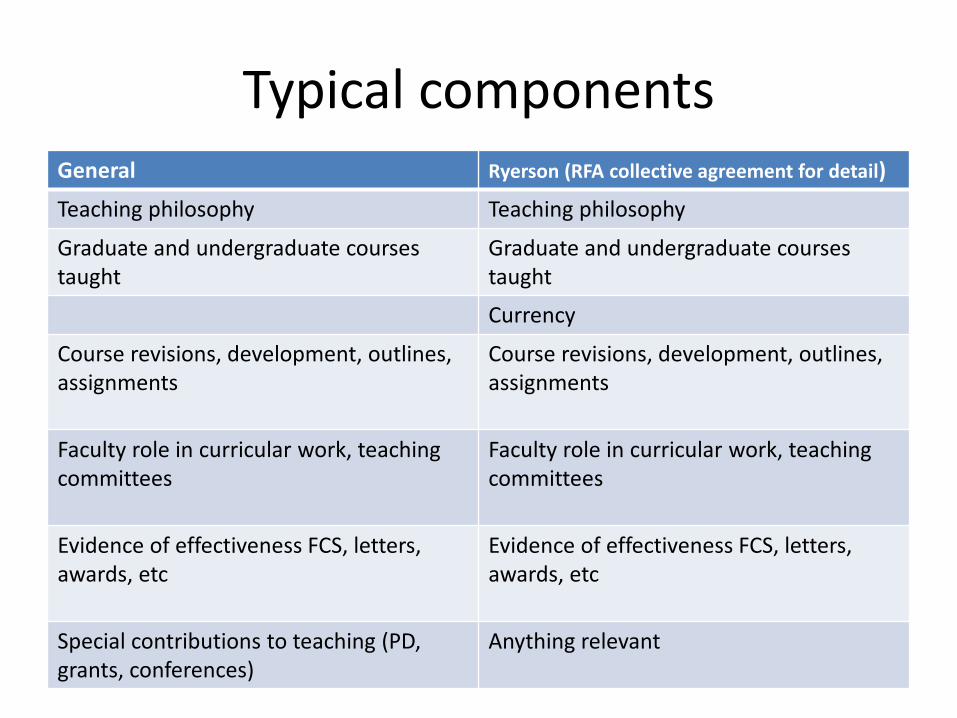
Typical components General Ryerson (RFA collective agreement for detail)
Teaching philosophy Teaching philosophy
Graduate and undergraduate courses taught
Graduate and undergraduate courses taught
Currency
Course revisions, development, outlines, assignments
Course revisions, development, outlines, assignments
Faculty role in curricular work, teaching committees
Faculty role in curricular work, teaching committees
Evidence of effectiveness FCS, letters, awards, etc
Evidence of effectiveness FCS, letters, awards, etc
Special contributions to teaching (PD, grants, conferences)
Anything relevant

Statement of Teaching Philosophy
• Discuss your view of teaching and learning • Contain reflections on teaching experiences • Describe learning environments you work in • Demonstrate understanding of teaching
practices • Discuss relations between you and your
students • Show knowledge of your discipline • Demonstrate desire to grow as a teacher • Show understanding of the institutional
climate
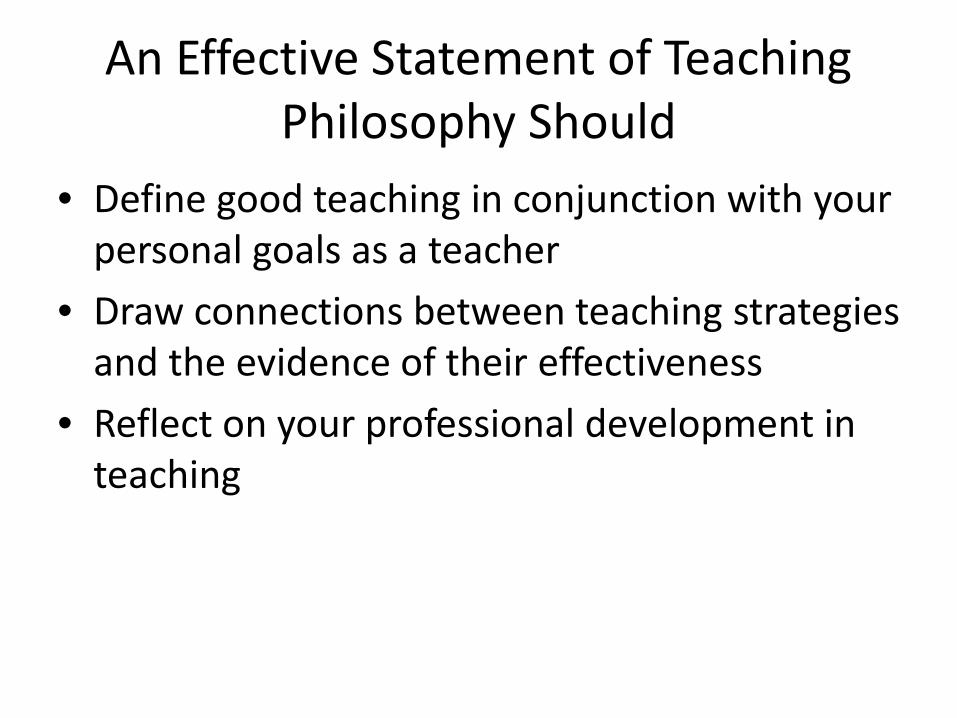
An Effective Statement of Teaching Philosophy Should
• Define good teaching in conjunction with your personal goals as a teacher
• Draw connections between teaching strategies and the evidence of their effectiveness
• Reflect on your professional development in teaching

Potential Sources of Evidence
1. Data from oneself – A list of courses taught with a list of course
content, responsibilities and student info – Examples of course materials (and modifications) – Examples of comments on student papers
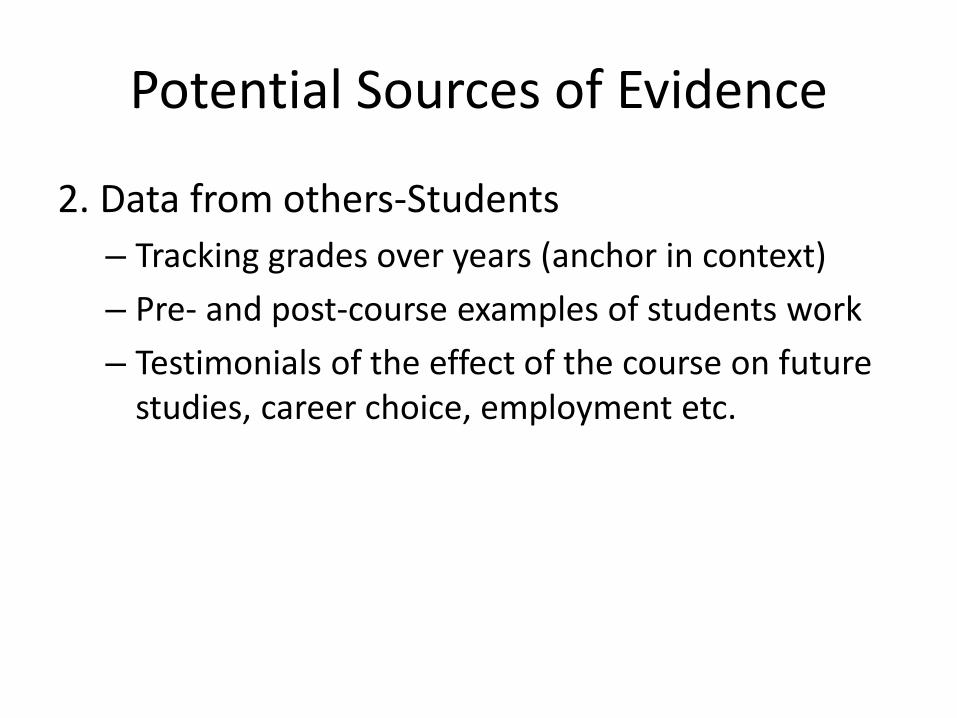
Potential Sources of Evidence
2. Data from others-Students – Tracking grades over years (anchor in context) – Pre- and post-course examples of students work – Testimonials of the effect of the course on future
studies, career choice, employment etc.

Potential Sources of Evidence
3. Data from others-Colleagues Colleagues can provide analyses that serve as a measure of
– Mastery of course content – Ability to convey course content and objectives – Suitability of specific teaching methods – Commitment to teaching

Example Statement of Teaching Philosophy

After the Statement of Teaching Philosophy, what else is included?
Typical components General Ryerson (RFA collective agreement for detail)
Teaching philosophy Teaching philosophy
Graduate and undergraduate courses taught
Graduate and undergraduate courses taught
Currency
Course revisions, development, outlines, assignments
Course revisions, development, outlines, assignments
Faculty role in curricular work, teaching committees
Faculty role in curricular work, teaching committees
Evidence of effectiveness FCS, letters, awards, etc
Evidence of effectiveness FCS, letters, awards, etc
Special contributions to teaching (PD, grants, conferences)
Anything relevant
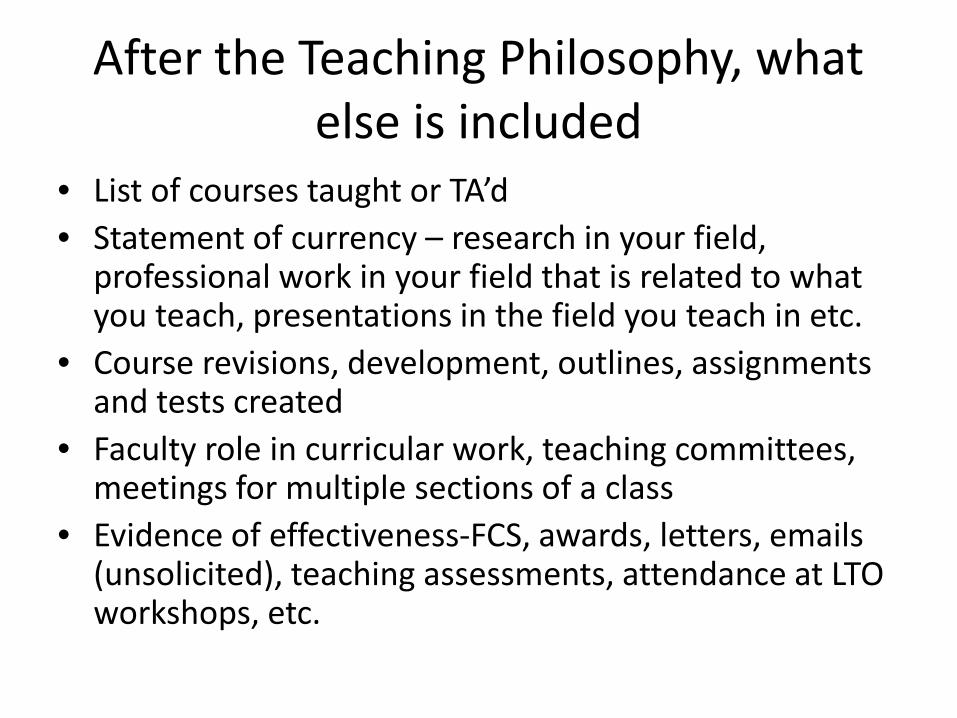
After the Teaching Philosophy, what else is included
• List of courses taught or TA’d • Statement of currency – research in your field,
professional work in your field that is related to what you teach, presentations in the field you teach in etc.
• Course revisions, development, outlines, assignments and tests created
• Faculty role in curricular work, teaching committees, meetings for multiple sections of a class
• Evidence of effectiveness-FCS, awards, letters, emails (unsolicited), teaching assessments, attendance at LTO workshops, etc.
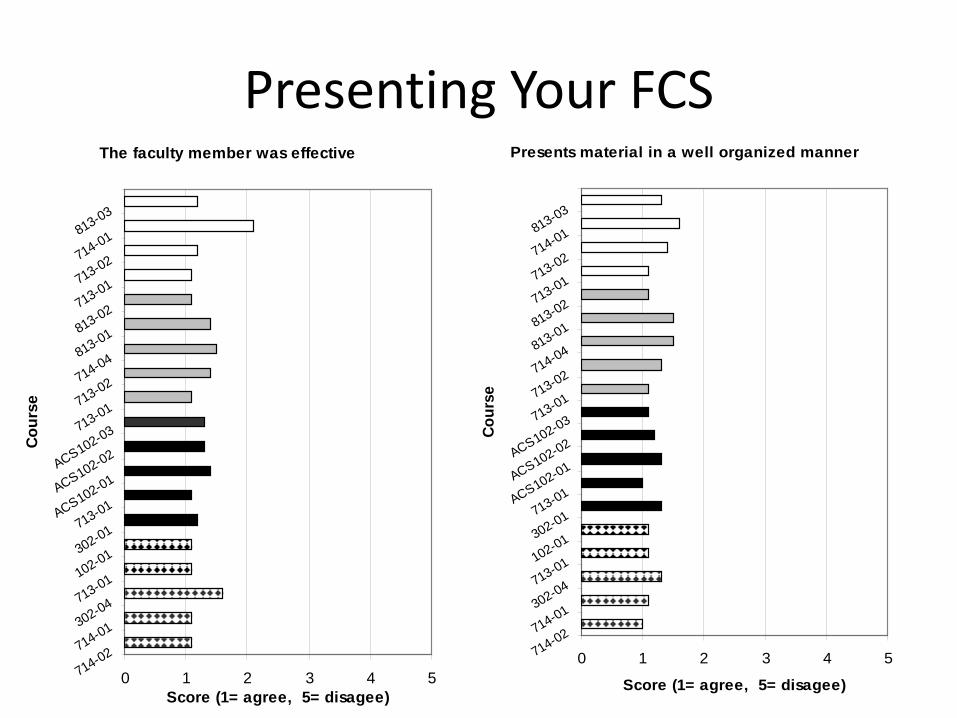
Presenting Your FCS The faculty member was effective
0 1 2 3 4 5714-02714-01302-04713-01102-01302-01713-01ACS102-01ACS102-02ACS102-03713-01713-02714-04813-01813-02713-01713-02714-01813-03
Cour
se
Score (1= agree, 5= disagee)
Presents material in a well organized manner
0 1 2 3 4 5714-02714-01302-04713-01102-01302-01713-01ACS102-01ACS102-02ACS102-03713-01713-02714-04813-01813-02713-01713-02714-01813-03
Cour
se
Score (1= agree, 5= disagee)
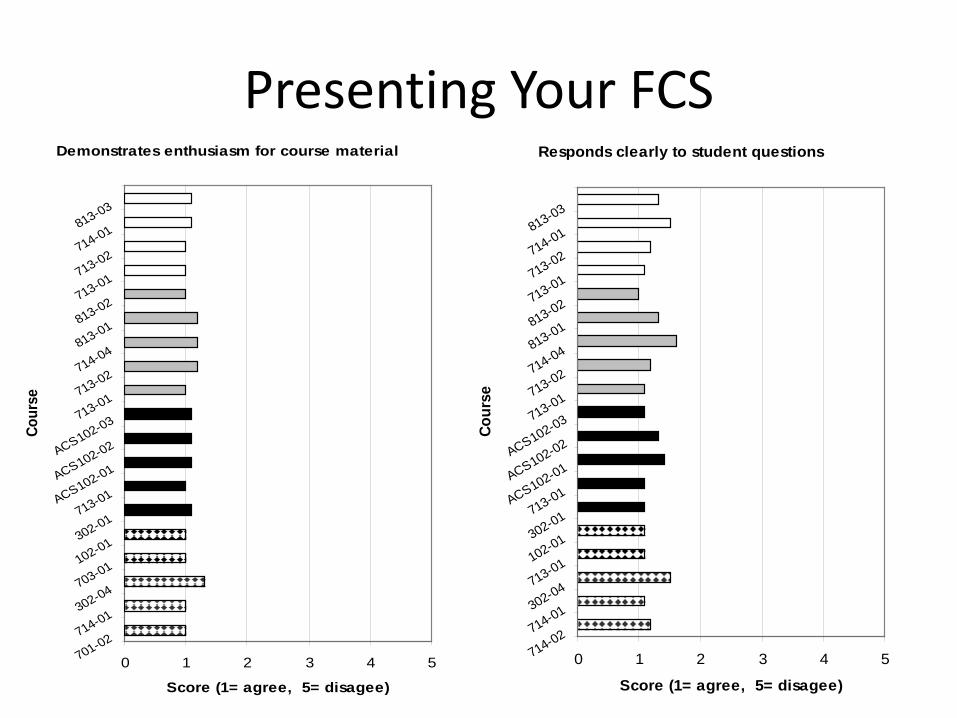
Presenting Your FCS Demonstrates enthusiasm for course material
0 1 2 3 4 5701-02714-01302-04703-01102-01302-01713-01ACS102-01ACS102-02ACS102-03713-01713-02714-04813-01813-02713-01713-02714-01813-03
Cour
se
Score (1= agree, 5= disagee)
Responds clearly to student questions
0 1 2 3 4 5714-02714-01302-04713-01102-01302-01713-01ACS102-01ACS102-02ACS102-03713-01713-02714-04813-01813-02713-01713-02714-01813-03
Cour
se
Score (1= agree, 5= disagee)

Longitudinal Tracking – Teaching courses in the same area for many
years (2003-2013)
Example of presenting Your FCS
• Data presented: – Tracking Combined Scores from All Questions – Tracking Online vs. Paper – Tracking Individual Courses – Tracking Selected Questions – Tracking Student Participation in % – Tracking Number of Students Enrolled – Including Institutional Context (Ryerson, Faculty, Department) – Including Trends
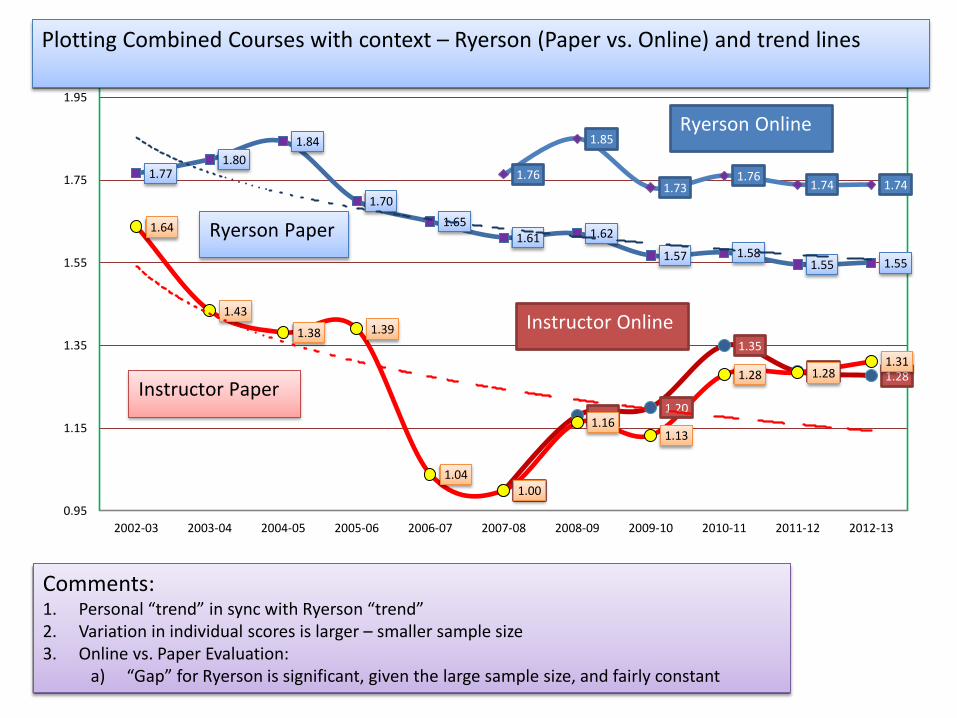
1.00
1.18 1.20
1.35
1.29 1.28
1.64
1.43
1.38 1.39
1.04 1.00
1.16 1.13
1.28 1.28 1.31
1.76
1.85
1.73 1.76
1.74 1.74 1.77
1.80 1.84
1.70 1.65
1.61 1.62
1.57 1.58 1.55 1.55
0.95
1.15
1.35
1.55
1.75
1.95
2002-03 2003-04 2004-05 2005-06 2006-07 2007-08 2008-09 2009-10 2010-11 2011-12 2012-13
Faculty Course Surveys
Ryerson Paper
Ryerson Online
Instructor Paper
Instructor Online
Comments: 1. Personal “trend” in sync with Ryerson “trend” 2. Variation in individual scores is larger – smaller sample size 3. Online vs. Paper Evaluation:
a) “Gap” for Ryerson is significant, given the large sample size, and fairly constant
Plotting Combined Courses with context – Ryerson (Paper vs. Online) and trend lines

1.20
1.35
1.28
1.64
1.43
1.38 1.39
1.04 1.00
1.16 1.13
1.28 1.28
1.31
1.84
1.75 1.71
1.73 1.76
1.96
1.90 1.90 1.94
1.80
1.70
1.64 1.62
1.58
1.68
1.46
1.66
0.95
1.15
1.35
1.55
1.75
1.95
2002-03 2003-04 2004-05 2005-06 2006-07 2007-08 2008-09 2009-10 2010-11 2011-12 2012-13
Faculty Course Surveys
Instructor Paper
Instructor Online
Department Paper
Department Online
Comments: 1. Personal “trend” in sync with the Department “trend” 2. Variation in individual scores is larger – smaller sample size 3. Online vs. Paper Evaluation:
a) “Gap” for the Department is significant, given the large sample size
Plotting Combined Courses with context – Ryerson (Paper vs. Online) and trend lines
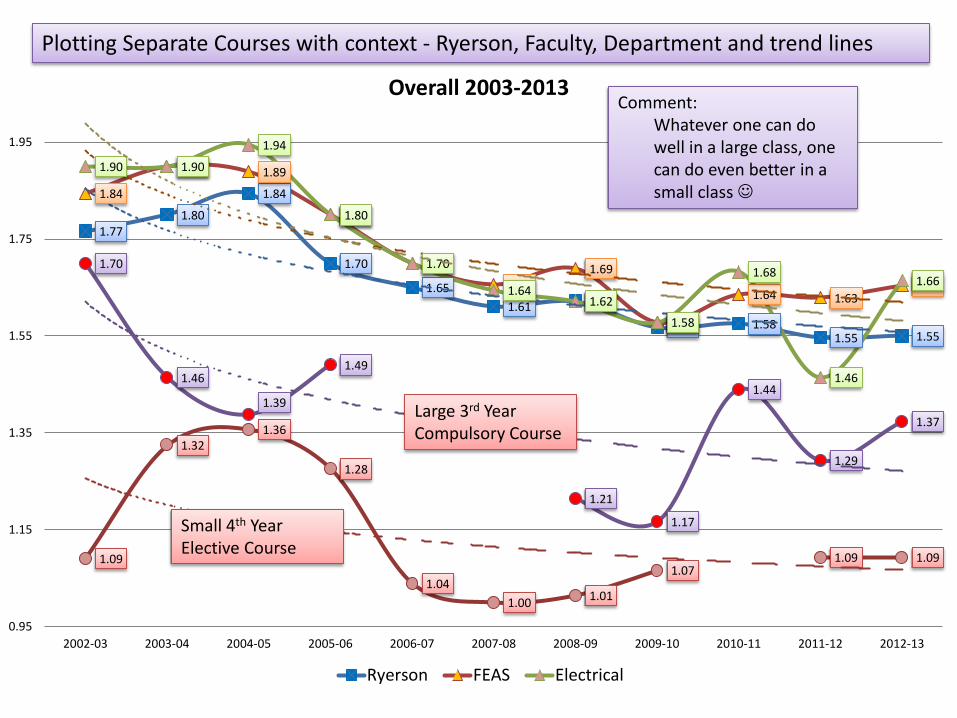
1.09
1.32 1.36
1.28
1.04 1.00 1.01
1.07 1.09 1.09
1.77 1.80
1.84
1.70
1.65 1.61 1.62
1.57 1.58 1.55 1.55
1.84
1.90 1.89
1.80
1.70
1.66 1.69
1.58
1.64 1.63 1.65
1.90 1.90
1.94
1.80
1.70
1.64 1.62
1.58
1.68
1.46
1.66 1.70
1.46
1.39
1.49
1.21
1.17
1.44
1.29
1.37
0.95
1.15
1.35
1.55
1.75
1.95
2002-03 2003-04 2004-05 2005-06 2006-07 2007-08 2008-09 2009-10 2010-11 2011-12 2012-13
Overall 2003-2013
Ryerson FEAS Electrical
Plotting Separate Courses with context - Ryerson, Faculty, Department and trend lines
Comment: Whatever one can do
well in a large class, one can do even better in a small class
Large 3rd Year Compulsory Course
Small 4th Year Elective Course

1.6 1.6 1.6 1.55
1.5
1.4 1.4
1.3 1.3 1.3 1.3
1.6 1.6 1.6 1.55
1.6
1.5 1.5
1.3
1.4
1.3 1.3
1.6 1.65
1.7 1.65
1.6
1.5
1.4
1.2
1.3 1.3 1.3
1.17 1.20
1.32
1.20
1.00 1.00
1.15
1.07 1.00 1.00
1.15
0.95
1.15
1.35
1.55
1.75
1.95
2.15
2.35
2.55
2002-03 2003-04 2004-05 2005-06 2006-07 2007-08 2008-09 2009-10 2010-11 2011-12 2012-13
Fairness and Respect for Students: Q5 before 2009, Q9 after 2009
Plotting Individual Questions with context - Ryerson, Faculty, Department and trend lines
Instructor
Ryerson
Department
Faculty
Comment: Personal “trend” in sync with the Ryerson,
Faculty, Department “trends”
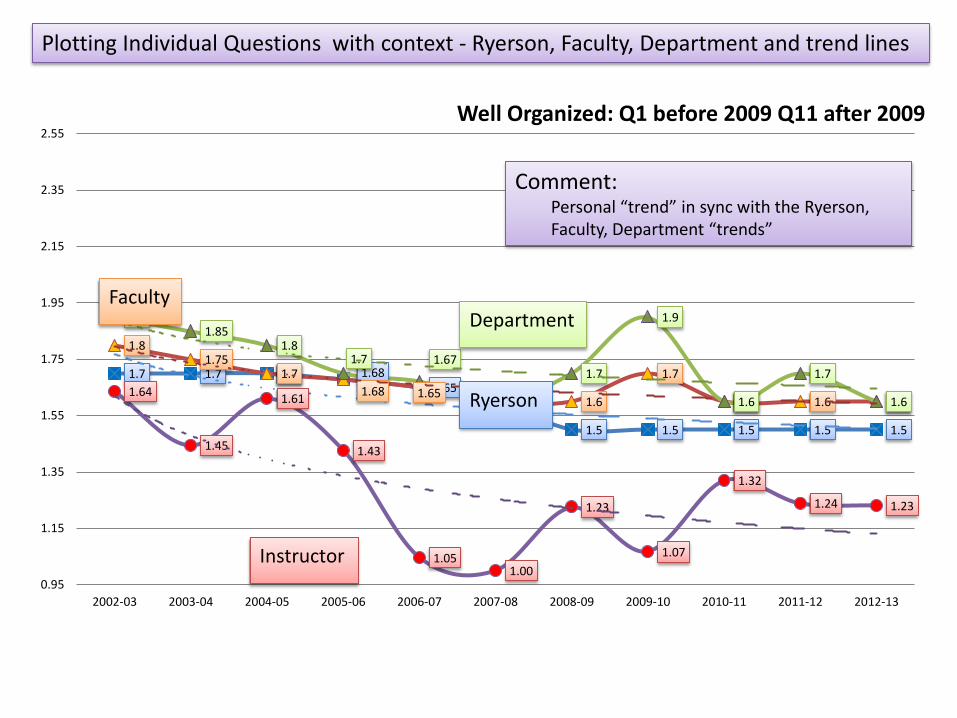
Plotting Individual Questions with context - Ryerson, Faculty, Department and trend lines
1.7 1.7 1.7 1.68 1.65
1.6
1.5 1.5 1.5 1.5 1.5
1.8 1.75
1.7 1.68 1.65
1.6 1.6
1.7
1.6 1.6 1.6
1.9 1.85
1.8 1.7 1.67
1.6
1.7
1.9
1.6
1.7
1.6 1.64
1.45
1.61
1.43
1.05 1.00
1.23
1.07
1.32
1.24 1.23
0.95
1.15
1.35
1.55
1.75
1.95
2.15
2.35
2.55
2002-03 2003-04 2004-05 2005-06 2006-07 2007-08 2008-09 2009-10 2010-11 2011-12 2012-13
Well Organized: Q1 before 2009 Q11 after 2009
Instructor
Ryerson
Department Faculty
Comment: Personal “trend” in sync with the Ryerson,
Faculty, Department “trends”
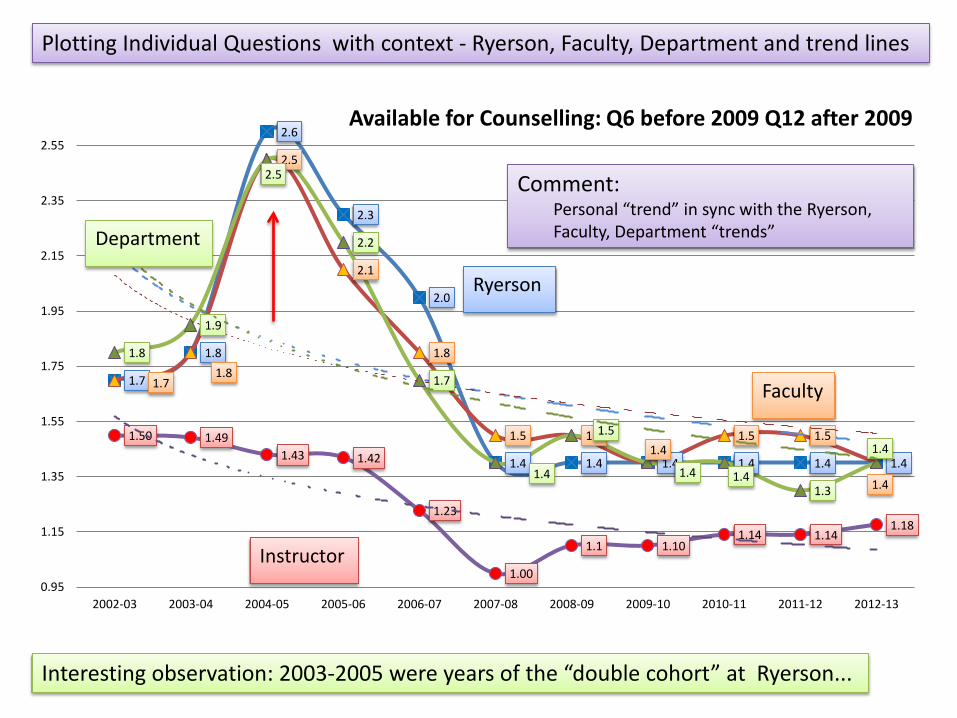
Plotting Individual Questions with context - Ryerson, Faculty, Department and trend lines
1.7
1.8
2.6
2.3
2.0
1.4 1.4 1.4 1.4 1.4 1.4
1.7 1.8
2.5
2.1
1.8
1.5 1.5 1.4
1.5 1.5
1.4
1.8
1.9
2.5
2.2
1.7
1.4
1.5
1.4 1.4 1.3
1.4 1.50 1.49
1.43 1.42
1.23
1.00
1.1 1.10 1.14 1.14
1.18
0.95
1.15
1.35
1.55
1.75
1.95
2.15
2.35
2.55
2002-03 2003-04 2004-05 2005-06 2006-07 2007-08 2008-09 2009-10 2010-11 2011-12 2012-13
Available for Counselling: Q6 before 2009 Q12 after 2009
Interesting observation: 2003-2005 were years of the “double cohort” at Ryerson...
Instructor
Ryerson
Department
Faculty
Comment: Personal “trend” in sync with the Ryerson,
Faculty, Department “trends”
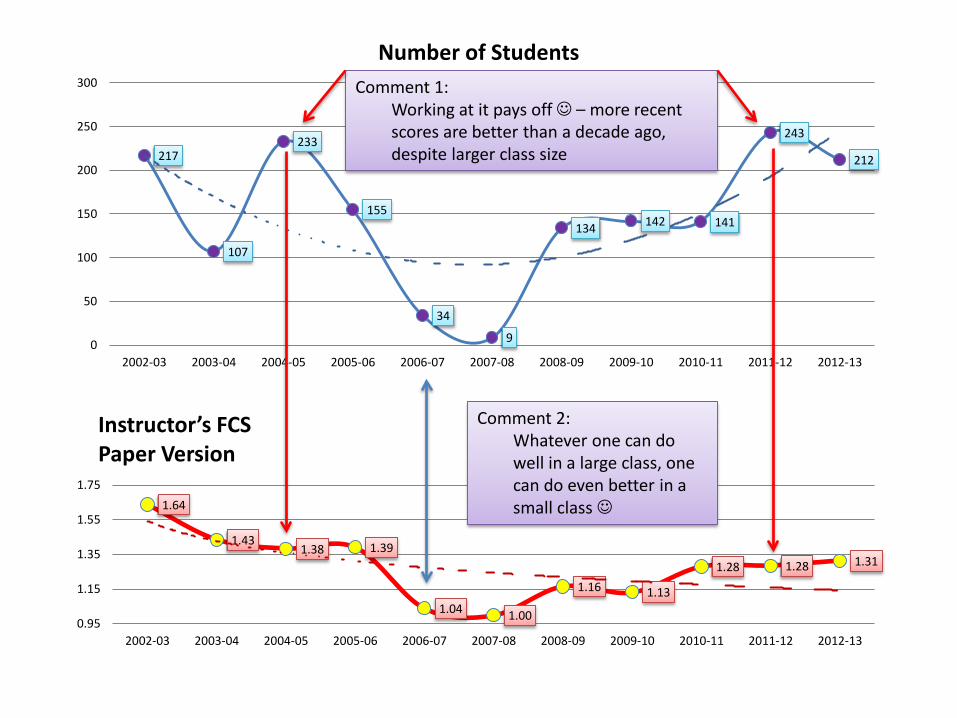
217
107
233
155
34
9
134 142 141
243
212
0
50
100
150
200
250
300
2002-03 2003-04 2004-05 2005-06 2006-07 2007-08 2008-09 2009-10 2010-11 2011-12 2012-13
Number of Students
1.64
1.43 1.38 1.39
1.04 1.00
1.16 1.13
1.28 1.28 1.31
0.95
1.15
1.35
1.55
1.75
2002-03 2003-04 2004-05 2005-06 2006-07 2007-08 2008-09 2009-10 2010-11 2011-12 2012-13
Instructor’s FCS Paper Version
Comment 2: Whatever one can do
well in a large class, one can do even better in a small class
Comment 1: Working at it pays off – more recent
scores are better than a decade ago, despite larger class size
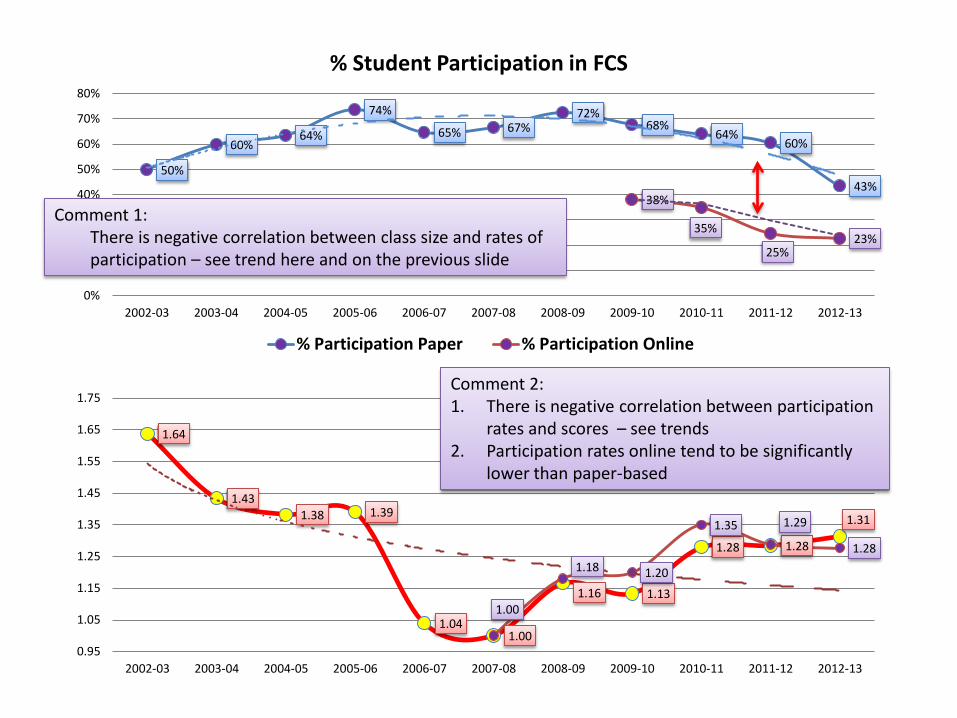
50%
60% 64%
74%
65% 67% 72%
68% 64%
60%
43% 38%
35%
25% 23%
0%
10%
20%
30%
40%
50%
60%
70%
80%
2002-03 2003-04 2004-05 2005-06 2006-07 2007-08 2008-09 2009-10 2010-11 2011-12 2012-13
% Student Participation in FCS
% Participation Paper % Participation Online
1.64
1.43 1.38 1.39
1.04 1.00
1.16 1.13
1.28 1.28
1.31
1.00
1.18 1.20
1.35 1.29
1.28
0.95
1.05
1.15
1.25
1.35
1.45
1.55
1.65
1.75
2002-03 2003-04 2004-05 2005-06 2006-07 2007-08 2008-09 2009-10 2010-11 2011-12 2012-13
Comment 2: 1. There is negative correlation between participation
rates and scores – see trends 2. Participation rates online tend to be significantly
lower than paper-based
Comment 1: There is negative correlation between class size and rates of
participation – see trend here and on the previous slide

Resources • Seldin, P. (1991) The Teaching Portfolio: A Practical Guide
to Improved Performance and Promotion Tenure Decisions. Bolton, MA: Anker
• Fink, L. D. (2003) Creating Significant Learning Experiences: An Integrated Approach to Designing College Courses. Jossey-Bass
• Kaplan, M. et al. (2008) Rubric for Statements of Teaching Philosophy. To Improve the Academy. San Francisco: Jossey-Bass.
• LTO Website http://ryerson.ca/lt/resources/prof_dev/dossier_design.html
Top Related