


Languages
Pages
Legal


GEORGIA PUBLIC SCHOOL EMPLOYEES’ RETIREMENT SYSTEM EXPERIENCE INVESTIGATION FOR THE FIVE-YEAR PERIOD ENDING JUNE 30, 2014

December 17, 2015
Board of Trustees
Georgia Public School Employees’ Retirement System
Two Northside 75, Suite 300
Atlanta, GA 30318
Members of the Board:
We are pleased to submit the results of an investigation of the economic and demographic
experience for the Georgia Public School Employees’ Retirement System. The purpose of the
investigation was to assess the reasonability of the actuarial assumptions currently used by the
Retirement System. This investigation covers the five-year period from July 1, 2009 to
June 30, 2014. As a result of the investigation, it is recommended that revised economic and
demographic tables be adopted by the Board for future use.
The investigation of the demographic experience of members of the System includes all active and
retired members as well as beneficiaries of deceased members. The experience was investigated
separately for males and females since different tables are used for each of these groups.
The number of members expected to separate from active service and the expected number of post-
retirement deaths was obtained by use of the rates determined in the last experience investigation
and adopted by the Board of Trustees. The results of the investigation indicate that the assumed
rates of separation from active service due to withdrawal, death and retirement, and the rates of
post-retirement mortality do not accurately reflect the actual and anticipated experience of the
Retirement System. As a result of the investigation, new withdrawal, retirement and mortality
tables have been developed which reflect more closely the actual experience of the membership.
This report shows a comparison of the actual and expected cases of separation from active service
and actual and expected number of deaths. A comparison between the rates of separation and
mortality presently in use and the recommended revised rates are also shown in this report.
Off
Cavanaugh Macdonald CC OO NN SS UU LL TT II NN GG,, LL LL CC
The experience and dedication you deserve
3550 Busbee Pkwy, Suite 250, Kennesaw, GA 30144 Phone (678) 388-1700 • Fax (678) 388-1730
www.CavMacConsulting.com Offices in Englewood, CO • Kennesaw, GA • Bellevue, NE

All new assumptions are shown in the attached tables in Appendix C of this report. In the actuary’s
judgment, the recommended assumptions are suitable for use until further experience indicates
that modifications are desirable.
The experience investigation was performed by, and under the supervision of, independent
actuaries who are members of the American Academy of Actuaries with experience in performing
valuations for public retirement systems. The undersigned meet the Qualification Standards of the
American Academy of Actuaries to render the actuarial opinion contained herein.
Respectfully submitted,
Edward A. Macdonald, ASA, FCA, MAAA Cathy Turcot
President Principal and Managing Director
Edward J. Koebel, FCA, EA, MAAA
Principal and Consulting Actuary
S:\Georgia Public Schools\Experience Studies\Exp Study 2009-2014\GA PSERS Experience Investigation Report _2014_DRAFT.docx

TABLE OF CONTENTS
Section Page
I Executive Summary 1
II Financial Impact 3
III Economic Assumptions 4
IV Demographic Assumptions 11
Rates of Withdrawal 12
Rates of Disability Retirement 18
Rates of Retirement 19
Rates of Pre-Retirement Mortality 23
Rates of Post-Retirement Mortality 26
V Other Assumptions and Methods 32
Appendix
A Historical June CPI (U) Index 33
B Capital Market Assumptions and Asset Allocation 34
C Recommended Rates 35

Page 1
Section I
Executive Summary
The following table summarizes the findings and recommendations with regard to the assumptions
utilized for the Georgia Public School Employees’ Retirement System. Detailed explanations for
the recommendations are found in the sections that follow.
Recommended Economic Assumption Changes
The table below lists the two economic assumptions used in the actuarial valuations and the
current and proposed rates.
Item Current Proposed
Price Inflation 3.00% 2.75%
Investment Return* 7.50% 7.50%
* net of investment expenses.
Recommended Demographic Assumption Changes
The table below lists the demographic assumptions we recommend be changed based on the
experience of the last five years.
Assumption Changes
Withdrawal, Pre-Retirement Mortality, Service Retirement and Post-Retirement Mortality

Page 2
Recommended Other Assumption Changes
The table below lists the other assumptions that are considered in our valuations that should be
reviewed during the experience study.
Assumption Assumption Changes
Administrative Expenses No Change to current method of determining rate
Amortization Method No change to current method of level dollar
amortization
Asset Smoothing No change to current method of smoothing market
gains and losses over 5 year period
Cost of Living No change to current assumption of 1.5% semi-annually
Option Factors Recommend change in current option factors to reflect
change in mortality rate
Termination Benefits Recommend change in assumption for active vested
members receiving termination benefits
Valuation Cost Method No change in Entry Age Normal Cost Method

Page 3
Section II
Financial Impact
The following table highlights the impact of the recommended changes on the principal valuation
results.
Impact on Principal Valuation Results
Valuation Results
2014
Recommended
Assumptions
Unfunded Accrued
Liability $158,915,410 $189,416,143
Funding Ratio 82.8% 80.2%
Actuarially Determined
Employer Contribution
Normal Cost*
Accrued Liability
Total
$11,779,000
$14,498,000
$26,277,000
$13,063,000
$17,234,000
$30,297,000
Amortization Period
(in years) 23.9 24.0
*Normal Cost includes estimated administrative expenses

Page 4
Section III
Economic Assumptions
There are two economic assumptions used in the actuarial valuations performed for the System.
They are:
Price Inflation
Investment Return
Actuarial Standard of Practice (ASOP) No. 27, “Selection of Economic Assumptions for
Measuring Pension Obligations” provides guidance to actuaries in selecting economic
assumptions for measuring obligations under defined benefit plans. ASOP No. 27 was revised in
September, 2013 and no longer includes the concept of a “best estimate range”. Instead, the
revised standard now requires that each economic assumption selected by the actuary should be
reasonable which means it has the following characteristics:
It is appropriate for the purpose of the measurement;
It reflects the actuary’s professional judgment;
It takes into account historical and current economic data that is relevant as of the
measurement date;
It reflects the actuary’s estimate of future experience, the actuary’s observation of the
estimates inherent in market data, or a combination thereof; and
It has no significant bias (i.e., it is not significantly optimistic or pessimistic), except when
provisions for adverse deviation or plan provisions that are difficult to measure are included
and disclosed, or when alternative assumptions are used for the assessment of risk.
Each economic assumption should individually satisfy this standard. Furthermore, with respect to
any particular valuation, each economic assumption should be consistent with every other
economic assumption over the measurement period.
In our opinion, the economic assumptions recommended in this report have been developed in
accordance with ASOP No. 27. The following table shows our recommendations followed by
detailed discussions of each assumption.
Item Current Proposed
Price Inflation 3.00% 2.75%
Real Rate of Return* 4.50 4.75
Investment Return 7.50% 7.50%
*Net of Investment Expenses

Page 5
Price Inflation
Background: As can be seen from the table on the previous page, assumed price inflation is used
as the basis for the investment return assumption. This latter assumption will be discussed in detail
in the following section.
It is important that the price inflation assumption be consistently applied throughout the economic
assumptions utilized in an actuarial valuation. This is called for in ASOP No. 27 and is also
required to meet the parameters for determining pension liabilities and expense under
Governmental Accounting Standards Board (GASB) Statements No. 67 and 68.
The current price inflation assumption is 3.00% per year.
Past Experience: The Consumer Price Index, US City Average, All Urban Consumers, CPI (U),
has been used as the basis for reviewing historical levels of price inflation. The level of that index
in June of each of the last 50 years is provided in Appendix A.
In analyzing this data, annual rates of inflation have been determined by measuring the compound
growth rate of the CPI (U) over various time periods. The results are as follows:
Period Number of
Years Inflation
Annual
Standard Deviation
2004-2014 10 2.31% 1.81%
1994-2004 10 2.51 0.83
1984-1994 10 3.62 1.06
1974-1984 10 7.78 3.39
1964-1974 10 4.68 2.63
1994-2014 20 2.41% 1.37%
1984-2014 30 2.81 1.39
1974-2014 40 4.03 2.99
1964-2014 50 4.16 2.90
1926-2014 88 2.98 4.15

Page 6
The following graph illustrates the historical levels of price inflation measured as of June 30th of
each of the last 50 years and compared to the current 3.00% annual rate currently assumed.
Annual Rate of CPI (U) Increases
Over more recent historical periods, the average annual rate of increase in the CPI-U has been
below 3.00%. The period of high inflation from 1973 to 1982 has a significant impact on the
averages over periods which include these rates. Further, the average rate of 2.98% over the entire
88 year period is close to the average rate of 2.81% for the prior 30 years (1984 to 2014) but the
volatility of the annual rates in the more recent years has been markedly lower as indicated by the
significantly lower annual standard deviations. Many experts attribute the lower average annual
rates and lower volatility to the increased efforts of the Federal Reserve since the early 1980’s to
stabilize price inflation. The severe recession of 2008-2009 resulted in a short period of deflation
followed by low levels of inflation. The Federal Reserve has combated this weak environment
with zero interest rates and quantitative easing. Although the quantitative easing program has
ended, the Federal Reserve has disclosed an inflation target of at least 2.0% annually and will keep
interest rates very low until they see progress toward the target.
-3.00
-1.00
1.00
3.00
5.00
7.00
9.00
11.00
13.00
15.00
19
64
19
66
19
68
19
70
19
72
19
74
19
76
19
78
19
80
19
82
19
84
19
86
19
88
19
90
19
92
19
94
19
96
19
98
20
00
20
02
20
04
20
06
20
08
20
10
20
12
20
14
3.00% CPI (U)

Page 7
Recommendation: It is difficult to accurately predict inflation. Inflation’s short-term volatility
is illustrated by comparing its average rate over the last 10, 30 and 50 years. Although the 10-year
average of 2.31% is lower than the System’s assumed rate of 3.00%, the longer 30, 40 and 50-year
averages of 2.79%, 3.94% and 4.25% respectively, are at or slightly higher than the System’s rate.
The validity of the System’s assumption is, therefore, dependent upon the emphasis one assigns to
the short and long-terms.
Current economic forecasts suggest lower inflation but are generally looking at a shorter time
period than appropriate for our purposes. In the 2014 OASDI Trustees Report, the Chief Actuary
for Social Security bases the 75 year cost projections on an intermediate inflation assumption of
2.7% with a range of 1.7% to 3.7%. We consider that range reasonable, and recommend that
PSERS lower the current price inflation assumption from 3.00 to 2.75 % per year.
Price Inflation Assumption
Current 3.00%
Recommended 2.75%

Page 8
Investment Return
Background: The assumed investment return is one of the most significant assumptions in the
annual actuarial valuation process as it is used to discount the expected benefit payments for all
active, inactive and retired members of the System. Minor changes in this assumption can have a
major impact on valuation results. The investment return assumption should reflect the asset
allocation target for the funds set by the Board of Trustees.
The current assumption is 7.50%, consisting of a price inflation assumption of 3.00% and a real
rate of return assumption of 4.50%. The return is net of all investment expenses.
Past Experience: The assets for the System are valued using a widely accepted asset-smoothing
methodology (5-year smoothing) that fully recognizes the expected investment income and also
recognizes 20% of each year’s investment gain or loss (the difference between actual and
expected investment income). The asset smoothing methodology from 2010 through 2012 was
based on 7-year smoothing and actuarial value was set equal to market value in 2013. The recent
experience over the last five years is shown in the table below.
Year
Ending
6/30
Actuarial Value Market Value
Rate of Return
2010 2.17% 11.59%
2011 4.14 21.65
2012 4.37 2.00
2013 6.84 13.45
2014 9.47 17.37
Average 5.37% 13.02%
The impact of the asset smoothing method can be observed in the table. Very poor asset returns
during 2008 and 2009 are reflected in the actuarial value returns through 2013. While important
to review and analyze, historical returns over such a short time period are not credible for the
purpose of setting the long-term assumed future rate of return.
We next include in our analysis information concerning future expectations for the investment
return assumption. Because of the significant variability in past year-to-year results and the inter-
play of inflation on those results in the short term, we prefer to base our investment return
assumption on the capital market assumptions utilized by the Board in setting investment policy
and the asset allocation established by the Board as a result of that policy. This approach is
referred to as the building block method in ASOP No. 27.

Page 9
Analysis: The current capital market assumptions and asset allocation as provided by the System
are shown in Appendix B. We further assumed that investment returns approximately follow a
lognormal distribution with no correlation between years. The results below provide an expected
range of real rates of return over a 50 year time horizon. Looking at one year results produces an
expected real return of 6.38% but also has a high standard deviation or measurement of volatility.
By expanding the time horizon, the average return does not change much but the volatility
declines significantly. The following table provides a summary of results. The geometric real
rates of return are net of investment expenses.
Time
Span In
Years
Mean
Real
Return
Standard
Deviation
Real Returns by Percentile
5th 25th 50th 75th 95th
1 6.38% 15.36% -16.87% -4.44% 5.29% 16.00% 33.35%
5 5.51% 6.79% -5.27% 0.82% 5.29% 9.95% 17.02%
10 5.40% 4.79% -2.29% 2.11% 5.29% 8.56% 13.46%
20 5.34% 3.38% -0.13% 3.03% 5.29% 7.59% 11.00%
30 5.32% 2.76% 0.84% 3.44% 5.29% 7.17% 9.93%
40 5.32% 2.39% 1.43% 3.69% 5.29% 6.91% 9.30%
50 5.31% 2.14% 1.93% 3.86% 5.29% 6.74% 8.87%
Based on this analysis there is a 50% likelihood that the average real rate of return over a 50-year
period will be 5.29%. it can also be inferred that for the 10 year time span, 5% of the resulting
real rates of return were below -2.29% and 95% were above that. As the time span increases, the
results begin to merge. Over a 50 year time span, the results indicate there is a 25% chance that
real returns will be below 3.86% and a 25% chance they will be above 6.74%. In other words
there is a 50% chance the real returns will be between 3.86% and 6.74 %.
Page 10
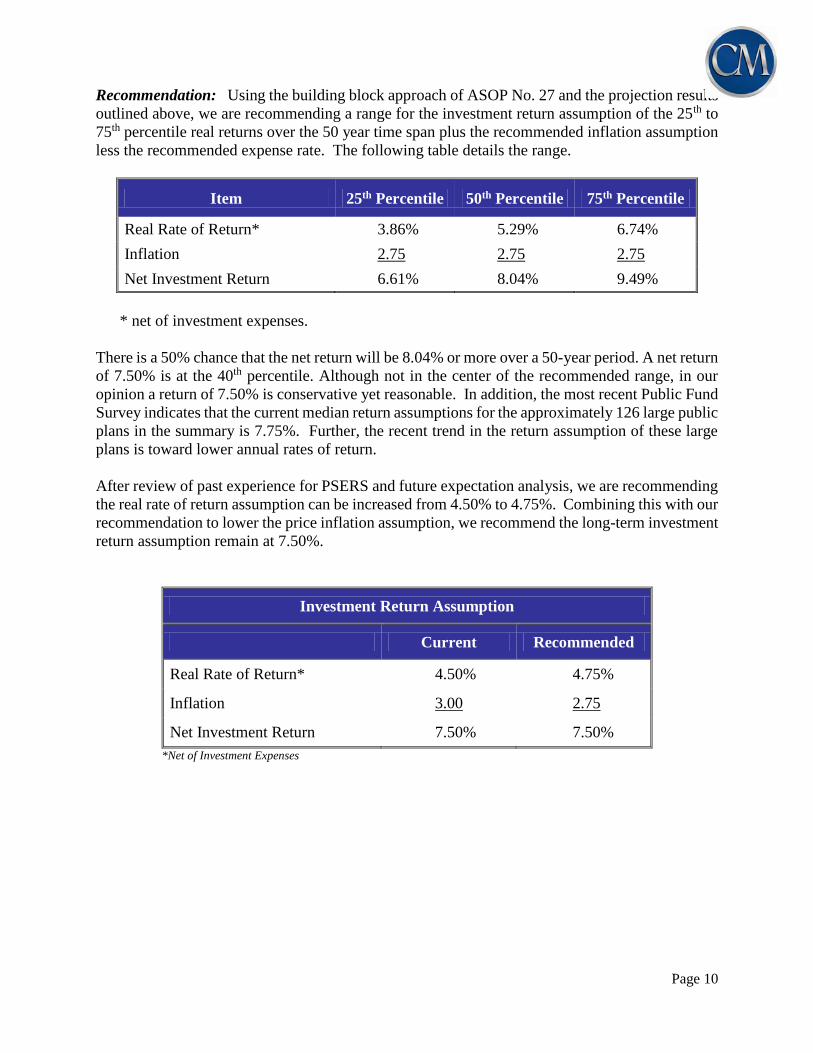
Recommendation: Using the building block approach of ASOP No. 27 and the projection results
outlined above, we are recommending a range for the investment return assumption of the 25th to
75th percentile real returns over the 50 year time span plus the recommended inflation assumption
less the recommended expense rate. The following table details the range.
Item 25th Percentile 50th Percentile 75th Percentile
Real Rate of Return* 3.86% 5.29% 6.74%
Inflation 2.75 2.75 2.75
Net Investment Return 6.61% 8.04% 9.49%
* net of investment expenses.
There is a 50% chance that the net return will be 8.04% or more over a 50-year period. A net return
of 7.50% is at the 40th percentile. Although not in the center of the recommended range, in our
opinion a return of 7.50% is conservative yet reasonable. In addition, the most recent Public Fund
Survey indicates that the current median return assumptions for the approximately 126 large public
plans in the summary is 7.75%. Further, the recent trend in the return assumption of these large
plans is toward lower annual rates of return.
After review of past experience for PSERS and future expectation analysis, we are recommending
the real rate of return assumption can be increased from 4.50% to 4.75%. Combining this with our
recommendation to lower the price inflation assumption, we recommend the long-term investment
return assumption remain at 7.50%.
Investment Return Assumption
Current Recommended
Real Rate of Return* 4.50% 4.75%
Inflation 3.00 2.75
Net Investment Return 7.50% 7.50%
*Net of Investment Expenses

Page 11
Section IV
Demographic Assumptions
There are several demographic assumptions used in the actuarial valuations performed for the
Georgia Public School Employees’ Retirement System. They are:
Rates of Withdrawal
Rates of Disability Retirement
Rates of Service Retirement
Rate of Mortality
The Actuarial Standards Board has issued Actuarial Standard of Practice (ASOP) No. 35,
“Selection of Demographic and Other Noneconomic Assumptions for Measuring Pension
Obligations”, which provides guidance to actuaries in selecting demographic assumptions for
measuring obligations under defined benefit plans. In our opinion, the demographic assumptions
recommended in this report have been developed in accordance with ASOP No. 35.
The purpose of a study of demographic experience is to compare what actually happened to the
membership during the study period (July 1, 2009, through June 30, 2014) with what was expected
to happen based on the assumptions used in the most recent Actuarial Valuations.
Detailed tabulations by age, service and/or gender are performed over the entire study period.
These tabulations look at all active and retired members during the period as well as separately
annotating those who experience a demographic event, also referred to as a decrement. In addition
the tabulation of all members together with the current assumptions permits the calculation of the
number of expected decrements during the study period.
If the actual experience differs significantly from the overall expected results, or if the pattern of
actual decrements, or rates of decrement, by age, gender, or service does not follow the expected
pattern, new assumptions are recommended. Recommended changes usually do not follow the
exact actual experience during the observation period. Judgment is required to extrapolate future
experience from past trends and current member behavior.
The remainder of this section presents the results of the demographic study. We have prepared
tables that show a comparison of the actual and expected decrements and the overall ratio of actual
to expected results (A/E Ratios) under the current assumptions. If a change is being proposed, the
revised A/E Ratios are shown as well.

Page 12
RATES OF WITHDRAWAL
COMPARISON OF ACTUAL AND EXPECTED WITHDRAWALS
FROM ACTIVE SERVICE
CENTRAL Ratio of Ratio of
AGE Actual Expected Actual to Actual Expected Actual to
OF GROUP Expected Expected
20 154 135.7 1.135 74 82.3 0.899
25 390 419.1 0.931 420 447.1 0.939
30 314 360.9 0.870 619 721.1 0.858
35 347 366.3 0.947 875 945.8 0.925
40 433 424.3 1.021 1,114 1,156.0 0.964
45 526 557.2 0.944 1,105 1,141.7 0.968
50 576 613.0 0.940 990 1,020.9 0.970
55 519 535.5 0.969 753 779.2 0.966
60 456 486.7 0.937 498 485.9 1.025
63 & Over 729 626.6 1.163 672 443.4 1.516
TOTAL 4,444 4,525.3 0.982 7,120 7,223.4 0.986
25 44 42.2 1.043 25 28.9 0.865
30 77 103.9 0.741 138 139.4 0.990
35 93 98.2 0.947 317 319.3 0.993
40 122 125.5 0.972 597 617.5 0.967
45 178 179.4 0.992 678 691.7 0.980
50 178 225.0 0.791 621 668.9 0.928
55 231 212.5 1.087 491 488.5 1.005
60 244 228.9 1.066 417 356.7 1.169
63 & Over 759 455.0 1.668 793 415.7 1.908
TOTAL 1,926 1,670.6 1.153 4,077 3,726.6 1.094
30 13 18.0 0.722 6 9.2 0.652
35 33 34.7 0.951 73 65.5 1.115
40 67 57.7 1.161 191 206.6 0.924
45 108 106.4 1.015 454 427.3 1.062
50 166 167.5 0.991 555 625.7 0.887
55 166 174.9 0.949 515 597.1 0.863
58 & Over 67 52.5 1.276 178 193.5 0.920
TOTAL 620 611.7 1.014 1,972 2,124.9 0.928
Withdrawals with less than 5 years of service
Withdrawals with at least 5 but less than 10 years of service
Withdrawals with 10 or greater years of service
NUMBER OF WITHDRAWALS
MALE FEMALE

Page 13
The following graphs show a comparison of the current expected, actual, and proposed rates of
withdrawal for actives.
0.0000
0.0400
0.0800
0.1200
0.1600
0.2000
0.2400
0.2800
0.3200
0.3600
0.4000
20 25 30 35 40 45 50 55 60 63+
AGE
Withdrawal Rates (Service < 5) - Males
Actual Rate Expected Rate Proposed Rate
0.0000
0.0400
0.0800
0.1200
0.1600
0.2000
0.2400
0.2800
0.3200
0.3600
0.4000
20 25 30 35 40 45 50 55 60 63+
AGE
Withdrawal Rates (Service < 5) - Females
Actual Rate Expected Rate Proposed Rate

Page 14
0.0000
0.0200
0.0400
0.0600
0.0800
0.1000
0.1200
0.1400
0.1600
0.1800
0.2000
25 30 35 40 45 50 55 60 63+
AGE
Withdrawal Rates (Service 5-9) - Males
Actual Rate Expected Rate Proposed Rate
0.0000
0.0200
0.0400
0.0600
0.0800
0.1000
0.1200
0.1400
0.1600
0.1800
0.2000
25 30 35 40 45 50 55 60 63+
AGE
Withdrawal Rates (Service 5-9) - Females
Actual Rate Expected Rate Proposed Rate

Page 15
0.0000
0.0200
0.0400
0.0600
0.0800
0.1000
0.1200
0.1400
30 35 40 45 50 55 58+
AGE
Withdrawal Rates (Service 10+) - Males
Actual Rate Expected Rate Proposed Rate
0.0000
0.0200
0.0400
0.0600
0.0800
0.1000
0.1200
0.1400
30 35 40 45 50 55 58+
AGE
Withdrawal Rates (Service 10+) - Females
Actual Rate Expected Rate Proposed Rate

Page 16
The rates of withdrawal adopted by the Board are used to determine the expected number of
separations from active service which will occur as a result of resignation or dismissal. The
preceding results indicate that during the study period the number of withdrawals varied from the
expected in many age categories. We recommend that the rates of withdrawal be revised at this
time to more closely reflect the experience of the System and maintain a degree of conservatism.
COMPARATIVE RATES OF WITHDRAWAL
FROM ACTIVE SERVICE
AGE
0 - 4 5 - 9 10 + 0 - 4 5 - 9 10 +
20 35.00% 37.00%
25 30.00% 17.00% 28.00% 17.00%
30 27.00% 16.00% 14.00% 25.00% 15.00% 12.00%
35 24.00% 14.00% 9.00% 23.00% 13.00% 9.00%
40 21.00% 12.00% 7.00% 21.00% 12.00% 7.50%
45 20.00% 11.00% 6.50% 19.00% 11.00% 6.50%
50 18.00% 11.00% 6.50% 17.00% 9.00% 6.50%
55 15.00% 9.00% 6.00% 15.00% 9.00% 6.00%
60 13.00% 9.00% 0.00% 12.00% 7.50% 0.00%
64 13.00% 9.00% 0.00% 13.50% 11.50% 0.00%
20 34.00% 32.00%
25 29.00% 19.00% 28.00% 18.00%
30 24.00% 15.00% 11.00% 23.00% 15.00% 10.00%
35 20.00% 13.00% 10.00% 19.00% 13.00% 10.00%
40 17.00% 12.00% 8.00% 17.00% 12.00% 8.00%
45 16.00% 10.00% 7.00% 15.50% 10.00% 7.00%
50 14.00% 9.00% 6.50% 14.00% 8.50% 6.00%
55 12.00% 8.00% 6.00% 12.00% 8.00% 5.50%
60 11.00% 7.00% 0.00% 11.00% 7.50% 0.00%
64 11.00% 7.00% 0.00% 12.00% 9.00% 0.00%
Years Of Service Years Of Service
Male
Female
RATES OF WITHDRAWAL
Present Proposed

Page 17
COMPARISON OF ACTUAL AND EXPECTED WITHDRAWALS
BASED ON PROPOSED RATES
CENTRAL Ratio of Ratio of
AGE Actual Expected Actual to Actual Expected Actual to
OF GROUP Expected Expected
20 154 141.7 1.087 74 77.4 0.956
25 390 396.8 0.983 420 433.6 0.969
30 314 339.4 0.925 619 685.3 0.903
35 347 357.1 0.972 875 892.3 0.981
40 433 424.3 1.021 1,114 1,130.0 0.986
45 526 529.3 0.994 1,105 1,119.5 0.987
50 576 585.2 0.984 990 1,014.0 0.976
55 519 535.5 0.969 753 772.4 0.975
60 456 460.8 0.990 498 502.0 0.992
63 & Over 729 650.7 1.120 672 483.7 1.389
TOTAL 4,444 4,420.8 1.005 7,120 7,110.2 1.001
25 44 42.2 1.043 25 27.4 0.912
30 77 93.8 0.821 138 139.4 0.990
35 93 93.1 0.999 317 319.3 0.993
40 122 125.5 0.972 597 607.5 0.983
45 178 179.4 0.992 678 684.4 0.991
50 178 203.4 0.875 621 631.7 0.983
55 231 207.9 1.111 491 488.3 1.006
60 244 233.3 1.046 417 391.5 1.065
63 & Over 759 581.4 1.305 793 534.4 1.484
TOTAL 1,926 1,760.0 1.094 4,077 3,823.9 1.066
30 13 16.2 0.802 6 8.4 0.714
35 33 33.7 0.979 73 65.5 1.115
40 67 60.7 1.104 191 206.6 0.924
45 108 106.4 1.015 454 427.3 1.062
50 166 167.5 0.991 555 588.8 0.943
55 166 174.8 0.950 515 554.5 0.929
58 & Over 67 52.5 1.276 178 182.8 0.974
TOTAL 620 611.8 1.013 1,972 2,033.9 0.970
Withdrawals with less than 5 years of service
Withdrawals with at least 5 but less than 10 years of service
Withdrawals with 10 or greater years of service
NUMBER OF WITHDRAWALS
MALE FEMALE

Page 18
RATES OF DISABILITY RETIREMENT
COMPARISON OF ACTUAL AND EXPECTED DISABILITY RETIREMENTS
CENTRAL Ratio of
AGE Actual Expected Actual to
OF GROUP Expected
37 & Under 0 0.4 0.000
40 1 2.5 0.400
45 10 10.6 0.943
50 27 29.1 0.928
55 60 73.5 0.816
60 92 100.9 0.912
TOTAL 190 217.0 0.876
NUMBER OF DISABILITY RETIREMENTS
The following graph shows a comparison of the current expected, actual, and proposed rates of
disability retirement.
0.00000
0.00100
0.00200
0.00300
0.00400
0.00500
37 & Under 40 45 50 55 60
AGE
Disability Rates
Actual Rate Expected Rate Proposed Rate
During the period under investigation, the actual rates of disability retirement were somewhat less
than expected over all age groups. However since this is a conservative result, we recommend no
change to the rates of disability retirement at this time and will continue to monitor this assumption
to see if future changes are needed.
Page 19
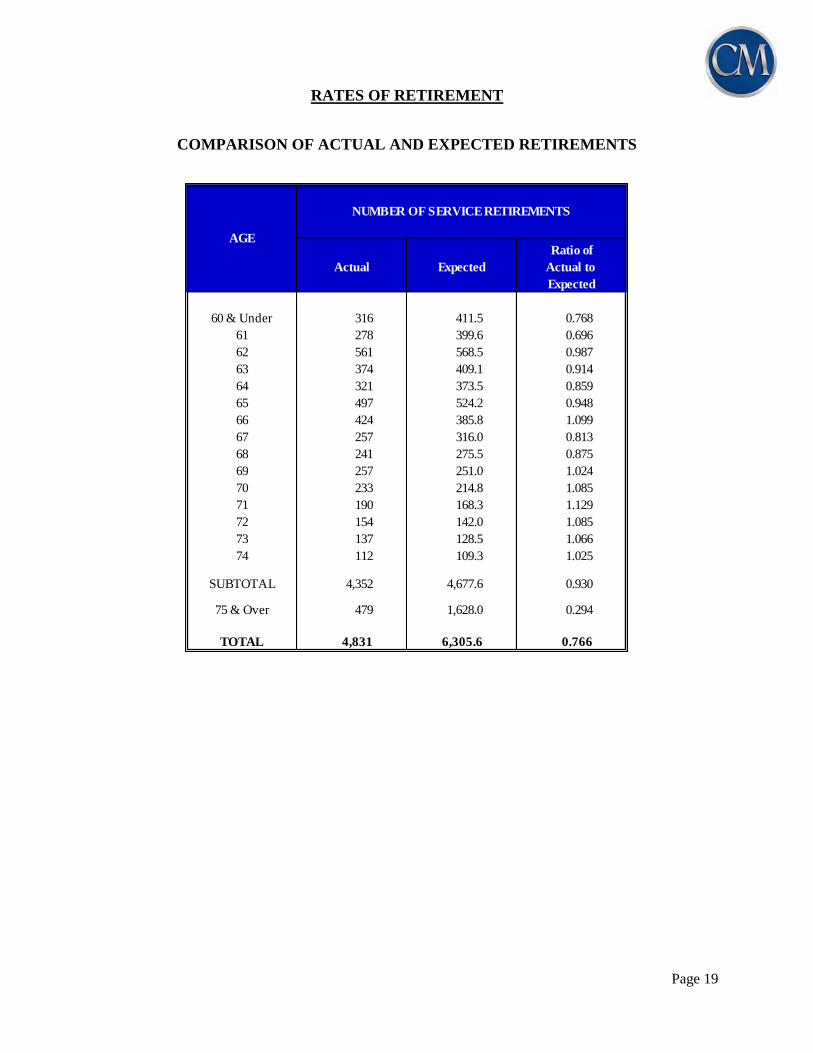
RATES OF RETIREMENT
COMPARISON OF ACTUAL AND EXPECTED RETIREMENTS
Ratio of
Actual Expected Actual to
Expected
60 & Under 316 411.5 0.768
61 278 399.6 0.696
62 561 568.5 0.987
63 374 409.1 0.914
64 321 373.5 0.859
65 497 524.2 0.948
66 424 385.8 1.099
67 257 316.0 0.813
68 241 275.5 0.875
69 257 251.0 1.024
70 233 214.8 1.085
71 190 168.3 1.129
72 154 142.0 1.085
73 137 128.5 1.066
74 112 109.3 1.025
SUBTOTAL 4,352 4,677.6 0.930
75 & Over 479 1,628.0 0.294
TOTAL 4,831 6,305.6 0.766
AGE
NUMBER OF SERVICE RETIREMENTS

Page 20
The following graph shows a comparison of the present, actual, and proposed rates of service
retirements.
0.0000
0.0500
0.1000
0.1500
0.2000
0.2500
0.3000
0.3500
60 61 62 63 64 65 66 67 68 69 70 71 72 73 74
AGE
Retirement Rates
Actual Rate Expected Rate Proposed Rate
The analysis of the experience reflects that the current assumed rates of retirement over-anticipate
retirements at the younger ages and under anticipate retirements at the older ages. We recommend
adjustment to the rates to reflect the experience as well as maintain a reasonable degree of margin.

Page 21
The following table shows a comparison of the present and proposed rates of service retirement.
COMPARATIVE RATES OF RETIREMENT
Present Proposed
60 15.0% 13.0%
61 15.0% 13.0%
62 22.0% 22.0%
63 18.0% 17.5%
64 18.0% 17.0%
65 28.0% 28.0%
66 25.0% 27.0%
67 25.0% 23.0%
68 25.0% 23.0%
69 25.0% 26.0%
70 25.0% 27.0%
71 25.0% 27.0%
72 25.0% 27.0%
73 25.0% 27.0%
74 25.0% 27.0%
75 100.0% 100.0%
AGE RATES OF SERVICE RETIREMENT

Page 22
COMPARISON OF ACTUAL AND EXPECTED RETIREMENTS
BASED ON PROPOSED RATES OF RETIREMENT
Ratio of
Actual Expected Actual to
Expected
60 & Under 316 356.6 0.886
61 278 346.3 0.803
62 561 568.5 0.987
63 374 397.8 0.940
64 321 352.8 0.910
65 497 524.2 0.948
66 424 416.6 1.018
67 257 290.7 0.884
68 241 253.5 0.951
69 257 261.0 0.985
70 233 231.9 1.005
71 190 181.7 1.046
72 154 153.4 1.004
73 137 138.8 0.987
74 112 118.0 0.949
SUBTOTAL 4,352 4,591.8 0.948
75 & Over 479 1,628.0 0.294
TOTAL 4,831 6,219.8 0.777
NUMBER OF SERVICE RETIREMENTS
AGE

Page 23
RATES OF PRE-RETIREMENT MORTALITY
COMPARISON OF ACTUAL AND EXPECTED CASES OF
PRE-RETIREMENT MORTALITY
CENTRAL
AGE
OF GROUP
Actual Expected Actual Expected
20 0 0.2 0.000 0 0.1 0.000
25 0 0.6 0.000 0 0.4 0.000
30 3 1.1 2.727 1 1.2 0.833
35 1 2.2 0.455 0 3.8 0.000
40 4 4.5 0.889 6 10.4 0.577
45 6 9.9 0.606 11 22.8 0.482
50 16 19.8 0.808 15 41.5 0.361
55 22 37.4 0.588 29 64.1 0.452
58 & OVER 92 404.3 0.228 65 366.5 0.177
TOTAL 144 480.0 0.300 127 510.8 0.249
NUMBER OF PRE-RETIREMENT DEATHS
Proposed Rates
MALES FEMALES
Ratio of Actual
to Expected
Ratio of Actual
to Expected
During the period under investigation, the actual rates of death in active service were significantly
less than expected for both males and females at all ages. We recommend that the rates of mortality
in active service for both males and females be changed to the RP-2000 Employee Mortality Table
projected to 2025 with projection scale BB. The following graphs show a comparison of the
present, actual, and proposed rates of pre-retirement mortality.

Page 24
0.00000
0.00100
0.00200
0.00300
0.00400
0.00500
0.00600
0.00700
0.00800
0.00900
35 40 45 50 55 60AGE
Pre-Retirement Mortality Rates - Males
Actual Rate Expected Rate Proposed Rate
0.00000
0.00100
0.00200
0.00300
0.00400
0.00500
0.00600
0.00700
0.00800
0.00900
35 40 45 50 55 60AGE
Pre-Retirement Mortality Rates - Females
Actual Rate Expected Rate Proposed Rate

Page 25
COMPARATIVE RATES OF PRE-RETIREMENT MORTALITY
AGE
Present Proposed Present Proposed
20 0.0357% 0.0320% 0.0191% 0.0177%
25 0.0378% 0.0349% 0.0207% 0.0192%
30 0.0499% 0.0412% 0.0264% 0.0245%
35 0.0841% 0.0717% 0.0475% 0.0441%
40 0.1142% 0.1001% 0.0706% 0.0655%
45 0.1616% 0.1399% 0.1124% 0.1043%
50 0.2449% 0.1983% 0.1676% 0.1555%
55 0.4200% 0.2810% 0.2717% 0.2228%
60 0.7676% 0.4092% 0.5055% 0.3058%
64 1.2737% 0.5330% 0.8619% 0.4015%
RATES OF MORTALITY
MALE FEMALE
COMPARISON OF ACTUAL AND EXPECTED CASES
OF PRE-RETIREMENT DEATHS
BASED ON PROPOSED RATES OF MORTALITY
CENTRAL
AGE
OF GROUP
Actual Expected Actual Expected
20 0 0.1 0.000 0 0.1 0.000
25 0 0.6 0.000 0 0.3 0.000
30 3 0.9 3.333 1 1.1 0.909
35 1 1.9 0.526 0 3.5 0.000
40 4 3.9 1.026 6 9.7 0.619
45 6 8.6 0.698 11 21.2 0.519
50 16 16.2 0.988 15 38.1 0.394
55 22 25.3 0.870 29 51.8 0.560
58 & OVER 92 192.0 0.479 65 196.8 0.330
TOTAL 144 249.5 0.577 127 322.6 0.394
NUMBER OF PRE-RETIREMENT DEATHS
Proposed Rates
MALES FEMALES
Ratio of Actual
to Expected
Ratio of Actual
to Expected

Page 26
RATES OF POST-RETIREMENT MORTALITY
The current basis for rate of post-retirement mortality for service retirees and beneficiaries is the
RP-2000 Combined Mortality Table set forward one year for males. The current basis for rate of
post-retirement mortality for disability retirees is the RP-2000 Disabled Mortality Table set back
two years for males and set forward one year for females. The following shows a comparison of
the actual and expected deaths during the study period.
COMPARISON OF ACTUAL AND EXPECTED CASES
OF POST-RETIREMENT DEATHS
CENTRAL Ratio of Ratio of
AGE Actual Expected Actual to Actual Expected Actual to
OF GROUP Expected Expected
57 & Under 10 0.8 12.500 15 1.2 12.500
60 10 4.0 2.500 26 10.4 2.500
65 52 37.0 1.405 102 89.7 1.137
70 102 94.2 1.083 178 198.5 0.897
75 181 162.6 1.113 269 301.5 0.892
80 230 234.2 0.982 398 375.7 1.059
85 190 220.1 0.863 422 397.5 1.062
90 152 147.2 1.033 415 338.2 1.227
93 & Over 54 57.3 0.942 266 214.3 1.241
TOTAL 981 957.4 1.025 2,091 1,927.0 1.085
NUMBER OF DEATHS AMONG SERVICE RETIREMENTS AND BENEFICIARIES
MALE FEMALE
CENTRAL Ratio of Ratio of
AGE Actual Expected Actual to Actual Expected Actual to
OF GROUP Expected Expected
47 & Under 2 0.5 4.000 0 0.3 0.000
50 1 1.8 0.556 5 1.2 4.167
55 7 6.4 1.094 6 6.1 0.984
60 10 9.8 1.020 16 17.8 0.899
65 14 11.2 1.250 35 29.0 1.207
70 15 11.9 1.261 33 39.6 0.833
75 7 9.6 0.729 34 34.4 0.988
80 10 7.1 1.408 24 20.3 1.182
85 4 4.3 0.930 11 8.7 1.264
90 2 2.1 0.952 5 5.5 0.909
93 & Over 1 0.2 5.000 3 1.7 1.765
TOTAL 73 64.9 1.125 172 164.6 1.045
MALE FEMALE
NUMBER OF DEATHS AMONG DISABILITY RETIREMENTS

Page 27
Overall, the number of actual deaths among all retirements and beneficiaries was greater than the
number of deaths expected during the period under investigation. We recommend the RP-2000
Blue-Collar Mortality Table for service retirements and beneficiaries but in order to provide an
additional margin for anticipated mortality improvement, we recommend projecting the table to
2025 with projection scale BB and setting the table forward 3 years for males and 2 years for
females. Although an updated mortality table and mortality improvement scale have been
published by the Society of Actuaries (SOA), the SOA did not include public sector data in the
development of these new tables and relied on private sector data only. The SOA is currently
reviewing mortality for the public sector and may issue a new table in time for the next experience
study.
For the period after disability retirement, we recommend the RP-2000 Disabled Mortality Table
projected to 2025 with scale BB set forward 5 years for both males and females. The following
graphs show a comparison of the present, actual, and proposed rates of post-retirement mortality.

Page 28
0.000000
0.050000
0.100000
0.150000
0.200000
0.250000
0.300000
0.350000
60 65 70 75 80 85 90 93 & Over
AGE
Healthy Mortality Rates - Males
Actual Rate Expected Rate Proposed Rate
0.000000
0.050000
0.100000
0.150000
0.200000
0.250000
0.300000
60 65 70 75 80 85 90 93 & Over
AGE
Healthy Mortality Rates - Females
Actual Rate Expected Rate Proposed Rate

Page 29
0.000000
0.020000
0.040000
0.060000
0.080000
0.100000
0.120000
0.140000
0.160000
0.180000
0.200000
0.220000
0.240000
50 55 60 65 70 75 80 85
AGE
Disability Mortality Rates - Males
Actual Rate Expected Rate Proposed Rate
0.000000
0.020000
0.040000
0.060000
0.080000
0.100000
0.120000
0.140000
0.160000
0.180000
0.200000
0.220000
0.240000
50 55 60 65 70 75 80 85
AGE
Disability Mortality Rates - Females
Actual Rate Expected Rate Proposed Rate

Page 30
The following tables show a comparison of the present and proposed rates of post-retirement
mortality.
COMPARATIVE RATES OF POST-RETIREMENT MORTALITY
AGE
Present Proposed Present Proposed
35 0.0841% 0.1171% 0.0475% 0.0597%
40 0.1142% 0.1476% 0.0706% 0.0995%
45 0.1616% 0.1974% 0.1124% 0.1484%
50 0.2449% 0.3057% 0.1676% 0.2084%
55 0.4200% 0.5644% 0.2717% 0.2844%
60 0.7676% 0.9575% 0.5055% 0.5014%
65 1.4409% 1.4859% 0.9706% 0.9774%
70 2.4570% 2.4262% 1.6742% 1.7054%
75 4.2169% 3.9830% 2.8106% 2.7288%
80 7.2041% 6.5238% 4.5879% 4.4542%
85 12.2797% 10.9551% 7.7446% 7.5727%
90 19.9769% 18.5991% 13.1682% 12.7995%
SERVICE RETIREMENTS AND BENEFICIARIES
MALE FEMALE
AGE
Present Proposed Present Proposed
35 2.2571% 2.0938% 0.7450% 0.6911%
40 2.2571% 2.0938% 0.7450% 0.6911%
45 2.2571% 2.6878% 0.8184% 1.0700%
50 2.6404% 3.2877% 1.2477% 1.4595%
55 3.2859% 3.5271% 1.7598% 1.6987%
60 3.9334% 3.7102% 2.2936% 2.0725%
65 4.6584% 4.2891% 2.9594% 2.7830%
70 5.6909% 5.6244% 4.0140% 3.8623%
75 7.3292% 7.4957% 5.5777% 5.3473%
80 9.7640% 9.7046% 7.7135% 7.4098%
85 12.8343% 13.9099% 10.7099% 10.6215%
90 16.2186% 23.0128% 14.9698% 16.7340%
DISABILITY RETIREMENTS
MALE FEMALE

Page 31
COMPARISON OF ACTUAL AND EXPECTED CASES
OF POST-RETIREMENT DEATHS
BASED ON PROPOSED RATES OF MORTALITY
CENTRAL Ratio of Ratio of
AGE Actual Expected Actual to Actual Expected Actual to
OF GROUP Expected Expected
57 & Under 10 1.1 9.091 15 1.4 10.714
60 10 4.7 2.128 26 10.5 2.476
65 52 38.6 1.347 102 89.8 1.136
70 102 93.0 1.097 178 202.3 0.880
75 181 153.4 1.180 269 293.7 0.916
80 230 211.5 1.087 398 365.0 1.090
85 190 196.1 0.969 422 387.2 1.090
90 152 136.9 1.110 415 328.2 1.264
93 & Over 54 58.0 0.931 266 213.0 1.249
TOTAL 981 893.3 1.098 2,091 1,891.1 1.106
MALE FEMALE
NUMBER OF DEATHS AMONG SERVICE RETIREMENTS AND BENEFICIARIES
CENTRAL Ratio of Ratio of
AGE Actual Expected Actual to Actual Expected Actual to
OF GROUP Expected Expected
47 & Under 2 0.6 3.333 0 0.3 0.000
50 1 2.2 0.455 5 1.4 3.571
55 7 6.8 1.029 6 5.8 1.034
60 10 9.2 1.087 16 16.1 0.994
65 14 10.3 1.359 35 27.3 1.282
70 15 11.7 1.282 33 38.0 0.868
75 7 9.8 0.714 34 32.9 1.033
80 10 7.1 1.408 24 19.5 1.231
85 4 4.7 0.851 11 8.6 1.279
90 2 2.9 0.690 5 6.1 0.820
93 & Over 1 0.3 3.333 3 1.9 1.579
TOTAL 73 65.6 1.113 172 157.9 1.089
NUMBER OF DEATHS AMONG DISABILITY RETIREMENTS
MALE FEMALE

Page 32
Section V
Other Assumptions and Methods and Administrative Procedures
ADMINISTRATIVE EXPENSES: Currently, the method used for administrative expenses is to
add the budgeted expenses for the fiscal year to the normal cost. We recommend no change to this
method
AMORTIZATION METHOD: Currently, the unfunded accrued liability is amortized using a
level dollar amortization method. We recommend no change to this amortization method.
ASSETS: Currently, the actuarial value of assets recognizes a portion of the difference between
the market value of assets and the expected actuarial value of assets, based on the assumed
valuation rate of return. The amount recognized each year is 20% of the difference between market
value and expected actuarial value. We recommend maintaining the current smoothing method.
COST OF LIVING: Currently, we assume cost of living increases of 1.5% semi-annually. We
recommend maintaining this assumption.
OPTION FACTORS: The option factors currently used by the Retirement System are based on
the mortality tables and investment rate of return (discount rate) used in the valuation. We
recommend that the factors be revised to the mortality table recommended in this experience study.
ASSUMPTION FOR ACTIVE VESTED MEMBERS TERMINATION BENEFITS:
Currently, we assume that 25% of active members who terminate with ten or more years of service
before retirement will receive a benefit beginning at age 60 and 75% will receive a refund of
member contributions. We recommend changing this to assume that 50% will receive a benefit
and 50% will receive a refund of member contributions.
VALUATION COST METHOD: Currently, the valuation uses the entry age actuarial cost
method. This is the most widely used cost method of large public sector plans and has
demonstrated the highest degree of stability as compared to alternative methods. We recommend
no change to this assumption.

Page 33
APPENDIX A
Historical June CPI (U) Index
Year CPI (U) Year CPI (U)
1961 29.8 1988 118.0
1962 30.2 1989 124.1
1963 30.6 1990 129.9
1964 31.0 1991 136.0
1965 31.6 1992 140.2
1966 32.4 1993 144.4
1967 33.3 1994 148.0
1968 34.7 1995 152.5
1969 36.6 1996 156.7
1970 38.8 1997 160.3
1971 40.6 1998 163.0
1972 41.7 1999 166.2
1973 44.2 2000 172.4
1974 49.0 2001 178.0
1975 53.6 2002 179.9
1976 56.8 2003 183.7
1977 60.7 2004 189.7
1978 65.2 2005 194.5
1979 72.3 2006 202.9
1980 82.7 2007 208.352
1981 90.6 2008 218.815
1982 97.0 2009 215.693
1983 99.5 2010 217.965
1984 103.7 2011 225.722
1985 107.6 2012 229.478
1986 109.5 2013 233.504
1987 113.5 2014 238.343

Page 34
APPENDIX B
Capital Market Assumptions and Asset Allocation
Real Rates of Return and Standard Deviations by Asset Class
Asset Class Expected Real Rate of Return Standard Deviation
Fixed Income 0.0% 9.0%
Domestic Stocks – Large Cap 9.0% 21.5%
Domestic Stocks – Mid Cap 12.0% 24.5%
Domestic Stocks – Small Cap 13.5% 34.0%
Int’l Stocks - Developed Mkt 8.0% 19.0%
Int’l Stocks - Emerging Mkt 12.0% 27.0%
Alternatives 10.5% 27.5%
Asset Class Correlation Coefficients
Asset Class
Fixed
Income
Domestic
Stocks –
Large
Cap
Domestic
Stocks –
Mid
Cap
Domestic
Stocks –
Small
Cap
Int’l
Stocks -
Developed
Mkt
Int’l
Stocks -
Emerging
Mkt
Alts
Fixed Income 1.00
Domestic Stocks – Large Cap 0.18 1.00
Domestic Stocks – Mid Cap 0.18 0.94 1.00
Domestic Stocks – Small Cap 0.14 0.83 0.90 1.00
Int’l Stocks - Developed Mkt 0.15 0.63 0.65 0.51 1.00
Int’l Stocks - Emerging Mkt 0.08 0.67 0.70 0.65 0.69 1.00
Alternatives 0.32 0.75 0.80 0.83 0.65 0.63 1.00
Asset Allocation Targets
Asset Class Asset Allocation
Fixed Income 30.0%
US Large Stocks 39.7%
US Mid Stocks 3.7%
US Small Stocks 1.6%
Int’l Developed Mkt Stocks 18.9%
Int’l Emerging Mkt Stocks 6.1%

Page 35
APPENDIX C
TABLE 1
RATES OF SEPARATION FROM ACTIVE SERVICE – MALES
AGE 0 - 4 5 - 9 10+ Death Disability
19 0.37000 0.000307
20 0.37000 0.000320
21 0.36000 0.000331
22 0.34000 0.000340
23 0.29000 0.17000 0.000346
24 0.29000 0.17000 0.000349
25 0.28000 0.17000 0.000349
26 0.28000 0.17000 0.000351
27 0.28000 0.17000 0.000354
28 0.27000 0.16000 0.13500 0.000365
29 0.26000 0.15000 0.13000 0.000382
30 0.25000 0.15000 0.12000 0.000412
31 0.24000 0.14000 0.12000 0.000463 0.000005
32 0.24000 0.14000 0.12000 0.000521 0.000005
33 0.24000 0.14000 0.11000 0.000585 0.000010
34 0.24000 0.13000 0.10000 0.000651 0.000010
35 0.23000 0.13000 0.09000 0.000717 0.000025
36 0.23000 0.13000 0.09000 0.000780 0.000035
37 0.22000 0.12000 0.08000 0.000839 0.000050
38 0.22000 0.12000 0.08000 0.000894 0.000080
39 0.22000 0.12000 0.08000 0.000947 0.000095
40 0.21000 0.12000 0.07500 0.001001 0.000110
41 0.21000 0.12000 0.07500 0.001059 0.000160
42 0.20000 0.12000 0.07000 0.001127 0.000215
43 0.19000 0.11000 0.07000 0.001205 0.000270
44 0.19000 0.11000 0.06500 0.001296 0.000320
45 0.19000 0.11000 0.06500 0.001399 0.000370
46 0.19000 0.11000 0.06500 0.001499 0.000465
47 0.19000 0.11000 0.06500 0.001609 0.000565
48 0.19000 0.11000 0.06500 0.001725 0.000665
49 0.18000 0.10000 0.06500 0.001851 0.000765
50 0.17000 0.09000 0.06500 0.001983 0.000865
51 0.16000 0.09000 0.06500 0.002122 0.001015
52 0.16000 0.09000 0.06500 0.002271 0.001165
53 0.16000 0.09000 0.06500 0.002431 0.001750
54 0.16000 0.09000 0.06000 0.002609 0.002000
55 0.15000 0.09000 0.06000 0.002810 0.002250
56 0.15000 0.09000 0.05500 0.003067 0.002500
57 0.13000 0.09000 0.05000 0.003282 0.003000
58 0.12000 0.09000 0.04500 0.003526 0.003250
59 0.12000 0.08500 0.04500 0.003797 0.003500
60 0.12000 0.07500 0.004092 0.003500 0.13000
61 0.12000 0.09000 0.004403 0.003500 0.13000
62 0.13500 0.11500 0.004721 0.003500 0.22000
63 0.13500 0.11500 0.005034 0.003500 0.17500
64 0.13500 0.11500 0.005330 0.003500 0.17000
65 0.13500 0.11500 0.005600 0.28000
66 0.13500 0.11500 0.005839 0.27000
67 0.13500 0.11500 0.006044 0.23000
68 0.13500 0.11500 0.006215 0.23000
69 0.13500 0.11500 0.006518 0.26000
70 0.13500 0.11500 0.006800 0.27000
71 0.13500 0.11500 0.016839 0.27000
72 0.13500 0.11500 0.018697 0.27000
73 0.13500 0.11500 0.020825 0.27000
74 0.13500 0.11500 0.023233 0.27000
75 0.00000 0.00000 0.025929 1.00000
Rates of Withdrawal
Service
Retirement

Page 36
TABLE 2
RATES OF SEPARATION FROM ACTIVE SERVICE – FEMALES
AGE 0 - 4 5 - 9 10+ Death Disability
19 0.32000 0.000176
20 0.32000 0.000177
21 0.32000 0.000178
22 0.32000 0.000180
23 0.32000 0.18000 0.000183
24 0.30000 0.18000 0.000186
25 0.28000 0.18000 0.000192
26 0.28000 0.18000 0.000199
27 0.26000 0.18000 0.000207
28 0.25000 0.15000 0.10000 0.000218
29 0.23000 0.15000 0.10000 0.000230
30 0.23000 0.15000 0.10000 0.000245
31 0.22000 0.15000 0.10000 0.000285 0.000005
32 0.21000 0.15000 0.10000 0.000325 0.000005
33 0.20000 0.14000 0.10000 0.000365 0.000010
34 0.19000 0.13000 0.10000 0.000404 0.000010
35 0.19000 0.13000 0.10000 0.000441 0.000025
36 0.19000 0.13000 0.10000 0.000477 0.000035
37 0.18000 0.12500 0.10000 0.000514 0.000050
38 0.18000 0.12000 0.09000 0.000555 0.000080
39 0.18000 0.12000 0.09000 0.000601 0.000095
40 0.17000 0.12000 0.08000 0.000655 0.000110
41 0.16000 0.12000 0.08000 0.000718 0.000160
42 0.16000 0.11000 0.08000 0.000790 0.000215
43 0.16000 0.11000 0.08000 0.000869 0.000270
44 0.16000 0.10500 0.07000 0.000955 0.000320
45 0.15500 0.10000 0.07000 0.001043 0.000370
46 0.15000 0.10000 0.07000 0.001135 0.000465
47 0.15000 0.09000 0.07000 0.001230 0.000565
48 0.15000 0.09000 0.06500 0.001330 0.000665
49 0.14000 0.08500 0.06000 0.001438 0.000765
50 0.14000 0.08500 0.06000 0.001555 0.000865
51 0.14000 0.08500 0.06000 0.001683 0.001015
52 0.13500 0.08000 0.06000 0.001825 0.001165
53 0.13500 0.08000 0.05500 0.001981 0.001750
54 0.13000 0.08000 0.05500 0.002100 0.002000
55 0.12000 0.08000 0.05500 0.002228 0.002250
56 0.12000 0.07500 0.05000 0.002371 0.002500
57 0.11000 0.07500 0.04500 0.002525 0.003000
58 0.11000 0.07500 0.04500 0.002692 0.003250
59 0.11000 0.07500 0.04000 0.002871 0.003500
60 0.11000 0.07500 0.003058 0.003500 0.13000
61 0.12000 0.07500 0.003250 0.003500 0.13000
62 0.12000 0.08500 0.003443 0.003500 0.22000
63 0.12000 0.09000 0.003726 0.003500 0.17500
64 0.12000 0.09000 0.004015 0.003500 0.17000
65 0.12000 0.09000 0.004304 0.28000
66 0.12000 0.09000 0.004590 0.27000
67 0.12000 0.09000 0.004868 0.23000
68 0.12000 0.09000 0.005136 0.23000
69 0.12000 0.09000 0.005390 0.26000
70 0.12000 0.09000 0.005630 0.27000
71 0.12000 0.09000 0.013739 0.27000
72 0.12000 0.09000 0.015281 0.27000
73 0.12000 0.09000 0.016986 0.27000
74 0.12000 0.09000 0.018826 0.27000
75 0.00000 0.00000 0.020784 1.00000
Rates of Withdrawal
Service
Retirement

Page 37
TABLE 3
RATES OF MORTALITY FOR MEMBERS RETIRED ON ACCOUNT OF SERVICE
AND BENEFICIARIES OF DECEASED MEMBERS
AGE MALES FEMALES AGE MALES FEMALES
19 0.000340 0.000178 71 0.026765 0.018905
20 0.000346 0.000180 72 0.029559 0.020840
21 0.000349 0.000183 73 0.032686 0.022841
22 0.000349 0.000186 74 0.036100 0.024982
23 0.000351 0.000192 75 0.039830 0.027288
24 0.000354 0.000199 76 0.043908 0.029886
25 0.000365 0.000207 77 0.048349 0.032811
26 0.000382 0.000218 78 0.053569 0.036200
27 0.000673 0.000230 79 0.059187 0.040104
28 0.000742 0.000272 80 0.065238 0.044542
29 0.000812 0.000304 81 0.071733 0.049549
30 0.000880 0.000340 82 0.078867 0.055210
31 0.000945 0.000383 83 0.086598 0.061450
32 0.001008 0.000429 84 0.097448 0.068280
33 0.001067 0.000481 85 0.109551 0.075727
34 0.001119 0.000537 86 0.122941 0.083791
35 0.001171 0.000597 87 0.137847 0.092252
36 0.001220 0.000663 88 0.152743 0.103665
37 0.001272 0.000736 89 0.168812 0.115625
38 0.001330 0.000814 90 0.185991 0.127995
39 0.001399 0.000901 91 0.204007 0.140681
40 0.001476 0.000995 92 0.223224 0.153204
41 0.001564 0.001091 93 0.250467 0.165667
42 0.001663 0.001189 94 0.271263 0.181190
43 0.001757 0.001287 95 0.285234 0.194718
44 0.001861 0.001384 96 0.306313 0.202595
45 0.001974 0.001484 97 0.319624 0.214644
46 0.002100 0.001588 98 0.341120 0.220284
47 0.002237 0.001699 99 0.353540 0.232882
48 0.002545 0.001821 100 0.373578 0.242074
49 0.002778 0.001946 101 0.382320 0.259472
50 0.003057 0.002084 102 0.397886 0.272162
51 0.003379 0.002234 103 0.400000 0.293116
52 0.003892 0.002342 104 0.400000 0.307811
53 0.004608 0.002466 105 0.400000 0.322725
54 0.005092 0.002632 106 0.400000 0.337441
55 0.005644 0.002844 107 0.400000 0.351544
56 0.006244 0.003107 108 0.400000 0.364617
57 0.006938 0.003437 109 0.400000 0.376246
58 0.007713 0.003849 110 0.400000 0.386015
59 0.008594 0.004394 111 0.400000 0.393507
60 0.009575 0.005014 112 0.400000 0.398308
61 0.010474 0.005900 113 0.400000 0.400000
62 0.011491 0.006755 114 0.400000 0.400000
63 0.012656 0.007689 115 0.400000 0.400000
64 0.013737 0.008754 116 0.400000 0.400000
65 0.014859 0.009774 117 1.000000 0.400000
66 0.016410 0.010882 118 1.000000 1.000000
67 0.018338 0.012118 119 1.000000 1.000000
68 0.020106 0.013779 120 1.000000 1.000000
69 0.022062 0.015332
70 0.024262 0.017054

Page 38
TABLE 4
RATES OF MORTALITY FOR MEMBERS RETIRED ON ACCOUNT OF DISABILITY
AGE MALES FEMALES AGE MALES FEMALES
19 0.020938 0.006911 71 0.059591 0.041246
20 0.020938 0.006911 72 0.063153 0.044032
21 0.020938 0.006911 73 0.066917 0.046990
22 0.020938 0.006911 74 0.070859 0.050131
23 0.020938 0.006911 75 0.074957 0.053473
24 0.020938 0.006911 76 0.079187 0.057039
25 0.020938 0.006911 77 0.083527 0.060857
26 0.020938 0.006911 78 0.087959 0.064954
27 0.020938 0.006911 79 0.092468 0.069358
28 0.020938 0.006911 80 0.097046 0.074098
29 0.020938 0.006911 81 0.101687 0.079197
30 0.020938 0.006911 82 0.109122 0.084679
31 0.020938 0.006911 83 0.116934 0.090559
32 0.020938 0.006911 84 0.125144 0.096851
33 0.020938 0.006911 85 0.139099 0.106215
34 0.020938 0.006911 86 0.155385 0.116438
35 0.020938 0.006911 87 0.172787 0.127572
36 0.020938 0.006911 88 0.191152 0.139427
37 0.020938 0.006911 89 0.210317 0.153358
38 0.020938 0.006911 90 0.230128 0.167340
39 0.020938 0.006911 91 0.250467 0.181190
40 0.020938 0.006911 92 0.271263 0.194718
41 0.022121 0.007592 93 0.285234 0.202595
42 0.023306 0.008311 94 0.306313 0.214644
43 0.024493 0.009068 95 0.319624 0.220284
44 0.025684 0.009865 96 0.341120 0.232882
45 0.026878 0.010700 97 0.353540 0.242074
46 0.028078 0.011574 98 0.373578 0.259472
47 0.029279 0.012482 99 0.382320 0.272162
48 0.030481 0.013418 100 0.397886 0.293116
49 0.031681 0.014019 101 0.400000 0.307811
50 0.032877 0.014595 102 0.400000 0.322725
51 0.034074 0.015140 103 0.400000 0.337441
52 0.034400 0.015650 104 0.400000 0.351544
53 0.034701 0.016124 105 0.400000 0.364617
54 0.034987 0.016567 106 0.400000 0.376246
55 0.035271 0.016987 107 0.400000 0.386015
56 0.035565 0.017395 108 0.400000 0.393507
57 0.035881 0.017807 109 0.400000 0.398308
58 0.036234 0.018704 110 0.400000 0.400000
59 0.036637 0.019670 111 0.400000 0.400000
60 0.037102 0.020725 112 0.400000 0.400000
61 0.037645 0.021884 113 0.400000 0.400000
62 0.038275 0.023164 114 0.400000 0.400000
63 0.039002 0.024576 115 1.000000 1.000000
64 0.040855 0.026129 116 1.000000 1.000000
65 0.042891 0.027830 117 1.000000 1.000000
66 0.045123 0.029683 118 1.000000 1.000000
67 0.047566 0.031687 119 1.000000 1.000000
68 0.050230 0.033845 120 1.000000 1.000000
69 0.053122 0.036157
70 0.056244 0.038623
Top Related
