


Languages
Pages
Legal


T&D Support
Community Insights Conference
August 18-21,2015
Minneapolis, MN
2015 Electric T&D Benchmarking
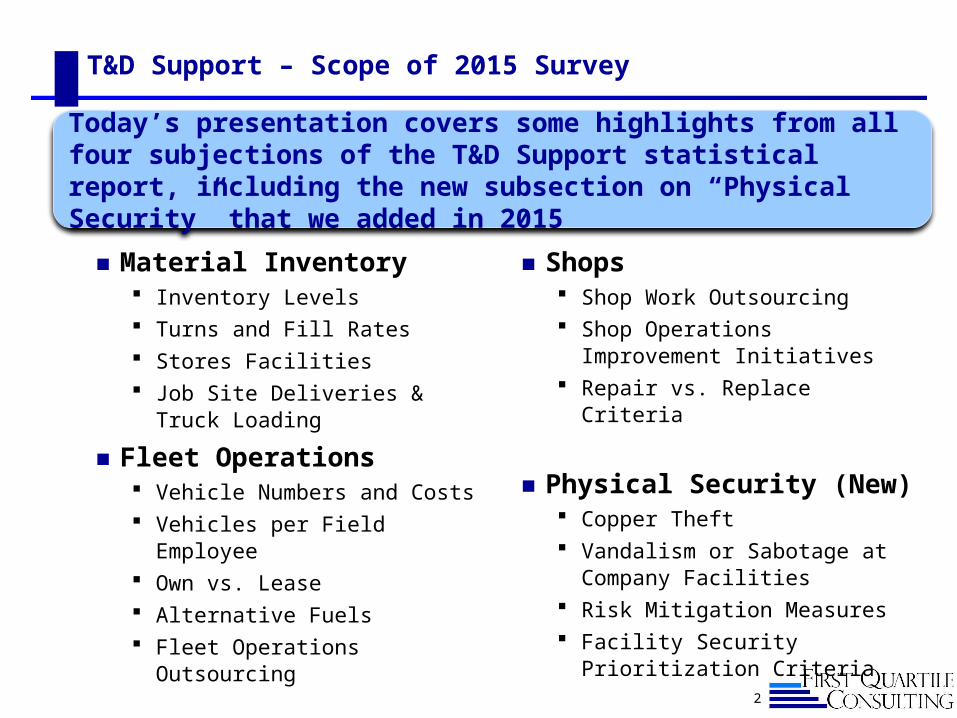
T&D Support – Scope of 2015 Survey
◼Material Inventory Inventory Levels Turns and Fill Rates Stores Facilities Job Site Deliveries & Truck
Loading
◼Fleet Operations Vehicle Numbers and Costs Vehicles per Field Employee Own vs. Lease Alternative Fuels Fleet Operations Outsourcing
◼Shops Shop Work Outsourcing Shop Operations Improvement
Initiatives Repair vs. Replace Criteria
◼Physical Security (New) Copper Theft Vandalism or Sabotage at Company
Facilities Risk Mitigation Measures Facility Security Prioritization
Criteria
2
Today’s presentation covers some highlights from all four subjections of the T&D Support statistical report, including the new subsection on “Physical Security” that we added in 2015

3
Material Inventory
T&D Material Inventory Levels
4
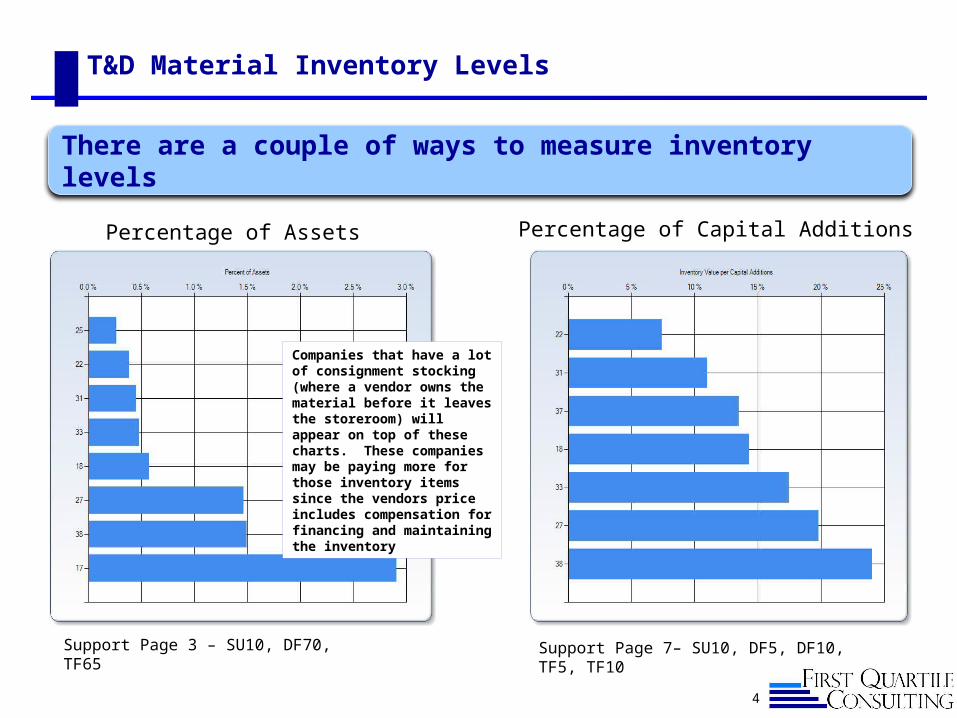
Percentage of Assets Percentage of Capital Additions
There are a couple of ways to measure inventory levels
Companies that have a lot of consignment stocking (where a vendor owns the material before it leaves the storeroom) will appear on top of these charts. These companies may be paying more for those inventory items since the vendors price includes compensation for financing and maintaining the inventory
Support Page 3 – SU10, DF70, TF65 Support Page 7– SU10, DF5, DF10, TF5, TF10

Inventory Turns and Order Fill Rates (Higher is Better)
5
Fill Rate %Turns per Year
Support Page 11 -- SU25
We expect to see tradeoffs, but a few companies are achieving better than average results on both of these common inventory performance benchmarking measures
Support Page 15 --- SU30

T&D Storeroom Facilities
6
# Storeroom Facilities # Facilities per 1,000 Square Miles
Support Page 28 – SU45
The best way to evaluate this is on a per square mile basis. Most companies have between 1 and 4 storerooms per 1,000 square miles
Support Page 30 – SU45, ST30

Job Site Deliveries and Truck Loading
7
% Material Delivered Directly to Job Site % Material Loaded on Crew Trucks
Support Page 32 – SU60
There are wide variations in how materials are provided to crews
Support Pages 33 and 34 -- SU61, SU62
Other:
33 – Loaded throughout the day and delivered to job sites
31 – Deliveries to crews
18 – Loaded by stores staff in the morning
17 – Loaded by crews and warehouse staff upon arrival of trucks

8
Fleet Operations
Se-ries1
0
0.5
1
1.5
2
2.5
3
3.5
4
Vehicles per Circ
Mile
Pa
sse
ng
er
Ve
hic
les
Ae
ria
l lift
tru
ck: s
ing
le b
...
Ae
ria
l lift
tru
ck: d
ou
ble
b...
Lin
e T
ruck
s D
err
ick
Dig
...
Ba
ckh
oe
He
avy
co
nst
ruc.
..
Me
diu
m T
ruck
GV
W1
0k
l...
He
avy
Tru
ck G
VW
26
k lb
s
$0
$10,000
$20,000
$30,000
$40,000
$50,000
$60,000
$70,000
$80,000
Cost per Vehicle
(Note the wide ranges of costs for
some classes)
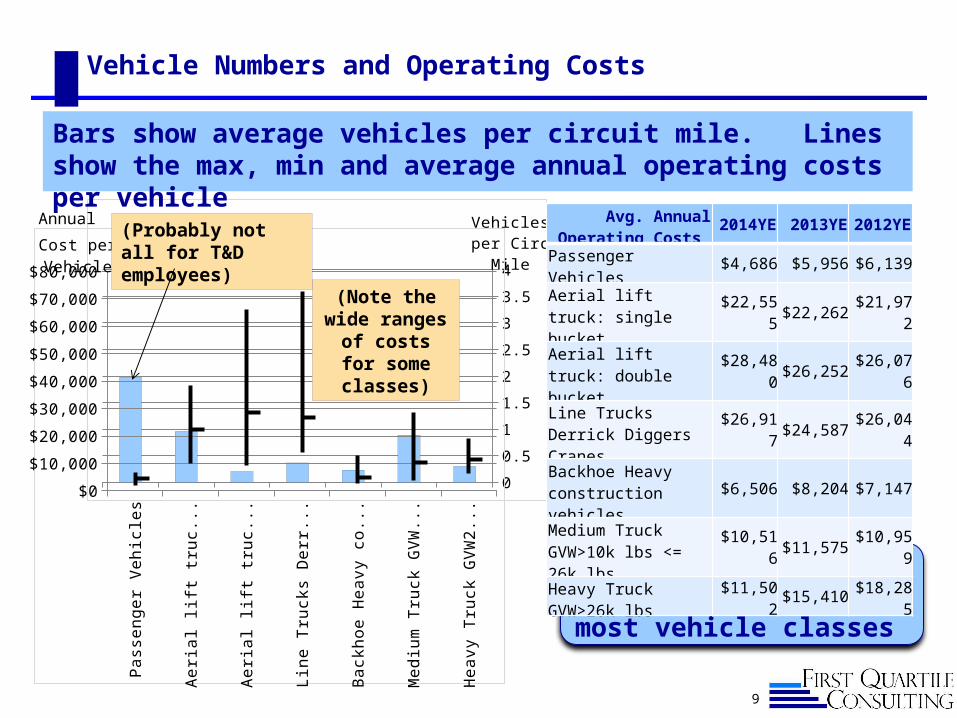
Vehicle Numbers and Operating Costs
Bars show average vehicles per circuit mile. Lines show the max, min and average annual operating costs per vehicle
9
Operating costs have been decreasing for most vehicle classes
(Probably not all for T&D employees)
Annual Avg. Annual Operating Costs
2014YE 2013YE 2012YE
Passenger Vehicles $4,686 $5,956 $6,139
Aerial lift truck: single bucket
$22,555 $22,262 $21,972
Aerial lift truck: double bucket
$28,480 $26,252 $26,076
Line Trucks Derrick Diggers Cranes
$26,917 $24,587 $26,044
Backhoe Heavy construction vehicles
$6,506 $8,204 $7,147
Medium Truck GVW>10k lbs <= 26k lbs
$10,516 $11,575 $10,959
Heavy Truck GVW>26k lbs
$11,502 $15,410 $18,285

10
Support Pages 55, 59, 60 and 61 -- SU125, SU135
Owned vs. Leased Vehicles and Percent Alternative Fuel Use
7 of 10 reporting companies own most of their vehicles. Only 2 of 10 show large percentages of alternative fuel use for the larger trucks that T&D uses
Vehicle Class 17 18 21 22 25 27 28 30 31 33 37 38
Passenger vehicles 100 100 100 0 12 NR NR 0 100 100 100 100Aerial lift truck: single bucket 100 50 0 10 NR NR 1 100 100 100 100Aerial lift truck: double bucket 100 100 64 0 0 NR NR 0 100 100 100 100Line trucks, derricks, diggers, cranes 100 100 82 5 9 NR NR 0 100 100 100 100Backhoe, heavy construction vehicles 100 100 0 24 NR NR 8 100 100 100 100Medium Truck GVW10k lbs <= 26k lbs 100 100 100 0 1 NR NR 1 100 100 100 100Heavy Truck GVW26k lbs 100 100 93 0 2 NR NR 3 100 100 100 100
Vehicle Class 17 18 21 22 25 27 28 30 31 33 37 38
Passenger vehicles NR 1 50 20 2 37 7 NR 0 0 44 20Aerial lift truck: single bucket NR 0 0 3 1 25 100 NR 0 0 70 0Aerial lift truck: double bucket NR 0 0 0 3 0 100 NR 0 0 70 0Line trucks, derricks, diggers, cranes NR 0 0 0 0 0 100 NR 0 0 70 0Backhoe, heavy construction vehicles NR 0 0 0 0 100 NR 0 0 0 0Medium Truck GVW10k lbs <= 26k lbs NR 0 0 0 0 2 97 NR 0 0 47 0Heavy Truck GVW26k lbs NR 0 0 0 0 0 100 NR 0 0 79 0
NR = No Response
NR = No Response
% of Vehicles that Are Owned (not leased)
% of Vehicles that Use Alternative Fuel (any type)
11
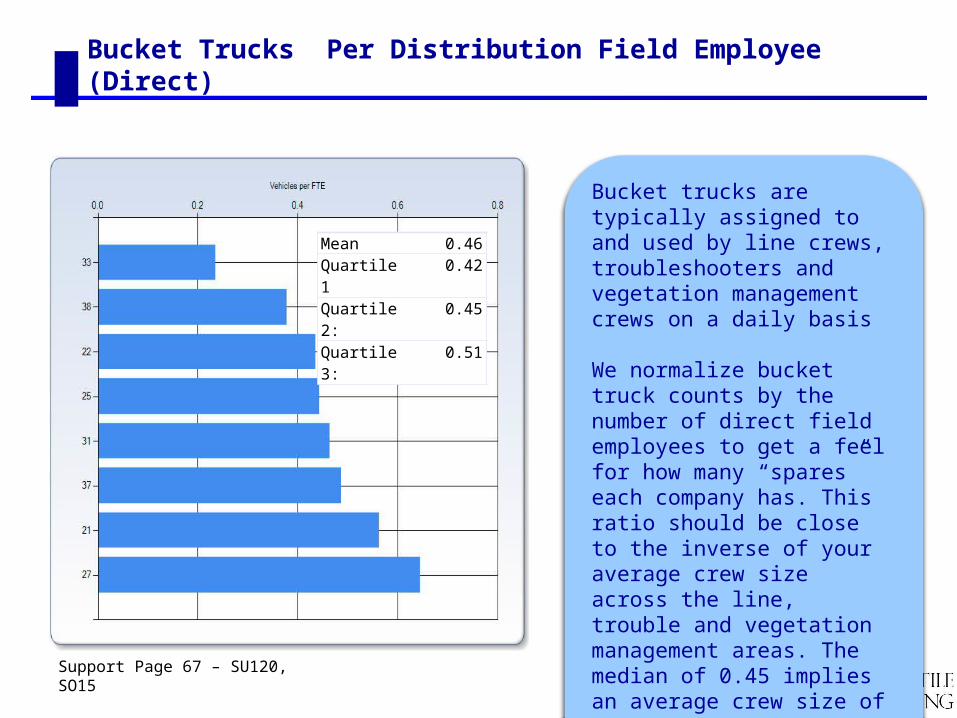
Bucket trucks are typically assigned to and used by line crews, troubleshooters and vegetation management crews on a daily basis
We normalize bucket truck counts by the number of direct field employees to get a feel for how many “spares” each company has. This ratio should be close to the inverse of your average crew size across the line, trouble and vegetation management areas. The median of 0.45 implies an average crew size of 2.2
Support Page 67 – SU120, SO15
Bucket Trucks Per Distribution Field Employee (Direct)
Mean 0.46Quartile 1 0.42Quartile 2: 0.45Quartile 3: 0.51

12
Heavy Equipment Per Circuit Mile
Support Page 53 – SU120, ST35
Typically these categories of equipment are not assigned to or used by all crews on an a daily basis (shared or pooled equipment)
Normalizing by circuit mile provides a rough indication of how much shared equipment is readily available to crews in each geographic area of each utility’s service territory.
The wide variations shown on this chart may be attributable to differences in practices regarding work contracting

13
Fleet Operations Outsourcing
Number of Responding Companies 15 13
Outsourced Functions- % of companies that outsource all or a portion Last Year This Year
Routine maintenance 40% 46%
Road Service 40% 38%
Tire repair & replacement 73% 69%
Engine repairs & overhauls 60% 77%
Transmission repairs & overhauls 80% 77%
Collision and Damage repair 87% 77%
Storage 20% 15%
Towing 87% 85%
Alignment 60% 69%
Glass & Windshield Replacement 87% 85%
Aerial Equipment Inspection 53% 62%
Other 33% 54%
Support Page 65 – SU140
All but one of the responding companies outsource portions of their fleet operations. There is little change in the functional breakdowns from last year.

14
Shops
15
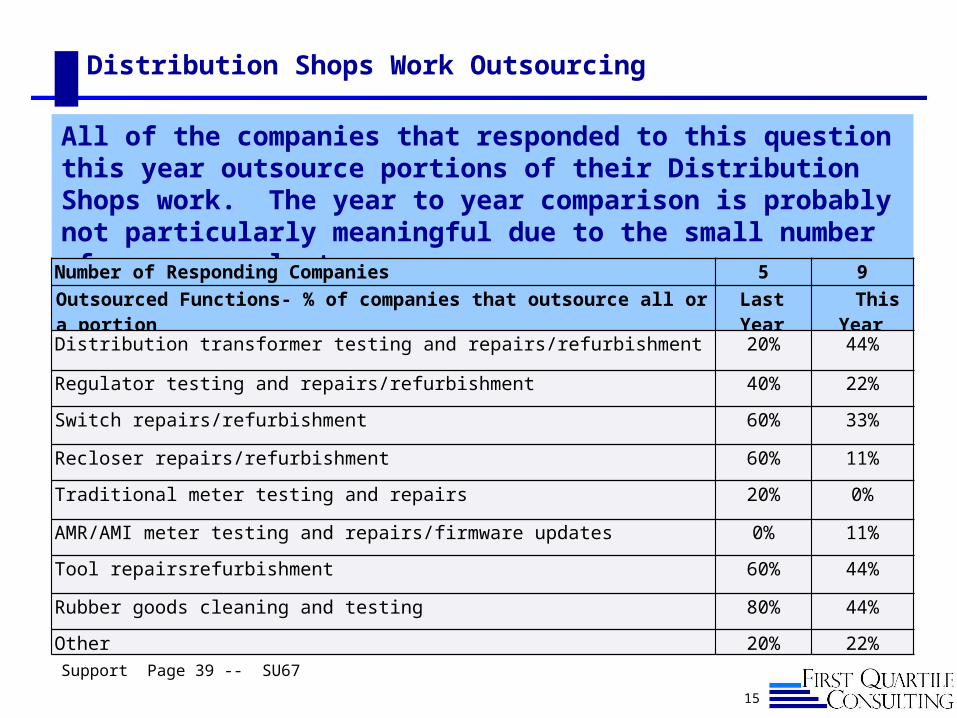
Distribution Shops Work Outsourcing
All of the companies that responded to this question this year outsource portions of their Distribution Shops work. The year to year comparison is probably not particularly meaningful due to the small number of responses last year,
Support Page 39 -- SU67
Number of Responding Companies 5 9
Outsourced Functions- % of companies that outsource all or a portion Last Year This Year
Distribution transformer testing and repairs/refurbishment 20% 44%
Regulator testing and repairs/refurbishment 40% 22%
Switch repairs/refurbishment 60% 33%
Recloser repairs/refurbishment 60% 11%
Traditional meter testing and repairs 20% 0%
AMR/AMI meter testing and repairs/firmware updates 0% 11%
Tool repairsrefurbishment 60% 44%
Rubber goods cleaning and testing 80% 44%
Other 20% 22%

16
Substation Shop Work Outsourcing
All of the companies that responded to this question this year outsource portions of their Substation Shop work. Transformer , switchgear and OCB testing and repairs all show small increases this year
Number of Responding Companies 10 8
Outsourced Functions- % of companies that outsource all or a portion Last Year This Year
Substation transformer testing and repairs/refurbishment 90% 100%
Substation switchgear testing and repairs/refurbishment 40% 50%
Oil Circuit Breaker (OCB) repairs/refurbishment 40% 75%
Air Circuit Breaker (ACB) repairs/refurbishment 50% 50%
Relay testing and repairs/refurbishment 50% 50%
Other 40% 38%
Support Page 45 -- SU90

17
Substation Shop Repair vs. Replace Criteria - Substation Transformers
All companies consider multiple factors when making replace vs. repair decisions for substation transformers, but there appears to be little commonality across companies
Support Page 42 -- SU85
17 Remaining life assessment from testing and DGA analysis
18 It depends on a lot of factors - age, availability of parts, lead time for parts, lead time for new equipment, cost of repair vs. cost of replacement, history of similar assets, etc. In general, if the repair can be performed quick and low cost, it is repaired. If the repair will take a long time, is very expensive, and the asset is old, it will be replaced. We also perform various tests on the transformer to determine its health and use that to help make the decision.
22 We consider the cost, manufacturer and type, age, rewind cost, lead time and damage.
23 Condition Assessment Maintenance Plan through our Central Maintenance Manager System - DGA Yearly Sampling, Ten Year Insulation Electrical Testing - History of Electrical Test data
24 Repair cost estimate must be <50% of the total
25 It's really more of a judgement call if the cost is somewhere around 50% (or below) the value of the asset to determine whether to repair or replace. If over 50% of the value, it gets replaced.
27 Doble Tests, DGA, IR, Visual Inspections
31 Transformer health index calculates many factors to decide if replacement is necessary, otherwise we repair.
33 For replacement and major repairs of Power Transformers we are using a risked based algorithm within our Cascade Database. The algorithm considers current off-line test results, yearly dissolved gas analysis (Main Tank and LTC), transformer criticality, Manufacturer, LTC Type, and Age. Asset Management will then couple this score with Maintenance History and Maintenance Dollars spent to derive a final ranking and asset replacement/repair strategy.
37 Age, parts availability, degree of failure
38 Repair cost and life cycle vs new purchase cost
18
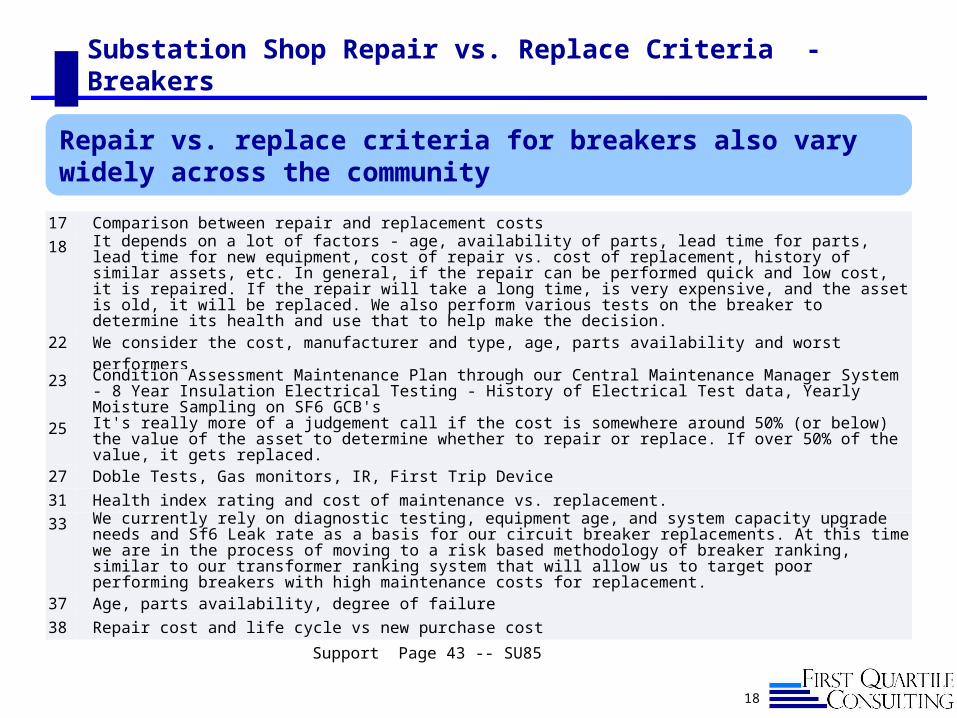
Substation Shop Repair vs. Replace Criteria - Breakers
Repair vs. replace criteria for breakers also vary widely across the community
17 Comparison between repair and replacement costs
18 It depends on a lot of factors - age, availability of parts, lead time for parts, lead time for new equipment, cost of repair vs. cost of replacement, history of similar assets, etc. In general, if the repair can be performed quick and low cost, it is repaired. If the repair will take a long time, is very expensive, and the asset is old, it will be replaced. We also perform various tests on the breaker to determine its health and use that to help make the decision.
22 We consider the cost, manufacturer and type, age, parts availability and worst performers
23 Condition Assessment Maintenance Plan through our Central Maintenance Manager System - 8 Year Insulation Electrical Testing - History of Electrical Test data, Yearly Moisture Sampling on SF6 GCB's
25 It's really more of a judgement call if the cost is somewhere around 50% (or below) the value of the asset to determine whether to repair or replace. If over 50% of the value, it gets replaced.
27 Doble Tests, Gas monitors, IR, First Trip Device
31 Health index rating and cost of maintenance vs. replacement.
33 We currently rely on diagnostic testing, equipment age, and system capacity upgrade needs and Sf6 Leak rate as a basis for our circuit breaker replacements. At this time we are in the process of moving to a risk based methodology of breaker ranking, similar to our transformer ranking system that will allow us to target poor performing breakers with high maintenance costs for replacement.
37 Age, parts availability, degree of failure
38 Repair cost and life cycle vs new purchase cost
Support Page 43 -- SU85

19
Substation Shop Repair vs. Replace Criteria - Relays
Repair vs. replace criteria for relays also vary.
Support Page 44 -- SU85
17 When cost effective
18 It depends on a lot of factors - age, availability of parts, lead time for parts, lead time for new equipment, cost of repair vs. cost of replacement, history of similar assets, etc. For relays, typically multiple relays are used for a protection scheme, so the system needs to be evaluated and a system decision is made.
23 Preventive Maintenance Plan through our SAP System - Maintenance and testing of protection equipment is 4 years - Auxiliary relays are maintain in various intervals between 1 to 2 years which are set up to ensure that the protection system is in good working condition.
25 It's really more of a judgement call if the cost is somewhere around 50% (or below) the value of the asset to determine whether to repair or replace. If over 50% of the value, it gets replaced.
27 Reliability(Mis-ops), Powerbase results allowed tolerances.
31 Replace on failure.
33 Electromechanical Relays: Repaired in-house. Microprocessor Relays: Use Spare stock to replace failed relays then send failed relay for repair utilizing manufacture's 10 year warranty.
37 Age, parts availability, degree of failure
38 Repair cost and life cycle vs new purchase cost
20
Physical Security
21
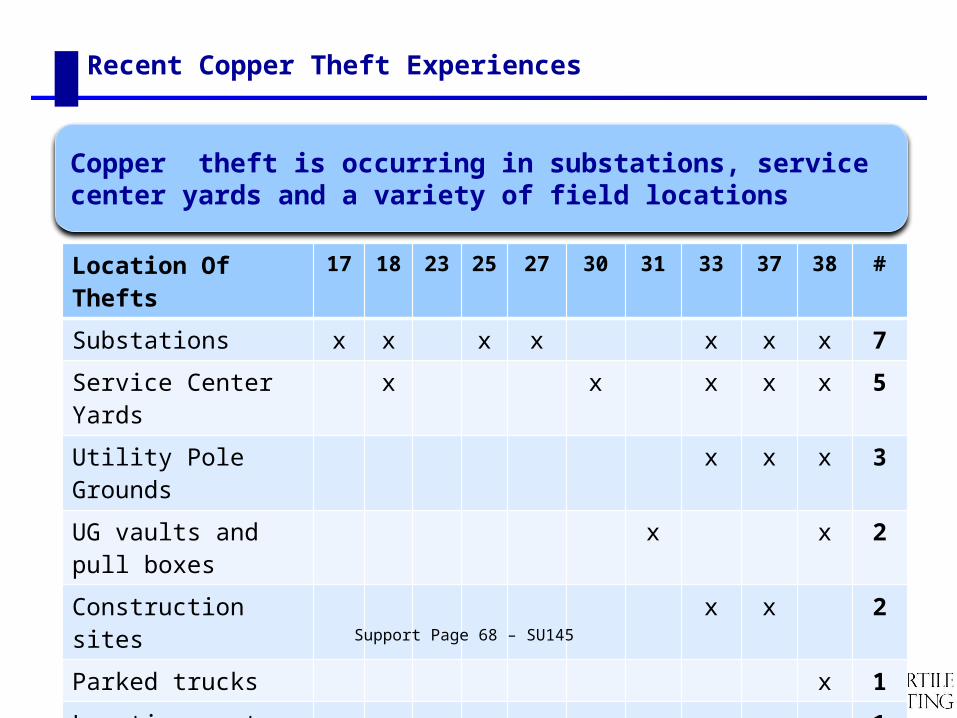
Recent Copper Theft Experiences
Location Of Thefts 17 18 23 25 27 30 31 33 37 38 #
Substations x x x x x x x 7
Service Center Yards x x x x x 5
Utility Pole Grounds x x x 3
UG vaults and pull boxes
x x 2
Construction sites x x 2
Parked trucks x 1
Locations not identified
x 1
Copper theft is occurring in substations, service center yards and a variety of field locations
Support Page 68 – SU145
22
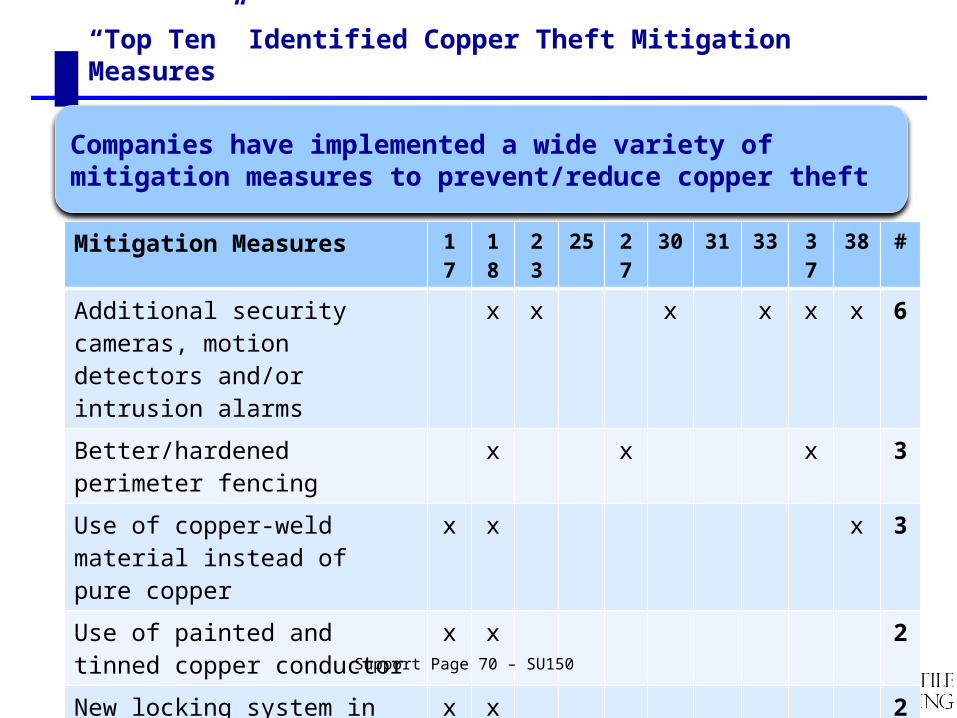
“Top Ten” Identified Copper Theft Mitigation Measures
Mitigation Measures 17 18 23 25 27 30 31 33 37 38 #
Additional security cameras, motion detectors and/or intrusion alarms
x x x x x x 6
Better/hardened perimeter fencing
x x x 3
Use of copper-weld material instead of pure copper
x x x 3
Use of painted and tinned copper conductor
x x 2
New locking system in yards and SS
x x 2
Companies have implemented a wide variety of mitigation measures to prevent/reduce copper theft
Support Page 70 – SU150

23
“Top Ten” Identified Copper Theft Mitigation Measures (continued)
Location of Theft 17 18 23 25 27 30 31 33 37 38 #
Added security patrols x x 2
Close/frequent communication with law enforcement
x x 2
Theft-Sting Operations x x 2
Promote new laws to regulate the movement of stolen materials
x x 2
Relocating copper storage in yards to more secure areas and locked bins
x x 2
Companies have implemented a wide variety of mitigation measures to prevent/reduce copper theft
Support Page 70 – SU150

24
Recent Vandalism or Sabotage Incidents
Incident Types 17 18 27 30 31 33 37 38 #
Shot transformers, conductor and insulators
x 1
Shots at substation equipment
x 1
Poles partially cut with chain saws
x 1
Fences cut x 1
Graffiti x x 2
No recent incidents x x x 3
5 of the 8 responding companies have had recent vandalism or sabotage incidents on their T&D equipment or at their buildings and yards
Support Page 71 – SU155

25
Facility Risk Rating Criteria To Determine Security Plans
Most companies use some type of facility risk rating criteria to determine the level of security that is implemented
Use a Facility Risk Rating Criteria To Determine Physical Security Plans23 risk assessment; feedback from local law enforcement; frequency & severity of incidents that occur
27 We have developed a tiering system for prioritizing critical substations based on several criteria, including KV(size), critical customer (hospital, Govt. Military, etc), NERC, criminal activity,etc.
30 As we constantly analyzing our theft/crime patterns and redeploy our guard service and investigators based upon needs.
31 The criteria used to select/prioritize locations for improved measures depends on: Bandwidth or existing comm/system equipment that can facilitate or support a new system. Manpower resources can come into play as well. Site criticality with regards to CIP or customer dependence ( major hospitals etc.). Budget restraints. Substation Engineering schedule. New CIP PSP‘s. System devices at their end of life cycle. Requests made based on need. Areas of recurring theft/breach or areas with recurring maintenance/outages.
33 Sites are identified by criticality; potential impact on the bulk electric system, power generation and transmission.
37 The criteria is based on criticality of the site to the overall system, frequency of past criminal activity, and crime index of surrounding area. We also have to facto in CIP Standards and Requirements as directed by NERC. With new construction, we have implemented the use of security standards to dictate what security equipment will be installed in an effort to make our equipment, system and parts all uniform.
38 Substation: NERC standards and past theft issues.
No Risk Rating Criteria/All Locations Are Treated The Same 17 Installation of the tattle-tale system Replaced all locks system-wide
18 The criteria in the past consisted first of those high risk locations where thefts and/or various criminal incidents have occurred on a regular basis, along with those locations that must be protected because of regulatory compliance requirements. We are on a path right now to upgrade physical security at all company locations because it is the right thing to do and it is what we consider best security practices n the industry.
38 Distribution: All service areas are equally important. Each service area is focused on diminishing this issue with improvement in technology and limiting traffic in the service area.
Support Page 73 – SU165

26
Corporate Offices
400 Continental Blvd. Suite 600El Segundo, CA 90245(310) 426-2790
New York | Maryland | Texas | Wyoming | Wisconsin
First Quartile Consulting is a utility-focused consultancy providing a full range of consulting services including continuous process improvement, change management, benchmarking and more. You can count on a proven process that assesses and optimizes your resources, processes, leadership management and technology to align your business needs with your customer’s needs.
Visit us at www.1stquartileconsulting.com | Follow our updates on LinkedIn
About 1QC
Satellite Offices
Debi [email protected]
David [email protected]
Dave [email protected]
Dave [email protected]
Your Presenters
Ken Buckstaff [email protected]
Thank You for Your Input and Participation!
Top Related