


Languages
Pages
Legal


[Street Address][City, ST ZIP Code]
p. f.
[Email]

Table of ContentsI. Executive Summary........................2
II. Methodology..................................2
III. Demographics................................3
IV. Overall Satisfaction........................4
V. The Survey.....................................5
VI. Survey Results................................8
VII. Company Information....................10
11. Profile of Key Players in Indian Third Party Logistics
11.1 3PL Service Providers
11.1.1 TCI Logistics
11.1.1.1 Company Profile
TCI Logistics was incorporated in 1958. TCI is India’s leading Multimodal Integrated Supply
Chain Solutions Provider. Currently the company has over 5000 employees and has 1000
plus offices. The company has a global spread with its presence in 6 countries. TCI logistics
has a warehousing space of around 10 million sq. ft. and its fleet includes 4 cargo ships and
7000 trucks. The company is an ISO 9001:2008 certified company.
Key Information
Founded in 1958
Employees 5000+
Legal identity Public Limited
Geographical Presence 1000+ offices , presence in 6 countries
Certification ISO 9001:2008
Warehousing capacities 10 million sq. ft.
Fleet 4 cargo ships, 7000 trucks
Listed at BSE (532349) & NSE (TCI)
Exhibit 11.1 Company Profile – TCI Logistics Source: Novonous
Website
- © NOVONOUS 2

Contact Details for TCI Logistics
Company TCI Logistics
Address TCI House69, Institutional Area, Sector-32,Gurgaon-122207(Haryana) (India)
Telephone +91-124-2381603 to 07
Fax +91-124-2381611
Website www.tcil.com
Email ID [email protected]
Key Management Mr. D. P. Agarwal
Designation Vice Chairman & Managing Director
Exhibit 11.2 Contact Details – TCI Logistics Source: Novonous
Website
11.1.1.2 TCI Logistics in 3PL Value Chain
The company has a strong focus on Freight Forwarding.TCI logistics has expertise in surface
transport entity. The company has a strong backing of resources like strong work force,
distributed offices and technology to provide total transportation solutions. The company
has an ability to transport cargo on FTL (Full Truck Load), LTL (Less Than Truck Load), small
packages and consignments and over dimensional cargo. Also the company has a special
division for freight forwarding called as TCI Freight which forms the largest division of TCI
Group resulting in around 44% of total revenues of TCI Logistics. Apart from that, TCI has a
facility of 10 million sq. ft. warehousing space thereby making it a strong focus area of TCI’s
value chain.
Since the company deals in end to end supply chain, it has integrated services of packaging
and domestic distribution to reach to its customers, bringing the services under its strong
focus area.
- © NOVONOUS 3

Exhibit 11.3 TCI Logistics Value Chain Source: Novonous
Insights
11.1.1.3 Financial performance of TCI Logistics
By analysing the past few years’ financial performance of the company, it can be observed
that the revenue of TCI Logistics has been continuously growing at a rate of around 4-5%,
and the company expects the same growing trend at a rate of around 15% for the next 5
years.
- © NOVONOUS 4

2009-10 2010-11 2011-12 2012-13 2013-140.00
5.00
10.00
15.00
20.00
25.00
14.5517.60 18.32 19.57 20.33
TCI Logistics Revenue (in INR bil-lion)
INR
bil
lion
Exhibit 11.4 TCI Logistics Revenue from 2009-10 to 2013-14 (INR billion)
Source: Novonous Insights
2009-10 2010-11 2011-12 2012-13 2013-140.00
5.00
10.00
15.00
20.00
25.0020.96
4.116.81
3.88
Year-wise TCI Logistics Revenue Growth (in %)
% G
row
th
Exhibit 11.5 Year-wise TCI Logistics Revenue Growth from 2009-10 to 2012-13 (in %)
Source: Novonous Insights
- © NOVONOUS 5

2013-14 2014-15 (est.)
2015-16 (est.)
2016-17 (est.)
2017-18 (est.)
2018-19 (est.)
0
10
20
30
40
20.3323.38
26.9231.02
35.7241.15
Estimated TCI Logistics Revenue (in INR billion)IN
R b
illi
on
Exhibit 11.6 Estimated TCI Logistics in Revenue from 2014-15 to 2018-19 (in INR billion)Source: NOVONOUS Insights
2013-14 2014-15 (est.)
2015-16 (est.)
2016-17 (est.)
2017-18 (est.)
2018-19 (est.)
0.00
4.00
8.00
12.00
16.00
3.90
15.00 15.14 15.23 15.15 15.20
Estimated Year-wise TCI Logistics Revenue Growth (in %)
% G
row
th
Exhibit 11.7 Estimated Year-wise TCI Logistics Revenue Growth from 2014-15 to 2018-19(in %) Source: NOVONOUS Insights
- © NOVONOUS 6

11.1.1.4 Business Strategy
11.1.1.4.1Service Level Business Strategy
Services
Multimodal Integrated Supply Chain Solutions
End to End Supply Chain
Custom Clearance/CHA
Logistics services in and to SAARC Nations.
1. TCI offers Multimodal Integrated Supply Chain Solutions: With its strong presence of fleet on land as well as sea, TCI manages to provide multimodal supply chain services to its customers.
2. The company is also into the end to end supply chain: TCI has the capability of handling the end to end service, that is right from the manufacturer of the goods to directly to the customers, without including any middleman.
3. Custom clearance/CHA: TCI has a license to act as Custom House Agent wherein, the firm can take steps for clearance of any transaction related to clearance of conveyances or import, export of goods.
4. TCI spreads its logistics service in and to SAARC Nations too: TCI is also well known for its logistics services outside India such as SAARC Nations with its operating offices in Singapore, Indonesia, Thailand, Malaysia.
- © NOVONOUS 7

11.1.1.5 SWOT Analysis for TCI Logistics
Exhibit 11.9 SWOT Analysis of TCI Logistics Source: NOVONOUS
Insights
Strengths
Multimodal Logistics – TCI Logistics covers its services through more than one mode of logistics like sea and land. It has a strong fleet of 4 cargo ships and 7000 plus trucks.
Integrated supply chain – TCI Logistics has a strong expertise in close alignment and coordination within a supply chain along with the integration of Management Information Systems (MIS).
Early mover advantage – Since the company is operating for more than 50 years in the industry, it has developed strong relationship with clients and has
gained deep IT penetration. Also the company has managed to achieve large scale of operation.
- © NOVONOUS 8

Weaknesses
Presence in largely unorganised and fragmented market – Since the company is present mostly in unorganised and fragmented market, it faces a challenge of lower margin than expected.
Relies on spot market for truck availability – The dependence on spot marketing brings inefficiency in the movement of goods as sometimes there could be a problem of non-availability of trucks.
Opportunities
Introduction of GST: The introduction of GST will boost the revenue for the company as well as the whole industry as the companies will not have to comply with different tax structure of different states.
Improvement in sea freight rates: As there will be improvement in sea freight rates, it will motivate customers to avail sea logistics services at affordable rates.
Threats
Increasing fuel cost – Increasing fuel cost is a threat to the company as well as the industry, as it result in decreasing number of customers who are cost conscious.
Taxation: High and irregular taxation is a major hurdle for companies operating 3PL industry.
11.1.1.6 Key Customers
Industry Verticals Key Clients
Automobile Toyota Bajaj Maruti Tata Mahindra & Mahindra Sonalika TVS JCB
FMCG HLL P&G Nestle Cadbury Amul Office One CCD
Telecom Nokia Reliance Motorola Ericson Tata Tele
- © NOVONOUS 9

Pharma Dr. Reddys Sunil Health Bharti Health
Chemicals MCC PTA Indo Rama PRAXAIR
Hitech Whirlpool ABB L&T Dixon
Exhibit 11.10 List of Key Customers TCI Logistics Source: Suzlon Website
Executive Summary
Use the sample content throughout this template to help you get started with planning your client satisfaction (or similar) survey.
Edit and add to the sample content to fit your business and to include the information that you want to gather with your survey. For example, when reporting survey results, you might want to include a summary of key result figures in this executive summary section.
A complete sample survey is also included (at the end of this document) that you can use on its own and customize as needed to create your survey.
Note: To delete any tip (such as this), just click the tip text and then press the spacebar.
Consumers were asked to participate in an anonymous survey to help the company’s
customer service department evaluate the effectiveness of their services. The survey
included questions about the client’s most recent experience. It asked questions about their
interaction with staff, staff response times; and whether the client’s issue was resolved. The
survey also asked respondents to give an overall summary of their experience. A total of
responses were received from a total of surveys mailed to customers.
- © NOVONOUS 10
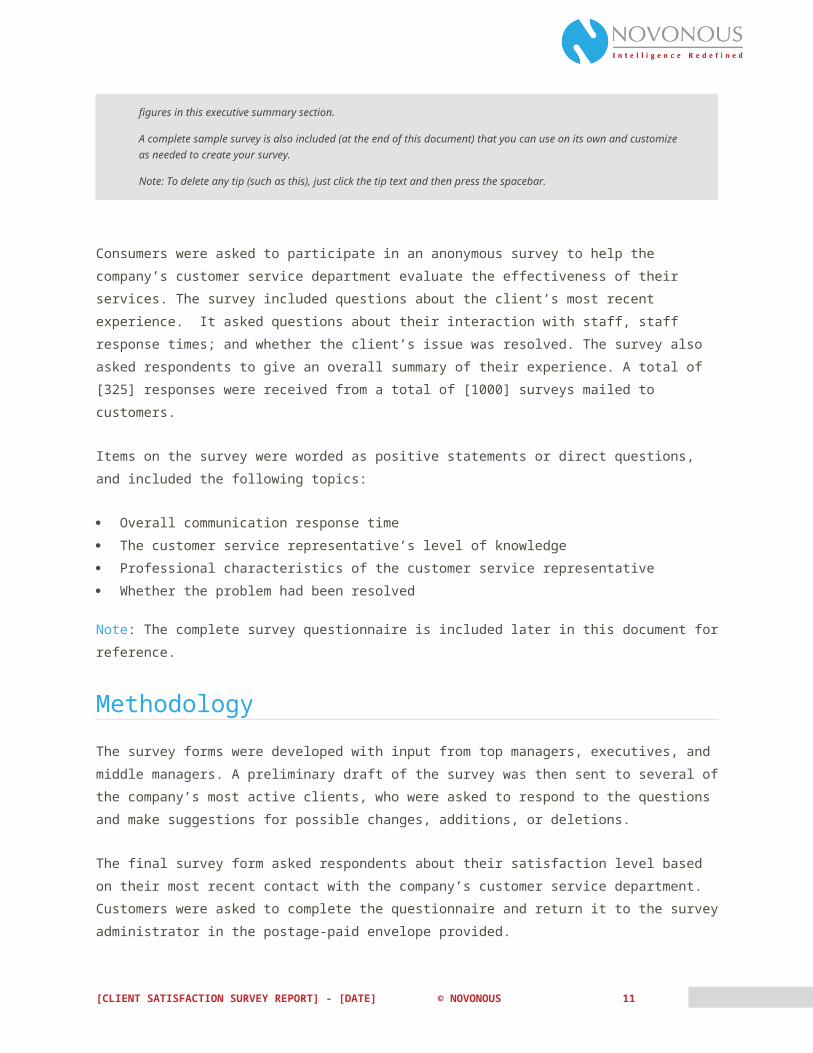
Items on the survey were worded as positive statements or direct questions, and included
the following topics:
Overall communication response time
The customer service representative’s level of knowledge
Professional characteristics of the customer service representative
Whether the problem had been resolved
Note: The complete survey questionnaire is included later in this document for reference.
Methodology
The survey forms were developed with input from top managers, executives, and middle
managers. A preliminary draft of the survey was then sent to several of the company’s most
active clients, who were asked to respond to the questions and make suggestions for
possible changes, additions, or deletions.
The final survey form asked respondents about their satisfaction level based on their most
recent contact with the company’s customer service department. Customers were asked to
complete the questionnaire and return it to the survey administrator in the postage-paid
envelope provided.
Questionnaire topics included:
Method of contact
Response time
Representative’s level of knowledge
Characteristics of the representative, including attentiveness, courtesy, enthusiasm,
friendliness, listening skills, patience, and responsiveness
The process used to resolve their issue
Overall appearance of the store
The convenience of the store’s location
The survey administrator checked returned surveys for missing information and responses
that would cause scanning errors. After scanning, the responses were imported into
Microsoft® Excel and errors were checked against the individual forms. Data analysis was
completed using Excel.
Note: The results reported can only be considered the opinions of the survey participants.
They cannot be generalized to represent the entire client population as a whole.
Demographics
Survey responses are broken out by several demographic categories, as follows:
- © NOVONOUS 11
The percentage of respondents are broken out by:
Under age 18
Age 18 to 44
Age 45 - 64
Age 65 and above
Gender
Education level
Under Age 18 Age 18 - 44 Age 45 - 64 Age 65+0
1020304050607080
Survey Respondents by Age and Gender
Female
Male
Not Speci-fied
Exhibit 1.1 Technology Source: NOVONOUS Insights
Didn't Graduate HS Graduate College Coursework
College Degree0
102030405060708090
Survey Respondents by Education Level
Over 19
18 or Younger
Overall Satisfaction
The overall level of satisfaction uses an average of replies to quantifiable survey questions,
based on a scale of 1 (extremely negative) through 5 (extremely positive). Following is an
example summary of demographic areas for which overall satisfaction is calculated:
Percentage of respondents younger than 18 or over 64 who expressed less satisfaction
than those between the ages of 18 and 64
- © NOVONOUS 12

Satisfaction level by gender
Satisfaction relative to education level of respondents over the age of 18
- © NOVONOUS 13

The Survey
Customer Service Department Satisfaction SurveyYou recently contacted our customer service department. We want to follow-up to ensure
that you were satisfied with the outcome of that contact.
Please help us improve our service by completing this short survey.
After you return your survey using the postage-paid envelope provided, we will send you a
gift certificate valued at to thank you for your time. Please allow four to six weeks for
receipt of your gift certificate.
Please tell us just a bit about yourself…
Your Age
☐ Under 18 ☐ 45 – 64 ☐ I prefer not to respond
☐ 18 – 44 ☐ 65 or over
Your Gender
☐ Female ☐ Male ☐ I prefer not to respond
Your Education Level
☐ Some high school ☐ Some college coursework
☐ I prefer not to respond
☐ High school graduate
☐ College graduate
Our communication response time…
In your most recent customer service experience, how did your contact our representative?
☐ Telephone ☐ Live online chat ☐ In person
How long did you have to wait before speaking with a representative?
☐ Right away ☐ Between 3 – 5 minutes
☐ More than 10 minutes
☐ Less than 3 minutes
☐ Between 5 – 10 minutes
- © NOVONOUS 14

It was quick and easy to connect with a customer service representative.
☐ Strongly agree ☐ Neutral ☐ Strongly Disagree
☐ Agree ☐ Disagree
Which of the following best describes the outcome of your most recent customer service
contact?
☐ My issue was fully resolved
☐ I was referred to someone else
☐ Representative did not understand my issue
☐ My issue was partially resolved
☐ I received wrong or unclear information
☐ Other
How many times did you have to contact customer service before this issue was resolved?
☐ My issue was resolved on the initial contact
☐ 4 or more times
☐ 2 – 3 times ☐ My issue is not yet resolved
The representative’s knowledge and professionalism…
The representative was knowledgeable.
☐ Strongly agree ☐ Neutral ☐ Strongly Disagree
☐ Agree ☐ Disagree
How would you best describe the outcome of your contact?
☐ My issue was fully resolved
☐ I was referred to someone else
☐ Representative did not understand my issue
☐ My issue was partially resolved
☐ I received wrong or unclear information
☐ Other
How well do the following terms describe the representative?
Rate each term on a scale of 1 (not at all) to 5 (very well).
1 2 3 4 5
Courteous ☐ ☐ ☐ ☐ ☐
Enthusiastic ☐ ☐ ☐ ☐ ☐
Friendly ☐ ☐ ☐ ☐ ☐
Good listener ☐ ☐ ☐ ☐ ☐
Patient ☐ ☐ ☐ ☐ ☐
- © NOVONOUS 15

Responsive ☐ ☐ ☐ ☐ ☐
Overall, how was the process for getting your issue resolved?
☐ Excellent ☐ Neutral ☐ Extremely poor
☐ Good ☐ Poor ☐
Characteristics of the store …
How did you find the store’s overall appearance?
☐ Clean and well stocked
☐ Unclean but well stocked
☐ Lobby/restrooms clean
☐ Clean but with empty shelves
☐ Unclean and with empty shelves
☐ Lobby/restrooms dirty
How would you rate the convenience of the store location?
☐ Excellent ☐ Neutral ☐ Extremely poor
☐ Good ☐ Poor ☐
If your problem is not yet resolved…
Please give us one more chance to make things right. Just check the contact box below and
one of our Customer Service Managers will contact you.
I would like a Customer Service Manager to contact me regarding my unresolved issue.
If requesting follow-up, please provide your preferred contact information:
Thank you very much for taking the time to complete this survey. Your input is valued and
very much appreciated!
- © NOVONOUS 16

Survey Results
You might want to provide a complete summary of responses in table format, as shown in the example that follows. Then add some charts to give visual impact to your key results.
Communication response time
Method of contact
Response Count
Telephone 188
Live online chat 36
In person 99
No response 2
Wait time
Response Count
None 18
< 3 minutes 114
3 – 5 minutes 62
5 – 10 minutes 48
> 10 minutes 75
No response 8
Connecting with customer service was quick and easy
Response Count
Strongly agree 72
Agree 88
Neutral 69
Disagree 43
Strongly disagree 45
No response 8
- © NOVONOUS 17

Outcome of contact
Response Count
Fully resolved 75
Partially resolved 85
Referred to other 59
Given wrong/unclear info 32
Representative did not understand issue 12
Other 60
No response 2
Number of customer service contacts to resolve issue
Response Count
1 60
2 – 3 165
4 or more 32
Not yet resolved 66
No response 2
- © NOVONOUS 18

- © NOVONOUS 19

Company Information
NOVONOUS
No. 579, Ground Floor, 16th Cross,
10th Main, ISRO Layout, Bangalore,
Karnataka – 560078, India
Tel +91-80-26860858
Fax+91-80-26860844
www.novonous.com
- © NOVONOUS 20
Top Related