


Languages
Pages
Legal


Targeting the microbiome!
The role of SDD in the era of MDR and XDR
Marc Bonten, UMC Utrecht
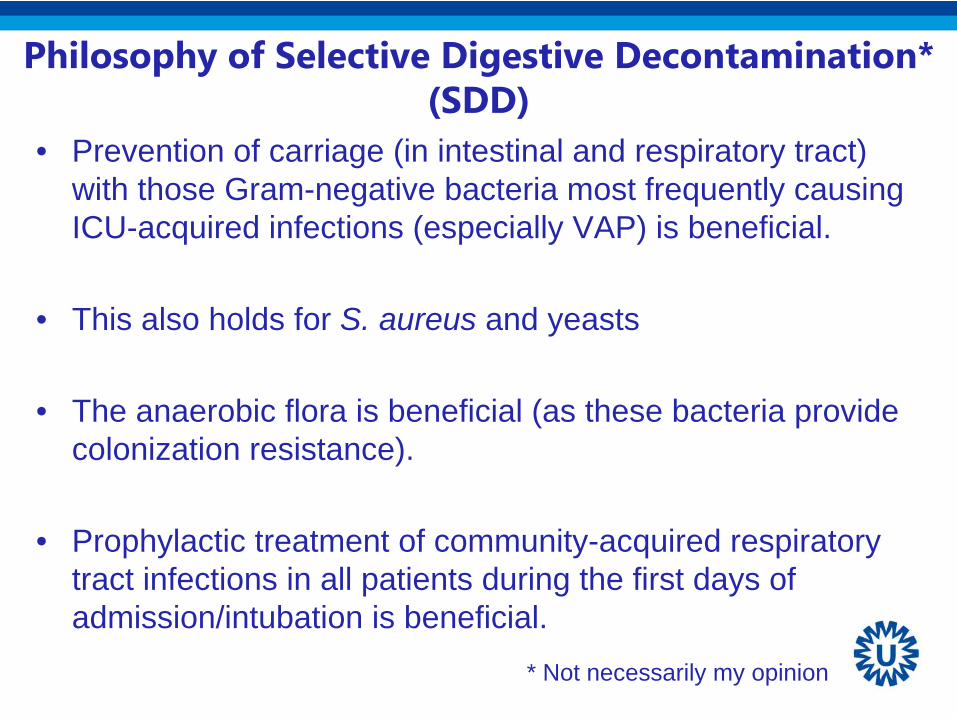
Philosophy of Selective Digestive Decontamination* (SDD)
• Prevention of carriage (in intestinal and respiratory tract) with those Gram-negative bacteria most frequently causing ICU-acquired infections (especially VAP) is beneficial.
• This also holds for S. aureus and yeasts
• The anaerobic flora is beneficial (as these bacteria provide colonization resistance).
• Prophylactic treatment of community-acquired respiratory tract infections in all patients during the first days of admission/intubation is beneficial.
* Not necessarily my opinion

SDD• Oropharyngeal application 4 dd 0.5 gr. paste containing 2% polymyxin E,
2% tobramycin and 2% amphotericin B (SOD)
• Intragastric application 4 dd 10 ml of suspension containing 100 mg polymyxin E, 80 mg tobramycin and 500 mg amphotericin B (suppositoria in case of stoma).
• Cefotaxim 4 dd 1 gr. i.v. during first 4 days of treatment.
• Surveillance cultures of throat, sputum and rectum on admission and twice weekly.
• Use of colonization resistance impairing antibiotics was discouraged.
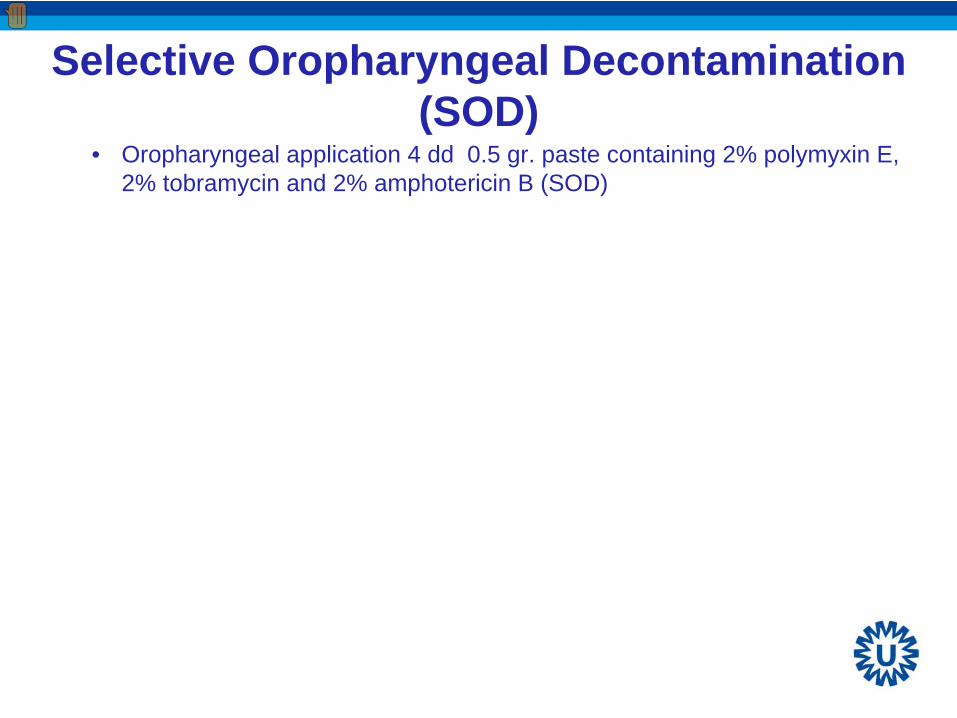
Selective Oropharyngeal Decontamination (SOD)
• Oropharyngeal application 4 dd 0.5 gr. paste containing 2% polymyxin E, 2% tobramycin and 2% amphotericin B (SOD)

Antibiotic resistance in the NetherlandsEpisodes of bacteremia in the Netherlands in 2014
MRSA:
40‐45VRE:
5‐10
CRE: 1
E. coli 3rd
gen Cephalosporin‐R: +
500
K. pneumoniae 3rd
gen Cephalosporin‐R: +
75
Based on ISIS‐AR (courtesy D. Frentz and Tjalling Leenstra)

Relevant studies for the Netherlands
1. Bergmans et al. AJRCCM 2001; 164: 382-8
• SOD vs Standard Care• Double-center placebo-controlled double-blind RCT; 225
patients
2. De Jonge et al. Lancet 2003; 362: 1011-6
• SDD vs Standard Care • single-center cluster-randomized; 934 patients
3. De Smet et al. NEJM 2009; 360: 20-31
• SDD vs SOD vs Standard Care• 13 center cluster-randomized cross-over, 6000 patients
4. Oostdijk et al. JAMA 2014; 312: 1429-37
• SDD vs SOD• 16 centers cluster-randomized cross-over, 12000 patients
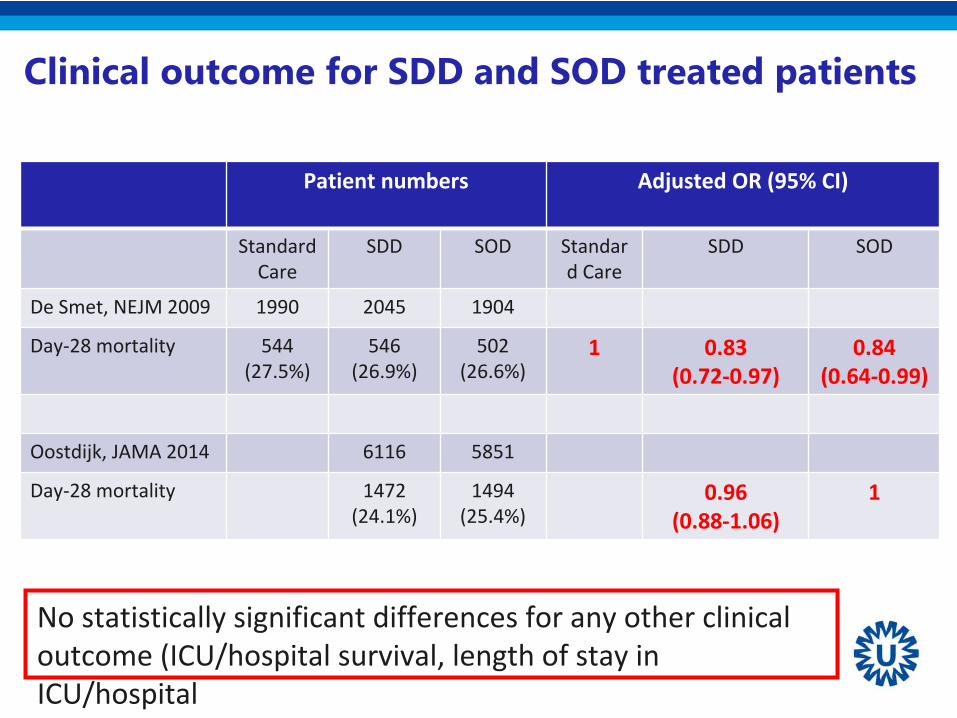
Patient numbers Adjusted OR (95% CI)
Standard
CareSDD SOD Standar
d CareSDD SOD
De Smet, NEJM 2009 1990 2045 1904
Day‐28 mortality 544(27.5%)
546 (26.9%)
502 (26.6%)
1 0.83 (0.72‐0.97)
0.84 (0.64‐0.99)
Oostdijk, JAMA 2014 6116 5851
Day‐28 mortality 1472 (24.1%)
1494 (25.4%)
0.96 (0.88‐1.06)
1
Clinical outcome for SDD and SOD treated patients
No statistically significant differences for any other clinical outcome (ICU/hospital survival, length of stay in
ICU/hospital

Effects of SDD/SOD on patient outcome, compared to no SDD/SOD
Odds ratios + 95% CI for SDD and/or SOD vs Standard Care1= de Smet, SDD/SOD vs SC; 2= de Jonge SDD vs SC, 3= Bergmans SOD vs SC
31 11 22 3

-50%
-30%
-10%
10%
30%
50%
70%
90%
Diff
eren
ces
in %
SDD group SOD group
Antibiotic usage differences (DDD/ICU-day) of the SDD and SOD group compared to the Control group
PENICILLINEN CARBAPENEMS CEFALOSPORINEN CHINOLONEN CLINDAMYCINE Total # DDD's / ICU-day
Effects of SDD/SOD on antbiotic use in ICU
Cephalosporins 85% increase with
SDD !
Total volume of iv antibiotics: 12% (SDD) and 10% (SOD) decrease!
De Smet et al. NEJM 2009
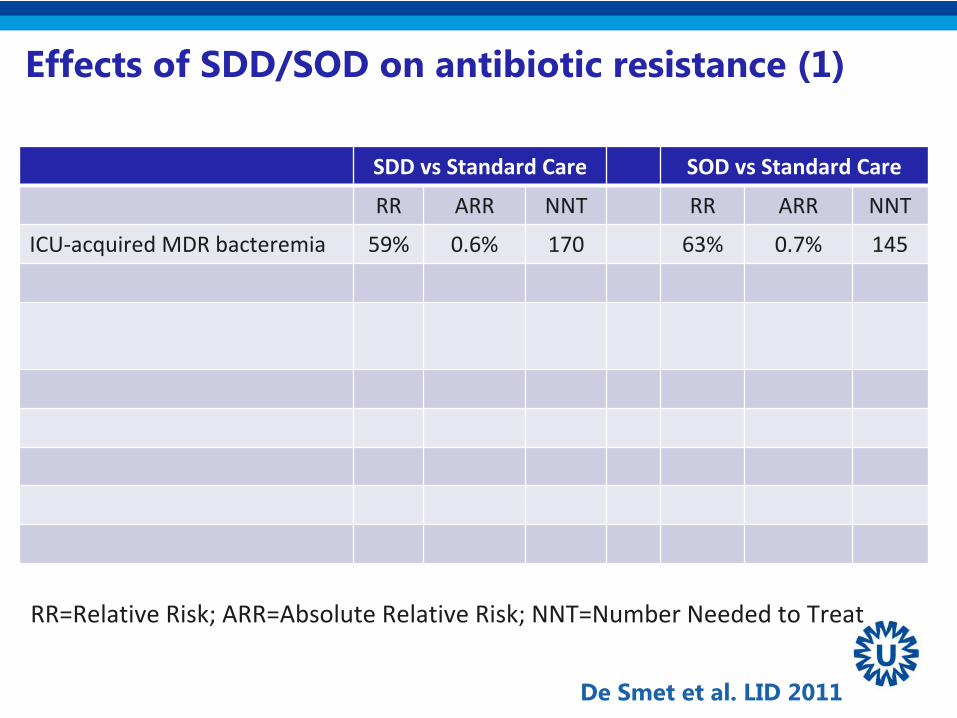
SDD vs Standard Care SOD vs Standard Care
RR ARR NNT RR ARR NNT
ICU‐acquired MDR bacteremia 59% 0.6% 170 63% 0.7% 145
Effects of SDD/SOD on antibiotic resistance (1)
De Smet et al. LID 2011
RR=Relative Risk; ARR=Absolute Relative Risk; NNT=Number Needed to Treat

SDD vs Standard Care SOD vs Standard Care
RR ARR NNT RR ARR NNT
ICU‐acquired MDR bacteremia 59% 0.6% 170 63% 0.7% 145
ICU‐acquired respiratory tract carriage
MDR 38% 5.5% 18 32% 4.6% 22Tobramycin‐resistant GNB ‐18% ‐2% ND ‐7%% ‐1% ND
Cefotaxim GNB 62% 4% 26 1% 0% ND
Intrinsic Colistin‐resistant GNB 55% 8,1% 12 14% 2% ND
Effects of SDD/SOD on antibiotic resistance (1)
De Smet et al. LID 2011
RR=Relative Risk; ARR=Absolute Relative Risk; NNT=Number Needed to Treat

Effects of SDD/SOD on antibiotic resistance (2)Each ICU: 12 months SDD and 12 months SOD (random order)Every month: point‐prevalence survey of all patients in ICU
Rectal carriage: average of monthly prevalence
*
* **
*
Oostdijk et al. JAMA 2014
Trends in time:
Aminoglycoside‐resistant GNBSDD (1.07 (95% CI 1.01‐1.13))SOD (1.04 (95% CI 1.00‐1.08))
* p<0.05
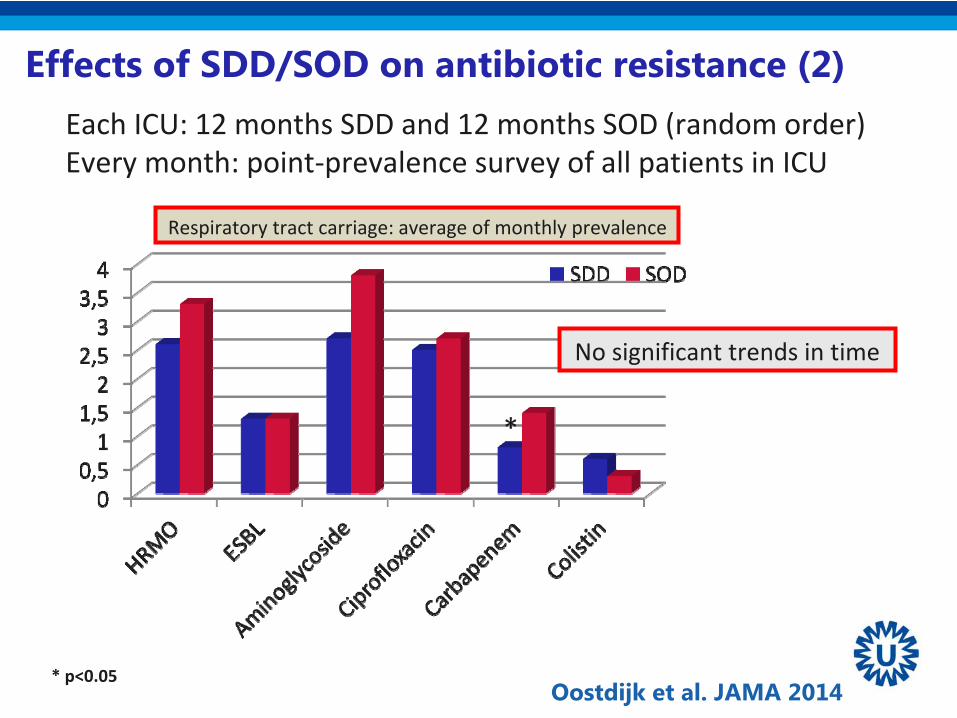
Effects of SDD/SOD on antibiotic resistance (2)Each ICU: 12 months SDD and 12 months SOD (random order)Every month: point‐prevalence survey of all patients in ICU
Respiratory tract carriage: average of monthly prevalence
*
Oostdijk et al. JAMA 2014* p<0.05
No significant trends in time

Aminoglycoside resistance
Colistin resistance

Fluoroquinolone resistance
3rd Gen cephalosporin resistance

The human microbiota Enterococcus Enterobacteriaceae
BacteroidesAlistipesDoreaAkkermansiaRuminococcusClostridium
Routinely culturable
Difficult/impossible to culture
DNA-based methods essential for a complete overview
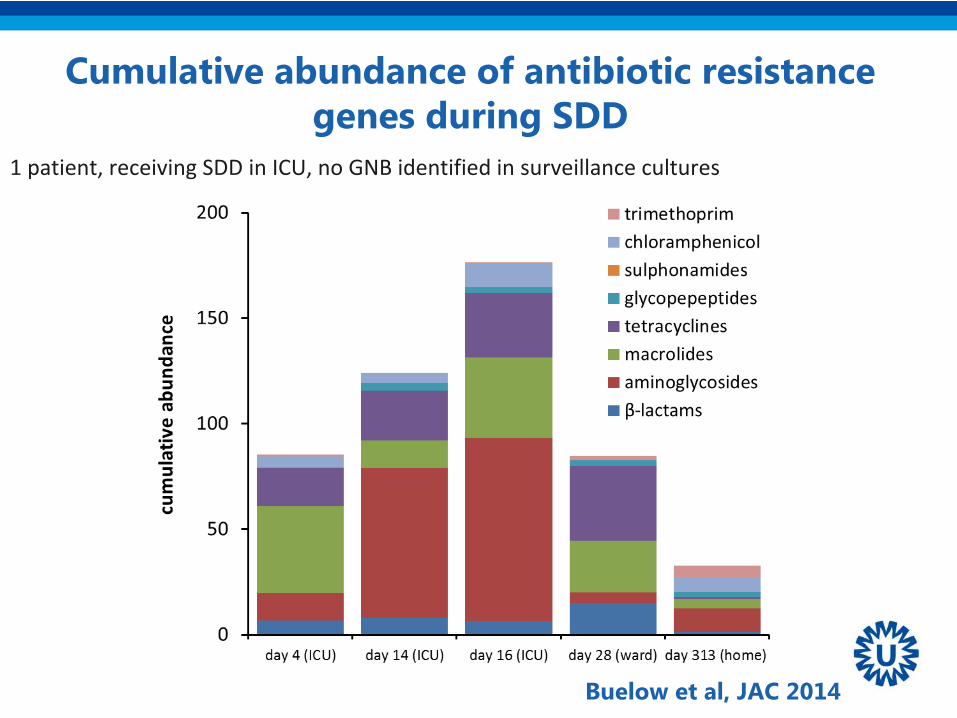
Cumulative abundance of antibiotic resistance genes during SDD
1 patient, receiving SDD in ICU, no GNB identified in surveillance cultures
Buelow et al, JAC 2014
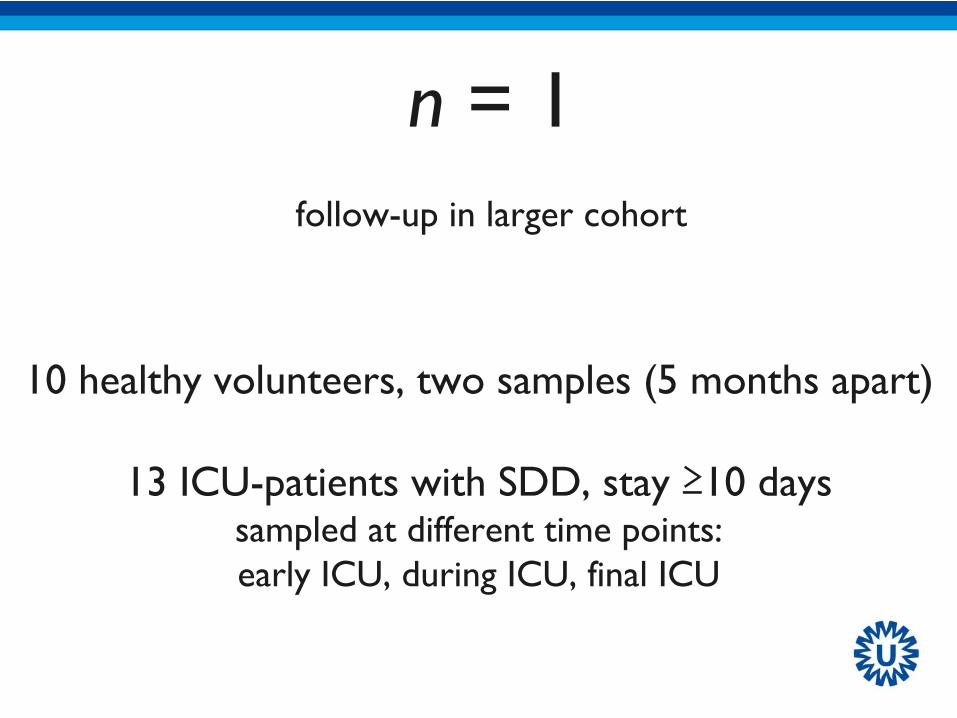
n = 1follow-up in larger cohort
10 healthy volunteers, two samples (5 months apart)
13 ICU-patients with SDD, stay ≥10 dayssampled at different time points:early ICU, during ICU, final ICU

increase Enterococcus
decrease butyrate-producing bacteria
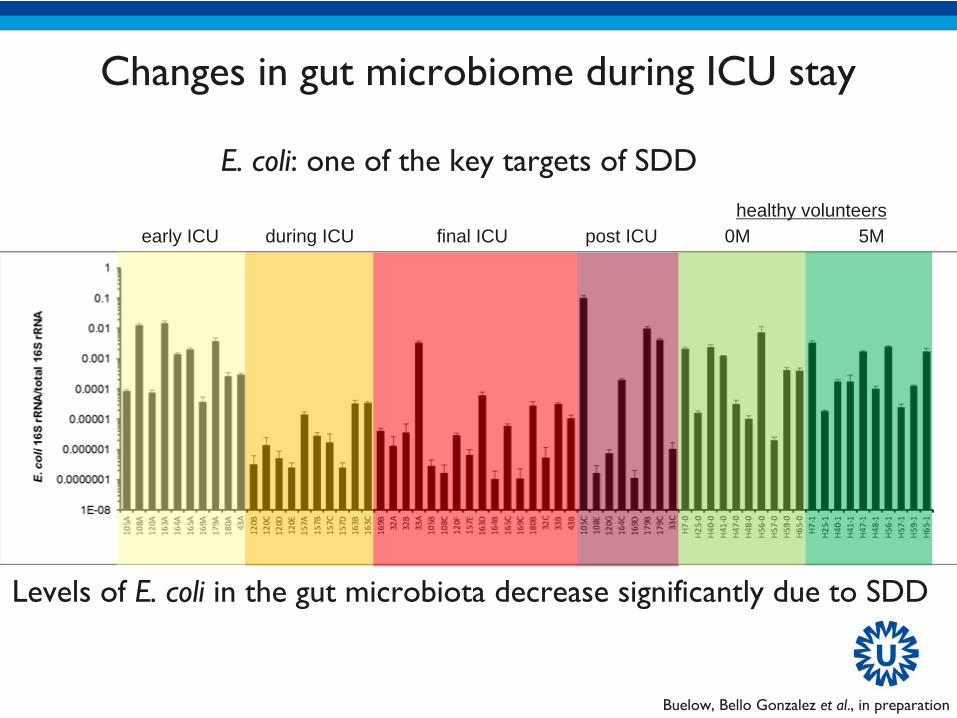
Changes in gut microbiome during ICU stay
Buelow, Bello Gonzalez et al., in preparation
Changes in gut microbiome during ICU stay
Buelow, Bello Gonzalez et al., in preparation
early ICU during ICU final ICU post ICU 0M 5Mhealthy volunteers
Levels of E. coli in the gut microbiota decrease significantly due to SDD
E. coli: one of the key targets of SDD

Primers for 81 resistance genes, 14 IS elements 16S rRNA: for relative quantification
Most common resistance genes in gut microbiotaForslund et al., 2013. Genome Res. 23:1163; Hu et al., 2014. Nat. Commun 4:2151
Clinically relevant resistance genesESBLs, carbapenemases, mecA, vancomycin resistance genes
The gut resistome
Buelow, Bello Gonzalez et al., in preparation
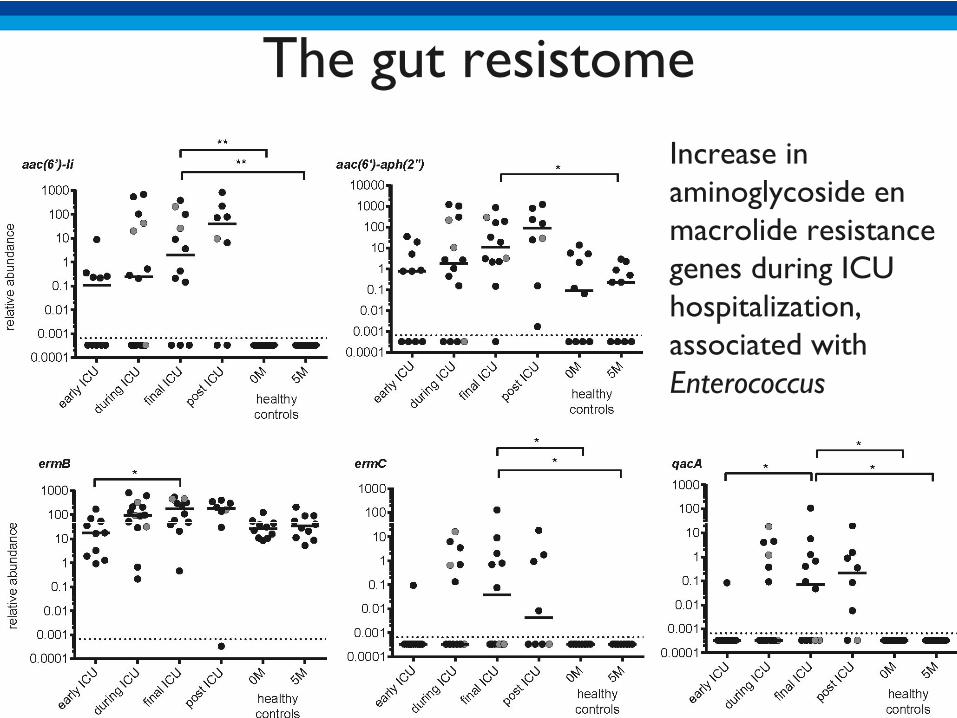
Increase in aminoglycoside en macrolide resistance genes during ICU hospitalization, associated with Enterococcus
The gut resistome
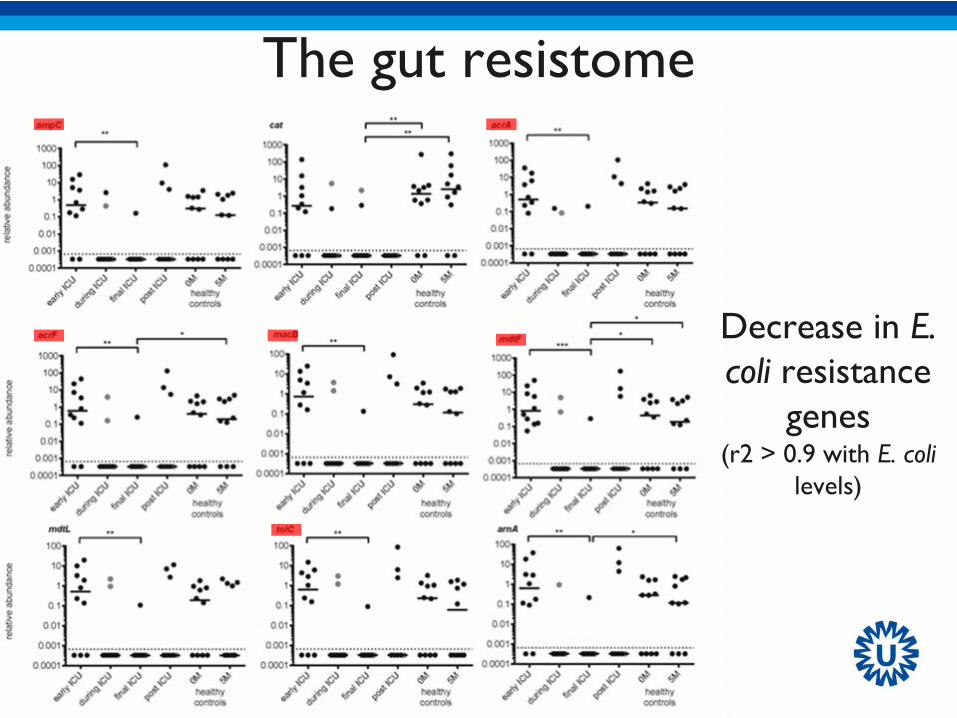
Decrease in E. coli resistance
genes (r2 > 0.9 with E. coli
levels)
The gut resistome
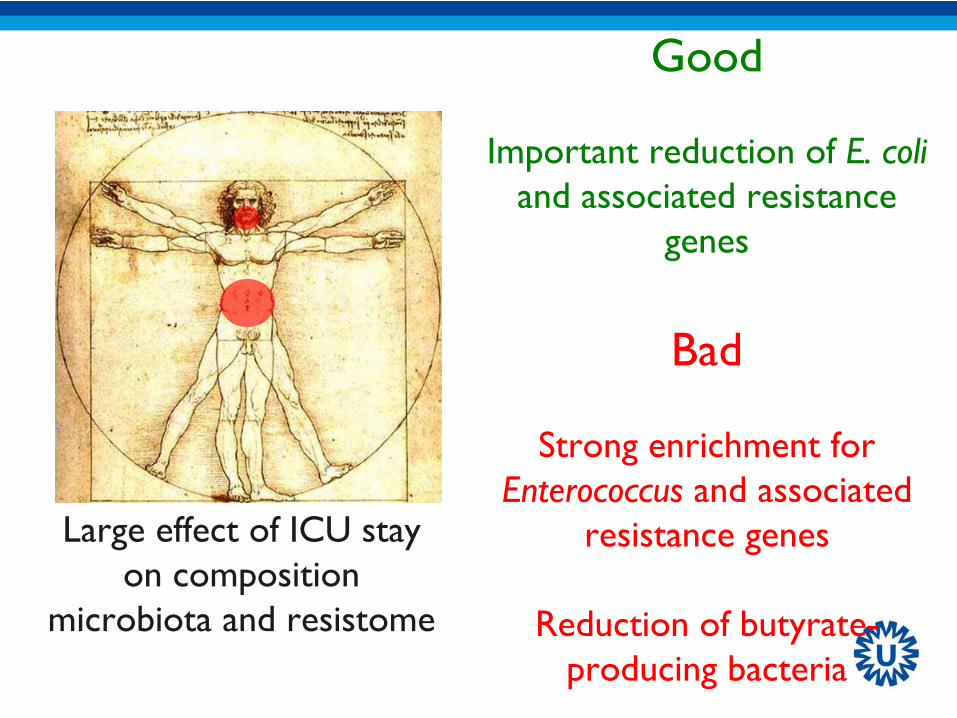
Good
Important reduction of E. coli and associated resistance
genes
Bad
Strong enrichment for Enterococcus and associated
resistance genes
Reduction of butyrate- producing bacteria
Large effect of ICU stay on composition
microbiota and resistome

De Jonge et al.Lancet 2003
De Smet et alNEJM 2009
Oostdijk et alBMJ Open 2013
De Jonge et alLancet 2003
De Smet et alLID 2011
Houben et alJAC 2014
Sporadic unsuccesfully controlled outbreaks
Buelow et alJAC 2014
SDD/SOD in ICU in the Netherlands
Wittekamp et alCrit Care 2015Oostdijk et alJAMA 2014

• In the Netherlands– SDD or SOD recommended for routine use in all
patients with expected length of stay >2 days– Need for careful microbiological monitoring,
especially for aminoglycoside/colistin resistance
Conclusions, part 1
• Why?Better patient outcome (NNT for ICU survival +30)Less IV antibioticsLess resistanceCost savingIntensivists happy

What to do to improve outcome of ICU patients?

• Lack of evidence for improved outcome in settings with MDR and XDR
Colistin resistance
Don’t do this!
What will my highly respected opponent bring forward?
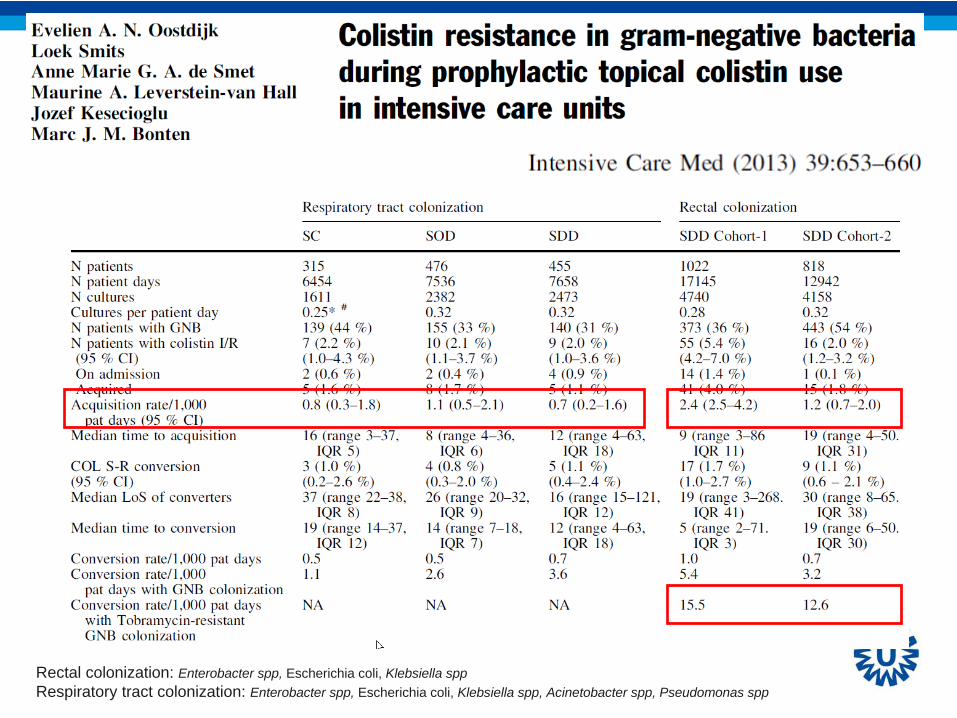
Rectal colonization: Enterobacter spp, Escherichia coli, Klebsiella sppRespiratory tract colonization: Enterobacter spp, Escherichia coli, Klebsiella spp, Acinetobacter spp, Pseudomonas spp


Monthly numbers of ESBL K. pneumoniae
Monthly numbers of colistin-resistant bacteria
Proportion of tobramycin-resistance among colistin-resistant bacteria

Oral gentamicin (15 mg/kg/day) is routinely used in neonates for prophylaxis of necrotising enterocolitis.
Between May 2005 and Sep 2007, 3 ESBL-E outbreaks (total duration 18 months) occurred.
During these outbreaks, gentamicin was replaced by oral colistin (8 mg/kg/day) in all neonates.
All neonates colonised with ESBL-E during the study period were retrospectively analysed with regard to the influence of colistin on ESBL-E colonisation.
30 (4.5%) of 667 neonates were colonised with ESBL-E: 21 had ESBL-producing Klebsiella pneumoniae -> 12 had received oral colistin.9 had ESBL-producing Klebsiella oxytoca -> 1 had received oral colistin.
Amongst ESBL-Kp, the rate of colistin resistance was higher in the colistin group (P = 0.0075).
4 different clones of ESBL-Kp and 3 different clones of ESBL-Ko were isolated, indicating the occurrence of patient-to-patient transmission. Colistin-resistant as well as colistin-susceptible isolates were detected within the same clones, indicating induction of resistance.

The emergence during therapy of a colistin-resistant OXA-181 K. pneumoniae isolate was documented following SDD with oral colistin, which is therefore strongly discouraged.
A hemodynamically unstable patient admitted (June 18) for mitral valve replacement and CABG surgery.
OXA-181 K. pneumoniae, susceptible to tigecycline and colistin (MIC 0.125g/ml) in urine on June 18 and rectal colonization was also demonstrated.
Colistin monotherapy (2MU q12 h IVI) was administered for 5 days.
A 2nd course of colistin (2 MU q8 h IVI) and meropenem was administered in conjunction with oral SDD (2% colistin/tobramycin in oral paste and enteral solution) for 22 days.
On 23 July, OXA-181-producing K. pneumoniae in stool specimen was colistin resistant with a 5-fold increase in MIC, to 4 g/ml.
Pt (apparently) underwent surgery and recovered

Study design CHX-BW 2% +

Current progress
Patient recruitment has started in 13 hospitals in 6
European countries
Protocol – including a waiver for informed consent ‐
not approved in France & Hungary
Samples size
estimation: 10.800
Latest study start
date: 19‐01‐2015
Final recruitment
date: 18‐04‐2017
Jan 2015

• It is confirmed that the mcr-1 gene is responsible for colistin resistance. The authors report that, “In an in-vivo model, production of MCR-1 negated the efficacy of colistin”.
• The mcr-1 gene is located on a plasmid and therefore can move easily between cells. This means mcr-1 has the potential to spread colistin resistance extremely fast. As stated in this paper, “The plasmid carryingmcr-
1
was mobilised to an
E coli
recipient at a frequency of 10−1
to 10−3
cells per recipient cell by conjugation.
• Numerous animals and people in China were found to already have E. coli with the mcr-1 gene. As the authors report, “We observed
mcr-1
carriage
in
E coli
isolates collected from 78 (15%) of 523 samples of raw meat and 166 (21%) of 804 animals during 2011–14, and 16 (1%) of 1322 samples from inpatients with infection.”
Todays news
Top Related