


Languages
Pages
Legal


.t3 ... 51113 ..... _1a_b_o_ra_to_r....:y:....__ _ ________ )
A FEED-EFFLUENT HEAT EXCHANGER/REACTOR DYNAMIC CONTROL LABORATORY EXPERIMENT
WILLIAM L. LUYBEN Lehigh University • Bethlehem, PA 18015
E xposing students to real process control instrumentation and to real process equipment in laboratory experiments is of great pedagogical and motivational
importance. Simulations lack the feel , touch, smell, and sound of a real chemical plant. All chemical engineering undergraduate curricula should have some experimental dynamics and control component.
Most control experiments used in undergraduate laboratories are quite simple because they are intended to reinforce basic ideas and principles learned in the theory part of the course. Single-loop control of level , temperature, or pressure is typical , with conventional PID algorithms used in digital controllers. Many papers have been published over the last four decades describing several types of laboratory experiments and course objectives and approaches. Recent papers include the work of Bequette, et a1.,l 11 and Lennox and Brisk.121
While these simple processes are necessary for initial experiments, they do not expose students to processes that are more challenging and that are commonly encountered in the chemical industry. More complex experiments are of great help in improving students' understanding of process-control basics. This paper describes one such process, the feedeffluent heat exchanger/reactor system. The apparatus is fairly simple and is safe to operate, and the investment in process equipment and instrumentation is modest.
The experiment was developed as part of the Lehigh Interdisciplinary Controls Laboratory, which has been in operation for almost a decadeY1 The laboratory is an elective course for chemical, electrical , and mechanical engineering seniors. Experiments in the three disciplines are performed by interdisciplinary teams. Students perform three very basic experiments during the first half of the semester. During the last half they perform two more advanced
experiments. The laboratory is operated two afternoons a week for three hours . Faculty supervision is provided by all three departments .
PROCESS DESCRIPTION
The need to preheat the feed to a tubular reactor to some minimum inlet temperature is one of the important features of tubular reactors that di stinguishes them from continuous stirred-tank reactors in which a minimum feed temperature seldom exists . With a tubular reactor, if the feed temperature is too low, the reactor will "quench" (move to a low-conversion steady state). Feed preheating can be done using a steam-heated heat exchanger or a fired furnace, depending on the temperature level required. Cooling of the reactor effluent is usually required , and this can be done by steam generation or using cooling water. The use of independent utility streams for preheating and cooling makes the control problem very easy because there is no interaction (see Figure lA).
This arrangement, however, is quite inefficient from a capital-investment and energy standpoint. Separate heating and cooling heat exchangers are required, which increases capital investment in heat-transfer area. The need to have reasonable temperature differential driving forces in both
William L. Luyben earned degrees in chemical engineering from Penn State (BS 1955) and Delaware (PhD 1963). His industrial experience includes four years with Exxon, four years with DuPont, and three decades of consulting with chemical and petroleum companies. He has taught at Lehigh University since 1967 and has participated in the development of several innovative undergraduate courses, from the introductory course in mass and energy balances through the capstone senior design course and an interdisciplinary controls laboratory.
© Copyright Ch£ Division of ASE£ 2000
56 Chemical Engineering Education

More complex experiments are of great help in improving students' understanding of process-control basics. This paper describes one such process, the feed-effluen t heat exchanger/reactor system. The apparatus is fairly simple and is safe to operate, and the investment in process equipment and instrumentation is modest.
A HOI
Pn:bealed reactor Cold feed
11 8 feed 111 I effluent111
~ Reactor II
~ ~ Cooled
B
Qin
Cold feed
Preheated feed
reactor effluent
Qoot
Reactor Hot reactor effluent
Bypass
Figure lA. Independent heating and cooling. lB. FEHE Process.
Figure 2. Process flowsheet.
TI
Reactor
TI I I I
- -.frcl+-~ ~
I
I ,-----------. I
~ --+j Tout= C1+KR(Tin-C2) t- --.!
Figure 3. Simulate adiabatic exothermic reactor.
Winter2000
heat exchangers reduces the thermodynamic efficiency of the process .
In a large number of industrial applications, the hot reactor effluent is used to preheat the cold reactor feed . The resulting decrease in heat-transfer area means lower capital investment and a more efficient process in terms of steadystate operation. Figure lB shows a feed-effluent heat exchanger coupled with an adiabatic exothermic reactor. The heat of reaction produces a reactor effluent temperature that is higher than the temperature of the feed stream to the reactor. Therefore heat can be recovered from the hot stream leaving the reactor.
This feed-effluent heat exchanger (FEHE) configuration results in significant dynamic control problems, however. This is one of the classic examples of the interaction and conflict between design and control. The control objective is to control the reactor inlet temperature by manipulating the bypass flow of cold material around the heat exchanger.
These FEHE systems have been used for many years in the chemical and petroleum industries. Papers describing the dynamics and control issues date back almost four decades,14
•51
with several recent studies appearing in the literature _l6-101
The importance of the FEHE configuration in the chemical industry is indisputable.
DESCRIPTION OF EXPERIMENTAL EQUIPMENT
Figure 2 gives a schematic of the experiment. Air from a 90-psig air supply flows through a pressure regulator that provides a constant pressure air source (50 psig). A manual valve sets the total air flow through the process. The pressure drop through the system is designed to be about 5 psi . Thus the pressure drop over this manual valve gives choke flow through the valve (P;n > 2 P0 ui)- This means that the flowrate is independent of the downstream pressure, so the total flow is constant for any downstream conditions.
About 25% of the air passes through the tube side of a heat exchanger in which it picks up heat. The remainder of the cold air is bypassed around the heat exchanger and mixed with the hot air leaving the heat exchanger. The split-ranged control valves in both the bypass line and the heat-exchanger exit line are positioned by a temperature controller, which controls the reactor inlet temperature. Since the safe failure mode is bypassing cold gas to the reactor, the bypass valve is air-to-close and the heat-exchanger valve is air-to-open.
57
The total air stream after mixing enters a heater that is used to add heat during startup and for openloop testing of the individual components of the system. Then the air stream enters the "reactor." Because of safety, environmental and cost-of-raw-material concerns, we do not use real chemicals. An exothermic adiabatic tubular reactor is simulated by using a vessel with an electric heater. The instrumentation looks at the inlet temperature and adjusts power to raise the exit temperature to the desired level. The reactor gain (i.e., how much the reactor exit temperature changes for a given change in the inlet temperature) is set to simulate a typical change in a chemical reaction rate with temperature. The instrumentation to achieve this is shown in Figure 3. The gain in the computing relay can be adjusted to give the desired reactor gain. The bot gas leaving the reactor passes through the shell side of the FEHE and a rotameter and is vented to the atmosphere.
The power controllers in the heater and reactor are 110 volt SCR units driving the type of electrical heating element used in heat guns (commonly used for paint removal). They
Reactor/heater Heating elements Temperature indicator Heat exchanger Controller
TABLE 1 Equipment List
See Fig. 9
Control valves =%trim, 1/2" trim Throttle valve 1/P transducers Air supply regulator 4-way valves
Manual valves Integral-orifice flow transmitter Instrument air regulator Recorder/Logger multi-trend, 8 inputs Panel lights and switches
SCR controller Control console Software for recorder Piping and fittings Computing relay reactor gain
Thermocouples Flow switch Rota meter Relief valve Air filter and drier
Flow indicator Gages Temperature transmitter Support frame
Total Equipment Cost
58
Cost ($/unit) No. Cost
1,100 30
450 500 700
400 125 500 150 125
125 1,400
150 3,500
l00
2,100 1,800
300
500
35 100 350 50
200
350 25
1,150 500
2 2,200 2 60
450 500 700
2 800 125
2 1,000 I 150 3 375
3 375 3 4,200 I 150 I 3,500 3 300
2 4,200 1,800
300 500 500
IO 350 100 350 50
200
I 350 4 100
1,150 500
$25,335
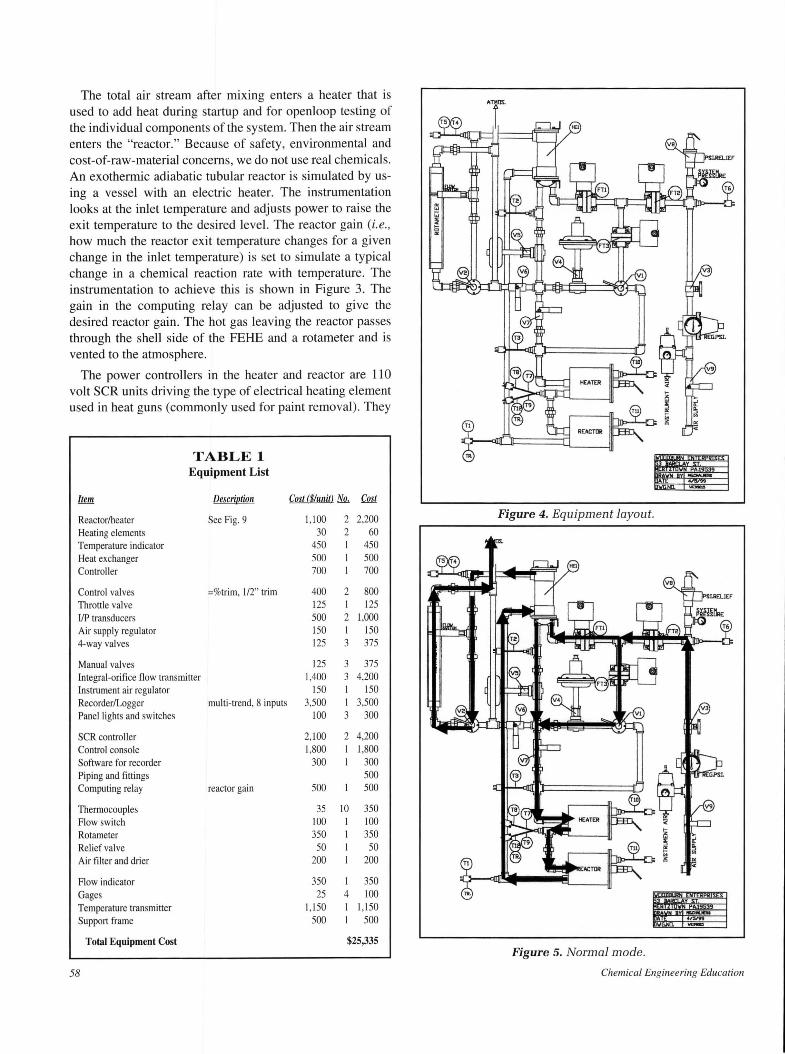
Figure 4. Equipment layout.
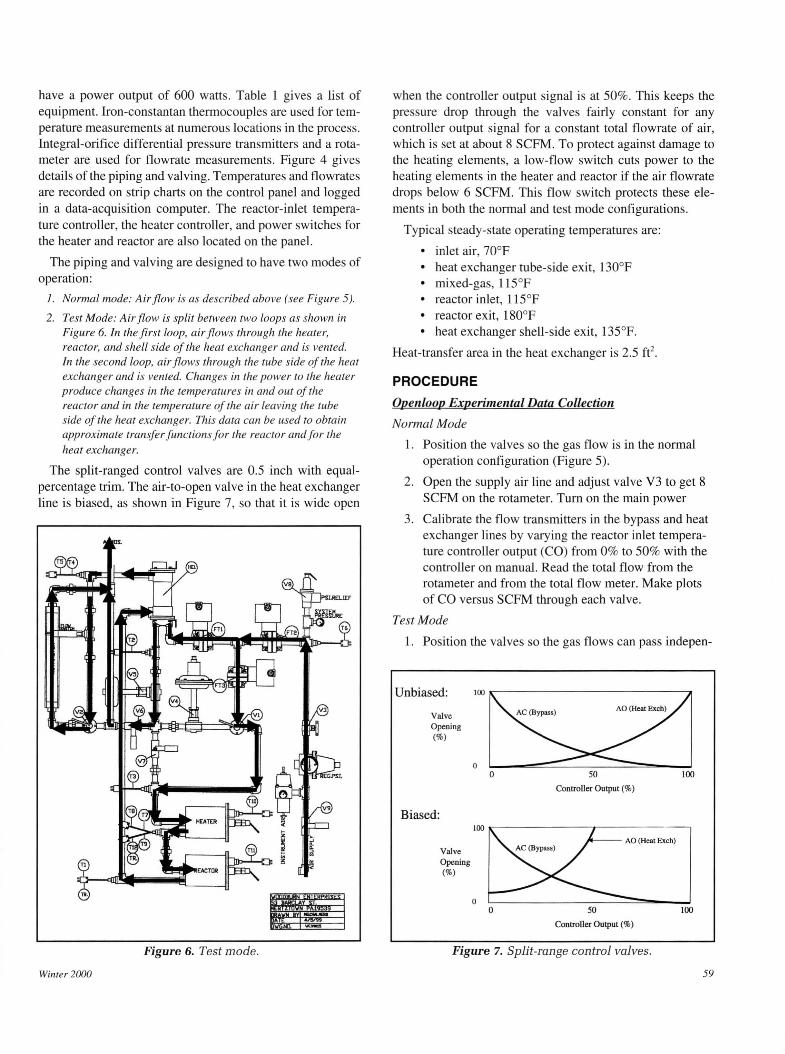
Figure 5. Normal mode.
Chemical Engineering Education
have a power output of 600 watts. Table 1 gives a list of equipment. Iron-constantan thermocouples are used for temperature measurements at numerous locations in the process. Integral-orifice differential pressure transmitters and a rotameter are used for flowrate measurements. Figure 4 gives details of the piping and valving. Temperatures and flowrates are recorded on strip charts on the control panel and logged in a data-acquisition computer. The reactor-inlet temperature controller, the heater controller, and power switches for the heater and reactor are also located on the panel.
The piping and valving are designed to have two modes of operation:
1. Normal mode: Air flow is as described above (see Figure 5).
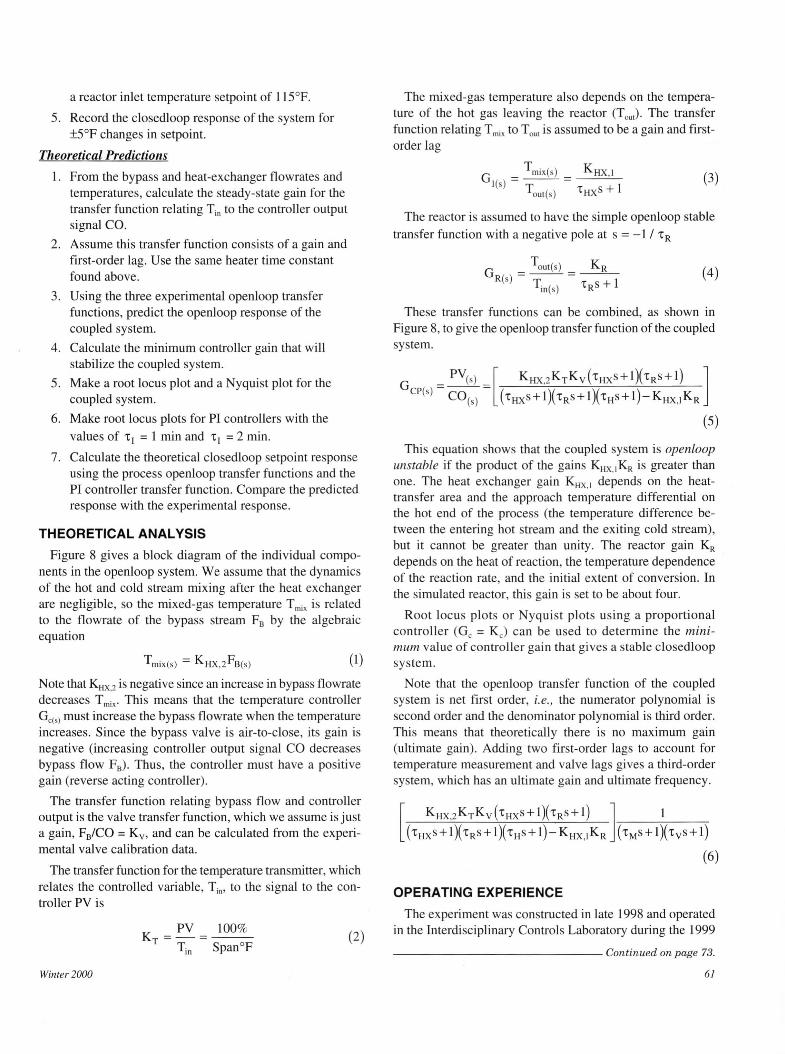
2. Test Mode: Air flow is split between two loops as shown in Figure 6. In the first loop, air flows through the heater, reactor, and shell side of the heat exchanger and is vented. In the second loop, air flows through the tube side of the heat exchanger and is vented. Changes in the power to the heater produce changes in the temperatures in and out of the reactor and in the temperature of the air leaving the tube side of the heat exchanger. This data can be used to obtain approximate transfer functions for the reactor and for the heat exchanger.
The split-ranged control valves are 0.5 inch with equalpercentage trim. The air-to-open valve in the heat exchanger line is biased, as shown in Figure 7, so that it is wide open
Figure 6. Test mode.
Winter2000
when the controller output signal is at 50%. This keeps the pressure drop through the valves fairly constant for any controller output signal for a constant total flowrate of air, which is set at about 8 SCFM. To protect against damage to the heating elements, a low-flow switch cuts power to the heating elements in the heater and reactor if the air flowrate drops below 6 SCFM. This flow switch protects these elements in both the normal and test mode configurations.
Typical steady-state operating temperatures are:
• inlet air, 70°F • heat exchanger tube-side exit, l30°F • mixed-gas, l l 5°F • reactor inlet, l 15°F • reactor exit, l 80°F • heat exchanger shell-side exit, 135°F.
Heat-transfer area in the heat exchanger is 2.5 ft2•
PROCEDURE Openloop Experimental Data Collection
Normal Mode
1. Position the valves so the gas flow is in the normal operation configuration (Figure 5).
2. Open the supply air line and adjust valve V3 to get 8 SCFM on the rotameter. Tum on the main power
3. Calibrate the flow transmitters in the bypass and heat exchanger lines by varying the reactor inlet temperature controller output (CO) from 0% to 50% with the controller on manual. Read the total flow from the rotameter and from the total flow meter. Make plots of CO versus SCFM through each valve.
Test Mode
l. Position the valves so the gas flows can pass indepen-
Unbiased:
Valve Opening (%)
Biased:
Valve Opening (%)
100
0
100
0
0
0
50
Controller Output (%)
AO (Heat Exch)
50
Controller Output(%)
Figure 7. Split-range control valves.
100
100
59

dently through the reactor and the heat exchanger in the test mode (see Figure 6).
2. With the temperature controller in manual, adjust the controller output to 15%.
3. Turn on power to the heater and adjust the heater controller to obtain an exit temperature of about 115°F.
4. Turn on the power to the reactor. Let the process come to steady state.
5. Calculate energy balances around the heat exchanger and calculate the overall heat-transfer coefficient U.
6. Make a step change in the heater power and record the responses of the reactor inlet temperature, the reactor exit temperature, and the heat exchanger tube-side exit temperature. Use this data to calculate the openloop transfer function for the heat exchanger relating T HX to Tout and the openloop transfer function for the reactor relating T;n to Tout·
7. Turn off the power to the heater and reactor. Wait for two minutes with air flowing to cool off the system.
Closedloou. Exu.erimental Data
l. Start up the system in the normal operating mode with heater and reactor power off. With the reactor inlet temperature controller on manual, set its output at 50%. Turn on power to the heater and to the reactor.
2. When the reactor inlet temperature reaches 95°F, turn off the heater power. Observe what happens to the reactor inlet and exit temperatures .
3. Turn the power to the heater back on. When the reactor inlet tempera-ture reaches 120°F, turn off the heater power. Observe what happens to the reactor inlet and exit tempera-tures.
4. Put the reactor inlet temperature controller on automatic with I<., = 5 (with a temperature transmitter span
of 160°F) and 't1 = 2 min, and with
60
Tmix
T '!HXs+l out
c~ KvKTKHx ,2(-ZHXs+l)(-zRs+l) ~v ('!HXS + l)('!RS + l)('!HS + 1)- KHX,IKR
Figure 8. Block diagrams of openloop coupled system.
5.000 DIA. 4.aOODIA.
5.826 BC.8 801.T'S ll/18"X24
'-------6.000 - -------
1.56001A. 1.750 DIA.
/ 1/Z"FNPT
1/nN'T-1""1.JBE AIW'TER
Alumina Oxide RTC-60-2 Regular Cotronics Corporation 3379 Shore Paricway Brooklyn NY.11235
NOTE:- Mold per Dwg.99030 NOTE:- Gnnd off ears to match element O.D.
P-03020-60 Heater Element 110VAC Cole Parmer 625 East Bunker Court Vernon Hills IL.60061-1844
WOODBURN ENTERPRISES 53 BARCLAY ST. MERTZTOWN PA 19539 DRAWN BY MG.CHALMERS DATE 4/17/99 DWG.NO. WE99028
Figure 9. Reactor/heater vessel
Chemical Engineering Education
a reactor inlet temperature setpoint of I 15°F.
5. Record the closedloop response of the system for ±5°F changes in setpoint.
Theoretical Predictions
I. From the bypass and heat-exchanger flowrates and temperatures, calculate the steady-state gain for the transfer function relating Tin to the controller output signal CO.
2. Assume this transfer function consists of a gain and first-order lag. Use the same heater time constant found above.
3. Using the three experimental openloop transfer functions, predict the open loop response of the coupled system.
4. Calculate the minimum controller gain that will stabilize the coupled system.
5. Make a root locus plot and a Nyquist plot for the coupled system.
6. Make root locus plots for PI controllers with the values of -r 1 = I min and -r 1 = 2 min.
7. Calculate the theoretical closedloop setpoint response using the process openloop transfer functions and the PI controller transfer function. Compare the predicted response with the experimental response.
THEORETICAL ANALYSIS
Figure 8 gives a block diagram of the individual components in the openloop system. We assume that the dynamics of the hot and cold stream mixing after the heat exchanger are negligible, so the mixed-gas temperature T mix is related to the flowrate of the bypass stream Fe by the algebraic equation
(1)
Note that KHx.2 is negative since an increase in bypass flowrate decreases T mix· This means that the temperature controller Gc(s) must increase the bypass flowrate when the temperature increases. Since the bypass valve is air-to-close, its gain is negative (increasing controller output signal CO decreases bypass flow Fe). Thus, the controller must have a positive gain (reverse acting controller) .
The transfer function relating bypass flow and controller output is the valve transfer function , which we assume is just a gain, Fe/CO = Kv, and can be calculated from the experimental valve calibration data.
The transfer function for the temperature transmitter, which relates the controlled variable, Tin• to the signal to the controller PV is
K _ PV 100%
T -Tin Span°F
(2)
Winter2000
The mixed-gas temperature also depends on the temperature of the hot gas leaving the reactor (T0 .,). The transfer function relating T mix to T0 ., is assumed to be a gain and firstorder Jag
G _ Tmix(s) _ KHX,l
I() - -5 Tout (s) 1 Hx S + l
(3)
The reactor is assumed to have the simple openloop stable transfer function with a negative pole at s = -1 / 'tR
G _ Tout (s) _ ~ R(s) - T - 't S + I
m(s) R
(4)
These transfer functions can be combined, as shown in Figure 8, to give the openloop transfer function of the coupled system.
This equation shows that the coupled system is openloop unstable if the product of the gains KHx. iKR is greater than one. The heat exchanger gain KHx. 1 depends on the heattransfer area and the approach temperature differential on the hot end of the process (the temperature difference between the entering hot stream and the exiting cold stream), but it cannot be greater than unity. The reactor gain KR depends on the heat of reaction, the temperature dependence of the reaction rate, and the initial extent of conversion. In the simulated reactor, this gain is set to be about four.
Root locus plots or Nyquist plots using a proportional controller (Ge = Kc) can be used to determine the minimum value of controller gain that gives a stable closedloop system.
Note that the openloop transfer function of the coupled system is net first order, i.e., the numerator polynomial is second order and the denominator polynomial is third order. This means that theoretically there is no maximum gain (ultimate gain) . Adding two first-order lags to account for temperature measurement and valve lags gives a third-order system, which has an ultimate gain and ultimate frequency.
[ KHx,2KTKv(-rHXs+l)(-rRs+l) l 1
(-rHXs+ 1 )(-rRs + 1 )(-rHs + 1)- KHX,IKR (-rMs + 1 )(-rvs + 1)
(6)
OPERATING EXPERIENCE
The experiment was constructed in late 1998 and operated in the Interdisciplinary Controls Laboratory during the 1999
---------------Continued on page 73.
6/
Laboratory Experiment Continued from page 61.
spring semester. Four groups of students ran the experiment. Each group was in the laboratory collecting data during three consecutive three-hour laboratory periods (a week and a half) . The theoretical analysis took about a week. Reports were due at the end of the third week.
The initial experimental temperature data was inconsistent and unreliable due to transmitter and recorder calibration problems. We also had to reduce the size of the control valves and change the trim from linear to equal percentage. Once these hardware bugs were worked out, the students were able to collect and analyze good data. Energy balance revealed significant heat losses because of the small scale of the equipment. Additional insulation was added.
Although the digital data logger is convenient for storing data for later plotting and for making calculations, an oldfashioned multichannel analog strip-chart paper recorder made it much easier to follow the dynamic transients as they occurred.
The response of the students was quite posi tive. They found the experiment both challenging and educational. The chemical engineering students were particularly interested in this experiment because many of them were working in their design course on dynamic simulations of chemical processes that featured reactor/heat-exchanger systems.
INTERESTING FEATURES
The coupled system is openloop unstable, but whether the temperature increases or decreases depends on the initial conditions. At low-temperature initial conditions, temperature drops exponentially. At high-temperature initial conditions, temperature increases exponentially. This is what should occur in Steps 2 and 3 of the Closedloop Experimental Data Procedure. The mechanical equivalent of this phenomenon is the trajectory of an inverted pendulum; it can fall to either one side or the other, depending on the initial position and velocity.
Runs with different reactor gains can be made to illustrate how this parameter affects the rate of the openloop runaway (or quench) and how it affects controller tuning.
Another modification is to run with different beat exchanger areas. This can be achieved by having two heat exchangers in series (on both the tube and shell sides) that can be valved in or out of the system.
ACKNOWLEDGMENT
The process and instrumentation hardware was designed and constructed by Matthew (Scotty) Chalmers and Bill Bechtel. Funds were provided by Ernst Benzien and the Pennsylvania Equipment Grant Program, and instrumenta-
Wimer 2000
tion equipment was provided by Honeywell.
NOMENCLATURE F
8 flowrate through bypass
Ge controller transfer function
Ger openloop transfer function of coupled system
GH heater openloop transfer function relating T in to Tmi,
GHx., heat exchanger transfer function relating T out to T in
GHx.2 heat exchanger transfer function relating T out to F 8
GR reactor openloop transfer function relating T in to T out
Kc controller gain
KH gain of heater openloop transfer function relating T in to T .
mi.
KHx., gain of heat exchanger transfer function relating T out to
T in
KHx.2 gain of heat exchanger transfer function relating T out to FB
KR gain of reactor open loop transfer function relating Tin to
T out
Ku ultimate gain
't H time constant of heater open loop transfer function
relating T in to T mi, [min]
'tHx ,1 time constant of heat exchanger transfer function relating
T out to T in [min]
't HX,2 time constant of heat exchanger transfer function relating
T out to FB [min]
't R time constant of reactor open loop transfer function
relating Tin to T out [min]
't I controller reset time [min]
REFERENCES 1. Bequette, B.W., K.D. Schott, V. Prasad, V. Natarajan, and
R.R. Rao, "Case Study Projects in an Undergraduate Process Control Course," Chem. Eng. Ed. , 32(3), 214 (1998)
2. Lennox, B., and M. Brisk, "Network Process Control Laboratory," Chem. Eng. Ed. , 32(4), 314 (1998)
3. Johnson, S.H. , W.L. Luyben, and D.L. Talhelm, "Undergraduate Interdisciplinary Controls Laboratory," J . of Eng. Ed., 84 (2), 133 (1995)
4. Douglas , J.M., J.C. Orcutt, and P .W. Berthiaume, "Design and Control of Feed-Effluent Exchanger-Reactor Systems," Ind. Eng. Chem. Funds. , 1,253 (1962)
5. Anderson, J.S., "A Practical Problem in Dynamic Heat Transfer ," The Chem. Engr. , 97 (1966)
6. Silverstein, J.L., and R. Shinnar, "Effect of Design on the Stability and Control of Fixed Bed Catalytic Reactors with Heat Feedback. 1. Concepts," Ind. Eng. Chem. Proc. Des. Dev., 21 , 241 (1982)
7. Tyreus, B.D., and W.L. Luyben, "Unusual Dynamics of a Reactor/Preheater Process with Deadtime, Inverse Response and Openloop Instability," J . Proc. Cont., 3, 241 (1993)
8. Jones, W.E ., and J.A. Wilson, "An Introduction to Process Flexibility. 1. Heat Exchange," Chem. Eng. Ed. , 31, 172 (1997)
9. Luyben, W.L., "Internal and External Openloop Instability," Ind. Eng. Chem. Res., 37(7), 2713 (1998)
10. Luyben, W.L., B.D. Tyreus, and M.L. Luyben, Plantwide Process Control, McGraw-Hill Book Co., New York, NY (1999) 0
73