


Languages
Pages
Legal


T1rho MRI in Brain Aging, Lumbar
Disc Degeneration, and Liver Fibrosis:
Clinical and Experimental Studies
ZHAO, Feng
A Thesis Submitted in Partial Fulfillment of the Requirements for the Degree of
Doctor of Philosophy in
Imaging and Interventional Radiology
The Chinese University of Hong Kong July 2013
Thesis/Assessment Committee
Professor James F. Griffith (Chair)
Professor Wang Yi-xiang (Thesis Supervisor)
Professor Yuan Jing (Thesis Co-supervisor)
Professor Yeung Ka Wai David (Committee Member)
Professor Lu Gang (Committee Member)
Professor Liu Xin (External Examiner)

論文評審委員會
James F. Griffith 教授 (主席)
王毅翔 教授 (論文導師)
袁璟 教授 (論文共同導師)
Yeung Ka Wai David 教授 (委員)
路剛 (委員)
劉新 教授 (校外委員)

i
ABSTRACT
T1rho relaxation is spin-lattice relaxation in the rotating frame. It determines the
decay of the transverse magnetization in the presence of a spin-lock radiofrequency
pulse, which applied along the transverse magnetization. T1rho MRI is sensitive to
low frequency motional processes, so it can be used to investigate the interaction
between water molecules and their macromolecular environment. T1rho imaging is
suggested to have the potential to identify early biochemical changes in tissues.
Aging and chronic hypertension are two major risk factors for common
neurodegenerative disease. However, whether normal brain aging and chronic
spontaneous hypertensive are associated with brain T1rho values changes were not
reported. We longitudinally measured the T1rho value in rat brain of Sprague-Dawley
(SD) rats from 5-month to 15-month, and spontaneous hypertensive rats (SHR) with
Wistar Kyoto (WKY) rats from 6-month to 12-month. The T1rho values in three brain
regions of thalamus, hippocampus, and cortices increased with aging process, and
were significantly higher in SHR than WKY rats.
For intervertebral disc, the correlation between T1rho and degenerative grade has
been reported. However, whether and how T1rho specifically offer better evaluation
of disc degeneration compared with T2 was not studied previously. T1rho and T2

ii
value of nucleus pulposus (NP) and annulus fibrosus (AF) was compared with
reference to the five-level and eight-level semi-quantitative disc degeneration grading
systems. For NP, T1rho and T2 decreased quadratically with disc degeneration grades
and had no significant trend difference (P=0.40). In NP, T1rho and T2 decrease in a
similar pattern following disc degeneration. For AF, T1rho and T2 decreased linearly
and the slopes of T2 were significantly flatter than those of T1rho (P<0.001).
Therefore, the T1rho is better suited for evaluating AF in degenerated disc than T2.
Liver fibrosis, a common feature of almost all causes of chronic liver disease,
involves macromolecules accumulated within the extracellular matrix. Male
Sprague-Dawley rats received intraperitoneal injection of 2 ml/kg CCl4 twice weekly
for up to 6 weeks. Then CCl4 was withdrawn for recovery. The liver T1rho values
increased slightly on day 2, then increased further and were highest at week 6 post
CCl4 insults, and decreased upon the withdrawal of the CCl4 insult. This study
demonstrated that T1rho MRI is a valuable imaging biomarker for liver injury and
fibrosis induced by CCl4. Liver T1rho value was only mildly affected by edema and
acute inflammation when there was no apparent fibrosis.
To translate liver T1rho MRI to clinical application, the technical feasibility of
T1rho MRI in human liver was explored and the normal range of T1rho values in
healthy volunteers was determined. We found it is feasible to obtain consistent liver

iii
T1rho measurement for healthy human liver with six spin-lock time (SLT) points of 1,
10, 20, 30, 40, and 50ms; the mean liver T1rho value of the healthy subjects was
42.5ms, with a range of 38.8-46.5ms. Adopting 3-SLT points of 1, 20, and 50ms for
T1rho measurement could provide reliable measurement and reduce the scanning time,
while 2-SLT points of 1 and 50ms do not provide reliable measurement.
(500 words)

iv
摘要
T1rho 弛豫是旋轉坐標系中的自旋晶格弛豫,它決定橫向磁化向量在存有自旋
鎖定射頻脈衝情況下的衰減,自旋鎖定脈衝與橫向磁化向量同向。T1rho 磁共振
成像對於低頻運動過程敏感,故可研究水與其周大分子物質環境間的交互作用,
有鑒別組織內早期生化改變的潛力。
衰老與慢性高血壓是常見腦退行性疾病的兩個主要危險因素。但是正常腦衰老
過程及慢性高血壓兩個因素與腦組織 T1rho 是否有相關性,尚缺乏研究。序貫性
測量 SD 老鼠自 5 至 15 月齡、WKY(血壓正常)和 SHR(患有自發性高血壓)
老鼠自 6 至 12 月齡的雙側丘腦、海馬、和皮質的腦組織 T1rho 值。發現三組老
鼠的丘腦、海馬及皮質的 T1rho 均隨年齡增長而增高;且 SHR 的顯著高於 WKY
老鼠。
T1rho 值與椎間盤退變等級的相關性已有報導。但相比 T2 值,T1rho 在評價
椎間盤退變方面是否優於或如何優於 T2 值尚缺乏研究。將椎間盤髓核及纖維環
的 T1rho 和 T2 值與 5 級和 8 級椎間盤退變等級系統做比較;發現髓核的 T1rho
及 T2 與椎間盤退變等級的相關性均呈二次函數降低,且無顯著差別(P=0.40)。
纖維環的 T1rho 及 T2 與椎間盤退變等級的相關性呈線性函數降低,T2 降低的斜
率明顯比 T1rho 降低的斜率要平坦(P<0.001)。故 T1rho 值比 T2 值更加適合評價
纖維環退變,而兩者在評價髓核時相似。

v
肝纖維化是幾乎所有慢性肝病的常見特徵,包括大分子物質在細胞外基質的
沉積。選用四氯化碳 CCl4 腹腔注射 6 周來製造肝纖維化模型。肝臟 T1rho 在注
射後的第二天輕度上升,然後持續上升,直到注射六周後 T1rho 達最高值,此後
T1rho 隨 CCl4 注射停止而降低。顯示 T1rho 磁共振成像對於監測慢性注射 CCl4
誘導的肝纖維化及肝損傷有價值。當沒有明顯肝纖維化時,肝 T1rho 輕微受水腫
及急性炎症的影響。
為將肝臟 T1rho 磁共振成像轉化到臨床使用,我們研究了其可行性,以及正
常志願者肝臟 T1rho 值分佈範圍。發現採用六個自旋鎖定時間來測量健康志願者
肝 T1rho,結果有較高的可重複性和一致性,肝 T1rho 平均值為 42.5ms,分佈範
圍為 38.8 到 46.5ms。採用三個自鎖鎖定時間點掃描,可以減少一半掃描時間,
且可以得到可信的肝 T1rho 值,但採用兩個自旋鎖定時間點則不行。
(799 字)
vi
ACKNOWLEDGEMENTS
I would like to express my deepest gratitude to my supervisor Prof. Wang Yi-Xiang
for his inspiration, guidance, support and encouragement during the course of my
study and preparation of this thesis. He is an enthusiastic scientist, a role model for
me. He teaches me not only the knowledge but also the principle on how to become a
scientist for exploring the unknowns. I treasure everything I learned from him, which
helped me accomplish my study with smoothness and will continue to help me thrive
in my future career. Without his continuous support and encouragement, this work
would not have been possible.
I would like to acknowledge my co-supervisor Prof. Yuan Jing for his guidance,
support and encouragement. Especially in aspect of MRI technology, he gives me
great supports. I am grateful for his expert advice and valuable discussion during the
years.
Special thanks are extended to Dr. Lu Gang, Dr. Deng Min, Dr. Lau Shuang, Dr.
Lau Pi-Chu, Dr. Chu Eagle, Dr. Wang Yong, Dr. Zen Xian-Jun, Dr. He Lai-Chang, Dr.
Yu Jian-Wen, and Mr. Qing Wei. Thanks to all of them for helping me throughout my
doctoral program, not only in research work, but also in daily life.
I also appreciate the MR staff members of the Department of Imaging and
Interventional Radiology in the Chinese University of Hong Kong for their kind

vii
assistance in this work.
Further thanks are due to all the volunteers who participated in this project.
Last but not least, I would like to express my endless gratitude to my parents and
my girlfriend, my mother in particular, for their love, understanding and selfless
support.
viii
LIST OF FIGURES
Figure 1.1: The diagram of the magnetization evolution during a spin-lock pulse
cluster.
Figure 1.2: The diagram of radiofrequency pulse sequence cluster for T1rho
magnetization preparation. The flip angle of PSL is calculated by
θ = 2π ∙ FSL ∙ SLT.
Figure 1.3: The diagram of rotary echo spin-lock pulse cluster for T1rho
magnetization preparation. The flip angle of PSL is calculated by
θ = 2π ∙ FSL ∙ SLT/2.
Figure 1.4: Block diagram for a typical T1rho imaging experiment. The purpose of
each module is described above the block.
Figure 2.1: Diagram of the sequence, which is the spin-lock fast field echo (FFE)
imaging sequence for T1rho MRI, the rotary echo spin-lock pulse cluster
is used for T1rho preparation. SLT= spin-lock time.
Figure 2.2: Diagram of the sequence, which is the spin-lock fast field echo (FFE)
imaging sequence for T1rho MRI, the rotary echo spin-lock pulse cluster
is used for T1rho preparation. The inversion TFE prepulse (inversion
time=1700 ms) is inserted before the T1rho preparation pulse for fluid

ix
attenuation. SLT= spin-lock time.
Figure 2.3: T1rho MR scanning schedule for SD rats, WKY rats and SHR. For the SD
rats, fluid attenuation was used in order to remove the contribution from
CSF to T1rho maps. SLT= spin-lock time.
Figure 2.4: T1rho-weighted images of a SD rat with spin-lock time points of 1ms,
20ms, and 50ms. The bilateral thalamus (T), hippocampus (H), and
cortices (C) were manually defined in the T1rho map according the
standard rat brain atls by Paxinos, G. and Watson, C. (2005) (see Figure
2.5). SLT= spin-lock time.
Figure 2.5: T1rho-weighted images of a SHR with spin-lock time points of 1ms, 20ms,
50ms, and 80ms (upper and middle row). The bilateral thalamus (T),
hippocampus (H), and cortices (C) were manually defined in the T1rho
map (left lower) according the standard rat brain atls (right lower) by
Paxinos, G. and Watson, C. (2005). Note that the MRI image does not
exactly match with the atlas image because they have different slice
thickness (1.5 mm for the MRI image and 0.12 mm for the atlas image).
SLT= spin-lock time.
Figure 2.6: T1rho values in the thalamus of SD rats at the age of 5, 8, 10, and 15
months. ***: p<0.001, **: p<0.01.
x
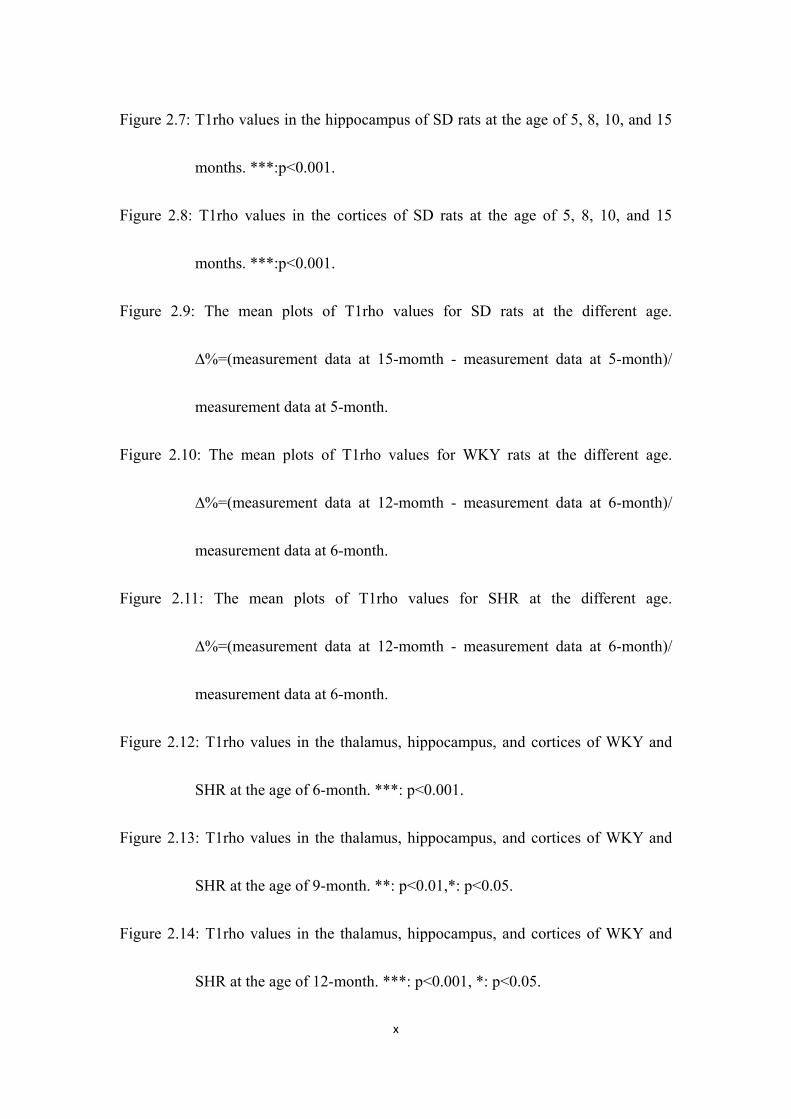
Figure 2.7: T1rho values in the hippocampus of SD rats at the age of 5, 8, 10, and 15
months. ***:p<0.001.
Figure 2.8: T1rho values in the cortices of SD rats at the age of 5, 8, 10, and 15
months. ***:p<0.001.
Figure 2.9: The mean plots of T1rho values for SD rats at the different age.
∆%=(measurement data at 15-momth - measurement data at 5-month)/
measurement data at 5-month.
Figure 2.10: The mean plots of T1rho values for WKY rats at the different age.
∆%=(measurement data at 12-momth - measurement data at 6-month)/
measurement data at 6-month.
Figure 2.11: The mean plots of T1rho values for SHR at the different age.
∆%=(measurement data at 12-momth - measurement data at 6-month)/
measurement data at 6-month.
Figure 2.12: T1rho values in the thalamus, hippocampus, and cortices of WKY and
SHR at the age of 6-month. ***: p<0.001.
Figure 2.13: T1rho values in the thalamus, hippocampus, and cortices of WKY and
SHR at the age of 9-month. **: p<0.01,*: p<0.05.
Figure 2.14: T1rho values in the thalamus, hippocampus, and cortices of WKY and
SHR at the age of 12-month. ***: p<0.001, *: p<0.05.

xi
Figure 3.1: Diagram of the sequence for T1rho MRI, which is the spin-lock balanced
fast field echo (b-FFE) imaging sequence for T1rho MRI, the rotary echo
spin-lock pulse cluster is used for T1rho preparation. SLT= spin-lock
time.
Figure 3.2: An example of placement of regions-of-interest (ROIs) over nucleus
pulposus (#), anterior annulus fibrosus (*), and posterior annulus fibrosus
(^) in one disc of T2-weighted image (left), T1rho map (middle), and T2
map (right).
Figure 3.3: A: The relationship between T1rho value of nucleus pulposus (NP) and
8-level degeneration grading. B: The relationship between T2 value of
nucleus pulposus (NP) and 8-level degeneration grading. *:p<0.05;
**:p<0.01; ***:p<0.001; n.s.: not significant.
Figure 3.4: A: The quadratic regression of T1rho value of nucleus pulposus (NP)
against 8-level degeneration grading. B: The quadratic regression of T2 of
nucleus pulposus (NP) against 8-level degeneration grading.
Figure 3.5: A: The relationship between T1rho value of nucleus pulposus (NP) and
5-level degeneration grading. B: The relationship between T2 value of
nucleus pulposus (NP) and 5-level degeneration grading. *:p<0.05;
**:p<0.01; ***:p<0.001; n.s.: not significant.

xii
Figure 3.6: A: The quadratic regression of T1rho value of nucleus pulposus (NP)
against 5-level degeneration grading. B: The quadratic regression of T2 of
nucleus pulposus (NP) against 5-level degeneration grading.
Figure 3.7: A: The relationship between T1rho value of annulus fibrosus (AF) and
8-level degeneration grading. B: The relationship between T2 value of
annulus fibrosus (AF) and 8-level degeneration grading. *:p<0.05;
**:p<0.01; ***:p<0.001; n.s.: not significant.
Figure 3.8: A: The linear regression of T1rho value of annulus fibrosus (AF) against
8-level degeneration grading. B: The linear regression of T2 of annulus
fibrosus (AF) against 8-level degeneration grading.
Figure 3.9: A: The relationship between T1rho value of annulus fibrosus (AF) and
5-level degeneration grading. B: The relationship between T2 value of
annulus fibrosus (AF) and 5-level degeneration grading. *:p<0.05;
**:p<0.01; ***:p<0.001; n.s.: not significant.
Figure 3.10: A: The linear regression of T1rho value of annulus fibrosus (AF) against
5-level degeneration grading. B: The linear regression of T2 of annulus
fibrosus (AF) against 5-level degeneration grading.
Figure 4.1: Schedule of CCl4 administration for the induction of liver fibrosis in adult
Sprague-Dawley rats, MRI data acquisition and liver histology.

xiii
Figure 4.2: Diagram of the sequence for T1rho MRI, which is the spin-lock balanced
fast field echo (b-FFE) imaging sequence for T1rho MRI, the rotary echo
spin-lock pulse cluster is used for T1rho preparation. SLT= spin-lock
time.
Figure 4.3: One typical rat’s T1rho-weighted image acquired with different spin-lock
times (SLT) ranging from 1 to 50ms (A-F). One typical rat’s coefficient of
determination (R2) map (G), T1rho map without R2 evaluation (H), and
T1rho map with R2>0.8 evaluation (I).
Figure 4.4: Longitudinal follow-up MRI measurements of rat liver T1rho values.
Figure 4.5: Typical T1rho maps of rat liver at different time phases.
Figure 4.6: Longitudinal follow-up MRI measurements of relative rat liver signal
intensity on T2WI .
Figure 4.7: H&E staining of rat liver tissue at different time phase. A: control rats, no
abnormality in parenchymal architecture; B: At day two after CCl4 insult,
infiltration of inflammatory cells, intracellular deposition of fat vacuoles
and hepatocellular swelling; C: At week 2 of CCl4 insult, presence of
necrotic cells; D & E: At week 4 & 6 of CCl4 insult, necrotic cells
progressed with the time of CCl4 insult; F: At 4 weeks after the
withdrawal of CCl4, active inflammation, fatty infiltration and necrotic

xiv
cells were no longer observed. Note: * fatty inclusion, # inflammation, ^
necrosis.
Figure 4.8: Picrosirius-red staining of rat liver tissue at different time phase. A:
control rats, no abnormality in parenchymal architecture; B: At day two
after CCl4 insult, intracellular deposition of fat vacuoles, no apparent
collagen deposition was observed for this time point; C: At week 2 of
CCl4 insult, early fibrosis was observed, with scattered collagen
deposition in the sinusoids of the peri-central lobular area without septa;
D & E: At week 4 & 6 of CCl4 insult, fibrosis progressed with the time of
CCl4 insult; F: At 4 weeks after the withdrawal of CCl4, mild residual
fibrous bands were still present. Note: f: fibrosis, * fatty inclusion
Figure 5.1: Coronal (left) and sagittal (right) scout images. Three axial slices are
selected to cut though the upper (slice 1), middle (slice 2) and lower (slice
3) liver.
Figure 5.2: Diagram of the sequence for T1rho MRI, which is the spin-lock balanced
fast field echo (b-FFE) imaging sequence for T1rho MRI, the rotary echo
spin-lock pulse cluster is used for T1rho preparation. SLT= spin-lock
time.
Figure 5.3: One healthy volunteer’s T1rho map constructed with 6-SLT, with

xv
coefficient of determination R2>0.8 evaluation. Five regions of interest
(ROIs) are placed on the liver parenchyma region, excluding observable
artifacts and blood vessels.
Figure 5.4: The T1rho-weighted images acquired with different spin-lock time (SLT)
ranging from 1 to 50ms.
Figure 5.5: One healthy volunteer’s T1rho maps constructed using 6-SLT (upper row),
3-SLT (middle row), and 2-SLT (lower row). Left column: coefficient of
determination (R2) maps, middle column: T1rho maps without R2
evaluation, right column: T1rho maps with R2>0.8 evaluation. When SLT
point decrease, R2 evaluation is less efficient to remove blood vessel
contamination and artifact. When SLT point is 2, the R2 is always equal to
one, so no pixels are excluded by criteria of R2>0.8.
Figure 5.6: Bland and Altman plots for comparison of 3-SLT v.s. 6-SLT liver T1rho
measurement (A) and 2-SLT v.s. 6-SLT liver T1rho measurement (B).
3-SLT measurement demonstrates good agreement with 6-SLT
measurement. SLT= spin-lock time.

xvi
LIST OF TABLES
Table 2.1: T1rho values (mean±SD) in the thalamus, hippocampus, and cortices of SD
rats at age of 5, 8, 10 and 15 months.
Table 2.2: T1rho values (mean±SD) in the thalamus, hippocampus, and cortices of
WKY rats and SHR at age of 6, 9, and 12 months.
Table 4.1: Liver T1rho values and normalized liver signal intensity on T2-weighted
images of eight rats without CCl4 insult in two MR scans with an
interval of 10 days.
Table 5.1: Liver T1rho values of healthy volunteer measured with 6, 3, and 2
spin-lock time (SLT) points.
Table 5.2: Comparison of liver T1rho values at fasting status and at post meal status.

xvii
LIST OF ABBREVIATIONS
1H hydrogen proton
17O oxygen
2D two-dimensional
3D three-dimensional
AD Alzheimer’s disease
AF annulus fibrosus
ANOVA one-way analysis of variance
B0 static magnetic field
B1 radiofrequency field strength
b-FFE balanced fast field echo
BOLD blood oxygen level-dependent
BSL spin-lock radiofrequency strength
C frontal cortices
CCl4 chronic carbon tetrachloride
CoV coefficient of variation
CSF cerebrospinal fluid
CT computed tomography
ETL echo train length
FFE fast field echo
FSL spin-lock frequency (in Hz)
fMRI functional magnetic resonance imaging
FOV field of view
GRE gradient echo

xviii
H hippocampus
H&E haematoxylin and eosin
ICC intraclass correlation coefficient
MTL medial temporal lobe
MRI magnetic resonance imaging
NP nucleus pulposus
NSA number of signal average
PD Parkinson’s disease
PDD Parkinson’s disease with dementia
PET positron emission tomography
R2 coefficient of multiple determinations
RF radiofrequency
ROI region of interest
SAR specific absorption rate
SD standard deviation
SD rat Sprague–Dawley rat
SE spin echo
SHR spontaneously hypertension rats
SLT spin-lock time
SPAIR spectral adiabatic inversion recovery
T thalamus
T1 spin-lattice relaxation time
T1rho
T2 transverse relaxation time
T2* effective transverse relaxation time

xix
T2WI T2-weighted image
TE echo time
TFE turbo field echo
TI inversion time
TR repetition time
TSE turbo spin echo
WKY rat Wistar Kyoto rat γ gyromagnetic ratio
Larmor frequency
spin-lock frequency (in rad)

xx

xxi
CONTENTS
ABSTRACT .................................................................................................................... i
ACKNOWLEDGEMENTS .......................................................................................... vi
LIST OF FIGURES ....................................................................................................viii
LIST OF TABLES ...................................................................................................... xvi
LIST OF ABBREVIATIONS .................................................................................... xvii
CONTENTS ................................................................................................................ xxi
CHAPTER 1 INTRODUCTION ................................................................................... 1
1.1 Conventional Magnetic Resonance Imaging ................................................... 1
1.1.1 Basic Principle of Conventional Magnetic Resonance Imaging ........... 1
1.1.2 T1 Relaxation ........................................................................................ 2
1.1.3 T2 Relaxation ........................................................................................ 3
1.2 T1rho Magnetic Resonance Imaging ............................................................... 3
1.2.1 T1rho Relaxation .................................................................................. 3
1.2.2 Principle of T1rho Magnetic Resonance Imaging ................................ 4
1.2.3 Radiofrequency Pulse for T1rho Magnetic Resonance Imaging .......... 5
1.2.4 T1rho-weighted Contrast Imaging and Application ........................... 10
1.2.5 Quantitative T1rho Mapping and Application .................................... 11
1.2.6 T1rho Dispersion and Application ...................................................... 13
1.3 Thesis Overview ............................................................................................ 14
CHAPTER 2 T1RHO MRI IN BRAIN AGING OF ANIMAL MODEL .................... 19
2.1 Introduction .................................................................................................... 19
2.2 Materials and Methods ................................................................................... 20
2.2.1 Animal Model of Brain Aging ............................................................ 20
xxii
2.2.2 T1rho Data Acquisition ....................................................................... 21
2.2.3 T1rho Data Processing ........................................................................ 23
2.2.4 T1rho Measurement and Statistical Analysis ...................................... 24
2.3 Results ............................................................................................................ 27
2.4 Discussion ...................................................................................................... 38
2.5 Summary ........................................................................................................ 42
CHAPTER 3 T1RHO MRI IN LUMBAR DISC DEGENERATION OF HUMAN
SUBJECTS .................................................................................................................. 43
3.1 Introduction .................................................................................................... 43
3.2 Methods.......................................................................................................... 45
3.2.1 Subjects ............................................................................................... 45
3.2.2 MR Image Acquisition ........................................................................ 46
3.2.2.1 T2-weighted MRI ..................................................................... 46
3.2.2.2 T2 Mapping Imaging ............................................................... 47
3.2.2.3 T1rho MRI ............................................................................... 47
3.2.3 Data Processing ................................................................................... 49
3.2.4 Data Measurement and Statistical Analysis ........................................ 49
3.3 Results ............................................................................................................ 52
3.3.1 Range of T1rho/T2 Values for Discs ................................................... 52
3.3.2 The Relationship between NP T1rho/T2 Values and 8-level
Degeneration Grading of Discs .................................................................... 52
3.3.3 The Relationship between NP T1rho/T2 Values and 5-level
Degeneration Grading of Discs .................................................................... 55
3.3.4 The Relationship between AF T1rho/T2 Values and 8-level
Degeneration Grading of Discs .................................................................... 58
3.3.5 The Relationship between AF T1rho/T2 Values and 8-level
xxiii
Degeneration Grading of Discs .................................................................... 61
3.4 Discussion ...................................................................................................... 64
3.5 Summary ........................................................................................................ 69
CHAPTER 4 T1RHO MRI IN RAT LIVER FIBROSIS MODEL INDUCED BY
CCL4 INSULT ............................................................................................................. 71
4.1 Introduction .................................................................................................... 71
4.2 Materials and Methods ................................................................................... 73
4.2.1 Animal Preparation ............................................................................. 73
4.2.2 MR Image Acquisition ........................................................................ 74
4.2.2.1 T2-weighted MRI ..................................................................... 75
4.2.2.2 T1rho MRI ............................................................................... 75
4.2.3 Data Processing ................................................................................... 76
4.2.4 Data Measurement and Statistical Analysis ........................................ 78
4.2.5 Histology Analysis .............................................................................. 79
4.3 Results ............................................................................................................ 80
4.3.1 T1rho Measurement Reproducibility .................................................. 80
4.3.2 Rat Liver T1rho Values at Different Time Phase ................................ 81
4.3.3 Relative Rat Liver Signal Intensity on T2WI at Different Time Phase
...................................................................................................................... 83
4.3.4 Histology Results ................................................................................ 84
4.4 Discussion ...................................................................................................... 86
4.5 Summary ........................................................................................................ 91
CHAPTER 5 T1RHO MRI IN LIVER OF HEALTHY HUMAN SUBJECTS .......... 93
5.1 Introduction .................................................................................................... 93
5.2 Methods.......................................................................................................... 95
5.2.1 Subjects ............................................................................................... 95

xxiv
5.2.2 MR Image Acquisition ........................................................................ 96
5.2.2.1 T2-weighted MRI ..................................................................... 96
5.2.2.2 T1rho MRI ............................................................................... 97
5.2.3 T1rho Data Processing ........................................................................ 99
5.2.4 T1rho Measurement .......................................................................... 100
5.3 Results .......................................................................................................... 102
5.3.1 T1rho Measurement Reproducibility ................................................ 105
5.3.2 T1rho Value Agreement of the Fasting Status with Post Meal Status
.................................................................................................................... 105
5.3.3 T1rho Value Agreement for T1rho Maps Constructed by Different
Spin-lock Time Points ................................................................................ 106
5.3.4 T1rho Value Range of Healthy Human Subjects .............................. 108
5.4 Discussion .................................................................................................... 108
5.5 Summary ...................................................................................................... 113
CHAPTER 6 GENERAL DISCUSSION AND FURTHER WORK ......................... 115
REFERENCES: ......................................................................................................... 119
LIST OF PUBLICATIONS........................................................................................ 138

1
CHAPTER 1 INTRODUCTION
1.1 Conventional Magnetic Resonance Imaging
1.1.1 Basic Principle of Conventional Magnetic Resonance Imaging
Magnetic resonance imaging (MRI) is a powerful and versatile medical imaging
technique and has been widely used in routine clinical practice. Compared with other
medical imaging methods such us computed tomography (CT), X-ray, and positron
emission tomography (PET), MRI provides high quality images with good soft tissue
contrast and has no ionizing radiation. T1-weighted imaging, T2-weighted imaging,
and proton-density weighted imaging are three most common imaging motilities for
routine clinical application.
Atoms with an odd number of protons and /or odd number of neutrons possess a
nuclear spin angular momentum, and therefore exhibit the MR phenomenon. In
biological specimens, hydrogen ( ), with a single proton, is the most abundant (the
body consists largely of O), the most sensitive (give rise to the largest signals), and
by far the most studied.
In the absence of an external magnetic field, the spins are oriented randomly and
the net macroscopic magnetic moment is zero. In the presence of an external magnetic

2
field B0, the magnetic moment vectors tend to align in the direction of B0 (z-direction
or longitudinal direction). In addition, the nuclear spins exhibit resonance at a Larmor
frequency . This Larmor frequency is dependent on the applied magnetic field
strength, and can be calculated from Larmor Equation:
= γ Equation [1.1]
where γ is the gyromagnetic ratio, a known constant for each type of atom (For ,
γ/2π = 42.58MHz/Tesla). In the context of magnetic resonance imaging, only oscillating signal can be
transmitted and received. To obtain an MR signal, a radiofrequency (RF) pulse B1 is
applied to flip the longitudinal magnetization into the x-y (transverse) plane, exciting
these spins out of equilibrium. The strength of B1 is much weaker than B0.
1.1.2 T1 Relaxation
Once the RF pulse is turned off, the protons gradually give the energy they obtained
from the RF pulse to the surrounding environment and return to the equilibrium state
(the magnetization vector along z-axis or longitudinal direction). This process is
spin-lattice (T1) relaxation, which is defined by the equation:
( ) = (1 − ( / )) Equation [1.2]
T1 relaxation time is the time constant in milliseconds required for 63%

3
longitudinal magnetization recovered. Because greater energy exchange is required at
higher frequencies, this relaxation effect will take longer at higher fields. Hence T1
values lengthen with increasing B0.
1.1.3 T2 Relaxation
Meanwhile, transverse magnetization decays due to proton getting out of phase as a
result of in-homogeneities in the magnetic field created by adjacent nuclei. This
course is spin-spin (T2) relaxation, which is defined by the equation:
( ) = (1 − ( / )) Equation [1.3]
T2 relaxation time is the time constant in milliseconds required for transverse
magnetization decays to 37% of original magnetization.
T1 and T2 relaxation are important MR parameters which have distinct values for
different tissues. Based on the differences of T1 and T2 for different tissues, MR
images with T1-weighted contrast and T2-weighted contrast can be generated by
manipulating MRI pulse sequences and imaging parameters.
1.2 T1rho Magnetic Resonance Imaging
1.2.1 T1rho Relaxation
T1rho (or ) relaxation is fully named as spin-lattice relaxation in the rotating
frame, where the subscript ‘rho’ or ‘ρ’ indicates the ‘rotating’ frame. T1rho relaxation
4
presents a relaxation procedure different from T1 and T2 relaxation. T1rho-weighted
contrast provides different or extra information of tissues beyond T1 and T2-weighted
contrast.
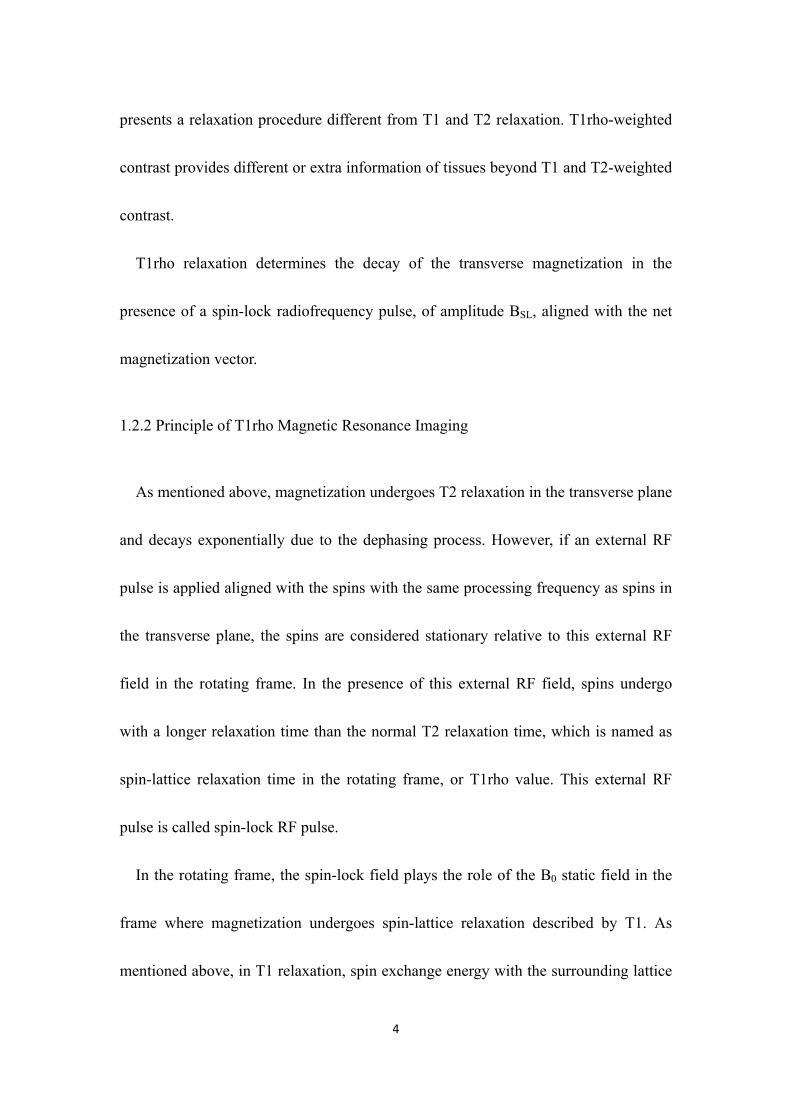
T1rho relaxation determines the decay of the transverse magnetization in the
presence of a spin-lock radiofrequency pulse, of amplitude BSL, aligned with the net
magnetization vector.
1.2.2 Principle of T1rho Magnetic Resonance Imaging
As mentioned above, magnetization undergoes T2 relaxation in the transverse plane
and decays exponentially due to the dephasing process. However, if an external RF
pulse is applied aligned with the spins with the same processing frequency as spins in
the transverse plane, the spins are considered stationary relative to this external RF
field in the rotating frame. In the presence of this external RF field, spins undergo
with a longer relaxation time than the normal T2 relaxation time, which is named as
spin-lattice relaxation time in the rotating frame, or T1rho value. This external RF
pulse is called spin-lock RF pulse.
In the rotating frame, the spin-lock field plays the role of the B0 static field in the
frame where magnetization undergoes spin-lattice relaxation described by T1. As
mentioned above, in T1 relaxation, spin exchange energy with the surrounding lattice

5
via processes that occur near the Larmor frequency. The spin-lock condition changes
the environment in which individual spins are able to interact with the lattice.
In the presence of spin-lock radiofrequency field, spins are able to efficiently
couple to the lattice at frequencies close to the nutation frequency of the spin-lock
pulse ( = (inrad), FSL= /2 (in Hz), where γ is the gyromagnetic ratio,
for , γ/2π = 42.58MHz/Tesla; is the amplitude of the spin-lock pulse,
is much smaller than ;) which is typically far below the Larmor frequency.
Therefore, the T1rho relaxation time is sensitive to low frequency physic-chemical
interactions between water and macromolecules with exchange correlation times and
rotational correlation times that are close to the reciprocal of the spin-lock frequency
(1/ ). Note that although FSL has a unit of Hz as frequency, it is proportional to
the spin-lock field strength and used to evaluate the field strength of a spin-lock pulse.
Here we could neglect the precession rate of spins with B0 in the rotating frame
because the spin-lock pulse is assumed on-resonance.
1.2.3 Radiofrequency Pulse for T1rho Magnetic Resonance Imaging
The magnetization evolution during a spin-lock pulse cluster is given in Figure 1.1.
The initial radiofrequency pulse (P1,90° ) is applied along x-axis (Figure 1.1a), and
flips magnetization vector into the transverse plane (Figure 1.1b) from its longitudinal

6
equilibrium position (Figure 1.1 a). A spin-lock pulse ( , ) is applied subsequently
along y-axis in the rotating frame with a duration of SLT (spin-lock time) (Figure
1.1c). After the end of the SLT period, the magnetization vector has been decayed
according to T1rho relaxation (Figure 1.1d), then a final radiofrequency pulse (P2,
90° ) is applied along the negative x axis (Figure 1.1d) to return the T1rho-relaxed
transverse magnetization to the longitudinal axis (Figure 1.1e). The resultant T1rho
prepared magnetization can be excited and spatially-encoded using a conventional
pulse sequence. The M (SLT) vector shortened due to T1rho decay which is described
by Equation:
M(SLT) = ∙ ( / ) Equation [1.4]
Where M(SLT) and M0 is the T1rho-prepared magnetization with the duration of
spin-lock and equilibrium magnetization; where SLT is the duration of the spin-lock
pulse.

7
Figure 1.1: The diagram of the magnetization evolution during a spin-lock pulse
cluster.
The diagram of a radiofrequency pulse sequence cluster for T1rho preparation is
shown in Figure 1.2. Pulse 1(P1) is a hard pulse used to excite the magnetization
vector (M) from the longitudinal equilibrium position into the transverse plane along
the y-axis. Spin-lock pulse ( ) is applied parallel to the M vector along the y-axis.
( = 2 ∙ ∙ , where FSL is the frequency of spin-lock pulse, SLT is the
duration of spin-lock time.) Pulse 2(P2) is a hard pulse used to return the
T1rho-relaxed transverse magnetization vector M(SLT) to the longitudinal axis.

8
Figure 1.2: The diagram of a radiofrequency pulse sequence cluster for T1rho
magnetization preparation. The flip angle of PSL is calculated by = 2 ∙ ∙ .
Because of the relatively long duration of spin-lock pulses, the T1rho method is
sensitive to B1 inhomogeneity. If the magnetization vector is poorly aligned with the
spin-lock pulse, there is ample opportunity for it to undergo pronounced off-axis
nutation, resulting in an unexpected orientation at the end of spin-lock (Charagundla
et al., 2003). The rotary echo spin-lock pulse (“self-compensating” spin-lock pulse) is
introduced to reduce the potential image artifacts arising from B1 inhomogeneity
(Charagundla et al., 2003; Solomon, 1959). This spin-lock pulse cluster is given in
Figure 1.3, it consists two halves with the equal duration but the opposed phase, and
the effectively refocuses the rotation spin-lock phase accumulation.

9
Figure 1.3: The diagram of rotary echo spin-lock pulse cluster for T1rho
magnetization preparation. The flip angle of PSL is calculated by = 2 ∙ ∙/2.
Like any other magnetization preparations such as saturation, inversion and
magnetization transfer, T1rho-weighted magnetization preparation itself cannot
generate T1rho-weighted MR images unless it is combined with the subsequent pulse
sequences to acquire the T1rho-relaxation-prepared MR signal. The T1rho-relaxed
magnetization can be acquired by almost any conventional pulse sequence. A block
diagram for a typical T1rho imaging experiment is given in Figure 1.4.
At first, a spin-lock pulse is applied for the preparation of T1rho-weighted
magnetization. After the T1rho-weighted magnetization is flipped back to the
longitudinal plane, the residual transverse magnetization is eliminated by a strong
gradient crusher. Then a normal acquisition pulse sequence, like spin echo (SE) type

10
or gradient echo (GRE) type sequences, either in 2D or 3D, is applied for image
acquisition. Finally, a sufficiently long (a couple of times of T1) wait time is often
applied after image acquisition to allow magnetization to fully restore in the
longitudinal direction for the next T1rho-weighted magnetization preparation.
In addition, other module blocks can be added into the T1rho imaging diagram
according to the requirements on specific clinical application. Such us, other
magnetization modules of fat suppression or fluid suppression can be applied before
or after the spin-lock pulse if necessary.
Figure 1.4: Block diagram for a typical T1rho imaging experiment. The purpose of
each module is described above the block.
1.2.4 T1rho-weighted Contrast Imaging and Application
T1rho MRI is normally utilized in three forms, including T1rho-weighted contrast
imaging, T1rho mapping, and T1rho dispersion imaging.
T1rho-weighted contrast imaging is the most basic form of T1rho MRI. It provides

11
different or additional tissue contrast information compared with T1 or T2-weighted
contrast imaging. With this kind of novel contrast, T1rho-weighted MR images have
been used to distinguish breast tumors (Santyr et al., 1989), brain tumors (Aronen et
al., 1999; Poptani et al., 2001), head and neck tumors (Markkola et al., 1996), and
liver lesions(Halavaara et al., 1998) from healthy tissue. Because muscle has faster
relaxation rates and greater magnetization transfer than blood, T1rho-weighted
contrast has been used to suppress the background myocardium to enhance
myocardium-blood contrast in cardiac imaging (Dixon et al., 1996; Muthupillai et al.,
2004; Witschey et al., 2012). Furthermore, T1rho-weighted contrast has also been
used for functional MRI (fMRI) to obtain better contrast than the normal
T2*-weighted blood oxygen level-dependent (BOLD) contrast (Hulvershorn et al.,
2005).
1.2.5 Quantitative T1rho Mapping and Application
A series of T1rho-weighted images acquired at varying duration of SLT (spin-lock
time) provide the data for T1rho mapping. The T1rho maps can be calculated on a
pixel-by-pixel basis, using a mono-exponential decay with Equation 1.4. T1rho
mapping provides versatile quantitative data for making comparisons for different
study groups or longitudinally monitoring the progression of T1rho values in same

12
group. T1rho mapping is the most common form of T1rho imaging and has been most
intensively used for various clinical applications.
The number of T1rho-weighted images at different SLT for fitting a single T1rho
map is at least two (Yuan et al., 2012). In addition, more T1rho-weighted images at
varying SLTs are always used for getting more accurate and precise T1rho maps.
However, T1rho MRI is relatively time-consuming due to the long delay time for
longitudinal magnetization restoration.
During the recent years, quantitative T1rho MRI has been extensively studied,
covering various organs and a wide range of disease processes, particularly in the
areas of knee cartilage and intervertebral discs. T1rho mapping was used to
quantitative evaluate the cartilage degeneration in the knee joints and intervertebral
discs degeneration. The studies indicated that T1rho values are significantly positive
correlated with the degree of cartilage degeneration (Nishioka et al., 2012; Regatte et
al., 2006; Tsushima et al., 2011), and significantly negative correlated with disc
degeneration (Blumenkrantz et al., 2010; Borthakur et al., 2011; Wang et al., 2013a;
Wang et al., 2013b). With biliary duct ligation induced rat liver fibrosis model, the
recent study showed that MR T1rho imaging is able to detect liver fibrosis, and the
degree of fibrosis is correlated with the degree of elevation of the T1rho measurement
(Wang et al., 2011a). Furthermore, the quantitative T1rho mapping has been used in

13
the patients with Alzheimer’s disease (Borthakur et al., 2008; Haris et al., 2009a;
Haris et al., 2011a; Haris et al., 2011b); the T1rho values of hippocampus and medial
temporal lobes in patients with Alzheimer’s disease are significantly lower than those
of healthy volunteers.
1.2.6 T1rho Dispersion and Application
T1rho dispersion is the dependence of T1rho relaxation time with spin-lock field
strength, or spin-lock frequency. If frequency of spin-lock (FSL) approaches zero, the
weak spin-lock field is unable to continue to lock individual spins from dephasing.
Hence, the T1rho approaches T2 at low FSL. On the other hand, if the FSL increases,
T1rho begins to approach T1, although in practical applications in biological tissue
this limit is never encountered due to the large spin-lock frequency needed to achieve.
T1rho dispersion imaging usually involves T1rho mapping for at least two
spin-lock frequencies. Because T1rho is sensitive to the low-frequency motional
processes around or at spin-lock frequency, T1rho dispersion imaging becomes a
powerful tool to study the low frequency spin-lattice interaction in biological tissues
and provides useful information like proton exchange between water and
macromolecules. T1rho dispersion has been shown to be sensitive to conditions which
affect proton exchange such as pH (Makela et al., 2001) and 17O concentration

14
(Charagundla et al., 1998; McCommis et al., 2010; Tailor et al., 2004; Tailor et al.,
2003).
1.3 Thesis Overview
T1rho MR imaging provides us a viable approach to study low-frequency motional
processes in biological tissues; it could provide useful information on composition of
macromolecules such as protein, proton exchange between water and macromolecules
and so on, that is not feasible by using T1 and T2 imaging.
This thesis is divided into six Chapters. The purpose of this introductory Chapter is
to provide background on the T1rho magnetic resonance imaging, briefly explain the
basic theoretical aspects of T1rho MRI and application of T1rho MRI.
In Chapter 2, we studied the whether and how normal brain aging and chronic
spontaneous hypertensive is associated with brain T1rho value changes. The T1rho
values in rat brain of Sprague-Dawley (SD) rats from 5-month to 15-month, and
spontaneous hypertensive rats (SHR) with Wistar Kyoto (WKY) rats from 6-month to
12-month, were longitudinally measured. The experimental results showed that the
T1rho value in three brain regions of thalamus, hippocampus, and cortices increased
with aging process, and the T1rho value was significantly higher in hypertensive rats
(SHR) than normotensive rats (WKY).
In Chapter 3, fifty-two human subjects were recruited for a clinical study to study

15
the whether and how T1rho value specifically offer better evaluation of disc
degeneration compared with T2 value. The T1rho and T2 values for nucleus pulposus
and annulus fibrosis of discs were evaluated using five-level and eight-level
semi-quantitative disc degeneration grading systems. The results showed that both
T1rho and T2 values decreased in a similar pattern following disc degeneration for
nucleus pulposus; T1rho value decreased progressively faster than T2 value for
annulus fibrosis; both T2 and T1rho values of nucleus pulposus and annulus fibrosis
did not reduce further by disc-space narrowing. Therefore, T1rho value is better suited
for evaluating AF in degenerated disc than T2 value. The eight-level grading system
will still be useful for clinical evaluation, particularly for those with severe disc
degeneration and disc space narrowing.
Recently it was shown that T1rho value increased with the severity of liver fibrosis
in rats with bile duct ligation. In Chapter 4, a rat carbon tetrachloride (CCl4) liver
injury model was used for further investigating the merit of T1rho MRI for liver
fibrosis evaluation. Male Sprague-Dawley rats received intraperitoneal injection of 2
ml/kg CCl4 twice weekly for up to 6 weeks. Then CCl4 was withdrawn and the
animals were allowed to recover. Liver T1rho MRI and conventional T2-weighted
images were acquired. Animals underwent MRI at baseline and at 2 days, 2 weeks, 4
weeks and 6 weeks post CCl4 injection, and they were also examined at 1 week and 4

16
weeks post CCl4 withdrawal. Liver histology was also sampled at these time points.
The results showed rat liver T1rho values increased slightly, though significantly, on
day 2, and then increased further and were highest at week 6 post CCl4 insults. The
relative liver signal intensity change on T2-weighted images followed a different time
course compared with that of T1rho. Liver T1rho values decreased upon the
withdrawal of the CCl4 insult. Histology confirmed the animals had typical CCl4
liver injury and fibrosis progression and regression processes. Therefore, T1rho MRI
can monitor CCl4-induced liver injury and fibrosis; liver T1rho was only mildly
affected by edema and acute inflammation; liver MR T1rho decreased when liver
fibrosis and injury regressed.
In Chapter 5, in order to translate liver T1rho MRI to a clinically applicable
imaging biomarker, 20 healthy human subjects were recruited in this clinical study to
explore the feasibility of T1rho MRI for human liver, and get the normal liver T1rho
values range for healthy subjects at 3 T. It was found that it is feasible to obtain
consistent liver T1rho measurement for healthy human liver with six spin-lock time
(SLT) points of 1, 10, 20, 30, 40, and 50ms. When a 3T scanner and a spin-lock
frequency was 500 Hz and six SLT points was used, the mean liver T1rho value of the
healthy subjects was 42.5 ms, with a range of 38.8-46.5ms. The feasibility of using
three (1, 20, and 50ms) or two (1, and 50ms) SLT points to measure liver T1rho value

17
was further explored. With the 38 examinations, the ICC for 6-SLT vs. 3-SLT T1rho
measurements was 0.949, while the ICC for 6-SLT vs. 2-SLT T1rho measurement was
0.625. The scan-rescan reproducibility ICC was 0.811, 0.804 and 0.69 for 6-SLT,
3-SLT and 2-SLT measurement, respectively. Therefore, adopting 3-SLTs of 1, 20, and
50ms can be an acceptable alternative for the liver T1rho measurement, while 2-SLT
of 1 and 50ms do not provide reliable measurement.
In Chapter 6, extensions of the T1rho MRI for future studies would be discussed.

18

19
CHAPTER 2 T1RHO MRI IN BRAIN AGING OF ANIMAL
MODEL
2.1 Introduction
For neuroimaging, though limited, promising studies on brain T1rho MR imaging
have been reported, including T1rho dispersion in the health human brain (Borthakur
et al., 2004), T1rho MRI in the patients with Alzheimer’s disease (Borthakur et al.,
2008; Haris et al., 2009a; Haris et al., 2011a; Haris et al., 2011b), the patients with
Parkinson’s disease with and without dementia (Haris et al., 2011a; Nestrasil et al.,
2010a), as well as, the animal model of Alzheimer’s disease (Borthakur et al., 2004)
and cerebral ischemia (Jokivarsi et al., 2010). These studies suggest
neuro-degenerative lesions are potentially associated with the change of the T1rho
relaxation time.
Aging and hypertension are the common risk factors for neurodegenerative disease.
However, whether normal aging process and chronic hypertension are associated with
brain T1rho relaxation change remains unknown. With aging process, decrease of
cerebral blood flow (Heiland et al., 2002; Lee et al., 2011), dysfunction of blood brain
barrier (Knox et al., 1980; Tomassoni et al., 2010), occurrence of brain atrophy
(Amenta et al., 2010), and loss of nerve cells (Napoleone et al., 1990; Tomassoni et
20
al., 2010) commonly exhibited in the brain of aged rats. Spontaneously hypertension
rats (SHR) are normotensive at birth and gradually develop severe hypertension in the
first 2-4 months of life. At 6 months they develop a sustained hypertension compared
to their normotensive control strain, the Wistar Kyoto (WKY) rats. The hypertensive
rats exhibit these similar changes with aging rats (Amenta et al., 2010; Knox et al.,
1980; Lee et al., 2011; Napoleone et al., 1990; Tomassoni et al., 2010), but they can
be more advanced than the age-matched normative rats.
Therefore, the purpose of study described in this Chapter is to observe the T1rho
values in rat brain associated with normal aging process and chronic hypertension. We
longitudinally investigated the T1rho values changes in the Sprague–Dawley (SD)
rats, Wistar–Kyoto (WKY) rats and Spontaneously Hypertensive rats (SHR).
2.2 Materials and Methods
2.2.1 Animal Model of Brain Aging
With the animal ethics approval, 18 male Sprague-Dawley (SD) rats, 11 male
Wistar-Kyoto (WKY) rats, and 11 male Spontaneously Hypertensive rats (SHR) were
included in our study. The SD rats were scanned longitudinally at the age of 5-month,
8-month, 10-month and 15-month. The SHR and the age matched-WKY rats were

21
scanned longitudinally at the age of 6-month, 9-month, and 12-month. The animals
were housed in cages (3 or 4 rats per cage) on a 12-h light/12-h dark cycle in an
air-conditioned room at 25°C. Food and water were available ad libitum.
2.2.2 T1rho Data Acquisition
MRI was performed on a 3 T clinical scanner (Achieva, Philips Healthcare, Best,
The Netherlands). The Ketamine/Xylazine combination anesthetic was used for MR
scanning; the dose of Ketamine/Xylazine for rat in this study was 100 mg/kg and 10
mg/kg body weight. After anesthesia, animals were positioned prone and a custom
made quadrature volume RF coil of 7cm internal diameter was used as signal
transmitter and receiver. 14-16 axial slices were used to cover the whole rat brain. The
diagram of sequence for T1rho MRI is given in Figure 2.1 and Figure 2.2. For T1rho
measurement, a rotary echo spin-lock pulse was implemented in a 3D fast field echo
(FFE) sequence. Spin-lock frequency was set as 500 Hz, TE and TR were 3.6ms and
7.4ms respectively. The voxel size was 0.3×0.35×1.50 mm3. The flip angle was 40
degree. The TI (delay time) after T1rho acquisition was set as 5500ms to restore
equilibrium magnetization prior to the next T1rho preparation.
T1rho MR scanning schedule for SD rats, WKY rats and SHR is given in Figure
2.3. The images of SD rats were acquired at three spin-lock time points (SLT) of 1ms,

22
20ms, and 50ms (Figure 2.3). The MR images of SHR and WKY rats were acquired at
four spin-lock times (SLT) of 1ms, 20ms, 50ms and 80ms (Figure 2.3). The number of
signal average (NSA) was 3 for SD rats and 4 for SHR and WKY rats. For the SD rat,
an inversion TFE prepulse (inversion time: 1700ms) was used to remove the
contribution from cerebrospinal fluid (CSF) to T1rho maps; and was not used in SHR
and WKY rats (Figure 2.2).
Figure 2.1: Diagram of the sequence, which is the spin-lock fast field echo (FFE)
imaging sequence for T1rho MRI, the rotary echo spin-lock pulse cluster is used for
T1rho preparation. SLT= spin-lock time.
Figure 2.2: Diagram of the sequence, which is the spin-lock fast field echo (FFE)
imaging sequence for T1rho MRI, the rotary echo spin-lock pulse cluster is used for
T1rho preparation. The inversion TFE prepulse (inversion time=1700ms) is inserted
before the T1rho preparation pulse for fluid attenuation. SLT= spin-lock time.

23
Figure 2.3: T1rho MR scanning schedule for SD rats, WKY rats and SHR. For the SD
rats, fluid attenuation was used in order to remove the contribution from CSF to
T1rho maps. SLT= spin-lock time.
2.2.3 T1rho Data Processing
T1rho maps were computed on a pixel-by-pixel basis by using a mono-exponential
decay model with a homemade Matlab program (Mathworks, Natick, MA):
M(SLT) = ∙ ( / ) Equation [1.4]
Where M0 and M(SLT) denote the equilibrium magnetization and T1rho-prepared
magnetization with the spin-lock time of SLT, respectively. This mono-exponential
equation was linearized by logarithm and T1rho maps were generated by fitting all
pixel intensity data as a function of SLT using linear regression. T1rho was calculated
as -1/slope of the straight-line fit. The T1rho-weighted images acquired at different
spin-lock time points and T1rho map for a typical SD rat is shown in Figure 2.4. The

24
T1rho-weighted images acquired at different spin-lock time points and T1rho map for
a typical hypertensive rat (SHR) is shown in Figure 2.5.
2.2.4 T1rho Measurement and Statistical Analysis
These measurements were performed in the thalamus, hippocampus, and cortices
region of the brain that is primarily associated with neuro-degenerative disease
(Hughes et al., 2012; Yankner et al., 2008). T1rho values were measured in
user-defined regions of interest (ROIs) in the bilateral thalamus (T), hippocampus (H),
and frontal cortices (C) from T1rho map of rat brains (Fig 4, Fig 5), according the
standard rat brain atls (right lower) by Paxinos, G. and Watson, C. (2005). Note that
the MRI image does not exactly match with the atlas image because they have
different slice thickness (1.5 mm for the MRI image and 0.12 mm for the atlas image).
We performed statistical tests showing that there were no significant differences in
T1rho values when comparing the two hemispheres. Therefore, we pooled the data of
the corresponding regions of both hemispheres. Data are presented as mean ±
standard deviation. All statistical analyses were done using SPSS 14.0 (SPSS,
Chicago, IL). The Mann-Whitney U test was used for non-paired comparison. The
one way analysis of variance (ANOVA) test was performed with linear trend study of
variable “T1rho values” with age process.

25
Figure 2.4: T1rho-weighted images of a SD rat with spin-lock time points of 1ms,
20ms, and 50ms. The bilateral thalamus (T), hippocampus (H), and cortices (C) were
manually defined in the T1rho map according the standard rat brain atls by Paxinos,
G. and Watson, C. (2005) (see Figure 2.5). SLT= spin-lock time.

26
Figure 2.5: T1rho-weighted images of a SHR with spin-lock time points of 1ms, 20ms,
50ms, and 80ms (upper and middle row). The bilateral thalamus (T), hippocampus
(H), and cortices (C) were manually defined in the T1rho map (left lower) according
the standard rat brain atls (right lower) by Paxinos, G. and Watson, C. (2005). Note
that the MRI image does not exactly match with the atlas image because they have
different slice thickness (1.5 mm for the MRI image and 0.12 mm for the atlas image).
SLT= spin-lock time.

27
2.3 Results
Two SD rats died at age of 14-month, so there were only 16 SD rats’ image data at
age of 14-month. The images of a WKY rat at age of 6-month, 2 WKY rats at age of
9-month, a SHR at age of 9-month and 2 SHR at age of 12-month were not included
in this study due to imaging artifact. The T1rho measurement data (mean±SD) for SD
rats, WKY rats, and SHR were summarized in the Table 2.1 and Table 2.2.
For the SD rats (Figure 2.6, Figure 2.7, Figure 2.8,), at age of month 8, T1rho
values in the thalamus, hippocampus and cortices increased on average by 5.1%
(p<0.05), 9.7% (p<0.05) and 5.2% (p<0.05) compared with the values at month 5. At
month 10, T1rho values in the thalamus, hippocampus and cortices increased on
average by 5.8% (p<0.05), 5.7% (p<0.05) and 6.4% (p<0.05) respectively compared
with the value at month 8. At month 15, T1rho values in the thalamus, hippocampus
and cortices increased on average by 7.5% (p<0.05), 5.7% (p<0.05) and 6.6% (p<0.05)
compared with the value at month 10, as well as increased by 19.5%, 22.4% and 19.4%
compared with the value at month 5. In addition, the one-way analysis of variance
(ANOVA) test for linear trend showed that T1rho values in thalamus, hippocampus
and cortices had a significant linear trend for increasing during the aging process from
5-month to 15-month (p<0.05, Table 2.1, Figure 2.9).
For the WKY rats and SHR, the T1rho values in thalamus, hippocampus and

28
cortices also had a significant linear trend for increasing during the aging process
from 6-month to 12-month (p<0.05, Table 2.2, Figure 2.10, Figure 2.11). At the age of
12-month, T1rho values in thalamus, hippocampus and cortices of WKY rats
increased on average by 20.0% (p<0.05), 9.5% (p<0.05), and 8.5% (p<0.05)
compared with the values at month 6. Similarly, at the age of 12-month, T1rho values
in thalamus, hippocampus and cortices of SHR increased on average by 14.7%
(p<0.05), 8.7% (p<0.05), and 7.5% (p<0.05) compared with the values at month 6.
Furthermore, T1rho values in thalamus, hippocampus and cortices of SHR were
consistently higher than those of WKY control rats at the age of 6-month, 9-month
and 12-month. At the age of 6-month, T1rho values in thalamus, hippocampus and
cortices of SHR were 12.6% (p<0.05), 7.7% (p<0.05), and 8.9% (p<0.05) higher than
WKY rats (Table 2.2, Figure 2.12, Figure 2.13, Figure 2.14). At the age of 9-month,
T1rho values in thalamus, hippocampus and cortices of SHR were 4.7% (p<0.05), 4.7%
(p<0.05), and 5.2% (p<0.05) higher than WKY rats (Table 2.2, Figure 2.12, Figure
2.13, Figure 2.14). At the age of 12-month, T1rho values in thalamus, hippocampus
and cortices of SHR were 7.0% (p<0.05), 7.0% (p<0.05), and 7.9% (p<0.05) higher
than WKY rats (Table 2.2, Figure 2.12, Figure 2.13, Figure 2.14). Meanwhile, the
percentage regional T1rho values difference between SHR and WKY rats did not
increase with aging process (Table 2.2).

29
Table 2.1: T1rho values (mean±SD) in the thalamus, hippocampus, and cortices of SD
rats at age of 5, 8, 10 and 15 months.
5 months 8 months 10 months 15 months
thalamus (ms) 67.2±2.4 70.6±3.1 a 74.7±4.0 b 80.3±3.9 c,d
hippocampus(ms) 73.2±2.3 80.3±3.0 a 84.9±3.7 b 89.7±3.7 c,d
cortices (ms) 71.6±1.9 75.3±3.1 a 80.1±3.6 b 85.4±4.1 c,d
Note: a: p<0.05 vs. 5-month old SD rats; b: p<0.05 vs. 8-month old SD rats; c: p<0.05
vs. 10-month old SD rats; d: p<0.05 for linear trend effect during the aging process
from 5-month to 15-month.
Table 2.2: T1rho values (mean±SD) in the thalamus, hippocampus, and cortices of
WKY rats and SHR at age of 6, 9, and 12 months.
6 months 9 months 12 months
WKY SHR Diff% WKY SHR Diff% WKY SHR Diff%
T (ms) 60.1±1.5 67.6±1.7a 12.6% 65.1±1.7 68.2±1.1
a 4.7% 72.0±4.3b
77.1±3.8a,b
7.0%
H (ms) 68.6±2.4 73.9±2.1a 7.7% 73.6±3.0 77.1±2.7
a 4.7% 75.1±2.6b
80.3±2.1a,b
7.0%
C(ms) 75.6±2.9 82.3±2.8a 8.9% 79.9±3.6 84.1±2.5
a 5.2% 82.0±2.0b
88.5±4.4a,b
7.9%
Note: T: thalamus; H: hippocampus; C: cortices; Diff%= (measurement of SHR -
measurement of WKY) / measurement of WKY. a: p<0.05 vs. age-matched WKY rats. b:
p<0.05 for linear trend effect during the aging process from 6-month to 12-month.

30
Figure 2.6: T1rho values in the thalamus of SD rats at the age of 5, 8, 10, and 15
months. ***: p<0.001, **: p<0.01.

31
Figure 2.7: T1rho values in the hippocampus of SD rats at the age of 5, 8, 10, and 15
months. ***:p<0.001.

32
Figure 2.8: T1rho values in the cortices of SD rats at the age of 5, 8, 10, and 15
months. ***:p<0.001.

33
Figure 2.9: The mean plots of T1rho values for SD rats at the different age.
∆%=(measurement data at 15-momth - measurement data at 5-month)/ measurement
data at 5-month.

34
Figure 2.10: The mean plots of T1rho values for WKY rats at the different age.
∆%=(measurement data at 12-momth - measurement data at 6-month)/ measurement
data at 6-month.

35
Figure 2.11: The mean plots of T1rho values for SHR at the different age.
∆%=(measurement data at 12-momth - measurement data at 6-month)/ measurement
data at 6-month.

36
Figure 2.12: T1rho values in the thalamus, hippocampus, and cortices of WKY and
SHR at the age of 6-month. ***: p<0.001.

37
Figure 2.13: T1rho values in the thalamus, hippocampus, and cortices of WKY and
SHR at the age of 9-month. **: p<0.01,*: p<0.05.

38
Figure 2.14: T1rho values in the thalamus, hippocampus, and cortices of WKY and
SHR at the age of 12-month. ***: p<0.001, *: p<0.05.
2.4 Discussion
Discovering the association between age/hypertension-related changes and T1rho
relaxation may help us better realize the T1rho relaxation for neurodegenerative
disease. In the current study, we found significantly increased T1rho relaxation in the
rat brain during the normal age processing period; this phenomenon was current in
rats without hypertension (SD, WKY rats) and rats with hypertension (SHR).
Furthermore, we found significantly higher T1rho relaxation in the hypertensive rat
(SHR) brain than the normotensive rat (WKY) brain in all three time points of

39
6-month, 9-month, and 12-month.
The feasibility of T1rho relaxation in measuring plaques burden in the mice model
of Alzheimer’s disease (AD) has been reported by Borthakur and colleagues
(Borthakur et al., 2006). Then they have shown increased T1rho relaxation in medial
temporal lobe (MTL) of Alzheimer’s disease (AD) patients compared to controls
(Borthakur et al., 2008). Furthermore, Haris and colleagues showed the significantly
increased T1rho relaxation in the hippocampus of mild cognitive impairment (MCI)
and Alzheimer’s disease (AD) patients compared to controls (Haris et al., 2009a); the
significantly increased T1rho relaxation in the hippocampus of Alzheimer’s disease
(AD) and Parkinson’s disease with dementia (PDD) patients compared to controls and
Parkinson’s disease (PD) (Haris et al., 2011a); the significantly increased T1rho
relaxation in the medial temporal lobe (MTL) of Alzheimer’s disease (AD) patients
compared to controls (Haris et al., 2011b). All these studies suggested that the
presence of Alzheimer’s disease (AD) pathology may contribute to the increased
T1rho relaxation.
Amyloid plaques also can appear in the cortex and hippocampus, neurofibrillary
tangles can predominately locate in the entorhinal cortex of normal aging individuals,
and generally more widespread in Alzheimer’s disease (AD) patients (Haris et al.,
2011b). Therefore, the gradually deposit of amyloid plaques and neurofibrillary

40
tangles in brain with normal aging process might contribute to the increase of T1rho
values in rat brain.
Brain atrophy, which is assumed to reflect underlying neuronal loss of brain, has
been reported might be associated with increased T1rho values in hippocampus and
medial temporal lobe (MTL) of Alzheimer’s disease (AD). Occurrence of brain
atrophy and loss of nerve cells in whole brain are commonly exhibited in aged rats;
therefore the brain atrophy and loss of nerve cells might also contribute to the increase
of T1rho values of brain with normal age process.
Hypertension is a prevalent comorbid medical condition of aging, and may also
predispose to neurodegenerative disorders (Yankner et al., 2008). Spontaneously
hypertensive rats (SHR), which are normotensive at birth and develop sustained
hypertension between 3 and 6 months of age, can represent a reasonable model of
hypertensive-related brain damage (Amenta et al., 2010).
In our current study, spontaneously hypertensive rats (SHR) and WKY rats were
underwent T1rho MR imaging comparatively; the T1rho values in SHR brain were
significantly higher than these of WKY rats in all three different time points. The
hypertensive rats exhibit similar brain changes with aging rats, such as the occurrence
of brain atrophy and loss of nerve cells (Amenta et al., 2010; Bendel and Eilam, 1992;
Knox et al., 1980; Tomassoni et al., 2010), but they can be more advanced than the

41
age-matched normative rats. Therefore, the higher degree of brain atrophy and loss of
nerve cells might contribute to the higher T1rho values in SHR brain than these of
WKY rats.
However, aging and hypertension have not been well understood at a molecular
level. The age-related and hypertension-related changes are complicated in brain.
There should be some other age-related changes and hypertension-related changes in
brain might co-contribute to the increase of T1rho values in brain with aging process
and hypertension.
In our study, the T1rho measurement in thalamus was the lowest in brain of SD,
SHR and WKY rats. For SD rats group, the T1rho value of hippocampus was higher
than that of cortex. For SHR and WKY rats group, the T1rho value of hippocampus
was lower than that of cortex. It might because of different scanning parameters were
used for them. For SD rats group, they were underwent T1rho MR imaging with an
inversion TFE prepulse inserted before T1rho pulse in order to remove the
contribution from CSF to the T1rho maps. For SHR and WKY rats, no inversion TFE
prepulse was inserted before T1rho pulse. In addition, three spin-lock times (SLT=1,
20, 50ms) and NSA=3 were used for SD rats; four spin-lock times (SLT=1, 20, 50,
80ms) and NSA=4 were used for SHR and WKY rats. Therefore, the SNR of SD rats
T1rho images was slightly lower than that of SHR and WKY rats.

42
The findings from the current study are preliminary, given the limited sample sizes.
Statistical power could be further increased with access to larger sample sizes in
future studies. This study did not investigate the exact mechanism of T1rho increase
in the normal aging and chronic hypertensive rat model. Histological correlation study
may be help to further understand the mechanism underlying the rat brain T1rho
increase.
2.5 Summary
In summary, T1rho values increased in rat brain might be associated with the
age-related and hypertension-related changes of brain tissue composition. T1rho MR
imaging might be a potential technique to monitor brain changes due to age process
and chronic hypertension. The age-related changes in T1rho values shown in our
study should also be taken into account in other kinds of longitudinal studies in rats
using T1rho MRI, particularly with the aim of also distinguishing neurodegenerative
changes in T1rho relaxation from normal aging processes.

43
CHAPTER 3 T1RHO MRI IN LUMBAR DISC
DEGENERATION OF HUMAN SUBJECTS
3.1 Introduction
Intervertebral disc degeneration is a process that begins early in life and is the
consequence of a variety of genetic, mechanical, traumatic and nutritional factors, as
well as normal ageing (Adams and Roughley, 2006). Early signs of disc degeneration
are manifested by biochemical changes, including a loss of proteoglycans, a loss of
osmotic pressure and hydration (Adams and Roughley, 2006). In the later stages of
disc degeneration, morphological changes occur, including a loss of disc height, disc
herniation, annular tears and radial bulging (Modic and Ross, 2007).
Magnetic resonance imaging is commonly used for assessment of symptomatic disc
degeneration. On T2-weighted MR images, disc degeneration is seen as a reduction in
signal of the nucleus pulposus (NP) and inner fibres of the annulus. With more severe
disc degeneration, disc height decreases. Pfirrmann et al. (Pfirrmann et al., 2001)
devised a five-level grading system for disc degeneration based on MR signal
intensity, disc structure, distinction between nucleus and annulus, and disc height.
Recently, it has been suggested that Pfirrmann’s five-level grading system does not
show discriminatory power to assess severe disc degeneration, and an eight level

44
grading system has been proposed and successfully applied in a number of clinical
studies (Griffith et al., 2007; Wang et al., 2011b; Wang et al., 2011c).
Noninvasive quantitative assessments for early degenerative changes are needed
and will become more important because of emerging alternative treatments for
earlier stages of disc degeneration (e.g. cell therapy, growth factor therapy) (Carl et al.,
2004; Phillips et al., 2003; Vadala et al., 2007).
Five-level and eight-level grading systems provide semi-quantitative evaluation of
disc degeneration, particularly for later stages of degeneration (Griffith et al., 2007;
Pfirrmann et al., 2001). T2 and T1rho value reflect the intrinsic material properties of
disc tissues, therefore the T2 and T1rho measurement are being widely explored
(Auerbach et al., 2006; Blumenkrantz et al., 2006; Blumenkrantz et al., 2010; Chiu et
al., 2001; Johannessen et al., 2006; Kerttula et al., 2001; Perry et al., 2006;
Weidenbaum et al., 1992). These measurements are theoretically device-and
reader-independent, and may have the potential to detect subtle differences in tissue
composition that may not be apparent with T2-weighted image-based qualitative or
semi-quantitative assessment; therefore they would likely be more useful for early
disc changes.
T2 measurement has been reported to be sensitive to changes in collagen and water
content in the intervertebral discs, and T2 value decreases with disc degeneration

45
(Chiu et al., 2001; Kerttula et al., 2001; Perry et al., 2006; Weidenbaum et al., 1992).
T1rho measurement, which probes the interaction between water molecules and
their macromolecular environment, is suggested to have the potential to identify early
biochemical changes in the intervertebral disc. In cadaveric human discs it was shown
that in the nucleus pulposus (NP) T1rho value strongly correlates with proteoglycan
content (Johannessen et al., 2006). In vivo studies have demonstrated differences in
mean T1rho values between the nucleus and the annulus, and have shown a
correlation between T1rho values and degenerative grades at 1.5T (Auerbach et al.,
2006; Blumenkrantz et al., 2006). More recently, in an in-vivo study using 3.0T,
Blumenkrantz et al. (Blumenkrantz et al., 2010) reported that the values of T1rho and
T2 were significantly correlated. However, whether and how T1rho specifically offer
better evaluation of disc degeneration compared with T2 remains unknown.
The purpose of study described in this Chapter is to determine the relative
performance of T1rho value and T2 value in their assessment of disc degeneration
with reference to the five-level and eight-level semi-quantitative disc degeneration
grading systems.
3.2 Methods
3.2.1 Subjects
46
Fifty-two subjects were recruited: 12 subjects without low-back pain (nine men and
three women; mean age 32.1 years, age range 23–42 years), and 40 subjects who had
low-back pain (17 men and 23 women; mean age 54.1 years, age range 28–76 years).
All subjects were confirmed to have no other spine diseases except disc degeneration.
The study was approved by the local human research ethics committee. Written
informed consent was obtained from all subjects.
3.2.2 MR Image Acquisition
To remove the potential confounding role of diurnal disc hydration changes, all
subjects underwent imaging in the morning. MRI acquisition was performed on a
3.0T clinical system (Achieva, Philips Healthcare, Best, The Netherlands). A
12-channel receive-only spine coil was used as the signal receiver to cover the lumbar
spine, and the built-in body coil was used as the signal transmitter.
3.2.2.1 T2-weighted MRI
The sagittal T2-weighted turbo spin echo (TSE) was included with the following
parameters: FOV=200mm, voxel size =1.0×1.0×4.0mm3, slice thickness=4 mm,
TR=3302ms, TE=120ms. The number of signal averages (NSA) was one. A
sensitivity-encoding (SENSE) factor of 2 was applied for parallel imaging to reduce
the phase encoding steps. The scan time of conventional T2 weighted image was 4

47
minutes and 11 seconds.
3.2.2.2 T2 Mapping Imaging
A multi-echo turbo spin echo (TSE) pulse sequence was used for T2 mapping.
Seven sagittal TSE images were acquired at identical locations as T1rho images. TSE
imaging parameters included: FOV=200 mm, voxel size=1.0×1.0×4.0mm3, slice
thickness=4 mm, echo train length (ETL) =7, TEs=16, 32, 48, 64, 80, 96 and 112ms,
TR=2300ms. The number of signal averages (NSA) was one. A sensitivity-encoding
(SENSE) factor of 2 was applied for parallel imaging to reduce the phase encoding
steps. The scan time of conventional T2 mapping imaging was 4 minutes and 34
seconds.
3.2.2.3 T1rho MRI
The diagram of sequence for T1rho MRI is given in Figure 3.1. The T1rho
preparation pulse cluster was implemented in a 3D balanced fast field echo (b-FFE)
sequence with centric phase-encoding acquisition for T1rho measurement. Spin-lock
frequency was set as 500 Hz and the spin-lock times (SLTs) of 1ms, 10ms, 20ms,
40ms and 60ms were used for acquisition and T1rho mapping. Volume shimming was
employed to minimize B0 heterogeneity.

48
Figure 3.1: Diagram of the sequence for T1rho MRI, which is the spin-lock balanced
fast field echo (b-FFE) imaging sequence for T1rho MRI, the rotary echo spin-lock
pulse cluster is used for T1rho preparation. SLT= spin-lock time.
Segmented phase alternating b-FFE readout with centric phase encoding order was
used for acquisition. T1rho-weighted images were acquired during the transient status
towards the steady state but with T1rho weighted magnetization maintained (Li et al.,
2008). A rotary echo spin-lock pulse was applied once for every segment length of 80
readouts. A delay time of 6,000ms was inserted after each segment acquisition to fully
restore the equilibrium magnetization before the next T1rho preparation. TE and TR
for b-FFE acquisition were 2.3ms and 4.6ms respectively. The field of view (FOV)
was 200 mm and the voxel size was 1.0×1.0×4.0 mm3. Seven sagittal slices were
acquired and the slice thickness was 4 mm. The flip angle was 40° and the number of
signal averages (NSA) was one. A sensitivity-encoding (SENSE) factor of 2 was
applied for parallel imaging to reduce the phase encoding steps. The whole body
specific absorption rate (SAR) was < 0.4W/kg for this sequence as demonstrated on
the scanner’s console. The scan time was 80 seconds per spin-lock time point.

49
3.2.3 Data Processing
Image analysis T2 and T1rho maps were computed on a pixel-by-pixel basis using
a mono-exponential decay model with a homemade Matlab program (Mathworks,
Natick, MA, USA):
M(TE) = M ∙ exp( / ) Equation [3.1]
M(SLT) = M ∙ exp( / ) Equation [1.4]
Where M0 and M(TE) denote the equilibrium magnetization and magnetization
acquired with the echo time TE, respectively. M(SLT) denotes the T1rho-prepared
magnetization with the spin-lock time of SLT.
These two mono-exponential equations were linearized by logarithm. T1rho and T2
maps were generated by fitting each pixel’s intensity as a function of SLT and TE
using a non-negative least-square fitting algorithm, respectively. T1rho and T2 values
were calculated as the inverse of the slope of the corresponding straight-line fit.
3.2.4 Data Measurement and Statistical Analysis
Five intervertebral discs (L1/L2–L5/S1) per subject were examined, with four discs
excluded because of previous vertebral fusion operation, leading to 256 discs in total
for analysis. As the purpose of this current study was to study the correlation of
T1rho/T2 values with disc degeneration of a wide spectrum of grading, subjects with

50
or without low-back pain were analyzed together.
Images were analyzed in the mid-sagittal section of the lumbar spine. With
T2-weighted images as reference, regions of interest (ROIs) were manually drawn
over the T2 map and T1rho map of the discs by a Radiology trainee (ZF) with 3 years’
experience reading MRI images. ROIs included nucleus pulposus (NP), anterior
annulus fibrosus (AF) and posterior AF (Figure 3.2). Values of anterior AF and
posterior AF were averaged as the value for AF. When an apparent tear was noted in
the annulus, the abnormal signal areas were excluded in the ROIs. The ROI size for
NP ranged 15−45mm2, while the ROI size for AF (anterior + posterior) ranged from
8mm2 to 45mm2.
Figure 3.2: An example of placement of regions-of-interest (ROIs) over nucleus
pulposus (#), anterior annulus fibrosus (*), and posterior annulus fibrosus (^) in one
disc of T2-weighted image (left), T1rho map (middle), and T2 map (right).
The Pfirrmann five-level grading system is widely used for disc degeneration
evaluation (Li et al., 2008, Pfirrmann et al., 2001). To increase the discriminatory
power, a modification of the Pfirrmann system by increasing the number of grades

51
from 5 to 8 has been devised (Griffith et al., 2007). Broadly speaking, Pfirrmann
Grade C (3/5) was expanded to two grades (Grades 3/8 and 4/8), while Pfirrmann
Grade D (4/5) was expanded to three grades (Grades 5/8, 6/8 and 7/8). The degree of
disc height narrowing was incorporated into this grading system, with grades≥6
involving disc height narrowing (Phillips et al., 2003). Five-level and eight-level disc
degeneration evaluations were carried out by a radiologist experienced in reading
these two disc degeneration grading systems.
All statistical analyses were done using SPSS v. 14.0 (SPSS, Chicago, IL). The
difference in T1rho and T2 values of various disc degeneration grades was tested
using the Mann–Whitney test or one-way ANOVA. When relaxation time was plotted
against degeneration grading, NP showed a quadratic trend so a quadratic regression
was fitted, and R2 and quadratic coefficients are reported. R2, the coefficient of
determination, is the percentage of variance which can be explained by independent
variables. AF had a linear trend so a linear regression was fitted, and R2 and slope are
reported. Quadratic coefficient and slope were tested in T1rho and T2 values by
including an interaction term in the model. All statistical tests were two-sided. A P
value of <0.05 was considered statistically significant.

52
3.3 Results
3.3.1 Range of T1rho/T2 Values for Discs
In this study, T1rho value for nucleus pulposus (NP) and annulus fibrosus (AF)
ranged from 41.8 to 147.9ms and from 36.5 to 74.3ms, respectively. T2 value ranged
from 24.8 to 148.1ms for NP, and from 23.7 to 64.4ms for AF.
3.3.2 The Relationship between NP T1rho/T2 Values and 8-level Degeneration
Grading of Discs
The relationship between NP T1rho/T2 values and 8-level degeneration grading of
the 256 discs is given in Figure 3.3. As the degeneration grading increased from grade
1/8 to grade 5/8, both T1rho and T2 values decreased, while there was no apparent
difference between grades 5/8 to 8/8. The trend line for NP T1rho/T2 values against
8-level degeneration grading fitted by quadratic regression is shown in Figure 3.4.
The quadratic coefficient (±SE) was 3.19±0.40 (P<0.0001, R2=0.62) for T1rho value
of NP, and 3.68±0.41 (P<0.0001, R2=0.69) for T2 value of NP. There was no
significant trend difference for the decrease in T1rho and T2 values over the increase
in degeneration grade (P=0.40).

53
Figure 3.3: A: The relationship between T1rho value of nucleus pulposus (NP) and
8-level degeneration grading. B: The relationship between T2 value of nucleus
pulposus (NP) and 8-level degeneration grading. *:p<0.05; **:p<0.01; ***:p<0.001;
n.s.: not significant.
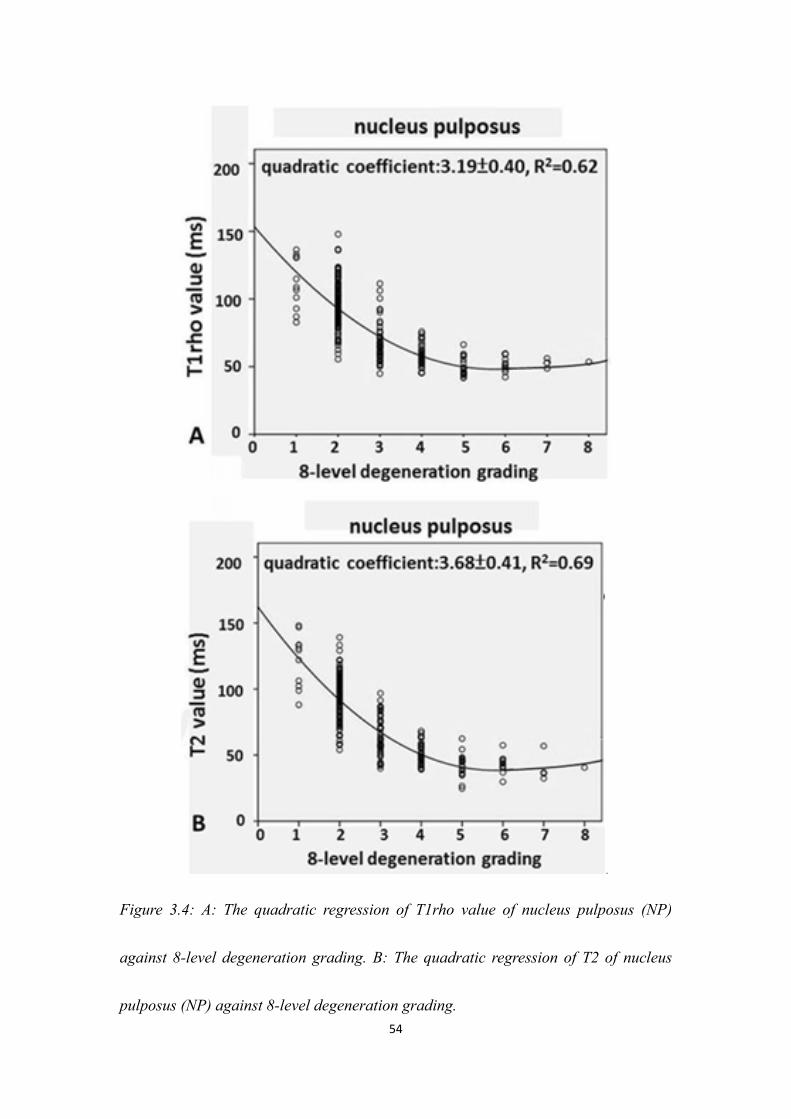
54
Figure 3.4: A: The quadratic regression of T1rho value of nucleus pulposus (NP)
against 8-level degeneration grading. B: The quadratic regression of T2 of nucleus
pulposus (NP) against 8-level degeneration grading.

55
3.3.3 The Relationship between NP T1rho/T2 Values and 5-level Degeneration
Grading of Discs
The relationship between NP T1rho/T2 values and 5-level degeneration grading of
the 256 discs is given in Figure 3.5. As the degeneration grading increased from grade
1/5 to grade 5/5, T1rho and T2 value decreased. The trend line for NP T1rho/T2
values against 5-level degeneration grading fitted by quadratic regression is shown in
Figure 3.6. The quadratic coefficient (±SE) was 3.35±1.03 (P<0.0013, R2=0.64) for
T1rho value, and 5.35±1.04 (P<0.0001, R2=0.71) for T2 value. There was no
significant trend difference for the T1rho and T2 values decrease over degeneration
grade increase (P=0.17).

56
Figure 3.5: A: The relationship between T1rho value of nucleus pulposus (NP) and
5-level degeneration grading. B: The relationship between T2 value of nucleus
pulposus (NP) and 5-level degeneration grading. *:p<0.05; **:p<0.01; ***:p<0.001;
n.s.: not significant.

57
Figure 3.6: A: The quadratic regression of T1rho value of nucleus pulposus (NP)
against 5-level degeneration grading. B: The quadratic regression of T2 of nucleus
pulposus (NP) against 5-level degeneration grading.

58
3.3.4 The Relationship between AF T1rho/T2 Values and 8-level Degeneration
Grading of Discs
The relationship between AF T1rho/T2 values and the eight-level grading of the
256 discs is shown in Figure 3.7. As the degeneration grade increased from 1/8 to 5/8,
T1rho value decreased. On the other hand, the trend of the decrease in T2 relaxation
time was much flatter. The trend line for AF T1rho/T2 values against 8-level
degeneration grading fitted with linear regression is shown in Figure 3.8. The slope (±
SE) was −3.02±0.32 (P<0.0001, R2=0.26) for T1rho value, and −1.43±0.30 (P<0.0001,
R2=0.08) for T2 value. There was a significant difference in the slopes of the decrease
in T1rho and T2 values over disc degeneration (P=0.0004).

59
Figure 3.7: A: The relationship between T1rho value of annulus fibrosus (AF) and
8-level degeneration grading. B: The relationship between T2 value of annulus
fibrosus (AF) and 8-level degeneration grading. *:p<0.05; **:p<0.01; ***:p<0.001;
n.s.: not significant.

60
Figure 3.8: A: The linear regression of T1rho value of annulus fibrosus (AF) against
8-level degeneration grading. B: The linear regression of T2 of annulus fibrosus (AF)
against 8-level degeneration grading.

61
3.3.5 The Relationship between AF T1rho/T2 Values and 8-level Degeneration
Grading of Discs
The relationship between AF T1rho/T2 values and the five-level grading of the 256
discs is shown in Figure 3.9. As the degeneration grade increased, T1rho value
decreased. On the other hand, the trend of the decrease in T2 value over the increase
in disc degeneration was much flatter. The trend line for AF T1rho/T2 values against
5-level degeneration grading fitted with linear regression is shown in Figure 3.10. The
slope (± SE) was −4.56±0.45 (P<0.0001, R2=0.29) for T1rho relaxation time, and
−1.84±0.44 (P<0.0001, R2=0.07) for T2 relaxation time. There was a significant
difference in the slopes of T1rho and T2 values (P=0.002).

62
Figure 3.9: A: The relationship between T1rho value of annulus fibrosus (AF) and
5-level degeneration grading. B: The relationship between T2 value of annulus
fibrosus (AF) and 5-level degeneration grading. *:p<0.05; **:p<0.01; ***:p<0.001;
n.s.: not significant.

63
Figure 3.10: A: The linear regression of T1rho value of annulus fibrosus (AF) against
5-level degeneration grading. B: The linear regression of T2 of annulus fibrosus (AF)
against 5-level degeneration grading.

64
3.4 Discussion
Compared with previous studies (Auerbach et al., 2006; Blumenkrantz et al., 2006;
Blumenkrantz et al., 2010), much larger number of subjects were included in this
study, including non-symptomatic volunteers as well as patients with low-back pain.
We evaluated 23- to 76-year-old subjects, an age range in which a broad spectrum of
disc degeneration, including early degeneration, is expected.
Both T1rho mapping and T2 mapping were acquired, and NP and FA were analyzed
separately. MR images were acquired sagittally so that all the five lumbar discs can be
analyzed in a single plane. Additionally, both semi-quantitative five-level and
eight-level grading systems were applied in this study. The disc T1rho/T2 values from
the current study were consistent with studies reported by other groups (Auerbach et
al., 2006; Blumenkrantz et al., 2010; Krueger et al., 2007; Marinelli et al., 2009;
Nguyen et al., 2008).
This study confirmed the previously reported negative relationship between T1rho
/T2 value and disc degenerative grade (Auerbach et al., 2006; Blumenkrantz et al.,
2010; Chiu et al., 2001; Kerttula et al., 2001; Nguyen et al., 2008). As in previous
reports, there were overlaps in T2 and T1rho values among different semi-quantitative
grades. This needs to be viewed in the context that disc degeneration is a continuum

65
rather than a discrete process. As a result, any discrete grading system will by design
contain ambiguity with respect to the grading categories. A semi-quantitative grade
system also suffers from subjectivity during grading by the radiologist.
For NP, our study showed that T1rho/T2 values followed the same trend with their
correlations with semi-quantitative gradings. T1rho value did not seem to offer any
additional advantage over T2 relaxation time in differentiating different severities of
disc degeneration. While progression from grade 1 to grade 2 is likely related to
normal ageing, it is possible that early treatment before disc space narrowing takes
place (i.e. < grade 6/8) will be more beneficial for the discs. It is noted that when
using the five-level grading as reference, the quadratic coefficient was higher for NP
T2 value than for NP T1rho value, although the difference was not statistically
significant (P=0.17). This is likely because there was a higher difference between
grade 1/5 and 2/5 discs for T2 relaxation time than for T1rho relaxation time (Figure
3.5, Figure 3.6), while this in turn could be due to the grading being based on
T2-weighted images, i.e. higher T2 value rendered the discs to be graded as grade 1/5.
On the other hand, very interestingly, T1rho value offered a distinct advantage over
T2 value in the evaluation of AF degeneration. While there were almost no changes in
T2 values as the disc degeneration grades increased, T1rho value decreased
apparently as disc degeneration grades increased. It is well known that AF

66
degeneration is a critical factor in disc stability (Modic and Ross, 2007). We also
carried out separate analysis for anterior AF and posterior AF, and no difference was
seen in their changes related to disc degeneration.
The role of specific biochemical changes in the altered MR signal intensity is still
not well understood in the reported literature. In the articular cartilage study, the loss
of proteoglycan results in an increase in T1rho relaxation time (Akella et al., 2001).
On the other hand, T1rho is reported to increase with sulphated glycosaminoglycan
content in degenerative discs (Johannessen et al., 2006). NP is composed of abundant
sulphated glycosaminoglycans in a loose network of Type II collagen. It is a hydrated
gel containing approximately 25% (dry weight) collagen and 50% (dry weight)
proteoglycan (Cassinelli et al., 2001). The proteoglycans of the nucleus osmotically
exert a “swelling pressure”, which enables it to support spinal compressive loads. In
comparison, AF is made up of coarse Type I collagen fibers, and contains 67% (dry
weight) collagen and a low concentration of proteoglycans (Cassinelli et al., 2001;
Weidenbaum et al., 1992). During the initial phase of disc degeneration, loss of
proteoglycans and collagen Type II is observed (Antoniou et al., 1996). Proteoglycan
loss reduces the capacity to bind water and leads to a loss of hydration. Later, Type I
collagen fibres replace the Type II collagen fibres in the annulus (Adams and
Roughley, 2006), thus altering the tensile properties of the tissue. While the reduced

67
water content is a contributing factor of the reduction of T1rho and T2 with
degenerated discs (Johannessen et al., 2006), T1rho and T2 relaxations represent
different contrast mechanisms and may provide complementary information about the
integrity of the disc, and the differences in relaxation times may be linked to the
varying tissue compositions and material properties. The T1rho reduction in AF
during disc degeneration may represent some macromolecular changes that occur
during the process. To better understand the difference in T1rho/T2 values reduction
during the course of NP and AF degeneration, and to translate these relaxation times
into reliable and specific biomarkers for early disc degeneration (Wang, 2005),
additional in vitro studies are warranted to further evaluate the role of MR
relaxometry in disc evaluation.
It is noted in this study that, for both NP and AF, discs of grade 5/8 to 8/8
degenerations had similar T1rho/T2 values. The eight-level grading system offers
information on disc space narrowing, i.e. <30% reduction in disc height for grade 6/8,
30–60% reduction in disc height for grade 7/8 and >60% reduction in disc height for
grade 8/8 (Griffith et al., 2007).
By using the eight-level grading system to study elderly men and elderly women, it
was found that elderly female subjects had more severe disc degeneration than male
subjects at all lumbar levels, and elderly women were more likely to have a narrowed

68
lumbar disc space than elderly men (Griffith et al., 2007; Wang and Griffith, 2010;
Wang et al., 2011b). As disc space narrowing is more likely to cause low-back pain
(Hassett et al., 2003; Videman et al., 2003), our results suggest that even when T1rho
/T2 value are routinely measured for disc degeneration assessment in the future, the
eight-level grading system will still be useful for clinical evaluation, particularly for
those with severe disc degeneration and disc space narrowing.
There are a few limitations with the current study. The placement of ROIs on disc
regions was carried out manually. It is possible that there would be differences in
ROIs on T1rho maps and T2 maps. However, such differences would be rather small
and unlikely to affect the conclusion of this study. The correlation between T1rho and
T2 relaxation times and clinical symptoms, particularly the duration of low-back pain,
of the patients was not investigated. In fact, neither could we be certain that the back
pain of our patients was solely disc related. It was previously reported that only a
weak correlation exists between the level of disc degeneration and clinical symptoms
(Peterson et al., 2000), and imaging findings of degenerative disc disease do not
predict subsequent symptom development (Borenstein et al., 2001). The effect of
ageing on disc component relaxation time was not investigated, as the primary focus
of this study was to compare the relative performance of T1rho and T2 for disc
degeneration evaluation.

69
3.5 Summary
Both T1rho value and T2 value decrease following disc degeneration. For NP,
T1rho value and T2 value decrease in a similar pattern following disc degeneration.
For AF, T1rho value decrease progressively faster than T2 value. Therefore, T1rho
value is better suited for evaluating AF in degenerated disc than T2 value. Both T1rho
and T2 value does not reduce further by disc-space narrowing, therefore, the
eight-level grading system will still be useful for clinical evaluation, particularly for
those with severe disc degeneration and disc space narrowing.

70

71
CHAPTER 4 T1RHO MRI IN RAT LIVER FIBROSIS
MODEL INDUCED BY CCL4 INSULT
4.1 Introduction
Chronic liver disease is a major public health problem worldwide (Charlton, 2004;
Davis et al., 2003; Zhou and Lu, 2009). Liver fibrosis is a common feature of almost
all chronic liver diseases, involving the accumulation of collagen, proteoglycans, and
other macromolecules in the extracellular matrix. Ultimately, progressive hepatic
fibrosis leads to cirrhosis, which is a characteristic of all end-stage liver disease
(Wallace et al., 2008).
Clinically, liver fibrosis usually has an insidious onset and progresses slowly over
decades. Patients remain asymptomatic or have only mild, nonspecific symptoms until
the development of cirrhosis. Cirrhotic patients may have various sequelae of hepatic
decompensation, including variceal hemorrhage, ascites, hepatic encephalopathy, and
hepatic and renal failure. Cirrhosis is also a risk factor for the development of
hepatocellular carcinoma.
Originally, liver fibrosis was considered to be irreversible; however there is
increasing evidence that liver fibrosis is a dynamic process with potential for
regression (Arthur, 2002; Veldhuijzen et al., 2010; Wallace et al., 2008; Wanless et al.,

72
2000). To date, noninvasive diagnostic tests available from clinical practice are not
sensitive or specific enough to be used to detect occult liver injury at early or
intermediate stages. Liver biopsy is the standard of reference for the diagnosis and
staging of liver fibrosis. However, liver biopsy is an invasive procedure with possible
complications (Janes and Lindor, 1993). In addition, the histologic assessment of
fibrosis is also an inherently subjective process, and it is subject to sampling
variability (Poniachik et al., 1996).
To better treat individuals with progressive fibrosis, especially those who might
benefit from early intervention, a reproducible and reliable noninvasive method is
needed to evaluate disease progression, to monitor responses to drug treatment, and to
benefit epidemiologic research. T1rho MRI is sensitive to both low frequency
motional processes and static processes, so it can be used to investigate
macromolecular composition and proton exchange in tissues. Wang et al (Wang et al.,
2011a) showed that T1rho value became prolonged after bile duct ligation (BDL)
induced liver injury of rat model and that the T1rho value increased with the severity
of liver fibrosis. These results suggest that liver T1rho MRI may play an important
role for the early detection and grading of liver fibrosis.
However, a few important questions remain to be answered. (1) Is MR T1rho
sensitive to liver fibrosis with an aetiology other than biliary fibrosis? (2) How does

73
liver inflammation and edema affect liver T1rho values? (3) Can MR T1rho be used to
monitor liver fibrosis regression?
The purpose of study described in this Chapter is to answer these questions by
carrying out the T1rho MRI on the rat liver fibrosis model induced with chronic
carbon tetrachloride (CCl4) insult.
4.2 Materials and Methods
4.2.1 Animal Preparation
Eight male Sprague-Dawley rats with initial weights between 200 and 250 g were
used in the pilot study to assess the MRI measurement reproducibility, and 27 male
Sprague-Dawley rats of similar body weight were used for the experimental study.
The animals were housed on a 12-h light/12-h dark cycle in an air conditioned room
at 25°C. Food and water were available ad libitum.
Liver fibrosis in rats was induced by intraperitoneal injection of 2ml/kg body
weight CCl4 twice weekly, up to 6 weeks, with a 1:1 volume mixture of CCl4 (99.8%;
BDH Laboratory, Poole, UK) in olive oil. All rats were weighed twice a week in order
to adjust the CCl4 dosage according to their body weight. At the end of week 6, CCl4
administration was withdrawn, and the rats were allowed to recover for 4 weeks.

74
4.2.2 MR Image Acquisition
Data acquisition was performed using a commercially available 3-T clinical MR
system (Achieva, Philips Healthcare, Best, The Netherlands). The Ketamine/Xylazine
combination anesthetic was used for MR scanning; the dose of Ketamine/Xylazine for
rat in this study was 100 mg/kg and 10 mg/kg body weight. After anesthesia, animals
were positioned supine and an eight-channel human wrist radiofrequency (RF) coil
was used as the signal receiver, and the in-built body coil was used as the signal
transmitter. Five axial slices were selected to cut through liver.
For the reproducibility study, eight rats without CCl4 insult were MR imaged twice
with an interval of 10 days. Experimental animals were MR imaged at baseline before
CCl4 injection (n=12), 2 days (i.e. 48 h) post initial CCl4 injection (n=12), and 2
weeks (n=12), 4 weeks (n=10), 6 weeks (n=7) post the initiation of CCl4 injection,
and also MR imaged at 1week (n=4) and 4 weeks post the cessation of CCl4 injection
(n=7). The experiment set-up is described in Figure 4.1.
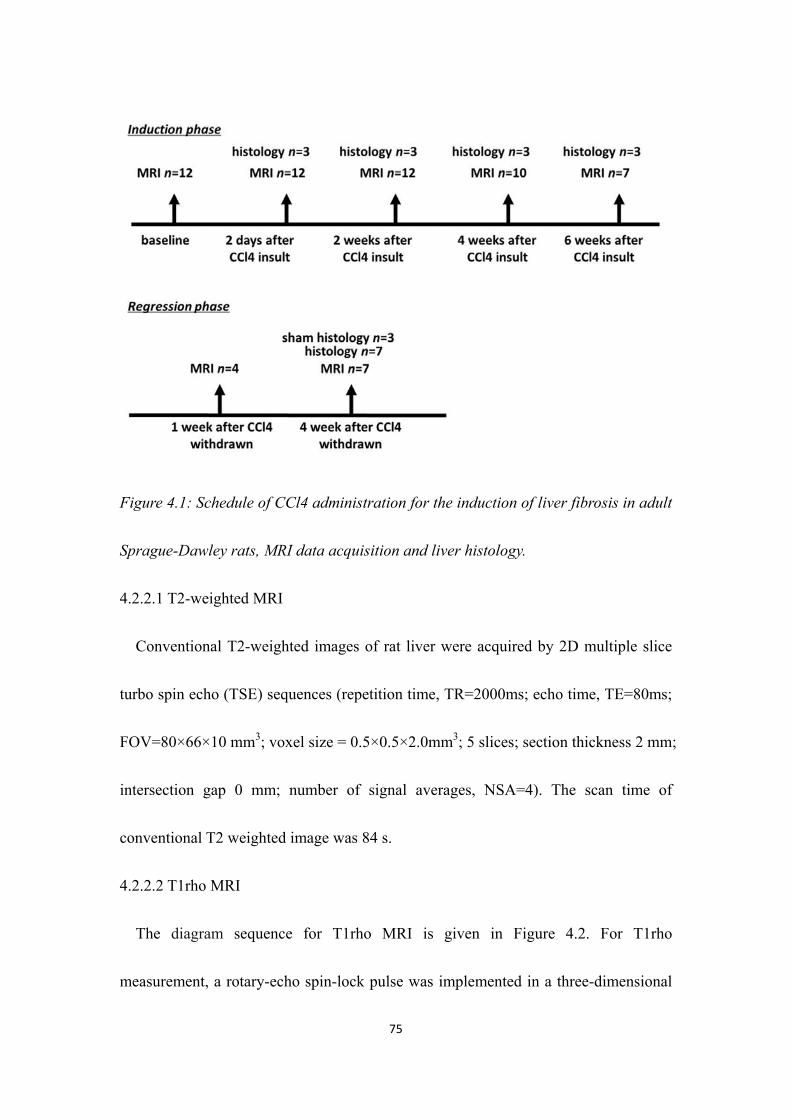
75
Figure 4.1: Schedule of CCl4 administration for the induction of liver fibrosis in adult
Sprague-Dawley rats, MRI data acquisition and liver histology.
4.2.2.1 T2-weighted MRI
Conventional T2-weighted images of rat liver were acquired by 2D multiple slice
turbo spin echo (TSE) sequences (repetition time, TR=2000ms; echo time, TE=80ms;
FOV=80×66×10 mm3; voxel size = 0.5×0.5×2.0mm3; 5 slices; section thickness 2 mm;
intersection gap 0 mm; number of signal averages, NSA=4). The scan time of
conventional T2 weighted image was 84 s.
4.2.2.2 T1rho MRI
The diagram sequence for T1rho MRI is given in Figure 4.2. For T1rho
measurement, a rotary-echo spin-lock pulse was implemented in a three-dimensional

76
balanced fast field echo sequence. Spin-lock frequency was set as 500 Hz, and the
spin-lock times of 1, 10, 20, 30, 40, and 50ms were used for T1rho mapping. The
subsequent normal-phase alternating balanced fast field-echo readout was used for
acquisition. Inversion time (delay time) after acquisition was set as 6000ms to restore
equilibrium magnetization prior to the next T1rho preparation. Volume shimming was
employed to minimize B0 inhomogeneities. TE and TR for b-FFE acquisition were
2.6ms and 5.3ms, respectively. The voxel size was 0.5×0.5×2.00 mm3. The flip angle
was 40 degree and the number of signal averages (NSA) was 4. No
sensitivity-encoding (SENSE) factor was applied for parallel imaging to reduce the
phase-encoding steps. The scan time was about 3 minutes per spin-lock time point.
Figure 4.2: Diagram of the sequence for T1rho MRI, which is the spin-lock balanced
fast field echo (b-FFE) imaging sequence for T1rho MRI, the rotary echo spin-lock
pulse cluster is used for T1rho preparation. SLT= spin-lock time.
4.2.3 Data Processing
T1rho maps were computed on a pixel-by-pixel basis by using a mono-exponential
decay model with a homemade Matlab program (Mathworks, Natick, MA):

77
M(SLT) = M ∙ exp( / ) Equation [1.4]
Where M0 and M(SLT) denote the equilibrium magnetization and T1rho-prepared
magnetization with the spin-lock time of SLT, respectively. This mono-exponential
equation was linearized by logarithm and T1rho maps were generated by fitting all
pixel intensity data as a function of SLT using linear regression. T1rho was calculated
as -1/slope of the straight line fit. T1rho maps were constructed using all 6 SLT points
(1, 10, 20, 30, 40, and 50ms). Maps of coefficient of determination (R2) were also
generated for the evaluation of goodness of fit. Only T1rho values for pixels
associated with R2>0.80 were included in the subsequent region of interest (ROI)
placement and T1rho analysis to eliminate the unreliable poorly fitted T1rho values
due to the blood vessel contamination with fresh blood inflow, as well as
respiration-induced artifacts. One typical rat’s T1rho-weighted image acquired with
different times of spin-lock (SLT) ranging from 1 to 50ms, coefficient of
determination (R2) map, and T1rho map without R2 evaluation are shown in Figure
4.3.

78
Figure 4.3: One typical rat’s T1rho-weighted image acquired with different spin-lock
time (SLT) ranging from 1 to 50ms (A-F). One typical rat’s coefficient of
determination (R2) map (G), T1rho map without R2 evaluation (H), and T1rho map
with R2>0.8 evaluation (I).
4.2.4 Data Measurement and Statistical Analysis
To quantify T1rho values on T1rho maps and liver signal intensities on
T2-weighted images, five regions-of-interest (ROIs) of approximately 3-4 mm2
(12-16 pixels) were placed on liver parenchyma region of each slice’s T1rho maps
with R2>0.80, excluding observable artifacts and blood vessels, leading to a total of
25 ROIs from each liver for each technique. For T2-weighted images, the mean signal
intensity of liver parenchyma was normalized by the signal intensity of the back
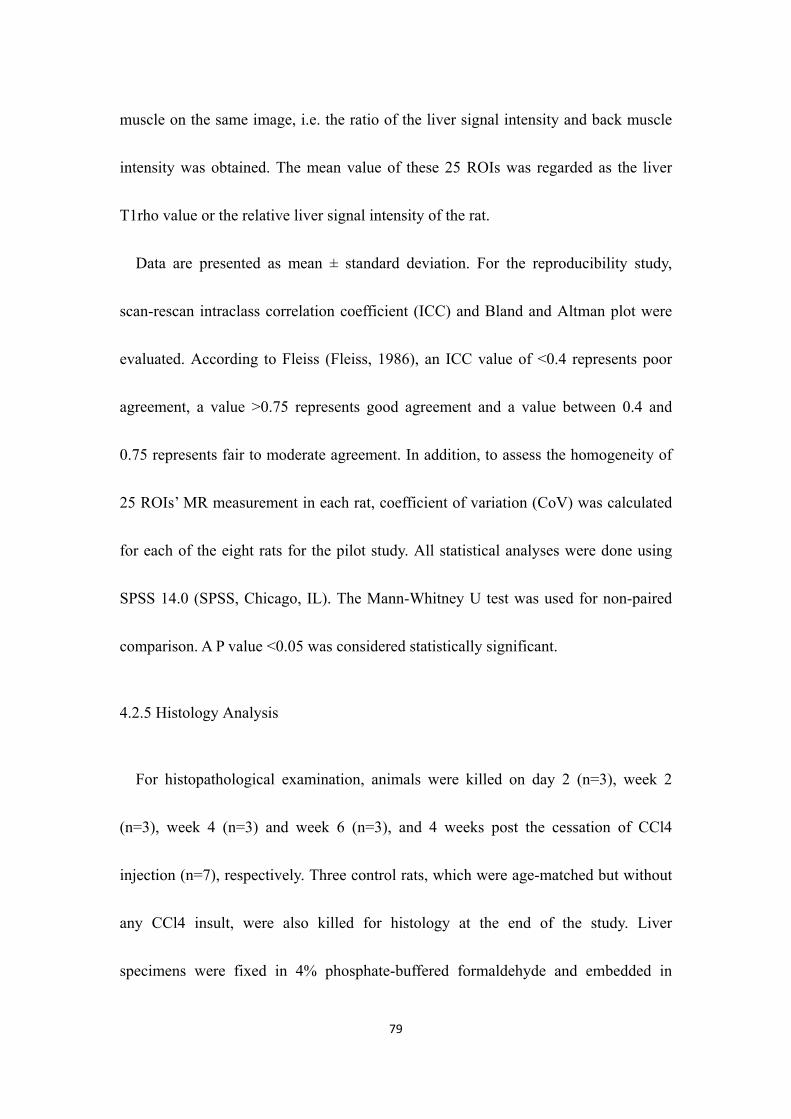
79
muscle on the same image, i.e. the ratio of the liver signal intensity and back muscle
intensity was obtained. The mean value of these 25 ROIs was regarded as the liver
T1rho value or the relative liver signal intensity of the rat.
Data are presented as mean ± standard deviation. For the reproducibility study,
scan-rescan intraclass correlation coefficient (ICC) and Bland and Altman plot were
evaluated. According to Fleiss (Fleiss, 1986), an ICC value of <0.4 represents poor
agreement, a value >0.75 represents good agreement and a value between 0.4 and
0.75 represents fair to moderate agreement. In addition, to assess the homogeneity of
25 ROIs’ MR measurement in each rat, coefficient of variation (CoV) was calculated
for each of the eight rats for the pilot study. All statistical analyses were done using
SPSS 14.0 (SPSS, Chicago, IL). The Mann-Whitney U test was used for non-paired
comparison. A P value <0.05 was considered statistically significant.
4.2.5 Histology Analysis
For histopathological examination, animals were killed on day 2 (n=3), week 2
(n=3), week 4 (n=3) and week 6 (n=3), and 4 weeks post the cessation of CCl4
injection (n=7), respectively. Three control rats, which were age-matched but without
any CCl4 insult, were also killed for histology at the end of the study. Liver
specimens were fixed in 4% phosphate-buffered formaldehyde and embedded in

80
paraffin. Sections 5-μm thick were de-waxed in xylene and rehydrated in ethanol. In
addition to standard haematoxylin and eosin (H & E) staining, sections were also
processed with 0.1% picrosirius red for collagen visualization.
4.3 Results
4.3.1 T1rho Measurement Reproducibility
The liver T1rho value and normalized liver signal intensity on T2-weighted images
of eight rats without CCl4 insult in two MR scans with an interval of 10 days is given
in Table 4.1. This pilot study showed the ICC of scan-rescan reproducibility for liver
T1rho measurement was 0.83. The Bland and Altman analysis showed a mean
difference of 0.33 (95% limits of agreement: -0.74, 1.39) for liver T1rho measurement.
The ICC of scan-rescan reproducibility for normalized liver signal intensity on
T2-weighted images measurement was 0.77. The Bland and Altman analysis showed
a mean difference of 0.004 (95% limits of agreement: -0.26, 0.27) for normalized
liver signal intensity on T2-weighted images measurement. These results suggest both
the liver T1rho measurement and normalized liver signal intensity on T2-weighted
images measurement had a good agreement in repeat MR examinations.
The CoV (coefficient of variation) of the 25 ROIs in each rat was 3.61±0.56% for

81
liver T1rho measurement and 7.27±1.07% for measurement of normalized liver signal
intensity.
Table 4.1: Liver T1rho values and normalized liver signal intensity on T2-weighted
images of eight rats without CCl4 insult in two MR scans with an interval of 10 days.
Rat No. Liver T1rho values (ms)
Normalized liver signal intensity
on T2-weighted images
Scan 1 Scan 2 Scan 1 Scan 2
1 45.38 45.8 1.68 1.57
2 43.62 43.9 1.73 1.73
3 44.88 44.43 1.77 1.69
4 43.04 42.96 1.79 1.65
5 45.3 44.65 1.61 1.62
6 44.2 43.78 1.61 1.56
7 43.62 42.32 1.39 1.68
8 43.5 43.1 1.49 1.54
mean 44.19 43.87 1.63 1.63
SD 0.89 1.10 0.14 0.07
4.3.2 Rat Liver T1rho Values at Different Time Phase
The normal rat liver T1rho value was 44.1±1.0ms at baseline measurement. Two
days post the initiation of CCl4 insult, the liver T1rho value was 46.1±1.3ms, which
represents an increase of 4.4%. At weeks 2, 4, and 6, the liver T1rho values were
49.4±3.7ms, 51.4±3.8 ms and 54.3±2.9ms, respectively; corresponding to increases
over the baseline values of 12.0%, 16.5% and 23.0%, respectively (Figure 4.4). At
weeks 1 and 4 after the withdrawal of CCl4 insult, liver T1rho values were
46.8±2.0ms and 45.1±0.6ms, respectively, with an increase over the baseline values of

82
6.1% and 2.3%, respectively (Figure 4.4). Typical T1rho maps of rat liver at different
time phases are shown in Figure 4.5.
Figure 4.4: Longitudinal follow-up MRI measurements of rat liver T1rho values.
Figure 4.5: Typical T1rho maps of rat liver at different time phases.

83
4.3.3 Relative Rat Liver Signal Intensity on T2WI at Different Time Phase
The normalized liver signal intensity on the T2-weighted image was 0.94±0.15 at
baseline. Two days post the initiation of CCl4 insult, this value was 1.30±0.20,
representing an increase of 38.3%. At weeks 2, 4 and 6, normalized liver signal
intensities on T2-weighted images were 1.34±0.15, 1.38±0.11 and 1.33±0.14,
respectively, corresponding to an increase over the baseline value of 41.8%, 46.4%,
and 41.5%, respectively (Figure 4.6). There were no significant differences of the
normalized T2-weighted liver signal intensities between weeks 2, 4 and 6. At weeks 1
and 4 after the withdrawal of CCl4 insults, the normalized liver signal intensities on
the T2-weighted images were 1.14±0.16 and 0.96±0.10, respectively, corresponding
to baseline value increases of 21.3% and 1.8% respectively (Figure 4.6).

84
Figure 4.6: Longitudinal follow-up MRI measurements of relative rat liver signal
intensity on T2WI .
4.3.4 Histology Results
H & E and picrosirius-red staining were performed for histological and collagen
assessments. No abnormality in parenchymal architecture was observed among
control rats (Figure 4.7A, Figure 4.8A). Extensive infiltration of inflammatory cells,
intracellular deposition of fat vacuoles and hepatocellular swelling, as well as mild
peri-central lobular liver necrosis were observed in the liver 2 days after CCl4 insult,
while no apparent collagen deposition was observed at this time point (Figure 4.7B,
Figure 4.8B). At week 2 of CCl4 insult, early fibrosis was seen, with scattered
collagen deposition in the sinusoids of the peri-central lobular area without septa
(Figure 4.7C, Figure 4.8C). At week 4 (Figure 4.7D, Figure 4.8D) and week 6 (Figure
4.7E, Figure 4.8E) of CCl4 insult, further fibrosis development was noted. Collagen
deposition was more pronounced in the liver at 6 weeks of CCl4 insult. The
specimens collected at 6 weeks exhibited septa formation with collagen deposition
forming portal–portal and portal–central bridges. Infiltration of inflammation cells,
intracellular deposition of fat vacuoles, as well as degeneration and necrosis of
hepatocytes were consistently observed in livers after 2, 4 and 6 weeks of CCl4 insult.
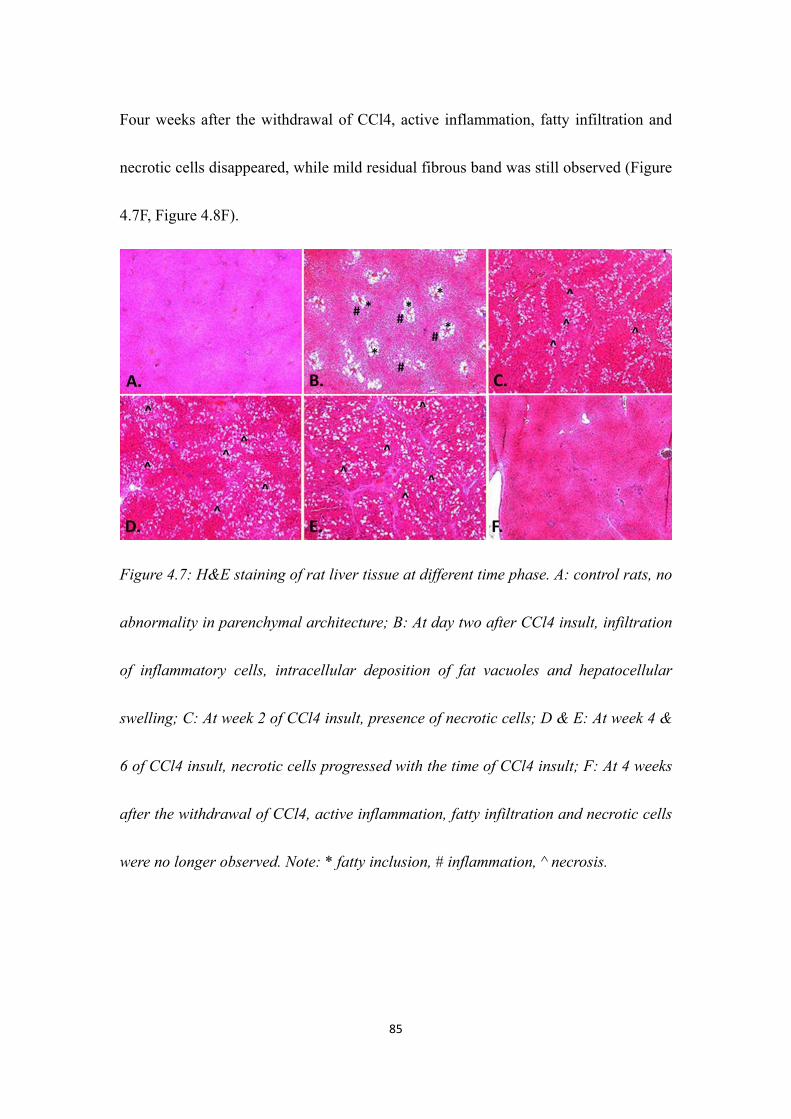
85
Four weeks after the withdrawal of CCl4, active inflammation, fatty infiltration and
necrotic cells disappeared, while mild residual fibrous band was still observed (Figure
4.7F, Figure 4.8F).
Figure 4.7: H&E staining of rat liver tissue at different time phase. A: control rats, no
abnormality in parenchymal architecture; B: At day two after CCl4 insult, infiltration
of inflammatory cells, intracellular deposition of fat vacuoles and hepatocellular
swelling; C: At week 2 of CCl4 insult, presence of necrotic cells; D & E: At week 4 &
6 of CCl4 insult, necrotic cells progressed with the time of CCl4 insult; F: At 4 weeks
after the withdrawal of CCl4, active inflammation, fatty infiltration and necrotic cells
were no longer observed. Note: * fatty inclusion, # inflammation, ^ necrosis.

86
Figure 4.8: Picrosirius-red staining of rat liver tissue at different time phase. A:
control rats, no abnormality in parenchymal architecture; B: At day two after CCl4
insult, intracellular deposition of fat vacuoles, no apparent collagen deposition was
observed for this time point; C: At week 2 of CCl4 insult, early fibrosis was observed,
with scattered collagen deposition in the sinusoids of the peri-central lobular area
without septa; D & E: At week 4 & 6 of CCl4 insult, fibrosis progressed with the time
of CCl4 insult; F: At 4 weeks after the withdrawal of CCl4, mild residual fibrous
bands were still present. Note: f: fibrosis, * fatty inclusion
4.4 Discussion
A noninvasive imaging technique for detecting liver fibrosis at early stages and
monitoring the disease progression or regression in response to treatment is highly
desirable. Recently, a number of novel MR imaging techniques are being investigated

87
to identify or grade liver cirrhosis. These include double contrast-enhanced MR
imaging (Aguirre et al., 2006), MR elastography (Salameh et al., 2009; Talwalkar et
al., 2008), diffusion-weighted imaging (Bonekamp et al., 2009; Talwalkar et al., 2008)
and diffusion tensor imaging (Cheung et al., 2010). The sensitivity of these techniques
for early liver fibrosis, reproducibility and inter-site variability has not been well
established (Sirlin, 2011). Other imaging methods, including ultrasonography and
nuclear imaging techniques, have limited value in detecting early liver fibrosis.
T1rho MRI is sensitive to both low-frequency motional processes and static
processes, and has been proposed to investigate macromolecular composition and
proton exchange within tissues (Duvvuri et al., 2001; Haris et al., 2009b; Nestrasil et
al., 2010b; Nguyen et al., 2008; Szyperski et al., 1993). Liver fibrosis involves the
accumulation of collagen, proteoglycans and other macromolecules within the
extracellular matrix; therefore it can likely be probed with MR T1rho relaxation.
Using the rat liver fibrosis model induced by bile duct ligation, Wang et al. (Wang et
al., 2011a) showed that T1rho MRI can be used to detect the rat liver fibrosis; the
T1rho value became prolonged after bile duct ligation, and was correlated with degree
of fibrosis.
In the current study, the reproducibility of repeat MR examinations was good for
measurements of liver T1rho measurement and normalized liver signal intensity on

88
T2-weighted images.
Our histology results largely mirror the previous reports of the development of liver
inflammation and fibrogenesis of this animal model (Cheung et al., 2010;
Constandinou et al., 2005; Hazle et al., 1990). Compared with baseline values, 48 h
after CCl4 insults there were significant increases (mean, 37%) of the relative signal
intensities on T2-weighted images, likely reflecting the edema and cellular swelling
associated with acute liver inflammation. While the rat liver T1rho values at baseline
were similar to those previously reported (Wang et al., 2011a), the mild yet significant
T1rho increase (mean, 4%) at 48 h may reflect a combination of liver tissue edema,
cellular swelling and inflammatory cell infiltration. Later, as degeneration and
necrosis of hepatocytes and fibrosis appeared and progressed, T1rho values further
increased, and were the highest at 6 weeks post insults (Figure 4.4). On the other hand,
the signal intensity on T2-weighted images reached a high value 48 h post CCl4 insult,
and then did not show any further significant increase (Figure 4.6). Therefore,
changes in the relative liver signal intensities on T2-weighted images and changes in
the T1rho values follow different time courses during CCl4 liver fibrosis induction.
The process of hepatic fibrosis is driven primarily by the development of
inflammation in response to parenchymal injury (Iredale, 2007). It is possible that
liver injuries such as degeneration and necrosis of hepatocytes during the experiments
89
might also contribute to the T1rho value increase. Four weeks post the cessation of
CCl4 insult, liver T1rho was 2% (mean value) higher than the baseline and it was still
statistically significant (Figure 4.4); while, with the inflammation, degeneration and
necrosis of hepatocytes subdued, a mild degree of liver fibrosis was still easily visible
in the rat livers (Figure 4.7F, Figure 4.8F). This slightly elevated liver T1rho at 4
weeks post the withdrawal of CCl4 accords with the residual fibrosis in the liver. The
relative liver signal intensity on T2-weighted images returned to baseline values at
this time point (Figure 4.6). The liver T1rho values decreased upon the withdrawal of
CCl4 insult, indicating MR T1rho may be used to monitor liver injury/fibrosis
regression as well as progression.
Our results also showed that the liver T1rho values of individual experimental rats
dispersed at weeks 2, 4 and 6 after CCl4 insult (Figure 4.4); while liver T1rho values
were more narrowly distributed at baseline and at 4 weeks post withdrawal of CCl4
insults (Figure 4.4). It has been well-documented that liver histology can vary widely
in the rat fibrosis model induced by multiple CCl4 doses. This is due to an
unpredictable variation in the response of the rat liver to CCl4 (Proctor and Chatamra,
1983). Our observations from week 2 to week 6 may reflect these response variations.
There is a lack of reliable methods for monitoring the rapidly changing liver damage
with each dose and, therefore, it is difficult to maintain a constant critical level of
90
liver damage. With further studies, it may be possible that MR T1rho could be used to
monitor the level of liver damage for individual rats; and CCl4 liver injury rodent
models may be applied when homogeneous severity is required for testing expensive
premarketing drugs. In those pre-clinical settings where the killing of experimental
animals is highly undesirable, liver T1rho can serve as a biomarker for liver injury
(Wang and Yan, 2008). In addition to the application for liver fibrosis evaluation,
T1rho imaging can also form part of multi-parametric MRI techniques as imaging
biomarkers in pre-clinical animal studies for evaluation of other intra-hepatic lesions
and therapeutic efficacy (Chen et al., 2006; Wang et al., 2010).
There are several limitations in this study. The findings from the current study are
preliminary, given the limited sample sizes. Statistical power could be further
increased with access to larger sample sizes in future studies. Though liver
intoxication with CCl4 is considered a classical animal model for hepatic fibrosis, the
fibrogenesis process is intertwined with edema, inflammation and hepatocyte necrosis.
However, in clinical patients, liver injury and fibrogenesis are mostly intertwined.
This study did not investigate the exact mechanism of T1rho increase in this CCl4
liver fibrosis model. A one-to-one correlation study of T1rho increase versus liver
collagen content, by analyzing individual rats, may help to further understand the
mechanism underlying the liver T1rho increase. Normalized liver signal intensities on

91
T2-weighted images were obtained in this study. This method could be improved by
quantitative T2 mapping. Other experimental models of hepatic fibrosis, such as those
associated with immunological damage and alcoholic liver disease (Constandinou et
al., 2005; Tsukamoto et al., 1990), should also be tested in further studies.
4.5 Summary
In summary, this Chapter demonstrated that MR T1rho is a valuable imaging
biomarker for liver injury and fibrosis induced with CCl4 chronic administration.
Liver T1rho was only mildly affected by edema and acute inflammation when there
was no apparent fibrosis. Liver MR T1rho values decreased when liver fibrosis and
injury regressed. When there is mild residual liver fibrosis but with inflammation and
hepatocytes necrosis subdued, liver T1rho remained slightly elevated, while the
relative liver signal intensity on T2-weighted image returned to baseline values.

92

93
CHAPTER 5 T1RHO MRI IN LIVER OF HEALTHY HUMAN
SUBJECTS
5.1 Introduction
Chronic liver disease is a major worldwide public health problem (Charlton, 2004;
Davis et al., 2003; Zhou and Lu, 2009). More than 570 million individuals worldwide
are chronically infected with hepatitis B virus (HBV) or hepatitis C virus (HCV)
(Zhou and Lu, 2009). The trend is expected to increase due to an ageing population,
the growing epidemic of obesity and nonalcoholic steatohepatitis, and the continued
emergence of clinical manifestations among individuals with longstanding chronic
viral hepatitis infections. Regardless of causes, chronic liver injury is generally
associated with the accumulation of collagen and other macromolecules within the
extracellular matrix, a process referred to as fibrosis (Wallace et al., 2008).
Liver fibrosis was considered to be irreversible originally; however there is
increasing evidence that liver fibrosis is a dynamic process with potential for
regression (Arthur, 2002; Veldhuijzen et al., 2010; Wallace et al., 2008; Wanless et al.,
2000). Promising new treatments for liver fibrosis are currently under intensive
investigation (Asadullah et al., 2003; Friedman, 2008; Hammel et al., 2001; Huang et
al., 2006; Oh et al., 2008). Therefore, early detection of liver fibrosis may be helpful

94
in the management of chronic liver disease.
While the majority of complications from chronic liver disease results from
progressive hepatic fibrosis, the available diagnostic tests used in clinical practice are
not sensitive or specific enough to detect occult liver injury at early or intermediate
stages (Afdhal and Nunes, 2004; Talwalkar et al., 2008). The conventional standard
for the diagnosing and staging liver fibrosis is percutaneous liver biopsy. However,
liver biopsy is an invasive and expensive procedure with possible side complications
(Janes and Lindor, 1993). Histological assessment of fibrosis is also an inherently
subjective process and is subject to sampling variability. A study that compared
laparoscopic versus histological diagnosis of cirrhosis found that 32% of cases were
underdiagnosed with histological examination of a single liver biopsy specimen
(Poniachik et al., 1996). And a number of studies have demonstrated that excessive
rates of sampling error (25–40%) result in poor reproducibility regardless of the
underlying liver disease origin (Ratziu et al., 2005). In addition, the extent of variation
from observer interpretation by expert histopathologists may be as high as 20%
(Bravo et al., 2001). These limitations make liver biopsy unsuitable for diagnosis and
longitudinal monitoring in the general population.
As reported, T1rho MRI is able to detect liver fibrosis in rat model induced by
biliary duct ligation, and the degree of fibrosis is correlated with the degree of
95
elevation of the T1rho measurement (Wang et al., 2011a). In Chapter 4, we also
reported T1rho MRI can be used to assess liver fibrosis in rat model induced by CCl4
intoxication of 1ml/kg twice weekly. The rat T1rho value increased over the baseline
value by 12%, 16.5%, and 23.0% at week 2, week 4, and week 6 after first injection
of CCl4. While at week 4 after the withdrawal of CCl4 insult, liver T1rho value
decreased to close to the baseline value.
These results suggest liver T1rho MRI may play an important role for liver fibrosis
early detection and grading. For translating liver T1rho MRI to a clinically applicable
imaging biomarker, the technical feasibility of T1rho MRI for human liver needs to be
evaluated.
The purpose of study described in this Chapter is four fold: 1) to evaluate the
measurement reproducibility of T1rho values for healthy human liver; 2) to evaluate
the T1rho value agreement of the fasting status with the post meal status; 3) to
evaluate the feasibility of using less T1rho-weighted images at different spin-lock
time points for human liver T1rho map; 4) to get normal liver T1rho value range of
healthy human subjects
5.2 Methods
5.2.1 Subjects
96
All volunteers were recruited from an advertisement in our university. All subjects
were clinically healthy, with no liver disease history or alcoholism. After the MRI
examination, the subjects were followed up by telephone for 3 months and confirmed
they remained healthy. In total, 20 subjects took part in this study, comprising 12
males and 8 females, with a mean age of 29.8 years (range: 20–44 years). Subjects
were asked to undergo MRI 2 h after their standard evening meal, and/or early in the
morning before taking breakfast (fasting status), depending on their availability.
5.2.2 MR Image Acquisition
MRI data acquisition was performed on a 3 T clinical scanner (Achieva; Philips
Healthcare, Best, Netherlands). An 8-channel cardiac coil was used as the signal
receiver to cover the liver, and the built-in body coil was used as the signal transmitter.
Subjects were examined supine.
5.2.2.1 T2-weighted MRI
Anatomical imaging protocol was axial breath-hold T2 weighted spectral adiabatic
inversion recovery (SPAIR) sequence (repetition time, TR=1236ms; echo time,
TE=70ms; matrix=300×170; voxel size= 1×1.4×7mm3; 20 slices; section thickness= 7
mm; intersection gap=2mm; number of signal averages, NSA=2). The scan time of
conventional T2 weighted image was 24 seconds.

97
5.2.2.2 T1rho MRI
After inspection of the anatomical images revealed no imaging abnormalities, with
scout scans in the coronal plane and sagittal plane, three representative axial slices
were selected to cut through the upper, middle and lower liver for T1rho imaging
(Figure 5.1). Volume shimming was employed to minimize B0 inhomogeneities.
The diagram of sequence for T1rho MRI is given in Figure 5.2. The rotary echo
spin-lock pulse was implemented in a single shot 2D balanced fast field echo (b-FFE)
sequence. Spin-lock frequency was set as 500Hz and spin-lock times of 1, 10, 20, 30,
40 and 50ms were used for T1rho mapping. Segmented normal phase alternating FFE
readout was used for acquisition. T1rho weighted images were acquired during the
transient status towards the steady state, but with T1rho weighted magnetisation
maintained. A rotary echo spin-lock pulse was applied once for every segment length
of 60 readouts. A delay time of 6000ms was inserted after each segment acquisition to
fully restore the equilibrium magnetization prior to the next T1rho preparation. TE
and TR for b-FFE acquisition were 1.16 and 2.3ms, respectively. The voxel size was
1.5×1.5×7.00mm3. The flip angle was 40 degree and the number of signal averages
(NSA) was 2. A sensitivity-encoding (SENSE) factor of 1.5 was applied for parallel
imaging to reduce the phase-encoding steps, and hence the acquisition time. The
whole body specific absorption rate (SAR) was < 0.4W/kg for this sequence as

98
demonstrated on the scanner’s console.
The images were acquired with a breath-hold technique. Volunteers were trained to
breath-hold during shallow breathing, and maintain breath-holding at a similar
breathing depth. At each slice level, T1rho images of each spin-lock time were
inspected immediately after acquisition, images with artifacts or a breath-holding
position shift were discarded and these images were reacquired. The scan time was 38
s per spin-lock time point, including 30 seconds preparation time, primarily for the
spin-lock pulse calibration, in which the period of time the subjects were allowed for
free-breathing; and the subsequent 8 seconds for data acquisition, in which the period
of time the breath was held. Including the time for rescanning, the whole examination
lasted about 15 minutes.
Figure 5.1: Coronal (left) and sagittal (right) scout images. Three axial slices are
selected to cut though the upper (slice 1), middle (slice 2) and lower (slice 3) liver.

99
Figure 5.2: Diagram of the sequence for T1rho MRI, which is the spin-lock balanced
fast field echo (b-FFE) imaging sequence for T1rho MRI, the rotary echo spin-lock
pulse cluster is used for T1rho preparation. SLT= time of spin-lock.
5.2.3 T1rho Data Processing
T1rho maps were computed on a pixel-by-pixel basis using a mono-exponential
decay model with a homemade Matlab program (Mathworks, Natick, MA):
M(SLT) = M ∙ exp( / ) Equation [1.4]
Where M0 and M (SLT) denote the equilibrium magnetisation and T1rho-prepared
magnetisation with the spin-lock time of SLT, respectively. This mono-exponential
equation was linearised by logarithm and T1rho maps were generated by fitting all
pixel intensity data as a function of SLT using linear regression. T1rho was calculated
as -1/slope of the straight line fit.
T1rho maps were constructed using all 6 SLT points (1, 10, 20, 30, 40, and 50ms),
3 SLT points (1, 20, and 50ms), and 2 SLT points (1 and 50ms). Maps of coefficient
of determination (R2) were also generated for the evaluation of goodness of fit. Only
T1rho values for pixels associated with R2>0.80 were included in the subsequent

100
region of interest (ROI) placement and T1rho analysis to eliminate the unreliable
poorly fitted T1rho values due to the blood vessel contamination with fresh blood
inflow, as well as respiration-induced artifacts.
5.2.4 T1rho Measurement
The data were measured by two radiology trainees (ZF, DM) with more than 3
years of experience of reading abdominal MRIs. To quantify liver T1rho value, five
ROIs of approximately 100–200mm2 were manually placed on the liver parenchyma
region of each slice’s T1rho maps with R2>0.80, excluding observable artifacts and
blood vessels (Figure 5.3), leading to a total of 15 ROIs from each liver examination.
The mean value of these 15 ROIs was regarded as the liver T1rho value for the
subject.
Ten data sets (five from fasting status and another five from post-meal status) were
used to assess inter-reader reproducibility. For this, the data were assessed by two
readers independently. After the confirmation of satisfactory inter-reader
reproducibility, the remaining data were measured by one trainee only (ZF), and the
results by this trainee were used for further analysis and processing.
Data are presented as mean ± standard deviation. Reproducibility was assessed
using intraclass correlation coefficient (ICC) on absolute agreement. According to

101
Fleiss (Fleiss, 1986), an ICC value of <0.4 represents poor agreement, a value >0.75
represents good agreement and a value between 0.4 and 0.75 represents fair to
moderate agreement. Comparison of liver T1rho value at fasting status and post-meal
status was carried out with Mann–Whitney U-test. All statistical analyses were done
using SPSS v. 14.0 (SPSS, Chicago, IL). A p-value <0.05 was considered statistically
significant.
Figure 5.3: One healthy volunteer’s T1rho map constructed with 6-SLT, with
coefficient of determination R2>0.8 evaluation. Five regions of interest (ROIs) are
placed on the liver parenchyma region, excluding observable artifacts and blood
vessels.

102
5.3 Results
The liver T1rho values of these 38 examinations measured from T1rho maps
constructed using 6-SLT, 3-SLT, and 2-SLT points are listed in Table 5.1. The
T1rho-weighted images acquired at different SLT, and T1rho maps constructed using
6-SLT, 3-SLT, and 2-SLT points are shown in Figure 5.4, and Figure 5.5, respectively.

103
Table 5.1: Liver T1rho values of healthy volunteer measured with 6, 3, and 2
spin-lock time (SLT) points.
Case
No.
Liver T1rho values (Millisecond)
Scan1-fasting
(n=11)
Scan 2-fasting
(n=3)
Scan 1- post meal
(n=15)
Scan 2- post meal
(n=9)
SLT=6 SLT =3 SLT =2 SLT=6 SLT=3 SLT=2 SLT=6 SLT=3 SLT=2 SLT=6 SLT=3 SLT=2
1 44.8 45.1 46.9 45.8 46.3 47.4 42.8 43.5 43.8 43.4 42.6 43.7
2 41.3 41.1 43.4 41.2 41.7 43.8 39.7 39.8 40.5 38.8 38.6 39.2
3 43.6 44.2 45.2 42.5 43.2 43.9
4 45.1 45.9 46.7 44.8 45.1 42.8
5 42.1 42.7 44.1 41.9 41.7 42.1 41.8 41.7 42.7
6 42.5 42.7 43.3 39.9 40.6 41.5
7 43.5 44.1 45.2
8 41.2 41.3 41.4 41 42 43.8
9 44.8 44.8 46.5 42.7 42.5 43.9
10 41.8 41.5 41.5
11 42.9 44.1 45.7
12 42.2 42.5 43.8 43.5 43.8 46.1 46.5 46.6 47.2
13 44.1 43.3 44.5
14 44.3 44.8 46.8
15 42.8 42.8 43.5
16 41.8 42.7 43.7 41.3 42.3 42.3
17 42 42.8 43.4 42.9 43.1 43.4
18 42.3 42.8 44.1 42.1 42.5 43.9
19 40.7 40.9 43.5
20 39.8 40.6 42.9
Mean 42.2 42.6 44.0 43.0 43.5 45.0 42.6 43.0 44.0 42.6 42.7 43.2
SD 1.4 1.5 1.4 2.4 2.5 2.1 1.6 1.6 2.0 2.2 2.2 2.1
Note: SLT =spin-lock time; SD= standard deviation;

104
Figure 5.4: The T1rho-weighted images acquired with different spin-lock time (SLT)
ranging from 1 to 50ms.
Figure 5.5: One healthy volunteer’s T1rho maps constructed using 6-SLT (upper row),
3-SLT (middle row), and 2-SLT (lower row). Left column: coefficient of determination
(R2) maps, middle column: T1rho maps without R2 evaluation, right column: T1rho
maps with R2>0.8 evaluation. When SLT point decrease, R2 evaluation is less efficient
to remove blood vessel contamination and artifact. When SLT point is 2, the R2 is

105
always equal to one, so no pixels are excluded by criteria of R2>0.8.
5.3.1 T1rho Measurement Reproducibility
The first 10 scans data set (5 from fasting status, 5 from post-meal status) were
used to assess inter-reader measurement reproducibility. The ICCs for inter-reader
measurement reproducibility were 0.930, 0.981, and 0.969 for T1rho maps
constructed by 6-SLT, 3-SLT and 2-SLT, respectively, indicating the T1rho
measurement had good reproducibility between the two readers.
12 subjects were scanned twice (3 at fasting status and 9 at post-meal status); the
ICCs for scan-rescan reproducibility were 0.811, 0.804, and 0.69 for 6-SLT, 3-SLT
and 2-SLT used for T1rho mapping, respectively; it indicated T1rho MRI using 6 or 3
SLT points had good scan-rescan reproducibility, while T1rho MRI using only 2 SLT
points had moderate scan-rescan reproducibility.
5.3.2 T1rho Value Agreement of the Fasting Status with Post Meal Status
A comparison was made to see whether there was a difference in the liver T1rho
value at fasting status and at post meal status. For those scanned twice, only the data
from the first scan were used, resulting 11 values from fasting status and 15 post meal
status. Liver T1rho values measured from the T1rho maps constructed by 6-SLT,
3-SLT, and 2-SLT is given in the Table 5.2. There was no significant difference in the

106
liver T1rho value at fasting status and at post meal status.
Table 5.2: Comparison of liver T1rho values at fasting status and at post meal status.
SLT points for
T1rho Mapping
Liver T1rho Values (Millisecond) p-value#
fasting status (n=11) post meal status (n=15)
6-SLT points 42.2±1.4 42.6±1.6 p=0.483
3-SLT points 42.6±1.5 43.0±1.6 p=0.363
2-SLT points 44.0±1.4 44.0±2.0 p=0.938
Note: 6-SLT points: 1, 10, 20, 30, 40 and 50ms; 3-SLT point: 1, 20 and 50ms; 2-SLT
points: 1 and 50ms. #: Mann–Whitney U-test.
5.3.3 T1rho Value Agreement for T1rho Maps Constructed by Different Spin-lock
Time Points
Polled all 38 examinations together, the ICC for 3-SLT T1rho measurement v.s.
6-SLT T1rho measurement was 0.949, while ICC for 2-SLT T1rho measurement v.s.
6-SLT T1rho measurement was only 0.652. The Bland and Altman plots for the
comparison are given in Figure 5.6, with the mean difference of 0.32 (95% limits of
agreement:-0.6, 1.23) for 3-SLT v.s. 6-SLT T1rho measurement, and the mean
difference of 1.37 (95% limits of agreement: -0.64, 3.37) for 2-SLT v.s. 6-SLT T1rho
measurement. These results suggest the T1rho measurement from the T1rho map
constructed by 3 SLT points had a good agreement with 6 SLT points. These results
indicate that using 3-SLT of 1, 20 and 50ms can be acceptable alternative for the liver

107
T1rho measurement, while 2-SLT of 1 and 50ms do not provide reliable measurement.
Figure 5.6: Bland and Altman plots for comparison of 3-SLT v.s. 6-SLT liver T1rho
measurement (A) and 2-SLT v.s. 6-SLT liver T1rho measurement (B). 3-SLT
measurement demonstrates good agreement with 6-SLT measurement. SLT= spin-lock
time.
108
5.3.4 T1rho Value Range of Healthy Human Subjects
Polled all 38 examinations together, the measured liver T1rho value was
42.5±1.7ms (range: 38.8-46.5ms) for 6-SLT, 42.9±1.8ms (range: 38.6-46.6ms) for
3-SLT, and 43.9±1.9ms (range: 39.2-47.4ms) for 2-SLT. There was no significant
difference between the measured liver T1rho values using 6-SLT and 3-SLT for T1rho
mapping (p=0.442), while the T1rho value difference between 6-SLT and 2-SLT used
for T1rho mapping was significant (p<0.001)
5.4 Discussion
In patients with pre-cirrhotic stages of liver fibrosis, as well as patients with early
cirrhosis, the liver parenchyma usually has a normal appearance, or may exhibit only
subtle, non-specific heterogeneity on conventional MRI. Recently, a number of novel
MRI techniques have been investigated to identify or grade liver cirrhosis. These
include double contrast-enhanced MRI (Aguirre et al., 2006), MR elastography
(Salameh et al., 2009; Talwalkar et al., 2008) and diffusion-weighted imaging
(Bonekamp et al., 2009; Talwalkar et al., 2008). These techniques’ sensitivity for
early liver fibrosis, reproducibility and intersite variability have not been well

109
established (Sirlin, 2011). Other imaging methods, including ultrasound and nuclear
imaging techniques, have limited value in detecting early liver fibrosis.
T1rho MRI, as a new mechanism for MR tissue contrast, has been investigated in
biomedical applications. Liver fibrosis involves the accumulation of collagen,
proteoglycans and other macromolecules. T1rho MRI is able to detect liver fibrosis in
rat model induced by biliary duct ligation (Wang et al., 2011a) and CCl4 insult (in
Chapter). It is plausible that T1rho MRI may be sensitive for evaluation of liver
fibrosis in patients.
Clinically, the technical difficulties of T1rho MRI include its relatively slow
acquisition speed, sensitivity to B0 and B1 field inhomogeneities and high SAR. A
rotary echo pulse was applied in this study to compensate the B1 inhomogeneities
(Charagundla et al., 2003). Volume shimming was also employed to minimize the B0
inhomogeneities. In all T1rho scans in this study, SAR deposition was under the
allowable Food and Drug Administration limits of 0.4W/kg averaged over the whole
body (Collins et al., 1998). Owing to respiratory motion, liver imaging represents a
particular challenge for this technique. In our initial pilot studies, three-dimensional
(3D) b-FFE sequence and respiratory gating was used to increase liver coverage;
however, the upper and lower sections of the scan block tended to have poor image
quality, probably due to B1 field inhomogeneity. Importantly, it was observed that

110
even the use of respiratory gating might not completely eliminate the
respiration-induced displacement of images acquired at each spin-lock time.
Meanwhile, liver vessels displayed high signal intensities with the use of b-FFE
sequence (Figure 5.4). Thus, even mild spatial misregistration due to respiratory
motion could lead to an artificially high T1rho value for liver parenchyma. As such,
the criterion of R2>0.80 was applied to eliminate the unreliable artificially high T1rho
values induced by the vessel contamination, as well as respiration-induced artifacts.
In this study, T1rho measurement had good reproducibility between the two readers
and two scans. It is known that the liver would have a higher level of glycogen post
meal than at fast status. Our current study suggests that this glycogen level fluctuation
does not affect liver T1rho level measurement.
Accurate and precise T1rho mapping is challenging under the scan time constraint
because multiple SLTs are usually required, and a long delay time (6000ms in this
study) is also often necessary in the spin-lock pulse sequence for the longitudinal
magnetization restoration. The reduction of the applied SLT numbers is an apparent
strategy to enhance T1rho imaging efficiency, as long as the accuracy and reliability
of T1rho mapping could be maintained. In clinical practice, it will be always
advantageous if accurate liver T1rho value measurement can be obtained with fewer
SLTs, particularly for patients who experience difficulties in holding their breath. In

111
addition, a high frequency spin-lock pulse is usually associated with high SAR and
total RF energy deposition, which may be a safety concern for T1rho MR imaging,
particularly at high fields, such as 3T (Santyr et al., 1994). Examinations with fewer
SLTs are also helpful to reduce the total RF energy deposition into the patient bodies,
and mitigating the safety concern.
When fewer SLTs are used for T1rho imaging, careful selection of the applied SLTs
is important to optimize the accuracy of the T1rho maps. If the applied SLTs are all
much shorter than the true T1rho value of the target tissue, big fitting deviation of
T1rho values can be introduced. On the other hand, much longer SLTs than the true
T1rho value would result in images with very low SNRs, and hence reduce the fitting
accuracy. The SLT of 1ms was selected, in this study, as the T1rho-weighted image
acquired at this SLT has the highest SNR. Theoretical analysis has shown that the
highest precision of exponential decay constant fitting could be achieved if the second
data point is measured around the true value of the exponential decay constant
(Fleysher et al., 2008). Therefore, The SLT of 50ms was selected because it was close
to and slightly larger than the true T1rho value of human livers at 3T. Actually, by
using two SLTs, T1rho and M0 could be explicitly solved from the mono-exponential
equation with the R2 always equal to one. An additional SLT of 20ms was included in
the 3-SLT fitting to increase the degree of freedom for fitting, and thus, improve the

112
robustness of T1rho mapping. Note that the selection of the third data point, 20ms in
this study, for fitting will be relatively robust, i.e. T1rho fitting accuracy and
uncertainty, would not change much if the third data point is selected, as the other
values like 30ms or 40ms. In the current study, with three slices acquired with 6 SLTs,
3 SLTs, or 2 SLTs, 11.4 minutes, 5.7 minutes or 3.8 minutes were required,
respectively. In addition, some resting time is allowed after each breath-holding. By
using 3-SLT approach, the T1rho imaging scan time for the liver could be reduced
approximately by a factor of two, compared to an acquisition using six SLTs.
After comparing the agreement of 3-SLT vs. 6-SLT measurement, and 2-SLT vs.
6-SLT measurement, all the MRI data, including fasting status and post-meal status,
were used for comparison. The ICC for 3-SLT v.s. 6-SLT measurement and 2-SLT v.s.
6-SLT measurement were satisfactory, according to Fleiss (Fleiss, 1986), though as
expected, the ICC for 3-SLT v.s. 6-SLT agreement (0.949) was better than 2-SLT v.s.
6-SLT agreement (0.652). In addition, the ICC for scan-rescan reproducibility was
comparable with 6-SLT and 3-SLT measurements (0.811 and 0.804 respectively),
while it was less optimal for 2-SLT measurement (0.69). The measured healthy human
liver T1rho value in this study is similar with the control rat liver T1rho values
reported in Chapter 4 and reported article (Wang et al., 2011d).
One limitation of the current study is that only healthy volunteers were studied, and

113
whether the results from this study can directly be translated to application in patients
with liver diseases remain to be further investigated.
5.5 Summary
In summary, it is feasible to obtain consistent liver T1rho measurement for human
subjects at 3 T. Our study demonstrated that the ICCs for inter-reader measurement
reproducibility and scan-rescan reproducibility were good for human liver T1rho
measurement; the liver T1rho value did not affected by glycogen level fluctuation;
adopting 3-SLT of 1, 20, and 50ms for T1rho measurement could provide reliable
measurement and reduce the scanning time approximately by a factor of two,
compared to an acquisition using 6-SLT of 1, 10, 20, 30, 40, and 50ms, it might be an
acceptable alternative when fast acquisition is desired for the liver T1rho imaging.
These preliminary results will be relevant for translating liver MRI T1rho to a
clinically applicable imaging biomarker for liver fibrosis.

114

115
CHAPTER 6 GENERAL DISCUSSION AND FURTHER
WORK
T1rho MRI provides us a new contrast mechanism that is different from T1- and
T2-weighted contrast. T1rho MRI can be performed in the forms of T1rho-weighted
image, T1rho mapping and T1rho dispersion. T1rho MRI is useful to study
low-frequency motional processes and chemical exchange in biological tissues.
In this dissertation, several applications of quantitative T1rho mapping were
investigated; including T1rho mapping in neuro-degeneration induced by normal
aging processing and chronic hypertension in rats, T1rho mapping in disc
degeneration in human subjects, T1rho mapping in liver injury and fibrosis model
induced by CCl4 insult, and T1rho mapping in normal liver in healthy human
subjects.
In our study described in Chapter 2, the exact mechanism of T1rho value increase
in rats with aging processing and chronic hypertension was not yet well investigated.
Further histological and biochemical correlation study should be conducted to further
understand the mechanism underlying the rat brain T1rho value increase. In our study
described in Chapter 3, the relative performance of T1rho and T2 for disc
116
degeneration evaluation was compared. The correlation between T1rho and T2 values
and clinical symptoms, particularly the duration of low-back pain, of the patients
should be further investigated. In our study described in Chapter 4, the exact
mechanism of T1rho increase in this CCl4 liver fibrosis model was not well
investigated. Further one-to-one correlation study of T1rho increase versus liver
collagen content, by analyzing individual rats, may help to further understand the
mechanism underlying the liver T1rho value increase. Additionally, in order to further
understand the T1rho MRI in liver fibrosis, other experimental models of hepatic
fibrosis, such as those associated with immunological damage and alcoholic liver
disease should also be tested in further studies. In our study described in Chapter 5,
clinical potential of T1rho MRI in the management of human liver have been
demonstrated. Further studies are encouraged to realize the ultimate clinical
application of T1rho MRI in the patients with liver fibrosis or cirrhosis.
In our studies described in this thesis, we quantified the T1rho values by setting
ROIs in rat brain, intervertebral disc, and liver parenchyma region of each slice’s
T1rho maps. Manual ROI analysis of T1rho map is a relatively time-consuming
method. An efficient and reliable T1rho measurement method, such as histogram
analysis method, should be further investigated.
T1rho MRI, particularly at low spin-lock frequency, is sensitive to B0 and B1

117
inhomogeneities. In our studies described in this thesis, volume shimming was
employed to minimize B0 inhomogeneities. The rotary echo spin-lock pulse
(“self-compensating” spin-lock pulse) is introduced to reduce the potential image
artifacts arising from B1 inhomogeneity. However, in our study described in Chapter 5,
the human liver T1rho images still tend to present the banding-like spin-lock artifacts
induced by B0 inhomogeneities; the percentage of satisfactory images per acquisition
was about 60%. The method described by Dixon et al. (Dixon et al., 1996) has been
proposed to reduce sensitivity to B0 field inhomogeneity in T1rho imaging. Therefore,
the pulse modified according to Dixon method should be further evaluated.
Chemical exchange (CE), usually represented by proton exchange, is thought to
play a crucial role in T1rho dispersion. It is worth noting that chemical exchange has
been recently exploited as a novel and powerful contrast mechanism for MRI, usually
performed in the forms of either T1rho dispersion imaging or chemical exchange
saturation transfer (CEST) imaging (Ward et al., 2000; van Zijl and Yadav, 2011).
Therefore, T1rho dispersion and the combination with CEST imaging are worth to be
conducted in the further to better characterize and understand the underlying chemical
exchange processes associated with physiology and pathology.

118

119
REFERENCES:
Adams, M.A., Roughley, P.J., 2006. What is intervertebral disc degeneration, and
what causes it? Spine (Phila Pa 1976) 31, 2151-2161.
Afdhal, N.H., Nunes, D., 2004. Evaluation of liver fibrosis: a concise review.
American Journal Of Gastroenterology 99, 1160-1174.
Aguirre, D.A., Behling, C.A., Alpert, E., Hassanein, T.I., Sirlin, C.B., 2006. Liver
fibrosis: noninvasive diagnosis with double contrast material-enhanced MR
imaging. Radiology 239, 425-437.
Akella, S.V., Regatte, R.R., Gougoutas, A.J., Borthakur, A., Shapiro, E.M., Kneeland,
J.B., Leigh, J.S., Reddy, R., 2001. Proteoglycan-induced changes in
T1rho-relaxation of articular cartilage at 4T. Magn Reson Med 46, 419-423.
Amenta, F., Tayebati, S.K., Tomassoni, D., 2010. Spontaneously hypertensive rat
neuroanatomy: applications to pharmacological research. Ital J Anat Embryol
115, 13-17.
Antoniou, J., Steffen, T., Nelson, F., Winterbottom, N., Hollander, A.P., Poole, R.A.,
Aebi, M., Alini, M., 1996. The human lumbar intervertebral disc: evidence
for changes in the biosynthesis and denaturation of the extracellular matrix
with growth, maturation, ageing, and degeneration. Journal Of Clinical

120
Investigation 98, 996-1003.
Aronen, H.J., Ramadan, U.A., Peltonen, T.K., Markkola, A.T., Tanttu, J.I.,
Jaaskelainen, J., Hakkinen, A.M., Sepponen, R., 1999. 3D spin-lock imaging
of human gliomas. Magnetic Resonance Imaging 17, 1001-1010.
Arthur, M.J., 2002. Reversibility of liver fibrosis and cirrhosis following treatment for
hepatitis C. Gastroenterology 122, 1525-1528.
Asadullah, K., Sterry, W., Volk, H.D., 2003. Interleukin-10 therapy--review of a new
approach. Pharmacological Reviews 55, 241-269.
Auerbach, J.D., Johannessen, W., Borthakur, A., Wheaton, A.J., Dolinskas, C.A.,
Balderston, R.A., Reddy, R., Elliott, D.M., 2006. In vivo quantification of
human lumbar disc degeneration using T(1rho)-weighted magnetic resonance
imaging. European Spine Journal 15 Suppl 3, S338-S344.
Bendel, P., Eilam, R., 1992. Quantitation of ventricular size in normal and
spontaneously hypertensive rats by magnetic resonance imaging. Brain
Research 574, 224-228.
Blumenkrantz, G., Li, X., Han, E.T., Newitt, D.C., Crane, J.C., Link, T.M., Majumdar,
S., 2006. A feasibility study of in vivo T1rho imaging of the intervertebral
disc. Magnetic Resonance Imaging 24, 1001-1007.
Blumenkrantz, G., Zuo, J., Li, X., Kornak, J., Link, T.M., Majumdar, S., 2010. In vivo

121
3.0-tesla magnetic resonance T1rho and T2 relaxation mapping in subjects
with intervertebral disc degeneration and clinical symptoms. Magn Reson
Med 63, 1193-1200.
Bonekamp, S., Kamel, I., Solga, S., Clark, J., 2009. Can imaging modalities diagnose
and stage hepatic fibrosis and cirrhosis accurately? Journal Of Hepatology 50,
17-35.
Borenstein, D.G., O'Mara, J.J., Boden, S.D., Lauerman, W.C., Jacobson, A.,
Platenberg, C., Schellinger, D., Wiesel, S.W., 2001. The value of magnetic
resonance imaging of the lumbar spine to predict low-back pain in
asymptomatic subjects : a seven-year follow-up study. Journal Of Bone And
Joint Surgery-American Volume 83-A, 1306-1311.
Borthakur, A., Gur, T., Wheaton, A.J., Corbo, M., Trojanowski, J.Q., Lee, V.M.,
Reddy, R., 2006. In vivo measurement of plaque burden in a mouse model of
Alzheimer's disease. Journal Of Magnetic Resonance Imaging 24,
1011-1017.
Borthakur, A., Maurer, P.M., Fenty, M., Wang, C., Berger, R., Yoder, J., Balderston,
R.A., Elliott, D.M., 2011. T1rho magnetic resonance imaging and
discography pressure as novel biomarkers for disc degeneration and low back
pain. Spine (Phila Pa 1976) 36, 2190-2196.

122
Borthakur, A., Sochor, M., Davatzikos, C., Trojanowski, J.Q., Clark, C.M., 2008.
T1rho MRI of Alzheimer's disease. Neuroimage 41, 1199-1205.
Borthakur, A., Wheaton, A.J., Gougoutas, A.J., Akella, S.V., Regatte, R.R.,
Charagundla, S.R., Reddy, R., 2004. In vivo measurement of T1rho
dispersion in the human brain at 1.5 tesla. Journal Of Magnetic Resonance
Imaging 19, 403-409.
Bravo, A.A., Sheth, S.G., Chopra, S., 2001. Liver biopsy. N Engl J Med 344,
495-500.
Carl, A., Ledet, E., Yuan, H., Sharan, A., 2004. New developments in nucleus
pulposus replacement technology. Spine J 4, 325S-329S.
Cassinelli, E.H., Hall, R.A., Kang, J.D., 2001. Biochemistry of intervertebral disc
degeneration and the potential for gene therapy applications. Spine J 1,
205-214.
Charagundla, S.R., Borthakur, A., Leigh, J.S., Reddy, R., 2003. Artifacts in
T(1rho)-weighted imaging: correction with a self-compensating spin-locking
pulse. Journal Of Magnetic Resonance 162, 113-121.
Charagundla, S.R., Stolpen, A.H., Leigh, J.S., Reddy, R., 1998. Off-resonance proton
T1rho dispersion imaging of 17O-enriched tissue phantoms. Magn Reson
Med 39, 588-595.
123
Charlton, M., 2004. Nonalcoholic fatty liver disease: a review of current
understanding and future impact. Clin Gastroenterol Hepatol 2, 1048-1058.
Chen, F., Sun, X., De Keyzer, F., Yu, J., Peeters, R., Coudyzer, W., Vandecaveye, V.,
Landuyt, W., Bosmans, H., Van Hecke, P., Marchal, G., Ni, Y., 2006. Liver
tumor model with implanted rhabdomyosarcoma in rats: MR imaging,
microangiography, and histopathologic analysis. Radiology 239, 554-562.
Cheung, J.S., Fan, S.J., Gao, D.S., Chow, A.M., Man, K., Wu, E.X., 2010. Diffusion
tensor imaging of liver fibrosis in an experimental model. Journal Of
Magnetic Resonance Imaging 32, 1141-1148.
Chiu, E.J., Newitt, D.C., Segal, M.R., Hu, S.S., Lotz, J.C., Majumdar, S., 2001.
Magnetic resonance imaging measurement of relaxation and water diffusion
in the human lumbar intervertebral disc under compression in vitro. Spine
(Phila Pa 1976) 26, E437-E444.
Collins, C.M., Li, S., Smith, M.B., 1998. SAR and B1 field distributions in a
heterogeneous human head model within a birdcage coil. Specific energy
absorption rate. Magn Reson Med 40, 847-856.
Constandinou, C., Henderson, N., Iredale, J.P., 2005. Modeling liver fibrosis in
rodents. Methods Mol Med 117, 237-250.
Davis, G.L., Albright, J.E., Cook, S.F., Rosenberg, D.M., 2003. Projecting future

124
complications of chronic hepatitis C in the United States. Liver Transpl 9,
331-338.
Dixon, W.T., Oshinski, J.N., Trudeau, J.D., Arnold, B.C., Pettigrew, R.I., 1996.
Myocardial suppression in vivo by spin locking with composite pulses. Magn
Reson Med 36, 90-94.
Duvvuri, U., Goldberg, A.D., Kranz, J.K., Hoang, L., Reddy, R., Wehrli, F.W., Wand,
A.J., Englander, S.W., Leigh, J.S., 2001. Water magnetic relaxation
dispersion in biological systems: the contribution of proton exchange and
implications for the noninvasive detection of cartilage degradation. Proc Natl
Acad Sci U S A 98, 12479-12484.
Fleiss, J., 1986. Reliability of measurement: the design and analysis of clinical
experiments. John Wiley & Sons, New York, NY.
Fleysher, R., Fleysher, L., Gonen, O., 2008. The optimal MR acquisition strategy for
exponential decay constants estimation. Magnetic Resonance Imaging 26,
433-435.
Friedman, S.L., 2008. Hepatic fibrosis -- overview. Toxicology 254, 120-129.
Griffith, J.F., Wang, Y.X., Antonio, G.E., Choi, K.C., Yu, A., Ahuja, A.T., Leung,
P.C., 2007. Modified Pfirrmann grading system for lumbar intervertebral
disc degeneration. Spine (Phila Pa 1976) 32, E708-E712.
125
Halavaara, J.T., Sepponen, R.E., Lamminen, A.E., Vehmas, T., Bondestam, S., 1998.
Spin lock and magnetization transfer MR imaging of local liver lesions.
Magnetic Resonance Imaging 16, 359-364.
Hammel, P., Couvelard, A., O'Toole, D., Ratouis, A., Sauvanet, A., Flejou, J.F.,
Degott, C., Belghiti, J., Bernades, P., Valla, D., Ruszniewski, P., Levy, P.,
2001. Regression of liver fibrosis after biliary drainage in patients with
chronic pancreatitis and stenosis of the common bile duct. N Engl J Med 344,
418-423.
Haris, M., McArdle, E., Fenty, M., Singh, A., Davatzikos, C., Trojanowski, J.Q.,
Melhem, E.R., Clark, C.M., Borthakur, A., 2009a. Early marker for
Alzheimer's disease: hippocampus T1rho (T(1rho)) estimation. Journal Of
Magnetic Resonance Imaging 29, 1008-1012.
Haris, M., McArdle, E., Fenty, M., Singh, A., Davatzikos, C., Trojanowski, J.Q.,
Melhem, E.R., Clark, C.M., Borthakur, A., 2009b. Early marker for
Alzheimer's disease: hippocampus T1rho (T(1rho)) estimation. Journal Of
Magnetic Resonance Imaging 29, 1008-1012.
Haris, M., Singh, A., Cai, K., Davatzikos, C., Trojanowski, J.Q., Melhem, E.R., Clark,
C.M., Borthakur, A., 2011a. T1rho (T1rho) MR imaging in Alzheimer's
disease and Parkinson's disease with and without dementia. Journal Of

126
Neurology 258, 380-385.
Haris, M., Singh, A., Cai, K., McArdle, E., Fenty, M., Davatzikos, C., Trojanowski,
J.Q., Melhem, E.R., Clark, C.M., Borthakur, A., 2011b. T(1rho) MRI in
Alzheimer's disease: detection of pathological changes in medial temporal
lobe. Journal Of Neuroimaging 21, e86-e90.
Hassett, G., Hart, D.J., Manek, N.J., Doyle, D.V., Spector, T.D., 2003. Risk factors
for progression of lumbar spine disc degeneration: the Chingford Study.
Arthritis Rheum 48, 3112-3117.
Hazle, J.D., Narayana, P.A., Dunsford, H.A., 1990. Chronic carbon tetrachloride and
phospholipase D hepatotoxicity in rat: in vivo 1H magnetic resonance, total
lipid analysis, and histology. Magn Reson Med 15, 211-228.
Heiland, S., Sartor, K., Martin, E., Bardenheuer, H.J., Plaschke, K., 2002. In vivo
monitoring of age-related changes in rat brain using quantitative diffusion
magnetic resonance imaging and magnetic resonance relaxometry.
Neuroscience Letters 334, 157-160.
Huang, Y.H., Shi, M.N., Zheng, W.D., Zhang, L.J., Chen, Z.X., Wang, X.Z., 2006.
Therapeutic effect of interleukin-10 on CCl4-induced hepatic fibrosis in rats.
World J Gastroenterol 12, 1386-1391.
Hughes, E.J., Bond, J., Svrckova, P., Makropoulos, A., Ball, G., Sharp, D.J., Edwards,

127
A.D., Hajnal, J.V., Counsell, S.J., 2012. Regional changes in thalamic shape
and volume with increasing age. Neuroimage 63, 1134-1142.
Hulvershorn, J., Borthakur, A., Bloy, L., Gualtieri, E.E., Reddy, R., Leigh, J.S., Elliott,
M.A., 2005. T1rho contrast in functional magnetic resonance imaging. Magn
Reson Med 54, 1155-1162.
Iredale, J.P., 2007. Models of liver fibrosis: exploring the dynamic nature of
inflammation and repair in a solid organ. Journal Of Clinical Investigation
117, 539-548.
Janes, C.H., Lindor, K.D., 1993. Outcome of patients hospitalized for complications
after outpatient liver biopsy. Annals Of Internal Medicine 118, 96-98.
Johannessen, W., Auerbach, J.D., Wheaton, A.J., Kurji, A., Borthakur, A., Reddy, R.,
Elliott, D.M., 2006. Assessment of human disc degeneration and
proteoglycan content using T1rho-weighted magnetic resonance imaging.
Spine (Phila Pa 1976) 31, 1253-1257.
Jokivarsi, K.T., Hiltunen, Y., Grohn, H., Tuunanen, P., Grohn, O.H., Kauppinen, R.A.,
2010. Estimation of the onset time of cerebral ischemia using T1rho and T2
MRI in rats. Stroke 41, 2335-2340.
Kerttula, L., Kurunlahti, M., Jauhiainen, J., Koivula, A., Oikarinen, J., Tervonen, O.,
2001. Apparent diffusion coefficients and T2 relaxation time measurements

128
to evaluate disc degeneration. A quantitative MR study of young patients
with previous vertebral fracture. Acta Radiologica 42, 585-591.
Knox, C.A., Yates, R.D., Chen, I., Klara, P.M., 1980. Effects of aging on the
structural and permeability characteristics of cerebrovasculature in
normotensive and hypertensive strains of rats. Acta Neuropathologica 51,
1-13.
Krueger, E.C., Perry, J.O., Wu, Y., Haughton, V.M., 2007. Changes in T2 relaxation
times associated with maturation of the human intervertebral disk. AJNR Am
J Neuroradiol 28, 1237-1241.
Lee, T.H., Liu, H.L., Yang, S.T., Yang, J.T., Yeh, M.Y., Lin, J.R., 2011. Effects of
aging and hypertension on cerebral ischemic susceptibility: evidenced by
MR diffusion-perfusion study in rat. Experimental Neurology 227, 314-321.
Li, X., Han, E.T., Busse, R.F., Majumdar, S., 2008. In vivo T(1rho) mapping in
cartilage using 3D magnetization-prepared angle-modulated partitioned
k-space spoiled gradient echo snapshots (3D MAPSS). Magn Reson Med 59,
298-307.
Makela, H.I., Grohn, O.H., Kettunen, M.I., Kauppinen, R.A., 2001. Proton exchange
as a relaxation mechanism for T1 in the rotating frame in native and
immobilized protein solutions. Biochem Biophys Res Commun 289,

129
813-818.
Marinelli, N.L., Haughton, V.M., Munoz, A., Anderson, P.A., 2009. T2 relaxation
times of intervertebral disc tissue correlated with water content and
proteoglycan content. Spine (Phila Pa 1976) 34, 520-524.
Markkola, A.T., Aronen, H.J., Paavonen, T., Hopsu, E., Sipila, L.M., Tanttu, J.I.,
Sepponen, R.E., 1996. Spin lock and magnetization transfer imaging of head
and neck tumors. Radiology 200, 369-375.
McCommis, K.S., He, X., Abendschein, D.R., Gupte, P.M., Gropler, R.J., Zheng, J.,
2010. Cardiac 17O MRI: toward direct quantification of myocardial oxygen
consumption. Magn Reson Med 63, 1442-1447.
Modic, M.T., Ross, J.S., 2007. Lumbar degenerative disk disease. Radiology 245,
43-61.
Muthupillai, R., Flamm, S.D., Wilson, J.M., Pettigrew, R.I., Dixon, W.T., 2004.
Acute myocardial infarction: tissue characterization with T1rho-weighted
MR imaging--initial experience. Radiology 232, 606-610.
Napoleone, P., Ferrante, F., Ghirardi, O., Ramacci, M.T., Amenta, F., 1990.
Age-dependent nerve cell loss in the brain of Sprague-Dawley rats: effect of
long term acetyl-L-carnitine treatment. Arch Gerontol Geriatr 10, 173-185.
Nestrasil, I., Michaeli, S., Liimatainen, T., Rydeen, C.E., Kotz, C.M., Nixon, J.P.,

130
Hanson, T., Tuite, P.J., 2010a. T1rho and T2rho MRI in the evaluation of
Parkinson's disease. Journal Of Neurology 257, 964-968.
Nestrasil, I., Michaeli, S., Liimatainen, T., Rydeen, C.E., Kotz, C.M., Nixon, J.P.,
Hanson, T., Tuite, P.J., 2010b. T1rho and T2rho MRI in the evaluation of
Parkinson's disease. Journal Of Neurology 257, 964-968.
Nguyen, A.M., Johannessen, W., Yoder, J.H., Wheaton, A.J., Vresilovic, E.J.,
Borthakur, A., Elliott, D.M., 2008. Noninvasive quantification of human
nucleus pulposus pressure with use of T1rho-weighted magnetic resonance
imaging. Journal Of Bone And Joint Surgery-American Volume 90, 796-802.
Nishioka, H., Hirose, J., Nakamura, E., Oniki, Y., Takada, K., Yamashita, Y., Mizuta,
H., 2012. T1rho and T2 mapping reveal the in vivo extracellular matrix of
articular cartilage. Journal Of Magnetic Resonance Imaging 35, 147-155.
Oh, M.K., Winn, J., Poordad, F., 2008. Review article: diagnosis and treatment of
non-alcoholic fatty liver disease. Aliment Pharmacol Ther 28, 503-522.
Perry, J., Haughton, V., Anderson, P.A., Wu, Y., Fine, J., Mistretta, C., 2006. The
value of T2 relaxation times to characterize lumbar intervertebral disks:
preliminary results. AJNR Am J Neuroradiol 27, 337-342.
Peterson, C.K., Bolton, J.E., Wood, A.R., 2000. A cross-sectional study correlating
lumbar spine degeneration with disability and pain. Spine (Phila Pa 1976) 25,

131
218-223.
Pfirrmann, C.W., Metzdorf, A., Zanetti, M., Hodler, J., Boos, N., 2001. Magnetic
resonance classification of lumbar intervertebral disc degeneration. Spine
(Phila Pa 1976) 26, 1873-1878.
Phillips, F.M., An, H., Kang, J.D., Boden, S.D., Weinstein, J., 2003. Biologic
treatment for intervertebral disc degeneration: summary statement. Spine
(Phila Pa 1976) 28, S99.
Poniachik, J., Bernstein, D.E., Reddy, K.R., Jeffers, L.J., Coelho-Little, M.E.,
Civantos, F., Schiff, E.R., 1996. The role of laparoscopy in the diagnosis of
cirrhosis. Gastrointestinal Endoscopy 43, 568-571.
Poptani, H., Duvvuri, U., Miller, C.G., Mancuso, A., Charagundla, S., Fraser, N.W.,
Glickson, J.D., Leigh, J.S., Reddy, R., 2001. T1rho imaging of murine brain
tumors at 4 T. Academic Radiology 8, 42-47.
Proctor, E., Chatamra, K., 1983. Controlled induction of cirrhosis in the rat. Br J Exp
Pathol 64, 320-330.
Ratziu, V., Charlotte, F., Heurtier, A., Gombert, S., Giral, P., Bruckert, E., Grimaldi,
A., Capron, F., Poynard, T., 2005. Sampling variability of liver biopsy in
nonalcoholic fatty liver disease. Gastroenterology 128, 1898-1906.
Regatte, R.R., Akella, S.V., Lonner, J.H., Kneeland, J.B., Reddy, R., 2006. T1rho

132
relaxation mapping in human osteoarthritis (OA) cartilage: comparison of
T1rho with T2. Journal Of Magnetic Resonance Imaging 23, 547-553.
Salameh, N., Larrat, B., Abarca-Quinones, J., Pallu, S., Dorvillius, M., Leclercq, I.,
Fink, M., Sinkus, R., Van Beers, B.E., 2009. Early detection of
steatohepatitis in fatty rat liver by using MR elastography. Radiology 253,
90-97.
Santyr, G.E., Fairbanks, E.J., Kelcz, F., Sorenson, J.A., 1994. Off-resonance spin
locking for MR imaging. Magn Reson Med 32, 43-51.
Santyr, G.E., Henkelman, R.M., Bronskill, M.J., 1989. Spin locking for magnetic
resonance imaging with application to human breast. Magn Reson Med 12,
25-37.
Sirlin, C.B., 2011. Science to practice: Can T1rho imaging be used to diagnose and
assess the severity of hepatic fibrosis? Radiology 259, 619-620.
Solomon, I., 1959. Rotary spin echoes. Physical Review Letters, 301-302.
Szyperski, T., Luginbuhl, P., Otting, G., Guntert, P., Wuthrich, K., 1993. Protein
dynamics studied by rotating frame 15N spin relaxation times. Journal Of
Biomolecular Nmr 3, 151-164.
Tailor, D.R., Baumgardner, J.E., Regatte, R.R., Leigh, J.S., Reddy, R., 2004. Proton
MRI of metabolically produced H2 17O using an efficient 17O2 delivery
133
system. Neuroimage 22, 611-618.
Tailor, D.R., Roy, A., Regatte, R.R., Charagundla, S.R., McLaughlin, A.C., Leigh,
J.S., Reddy, R., 2003. Indirect 17(O)-magnetic resonance imaging of cerebral
blood flow in the rat. Magn Reson Med 49, 479-487.
Talwalkar, J.A., Yin, M., Fidler, J.L., Sanderson, S.O., Kamath, P.S., Ehman, R.L.,
2008. Magnetic resonance imaging of hepatic fibrosis: emerging clinical
applications. Hepatology 47, 332-342.
Tomassoni, D., Bramanti, V., Amenta, F., 2010. Expression of aquaporins 1 and 4 in
the brain of spontaneously hypertensive rats. Brain Research 1325, 155-163.
Tsukamoto, H., Matsuoka, M., French, S.W., 1990. Experimental models of hepatic
fibrosis: a review. Seminars In Liver Disease 10, 56-65.
Tsushima, H., Okazaki, K., Takayama, Y., Hatakenaka, M., Honda, H., Izawa, T.,
Nakashima, Y., Yamada, H., Iwamoto, Y., 2011. Evaluation of cartilage
degradation in arthritis using T1rho magnetic resonance imaging mapping.
Rheumatology International.
Vadala, G., Sowa, G.A., Kang, J.D., 2007. Gene therapy for disc degeneration. Expert
Opin Biol Ther 7, 185-196.
van Zijl, P.C., Yadav, N.N., 2011. Chemical exchange saturation transfer (CEST):
what is in a name and what isn't? Magn Reson Med 65, 927-948.

134
Veldhuijzen, I.K., Toy, M., Hahne, S.J., De Wit, G.A., Schalm, S.W., de Man, R.A.,
Richardus, J.H., 2010. Screening and early treatment of migrants for chronic
hepatitis B virus infection is cost-effective. Gastroenterology 138, 522-530.
Videman, T., Battie, M.C., Gibbons, L.E., Maravilla, K., Manninen, H., Kaprio, J.,
2003. Associations between back pain history and lumbar MRI findings.
Spine (Phila Pa 1976) 28, 582-588.
Wallace, K., Burt, A.D., Wright, M.C., 2008. Liver fibrosis. Biochemical Journal 411,
1-18.
Wang, H., Li, J., Chen, F., De Keyzer, F., Yu, J., Feng, Y., Nuyts, J., Marchal, G., Ni,
Y., 2010. Morphological, functional and metabolic imaging biomarkers:
assessment of vascular-disrupting effect on rodent liver tumours. European
Radiology 20, 2013-2026.
Wang, Y.X., 2005. Medical imaging in pharmaceutical clinical trials: what
radiologists should know. Clinical Radiology 60, 1051-1057.
Wang, Y.X., Griffith, J.F., 2010. Effect of menopause on lumbar disk degeneration:
potential etiology. Radiology 257, 318-320.
Wang, Y.X., Griffith, J.F., Ma, H.T., Kwok, A.W., Leung, J.C., Yeung, D.K., Ahuja,
A.T., Leung, P.C., 2011b. Relationship between gender, bone mineral
density, and disc degeneration in the lumbar spine: a study in elderly subjects

135
using an eight-level MRI-based disc degeneration grading system.
Osteoporos Int 22, 91-96.
Wang, Y.X., Kwok, A.W., Griffith, J.F., Leung, J.C., Ma, H.T., Ahuja, A.T., Leung,
P.C., 2011c. Relationship between hip bone mineral density and lumbar disc
degeneration: a study in elderly subjects using an eight-level MRI-based disc
degeneration grading system. Journal Of Magnetic Resonance Imaging 33,
916-920.
Wang, Y.X., Yan, S.X., 2008. Biomedical imaging in the safety evaluation of new
drugs. Lab Anim 42, 433-441.
Wang, Y.X., Yuan, J., Chu, E.S., Go, M.Y., Huang, H., Ahuja, A.T., Sung, J.J., Yu, J.,
2011a. T1rho MR imaging is sensitive to evaluate liver fibrosis: an
experimental study in a rat biliary duct ligation model. Radiology 259,
712-719.
Wang, Y.X., Yuan, J., Chu, E.S., Go, M.Y., Huang, H., Ahuja, A.T., Sung, J.J., Yu, J.,
2011d. T1rho MR imaging is sensitive to evaluate liver fibrosis: an
experimental study in a rat biliary duct ligation model. Radiology 259,
712-719.
Wang, Y.X., Zhao, F., Griffith, J.F., Mok, G.S., Leung, J.C., Ahuja, A.T., Yuan, J.,
2013a. T1rho and T2 relaxation times for lumbar disc degeneration: an in

136
vivo comparative study at 3.0-Tesla MRI. European Radiology 23, 228-234.
Wang, Y.X., Zhao, F., Yuan, J., Mok, G.S., Ahuja, A.T., Griffith, J.F., 2013b.
Accelerated T1rho relaxation quantification in intervertebral disc using
limited spin-lock times. Quant Imaging Med Surg 3, 54-58.
Wanless, I.R., Nakashima, E., Sherman, M., 2000. Regression of human cirrhosis.
Morphologic features and the genesis of incomplete septal cirrhosis.
Archives Of Pathology & Laboratory Medicine 124, 1599-1607.
Ward, K.M., Aletras, A.H., Balaban, R.S., 2000. A new class of contrast agents for
MRI based on proton chemical exchange dependent saturation transfer
(CEST). Journal Of Magnetic Resonance 143, 79-87.
Weidenbaum, M., Foster, R.J., Best, B.A., Saed-Nejad, F., Nickoloff, E., Newhouse,
J., Ratcliffe, A., Mow, V.C., 1992. Correlating magnetic resonance imaging
with the biochemical content of the normal human intervertebral disc.
Journal Of Orthopaedic Research 10, 552-561.
Witschey, W.R., Zsido, G.A., Koomalsingh, K., Kondo, N., Minakawa, M., Shuto, T.,
McGarvey, J.R., Levack, M.A., Contijoch, F., Pilla, J.J., Gorman, J.H.,
Gorman, R.C., 2012. In vivo chronic myocardial infarction characterization
by spin locked cardiovascular magnetic resonance. J Cardiovasc Magn Reson
14, 37.

137
Yankner, B.A., Lu, T., Loerch, P., 2008. The aging brain. Annu Rev Pathol 3, 41-66.
Yuan, J., Zhao, F., Griffith, J.F., Chan, Q., Wang, Y.X., 2012. Optimized efficient
liver T(1rho) mapping using limited spin lock times. Physics In Medicine
And Biology 57, 1631-1640.
Zhou, K., Lu, L.G., 2009. Assessment of fibrosis in chronic liver diseases. J Dig Dis
10, 7-14.

138
LIST OF PUBLICATIONS
Journal Publications
1. Zhao F, Wang YX, Yuan J, Deng M, Wong HL, Chu ES, Go MY, Teng GJ, Ahuja
AT, Yu J. MR T1ρ as an imaging biomarker for monitoring liver injury progression
and regression: an experimental study in rats with carbon tetrachloride intoxication.
Eur Radiol. 2012; 22(8):1709-16.
2. Zhao F, Deng M, Yuan J, Teng GJ, Ahuja AT, Wang YX. Experimental evaluation
of accelerated t1rho relaxation quantification in human liver using limited
spin-lock times. Korean J Radiol. 2012;13(6):736-42.
3. Deng M, Zhao F^, Yuan J, Ahuja AT, Wang YX. Liver T1ρ MRI measurement in
healthy human subjects at 3 T: a preliminary study with a two-dimensional
fast-field echo sequence. Br J Radiol. 2012;85(1017): e590-5. (^:Co-first author).
4. Zhao F, Yan SX, Wang GF, Wang J, Lu PX, Chen B, Yuan J, Zhang SZ, Wang YX.
CT features of focal organizing pneumonia: An analysis of consecutive
histopathologically confirmed 45 cases. Euro J Radiol. 2013,
http://dx.doi.org/10.1016/j.ejrad.2013.04.017
5. Zhao F, Lu PX, Yan SX, Wang GF, Yuan J, Zhang SZ, Wang YX. CT and MR
features of xanthogranulomatous cholecystitis: An analysis of consecutive 49 cases.

139
Euro J Radiol. 2013, http://dx.doi.org/10.1016/j.ejrad.2013.04.026
6. Wang YX, Zhao F, Griffith JF, Mok GS, Leung JC, Ahuja AT, Yuan J. T1rho and
T2 relaxation times for lumbar disc degeneration: an in vivo comparative study at
3.0-Tesla MRI. Eur Radiol. 2013;23(1):228-34.
7. Yuan J, Zhao F, Griffith JF, Chan Q, Wang YX. Optimized efficient liver T(1ρ)
mapping using limited spin lock times. Phys Med Biol. 2012;57(6):1631-40.
8. Yuan J, Zhao F, Chan Q, Wang YX. Observation of bi-exponential T1ρ relaxation
of in-vivo rat muscles at 3T. Acta Radiol. 2012;53(6):675-81.
9. Yuan J, Li Y, Zhao F, Chan Q, Ahuja AT, Wang YX. Quantification of T(1ρ)
relaxation by using rotary echo spin-lock pulses in the presence of B(0)
inhomogeneity. Phys Med Biol. 2012;57(15):5003-5016.
10. Shi L, Wang YX, Yu C, Zhao F, Kuang PD, Shao GL. CT and ultrasound features
of basal cell adenoma of the parotid gland: a report of 22 cases with pathologic
correlation. AJNR Am J Neuroradiol. 2012;33(3):434-8.
11. Zhu XM, Wang YX, Leung KCF, Lee SF, Zhao F, Wang DW, Lai JMY, Wan C,
Cheng CHK, Ahuja AT Enhanced cellular uptake of aminosilane-coated
superparamagnetic iron oxide nanoparticles in mammalian cell lines. International
Journal of Nanomedicine 2012:7 953–964.
12. Wang Y, Li L, Wang YX, Feng XL, Zhao F, Zou SM, Hao YZ, Ying JM, Zhou

140
CW. Ultrasound Findings of Papillary Thyroid Microcarcinoma: A Review of 113
Consecutive Cases with Histopathologic Correlation. Ultrasound Med Biol.
2012;38(10):1681-8.
13. Zhang L, Yu WH, Wang YX, Wang C, Zhao F, Qi W, Chan WM, Huang Y, Wai
MS, Dong J, Yew DT. DL-3-N-Butylphthalide, an Anti-Oxidant Agent, Prevents
Neurological Deficits and Cerebral Injury Following Stroke per Functional
Analysis, Magnetic Resonance Imaging and Histological Assessment. Curr
Neurovasc Res. 2012;9(3):167-75.
14. Dai XJ, Gong HH, Wang YX, Zhou FQ, Min YJ, Zhao F, Wang SY, Liu BX, Xiao
XZ. Gender differences in brain regional homogeneity of healthy subjects after
normal sleep and after sleep deprivation: a resting-state fMRI study. Sleep Med.
2012;13(6):720-7.
Conference Proceedings
1. Feng Zhao, Li-Hong Zhang, Jing Yuan, Queenie Chan, David Yew, and Yi-Xiang
Wang. T1rho measurement in rat brain tissue changes associated with aging and
chronic hypertension, 21st ISMRM, 2013. 2875.
2.Feng Zhao, Jing Yuan, Min Deng, and Yi-Xiang Wang. Further exploration of MRI
techniques for liver T1rho quantification. 21st ISMRM, 2013. 4092.
3. Feng Zhao, Jing Yuan, Domily Ting Yi Lau, David Ka Kwai Yeung, Yi-Xiang J

141
Wang, Anil T Ahuja, James F Griffith. Small field-of-view high-resolution MR
imaging of talar dome at 3T: A comparison of 2D TSE and SSFP sequences, 1st
ICMRI & 18th KSMRM,2013.
4.Feng Zhao, Jing Yuan, Jiu Tian, Gang Lu, and Wai Sang Poon , Yi-Xiang Wang. A
longitudinal study on age-related changes of T1rho relaxation in rat brain, 20th
ISMRM, 2012. 0453. (MAGA)
5.Feng Zhao, Min Deng, Jing Yuan, Jun Yu, Yi-Xiang Wang.T1rho MR imaging for
rat liver with carbon tetrachloride intoxication: a time course study, 20th ISMRM,
2012. 0690.
6.Feng Zhao, Li-Hong Zhang, Jing Yuan, Queenie Chan, David Yew, Yi-Xiang Wang.
A comparative study of brain regional T1rho values of spontaneously hypertensive
rat and Wistar Kyoto rat, 20th ISMRM, 2012. 0347.
7.Feng Zhao, Hong-Jian He, Xiao-jing Yu, Yi-Xiang Wang, Shi-Zheng Zhang.
Imaginary toe-tapping causes classic motor hand area activation in bilateral upper
limb amputees,19th ISMRM, 2011. 3647.
8. Li Y, Zhao F, Wang YX, Ahuja AT, Yuan J. Study of magnetization evolution by
using composite spin-lock pulses for T(1ρ) imaging. Conf Proc IEEE Eng Med
Biol Soc. 2012 Aug;2012:408-11. doi: 10.1109/EMBC.2012.6345954.
9. Wang Yi-Xiang, Zhao Feng, Griffith James F., Mok Greta SP, Chan Queenie, Yuan

142
Jing. An In Vivo Comparative Study of T1rho and T2 Relaxation Times for
Evaluation of Lumber Disc Degeneration at 3.0 Tesla MRI, 20th ISMRM, 2012.
0354.
10.Wang, Yi-Xiang; Zhao, Feng; Wong, Vincent Wai Sun; Yuan, Jing; Kwong, Kin
Ming; Chan, Henry Lik Yuen. Liver MR T1rho Measurement in Liver Cirrhosis
Patients: A Preliminary Study with a 2D Fast Field Echo Sequence at 3T. 20th
ISMRM, 2012. 0213.
11.Pu-Xuan Lu, Feng Zhao, Jing Yuan, Greta SP Mok, James F Griffith, and
Yi-Xiang Wang. Accelerated T1rho relaxation quantification in intervertebral disc
using limited spin-lock times, 21st ISMRM, 2013. 3476.
12.Yuan Jing, Liang Dong, Zhao Feng, Li Yujia, Wang Yi-Xiang J., Ying Leslie. k-T
ISD Compressed Sensing Reconstruction for T1ñ Mapping: A Study in Rat Brains
at 3T. 20th ISMRM, 2012. 0939.
13.Pu-Xuan Lu, Hua Huang, Jing Yuan, Feng Zhao, and Yi-Xiang Wang. Intravoxel
Incoherent Motion MR Imaging showed lower pure molecular diffusion in fibrotic
livers: a report of preliminary results, 21st ISMRM, 2013. 4081.
14.Zhu Xiao-Ming, Leung Ken Cham-Fai, Lee Siu-Fung, Wang Da-Wei, Zhao Feng,
Lai Josie M. Y., Wan Chao, Cheng Christopher H. K., Wang Yi-Xiang. Enhanced
Cellular Uptake of Aminosilane Coated Superparamagnetic Iron Oxide

143
Nanoparticles in Mammalian Cell Lines, 20th ISMRM, 2012. 0641.
Top Related