


Languages
Pages
Legal


Supply Chain Videocast
Operations Rules 2012
Part 3: Managing Complexity Through Long Tail Analysis

Operations Rules 2012 3-Part Videocast Series
Part 1: Mitigating Supply Chain Risk/New
Risk Exposure Index
• Now Available On-Demand
Part 2: Supply Chain Segmentation for
Improved Profitability
• Now Available On-Demand
Part 3: Managing Complexity through
Long Tail Analysis
On-Demand Videocasts at www.scdigest.com/supply_chain_videocasts.php

Complexity Management: Long Tail
Analysis
David Simchi-Levi
E-mail: [email protected]
Professor, Massachusetts
Institute of Technology

Supply
Sources: plants vendors ports
Regional Warehouses: stocking points
Field Warehouses: stocking points
Customers, demand centers sinks
Production/ purchase costs
Inventory & warehousing costs
Transportation costs
Inventory & warehousing costs
Transportation costs
©Copyright 2012 D. Simchi-Levi 5

Supply Produce Distribute Sell
Plan/Design
Source
•Product Architecture
•Make/Buy
•Early Supplier Involvement
•Strategic Partnerships
•Suppliers Selection
•Supply Contracts
Fulfillment Supply Chain
Develo
pm
en
t Su
pp
ly C
hain
The Enterprise Fulfillment and Development Supply Chains
©Copyright 2012 D. Simchi-Levi 6

Complexity and its Challenges • Development Supply chain
– Hundreds of products
– Thousands of suppliers
• Fulfillment Supply chain – Multiple channels
– Customers in different regions
– Different packaging and labeling
– Many facilities
• The impact of complexity – Forecast accuracy
– Service level
– Inventory levels
– Cost (set-ups, inventory, …) and margins
©Copyright 2012 D. Simchi-Levi 7

Complexity and its Challenges • Development Supply chain
– Hundreds of products
– Thousands of suppliers
• Fulfillment Supply chain – Multiple channels
– Customers in different regions
– Different packaging and labeling
– Many facilities
• The impact of complexity – Forecast accuracy
– Service level
– Inventory levels
– Cost (set-ups, inventory, …) and margins
Our objective is to understand the hidden cost of complexity
and identify effective ways to manage it
©Copyright 2012 D. Simchi-Levi 8

9
What We’ll Cover …
• The Curse of Variability
Drivers and Impact
• Matching Products and Strategies
Push-Pull Supply Chains
• Complexity Management
The Long Tail Approach
• Summary

©Copyright 2012 D. Simchi-Levi
Demand variability & uncertainty complicate
operations and supply chain strategy and planning
Retail sales versus Orders to PC Manufacturers
The Bullwhip Effect:
• Order Variability is amplified up the supply chain
• Upstream echelons face higher variability
10

©Copyright 2012 D. Simchi-Levi
What are the Causes….
• Promotional sales
• Volume and Transportation Discounts
• Inflated orders
• Demand Forecast
• Long cycle times
• Lack of visibility
11

Consequences….
• Increased safety stock
• Reduced service level
• Inefficient allocation of resources
• Increased transportation costs
12 ©Copyright 2012 D. Simchi-Levi

13
What We’ll Cover …
• The Curse of Variability
Drivers and Impact
• Matching Products and Strategies
Push-Pull Supply Chains
• Complexity Management
The Long Tail
• Summary

©Copyright 2012 D. Simchi-Levi
Push-Pull Supply Chains
The Supply Chain Time Line
Low Uncertainty High Uncertainty
Customers Suppliers
PUSH STRATEGY PULL STRATEGY
Push-Pull Boundary
14

©Copyright 2012 D. Simchi-Levi
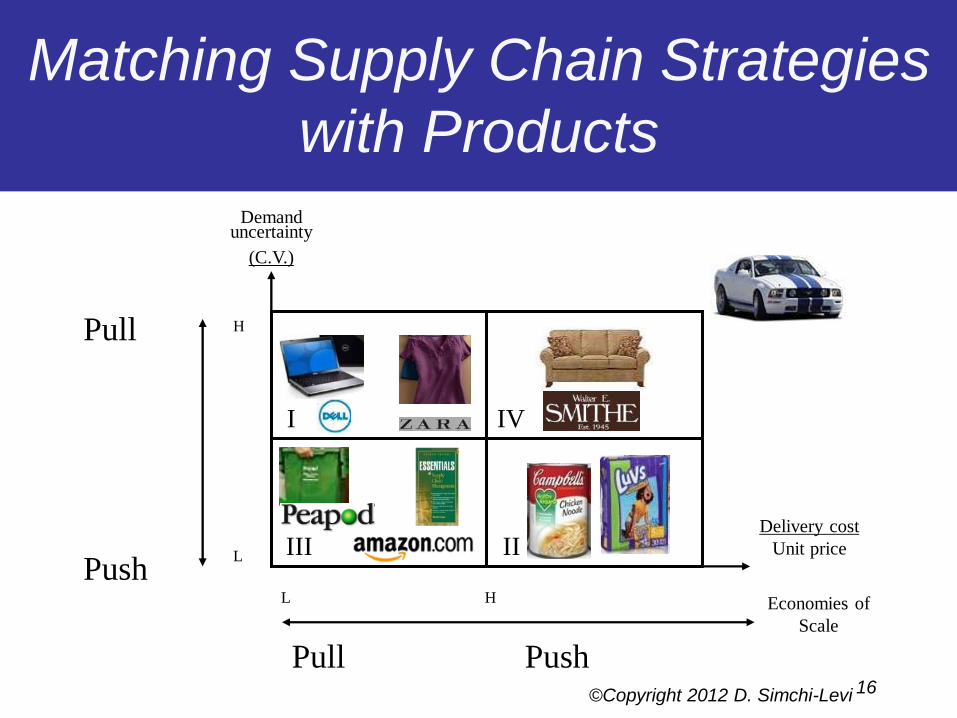
Matching Supply Chain Strategies
with Products
I IV
III II
Demand uncertainty
(C.V.)
Delivery cost
Unit price
L H
H
L
Economies of
Scale
15
Pull Push
Pull
Push
©Copyright 2012 D. Simchi-Levi
Matching Supply Chain Strategies
with Products
I IV
III II
Demand uncertainty
(C.V.)
Delivery cost
Unit price
L H
H
L
Economies of
Scale
16
Pull Push
Pull
Push

©Copyright 2012 D. Simchi-Levi
Matching Supply Chain Strategies
with Products
I IV
III II
Demand uncertainty
(C.V.)
Delivery cost
Unit price
L H
H
L
Economies of
Scale
17
Pull Push
Pull
Push

18
What We’ll Cover …
• The Need to Focus
Drivers and Impact
• Matching Products and Strategies
Supply Chain Segmentation
• Complexity Management
The Long Tail Approach
• Summary

©Copyright 2012 D. Simchi-Levi
Case Study: Steel Manufacturing Company
• Blast Furnace producing slabs – Currently slabs are produced using Make-to-Forecast
– About 300 different articles defined by steel grade, width, weight, etc
• Slabs are shipped to manufacturing facility – Lead time of 8-9 weeks
• Rolling Operations
– Slabs are hot or cold rolled into sheet metal or plates
– Production Processing time is 3-4 weeks
– Make-to-Order operations
Raw Materials
Iron Ore &
Carbon Coke Blast Furnace
Finishing
Cold-rolled
Finishing
Hot-rolled
8-9 weeks
3-4 weeks
End User
Final processing
Rolling
19

The Challenge • Poor forecast accuracy:
During a six-month period, the average absolute relative forecast error (ARFE) was above 240%, while the weighted average ARFE was below 130%
• Low fulfillment accuracy: During the same period of time, fulfillment accuracy was
below 50%
• Higher cost: Instability in the supply chain was driving material,
manufacturing and logistics costs up
©Copyright 2012 D. Simchi-Levi 20

©Copyright 2012 D. Simchi-Levi
The Long Tail: Orders Volume, Variability and Margins
21
(1,000,000)
-
1,000,000
2,000,000
3,000,000
4,000,000
5,000,000
0.00 0.50 1.00 1.50 2.00 2.50
Ave
rage
Mo
nth
ly A
rtic
le V
olu
me
Coefficient of Variation
Coeffecient of Variation for Articles with Average Monthly Volume less than 5MM kg(Bubble size represents the absolute value of variable margin)
Unique Articles

©Copyright 2012 D. Simchi-Levi
The Long Tail: Orders Volume, Variability and Margins
22
(1,000,000)
-
1,000,000
2,000,000
3,000,000
4,000,000
5,000,000
0.00 0.50 1.00 1.50 2.00 2.50
Ave
rage
Mo
nth
ly A
rtic
le V
olu
me
Coefficient of Variation
Coeffecient of Variation for Articles with Average Monthly Volume less than 5MM kg(Bubble size represents the absolute value of variable margin)
Unique Articles
©Copyright 2012 D. Simchi-Levi
(1,000,000)
-
1,000,000
2,000,000
3,000,000
4,000,000
5,000,000
0.00 0.50 1.00 1.50 2.00 2.50
Ave
rage
Mo
nth
ly A
rtic
le V
olu
me
Coefficient of Variation
Coeffecient of Variation for Articles with Average Monthly Volume less than 5MM kg(Bubble size represents the absolute value of variable margin)
Unique Articles
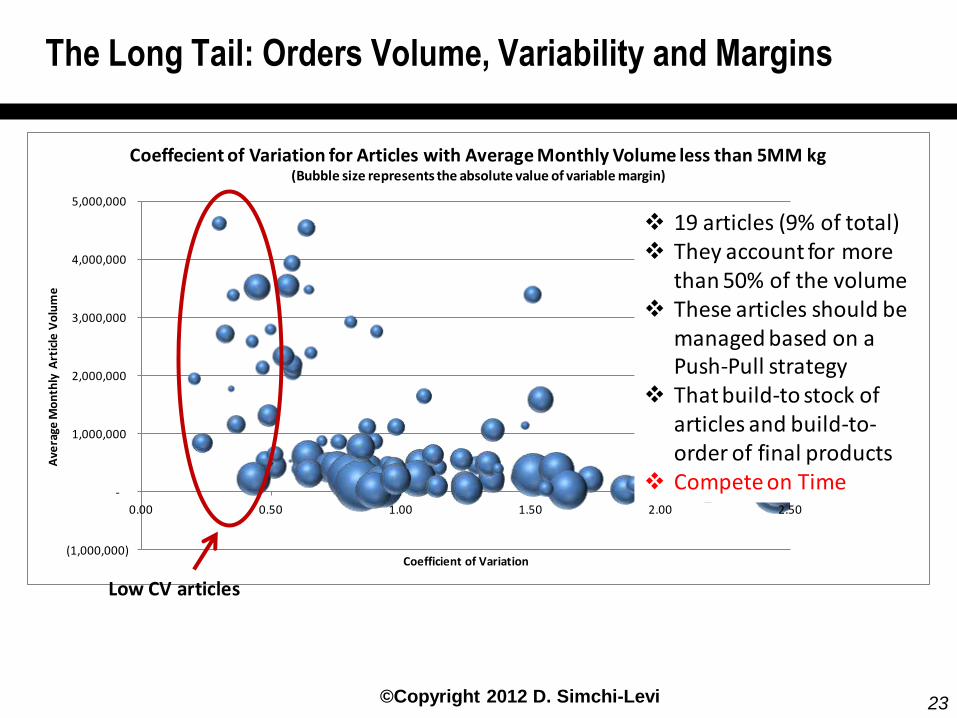
The Long Tail: Orders Volume, Variability and Margins
Low CV articles
23
19 articles (9% of total) They account for more
than 50% of the volume These articles should be
managed based on a Push-Pull strategy
That build-to stock of articles and build-to-order of final products
Compete on Time

©Copyright 2012 D. Simchi-Levi
The Supply Chain Strategy for the High Volume Low/Variability
Articles
Raw Materials
Iron Ore &
Carbon Coke Blast Furnace
Finishing
Cold-rolled
Finishing
Hot-rolled
8-9 weeks
3-4 weeks
End User
Final processing
Rolling
19 articles contributing more than 50% of the volume

©Copyright 2012 D. Simchi-Levi
Raw Materials
Iron Ore &
Carbon Coke Blast Furnace
Finishing
Cold-rolled
Finishing
Hot-rolled
8-9 weeks
3-4 weeks
End User
Final processing
Rolling
PUSH STRATEGY PULL STRATEGY
Push-Pull Boundary
Keep Stock
The Supply Chain Strategy for the High Volume Low/Variability
Articles

©Copyright 2012 D. Simchi-Levi
The Long Tail: Orders Volume, Variability and Margins
26
(1,000,000)
-
1,000,000
2,000,000
3,000,000
4,000,000
5,000,000
0.00 0.50 1.00 1.50 2.00 2.50
Ave
rage
Mo
nth
ly A
rtic
le V
olu
me
Coefficient of Variation
Coeffecient of Variation for Articles with Average Monthly Volume less than 5MM kg(Bubble size represents the absolute value of variable margin)
Unique Articles
Many low volume, low margin, high variability articles
These are not productive articles
They are candidates for removal from the business

The Long Tail Approach
Products
Long Tail
Popular Products
Popula
rity
•Is there an opportunity to simplify by managing the tail?
•Does the long tail contribute significantly to revenue?
•Does the long tail include many low margin products?
•What is the hidden cost of products in the long tail?
©Copyright 2012 D. Simchi-Levi 27

Example 2: Demand, variability, and allocated margin
©Copyright 2012 D. Simchi-Levi
1
10
100
1000
0 0.5 1 1.5 2 2.5 3 3.5
Averagem
onthlyshipments(LOGSCALE)
Coeffic
i
entofVaria onofmontlyshipments
30-80%
0-30%
Nega ve
80-90%
Allocat
ed
margin Allocated margin range
Tail accounts for
• 35 % of products
• 1.4% of revenue
• 50% of the negative margin products
Case Study: High-Tech Company

Example 2: Lead Time and the Long Tail
©Copyright 2012 D. Simchi-Levi
29
0%
10%
20%
30%
40%
50%
60%
70%
80%
90%
100%
High CV Low CV
4_LT>35
3_LT: 28-35
2_LT:21-27
1_LT<21
Rule: Products in the Long Tail are associated with
Longer Lead Times than other products
Tail accounts for
• 35 % of products
• 1.4% of revenue
• 50% of the negative margin products
• 60% of total cost per unit sold
For each Category, % of products with a given Lead Time

The Impact of Product Life Cycle on Variabiity
©Copyright 2012 D. Simchi-Levi
30
0
0.5
1
1.5
2
2.5
1 2 3 4 5 6 7 8 9 10 11 12 13 14 15 16
Co
eff
icie
nt
of
Var
iati
on
(C
V)
Products in Early Life
Product 1 Product 2
0
0.5
1
1.5
2
2.5
3
1 2 3 4 5 6 7 8 9 10 11 12 13 14 15 16
Co
eff
icie
nt
of
Var
iati
on
(C
V)
Products in End of Life
Product 3 Product 4

The Impact of Product Life Cycle on Variabiity
©Copyright 2012 D. Simchi-Levi
31
0
0.5
1
1.5
2
2.5
1 2 3 4 5 6 7 8 9 10 11 12 13 14 15 16
Co
eff
icie
nt
of
Var
iati
on
(C
V)
Products in Early Life
Product 1 Product 2
0
0.5
1
1.5
2
2.5
3
1 2 3 4 5 6 7 8 9 10 11 12 13 14 15 16
Co
eff
icie
nt
of
Var
iati
on
(C
V)
Products in End of Life
Product 3 Product 4
Rule: The tail is not Static—Products typically start at
the tail and end at the tail

Variability Growth with the Number of Products
©Copyright 2012 D. Simchi-Levi
32
100
120
140
160
180
200
220
240
260
280
300
0.8
0.9
1
1.1
1.2
1.3
1.4
2008 2009 2010 2011 2012
Nu
mb
er
of
Un
iqu
e P
rod
uct
s
Ave
rage
CV
Fiscal periods
Average CV Number of Products

Variability Growth with the Number of Products
©Copyright 2012 D. Simchi-Levi
33
100
120
140
160
180
200
220
240
260
280
300
0.8
0.9
1
1.1
1.2
1.3
1.4
2008 2009 2010 2011 2012
Nu
mb
er
of
Un
iqu
e P
rod
uct
s
Ave
rage
CV
Fiscal periods
Average CV Number of Products
Rule: The more products you have the higher the
variability

Example 3:The Long Tail Approach
©Copyright 2012 D. Simchi-Levi
A
B
C
21, 68%
Low High CoV of Sales (Mar-June’2010)
Medium
32, 15%
7, 3%
% S
ale
s C
on
trib
uti
on
2, 1%
10, 0.6%
45, 7% 27, 2%
Case Study: Foods Business
CoV sales:
•Low: <= 20%,
•Medium: 20%- 50%,
•High > 50%
% Sales Contribution
•A =High,
•B= Medium,
•C= Low
No. of SKUs,
% Sales
34

Complexity Management: Important Findings
• Items in the tail accounts for more inventory per dollar revenue than other items due
– High variability
– Long lead times
By a factor of three of more
• Variability during product lifecycle is high at
– Product introduction
– End-of-life
• Increasing the number of products increases variability for ALL existing products
• Complexity reduction starts at the product design stage
©Copyright 2012 D. Simchi-Levi 35

0%
20%
42%
FY10 Q2FY11 Q4 FY11
43%
68% 70%
FY10 Q2FY11 Q4 FY11
Dell Transformation Results •>99% fewer configurations • 3 times improvement in forecast accuracy
•>30% freight cost reduction on notebooks
•>30% manufacturing cost reduction
Copyright 2011 Dell Inc. All Rights Reserved
ODM volume
Popular, Pre-configured offers
Consumer Notebook Ocean Ship
5%
20%
~70%
FY10 Q2FY11 FY13 Exit
36

Supply Produce Distribute Sell
Plan/Design
Source
•Product Architecture
•Make/Buy
•Early Supplier Involvement
•Strategic Partnerships
•Suppliers Selection
•Supply Contracts
Fulfillment Supply Chain
Develo
pm
en
t Su
pp
ly C
hain
The Enterprise Fulfillment and Development Supply Chains
©Copyright 2012 D. Simchi-Levi 37

Supply Produce Distribute Sell
Plan/Design
Source
•Product Architecture
•Make/Buy
•Early Supplier Involvement
•Strategic Partnerships
•Suppliers Selection
•Supply Contracts
Fulfillment Supply Chain
Develo
pm
en
t Su
pp
ly C
hain
The Enterprise Fulfillment and Development Supply Chains
Need to understand the impact of New Product
Introduction on the tail taking into account BOM,
Volume, Cost, Lead Times… .
©Copyright 2012 D. Simchi-Levi 38
39
What We’ll Cover …
• The Need to Focus
Drivers and Impact
• Matching Products and Strategies
Supply Chain Segmentation
• Complexity Management
The Long Tail Approach
• Summary

40
Key Observations
• Complexity Management
The Long Tail has a huge impact on supply chain performance
Managing complexity starts at the product design level
The benefits of lower variety include better forecast, higher service levels with lower inventory, higher margins
©Copyright 2012 D. Simchi-Levi

Copyright SCDigest
More Resources
• Dr. David Simchi-Levi, MIT
• Operations Rules web site
– www.oprules.com
• Dan Gilmore, SCDigest
Top Related