


Languages
Pages
Legal

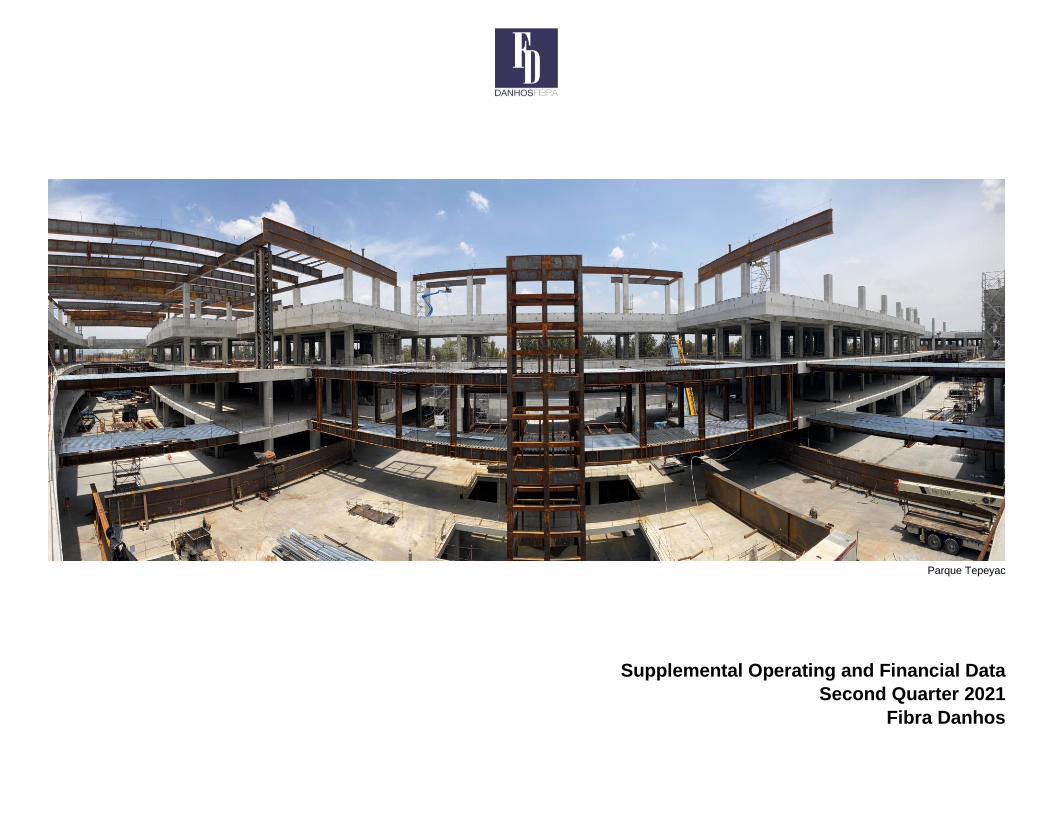
Parque Tepeyac
Supplemental Operating and Financial Data
Second Quarter 2021
Fibra Danhos
2
Table of contents
Comments from our CEO 4
Fibra Danhos’ financial evolution snapshot 5
Executive summary 6
1. Financial information of Fibra Danhos 8
2. Cash distribution for the second quarter 2021 and CBFI conciliation 10
3. Earnings 11
4. Operating indicators 14
5. Current Operating Portfolio 18
6. Current Development Portfolio and growth plan 19
7. Glossary 20
Disclaimer
This document may include forward-looking statements that may imply risks and uncertainty. Terms such as "estimate", "project", "plan", "believe", "expect", "anticipate", "intend", and other similar expressions could be construed as previsions or estimates. Fibra Danhos warns readers that: declarations and estimates mentioned in this document or realized by Fibra Danhos’ management are subjected to risks and uncertainties that could change in function of various factors external to Fibra Danhos´ control. Future expectations reflect Fibra Danhos’ judgment at the date of this document´s release. Fibra Danhos’ reserves the right or obligation to update the information contained in this document or derived from this document. Past or present performance is not an indicator to anticipate future performance.
Fibra Danhos We are a Mexican trust constituted, primarily, to develop, own, lease, operate, and acquire iconic and premier-quality commercial real estate assets in Mexico. Our objective is to provide attractive risk-adjusted returns to our CBFI holders, over the long-term, through stable cash distributions and the appreciation of our property values. We plan to maintain and grow a high-quality portfolio of properties. This, through our strong and unparalleled development capabilities and selective acquisitions of premier-quality iconic properties. We consider properties to be iconic if they have, the unique ability, to transform the areas surrounding their location. We consider properties to be premier-quality if they are located in prime locations, were developed with high construction and design standards, feature quality tenants, report high occupancy rates and, in the case of retail properties, attract a high volume of visitors and sales per square meter.
Investor Relations Contact Information
Elias Mizrahi Daniel Office: +52 (55) 5284 0030 ext.1024
Email: [email protected]
Earnings The quarterly results of the following quarters will be published on the following dates:
Report Release Date Investor Conference Call Information
Phone number:
Date: Time:
Third Quarter, 2021 Tentatively, Thursday, October 21th, 2021 Phone number: +1 (800) 895 3361 from within the U.S.
Fourth Quarter, 2021 Tentatively, Thursday, February 17th, 2022 +1 (785) 424 1062 from outside the U.S. First Quarter, 2022
Tentatively, Thursday, April 21nd, 2022 Date: Friday, July 23rd, 2021
Second Quarter, 2022 Tentatively, Thursday, July 21th, 2022 Time: 12:00 pm EST/11:00 am CST
ID: DANHOS
Stock Information
Ticker: DANHOS13 2Q21 1Q21 4Q20 3Q20 2Q20
Closing price (high) 26.17 26.14 24.89 22.88 23.00
Closing price (low) 22.11 23.63 19.07 18.41 17.20
Average closing price 24.15 24.97 22.14 20.79 19.86
Average daily trading volume (CBFIs) 833,708 1,034,856 1,065,793 901,805 1,510,472
Issued CBFIs 1,552,383,510 1,552,383,510 1,552,383,510 1,552,383,510 1,560,862,486
Outstanding CBFIs (BMV) 1,498,047,425 1,493,866,919 1,487,442,960 1,480,032,259 1,468,807,093
CBFIs with economic rights 1,466,932,664 1,462,752,158 1,456,328,199 1,448,917,498 1,434,409,737
Market capitalization (millions of pesos) 37,422.02 38,093.61 36,174.61 29,985.45 29,385.76
Analyst Coverage
Company Analyst E-mail
Barclays
Pablo Monsiváis [email protected]
Bank of America Merrill Lynch Carlos Peyrelongue [email protected]
BBVA Bancomer
Francisco Chávez [email protected]
Bradesco BBI Víctor Tapia [email protected]
BTG Pactual Gordon Lee [email protected]
Credit Suisse Vanessa Quiroga [email protected]
Evercore ISI Sheila McGrath [email protected] HSBC Eduardo Altamirano [email protected] J.P. Morgan Adrián Huerta [email protected]
ITAU BBA Enrico Trotta [email protected]
Monex Roberto Solano [email protected]
Morgan Stanley Nikolaj Lippmann [email protected]
Nau Securities Luis Prieto [email protected]
Santander José Manuel Ramírez [email protected]
Signum Research Armando Rodríguez [email protected]

4
Comments from our CEO
“Dear Investors, second quarter operation of our real estate portfolio maintained a healthy recovery trend. Traffic flow of tenants and visitors has been increasing as the pandemic subsides and the vaccination program progresses. Consumer confidence has been reflected in greater economic activity in our shopping centers, evidenced by higher sales from our tenants. Most of our leasing agreements have been renewed, and those spaces that were vacated are being rented again in very good terms.
The relief program granted to our tenants has paid off, credit note reserves for COVID have declined significantly, collections improved thus reducing accounts receivables and we have managed to sign deferred payment agreements with most tenants, when needed.
Revenues and consolidated NOI reached 1,177.5 million pesos and 949.2 million pesos respectively, showing increases of 14.8% and 12.1% in relation to the last consecutive quarter and are approaching pre-pandemic levels, but still down around 18%. NOI margin remained stable at 81% despite the fact that operating expenses have risen as a result of increased property operations. AFFO of 770.6 million pesos represents Ps. 0.53 of AFFO per CBFI with economic rights of and compares favorably with the Ps. 0.41 posted on the preceding quarter. Distribution approved for this period by our Technical Committee was Ps. 0.50 per CBFI, a payout ratio of 95.2%.
Parque Tepeyac posted global progress of 63%, with civil works fully completed and making progress on metallic structures. The project will be complemented with an entertainment area of twenty thousand square meters.
Despite the recent increase in Covid Delta Strain cases in certain regions of the country, hospital occupancy levels remain low, which apparently implies that the peak stage of the pandemic has been overcome and that the economic recovery will continue. We will remain alert and ready. I appreciate the work and commitment of our team, I am certain that the strength and experience of Fibra Danhos will allow us to fully recover and resume our growth path.”
Salvador Daniel Kabbaz Zaga
CEO, Fibra Danhos
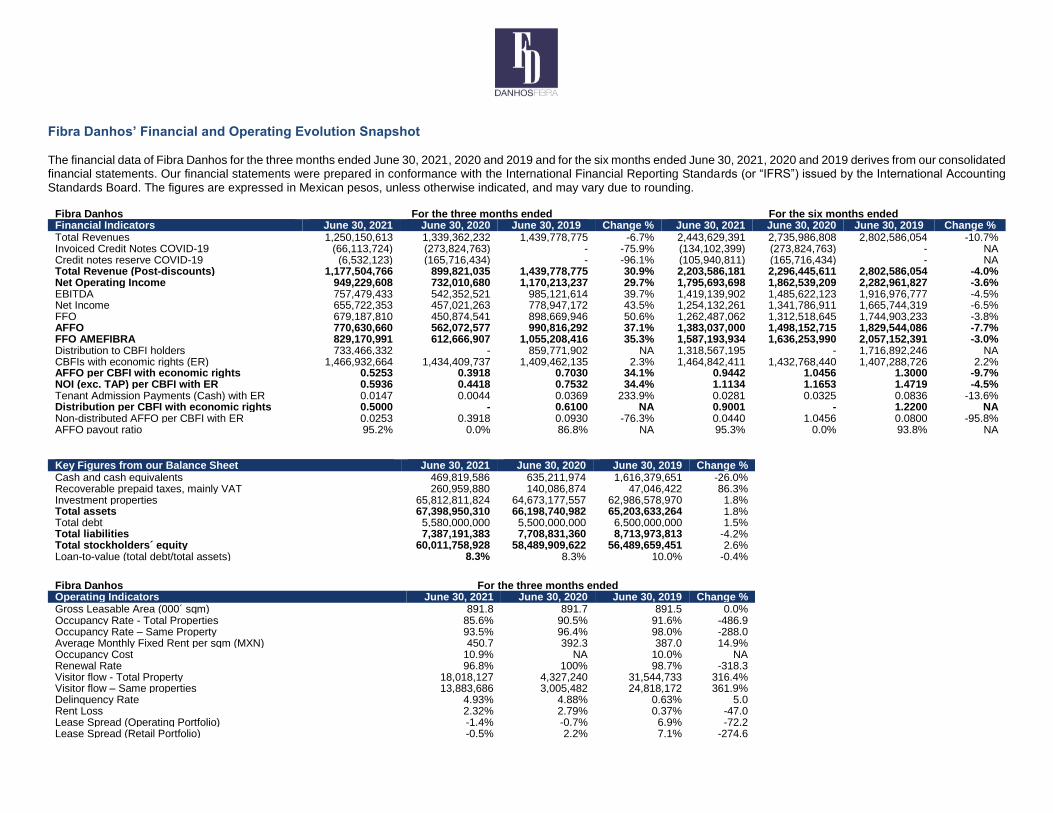
Fibra Danhos’ Financial and Operating Evolution Snapshot The financial data of Fibra Danhos for the three months ended June 30, 2021, 2020 and 2019 and for the six months ended June 30, 2021, 2020 and 2019 derives from our consolidated financial statements. Our financial statements were prepared in conformance with the International Financial Reporting Standards (or “IFRS”) issued by the International Accounting Standards Board. The figures are expressed in Mexican pesos, unless otherwise indicated, and may vary due to rounding.
Fibra Danhos For the three months ended For the six months ended Financial Indicators June 30, 2021 June 30, 2020 June 30, 2019 Change % June 30, 2021 June 30, 2020 June 30, 2019 Change % Total Revenues 1,250,150,613 1,339,362,232 1,439,778,775 -6.7% 2,443,629,391 2,735,986,808 2,802,586,054 -10.7% Invoiced Credit Notes COVID-19 (66,113,724) (273,824,763)
1,024,429,285
- -75.9% (134,102,399) (273,824,763) - NA Credit notes reserve COVID-19 (6,532,123) (165,716,434) - -96.1% (105,940,811) (165,716,434) - NA Total Revenue (Post-discounts) 1,177,504,766 899,821,035 1,439,778,775 30.9% 2,203,586,181 2,296,445,611 2,802,586,054 -4.0% Net Operating Income 949,229,608 732,010,680 1,170,213,237 29.7% 1,795,693,698 1,862,539,209 2,282,961,827 -3.6% EBITDA 757,479,433 542,352,521 985,121,614 39.7% 1,419,139,902 1,485,622,123 1,916,976,777 -4.5% Net Income 655,722,353 457,021,263 778,947,172 43.5% 1,254,132,261 1,341,786,911 1,665,744,319 -6.5% FFO 679,187,810 450,874,541 898,669,946 50.6% 1,262,487,062 1,312,518,645 1,744,903,233 -3.8% AFFO 770,630,660 562,072,577 990,816,292 37.1% 1,383,037,000 1,498,152,715 1,829,544,086 -7.7% FFO AMEFIBRA 829,170,991 612,666,907 1,055,208,416 35.3% 1,587,193,934 1,636,253,990 2,057,152,391 -3.0%
Distribution to CBFI holders 733,466,332 - 859,771,902 NA 1,318,567,195 - 1,716,892,246 NA CBFIs with economic rights (ER) 1,466,932,664 1,434,409,737 1,409,462,135 2.3% 1,464,842,411 1,432,768,440 1,407,288,726 2.2% AFFO per CBFI with economic rights 0.5253 0.3918 0.7030 34.1% 0.9442
1.0456 1.3000 -9.7%
NOI (exc. TAP) per CBFI with ER 0.5936 0.4418 0.7532 34.4% 1.1134 1.1653 1.4719 -4.5% Tenant Admission Payments (Cash) with ER 0.0147 0.0044 0.0369 233.9% 0.0281 0.0325 0.0836 -13.6% Distribution per CBFI with economic rights 0.5000 - 0.6100 NA 0.9001 - 1.2200 NA Non-distributed AFFO per CBFI with ER 0.0253 0.3918 0.0930 -76.3% 0.0440 1.0456 0.0800 -95.8% AFFO payout ratio 95.2% 0.0% 86.8% NA 95.3% 0.0% 93.8% NA
Key Figures from our Balance Sheet June 30, 2021 June 30, 2020 June 30, 2019 Change % Cash and cash equivalents 469,819,586 635,211,974 1,616,379,651 -26.0% Recoverable prepaid taxes, mainly VAT 260,959,880 140,086,874 47,046,422 86.3% Investment properties 65,812,811,824 64,673,177,557 62,986,578,970 1.8% Total assets 67,398,950,310 66,198,740,982 65,203,633,264 1.8% Total debt 5,580,000,000 5,500,000,000 6,500,000,000 1.5% Total liabilities 7,387,191,383 7,708,831,360 8,713,973,813 -4.2% Total stockholders´ equity 60,011,758,928 58,489,909,622 56,489,659,451 2.6% Loan-to-value (total debt/total assets) 8.3% 8.3% 10.0% -0.4%
Fibra Danhos For the three months ended Operating Indicators June 30, 2021 June 30, 2020 June 30, 2019 Change % Gross Leasable Area (000´ sqm) 891.8 891.7 891.5 0.0% Occupancy Rate - Total Properties 85.6% 90.5% 91.6% -486.9 Occupancy Rate – Same Property
93.5% 96.4% 98.0% -288.0 Average Monthly Fixed Rent per sqm (MXN) 450.7 392.3 387.0 14.9% Occupancy Cost 10.9% NA 10.0% NA Renewal Rate 96.8% 100% 98.7% -318.3 Visitor flow - Total Property 18,018,127 4,327,240 31,544,733 316.4% Visitor flow – Same properties 13,883,686 3,005,482 24,818,172 361.9% Delinquency Rate 4.93% 4.88% 0.63% 5.0 Rent Loss
2.32% 2.79% 0.37% -47.0 Lease Spread (Operating Portfolio) -1.4% -0.7% 6.9% -72.2 Lease Spread (Retail Portfolio) -0.5% 2.2% 7.1% -274.6
6
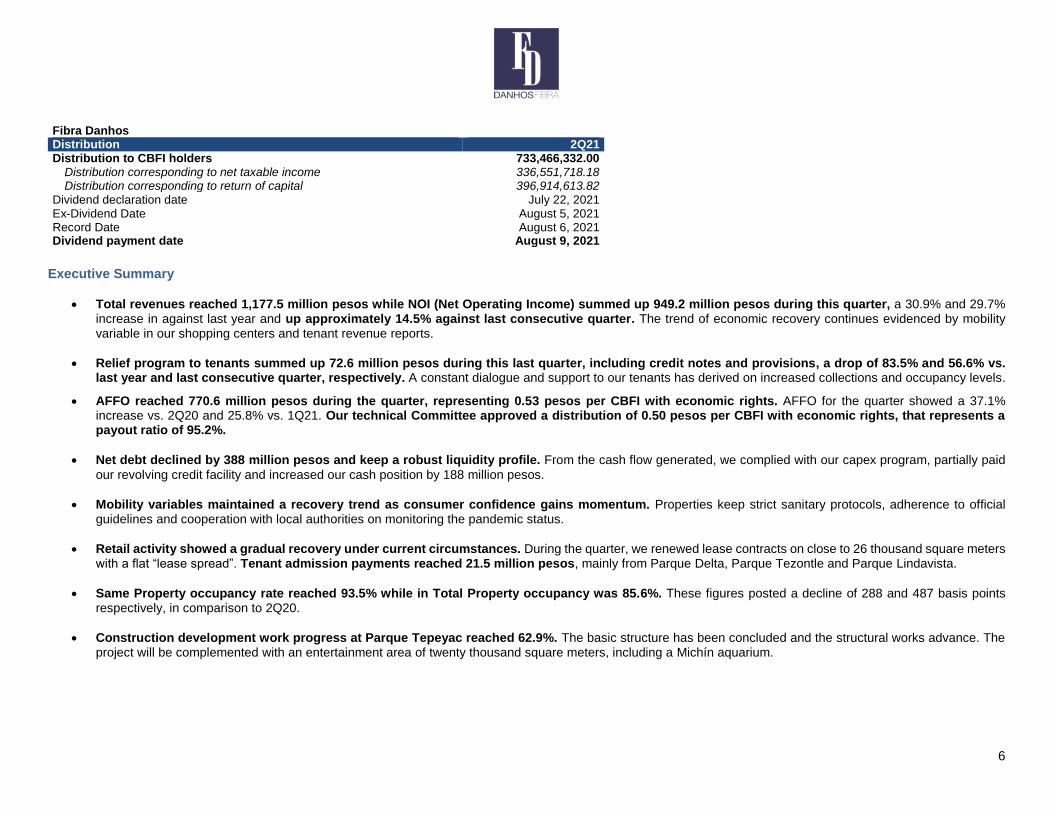
Fibra Danhos
Distribution 2Q21 Distribution to CBFI holders 733,466,332.00
Distribution corresponding to net taxable income 336,551,718.18 Distribution corresponding to return of capital 396,914,613.82
Dividend declaration date July 22, 2021 Ex-Dividend Date August 5, 2021 Record Date August 6, 2021 Dividend payment date August 9, 2021
Executive Summary
Total revenues reached 1,177.5 million pesos while NOI (Net Operating Income) summed up 949.2 million pesos during this quarter, a 30.9% and 29.7% increase in against last year and up approximately 14.5% against last consecutive quarter. The trend of economic recovery continues evidenced by mobility variable in our shopping centers and tenant revenue reports.
Relief program to tenants summed up 72.6 million pesos during this last quarter, including credit notes and provisions, a drop of 83.5% and 56.6% vs. last year and last consecutive quarter, respectively. A constant dialogue and support to our tenants has derived on increased collections and occupancy levels.
AFFO reached 770.6 million pesos during the quarter, representing 0.53 pesos per CBFI with economic rights. AFFO for the quarter showed a 37.1% increase vs. 2Q20 and 25.8% vs. 1Q21. Our technical Committee approved a distribution of 0.50 pesos per CBFI with economic rights, that represents a payout ratio of 95.2%.
Net debt declined by 388 million pesos and keep a robust liquidity profile. From the cash flow generated, we complied with our capex program, partially paid
our revolving credit facility and increased our cash position by 188 million pesos.
Mobility variables maintained a recovery trend as consumer confidence gains momentum. Properties keep strict sanitary protocols, adherence to official guidelines and cooperation with local authorities on monitoring the pandemic status.
Retail activity showed a gradual recovery under current circumstances. During the quarter, we renewed lease contracts on close to 26 thousand square meters with a flat “lease spread”. Tenant admission payments reached 21.5 million pesos, mainly from Parque Delta, Parque Tezontle and Parque Lindavista.
Same Property occupancy rate reached 93.5% while in Total Property occupancy was 85.6%. These figures posted a decline of 288 and 487 basis points respectively, in comparison to 2Q20.
Construction development work progress at Parque Tepeyac reached 62.9%. The basic structure has been concluded and the structural works advance. The project will be complemented with an entertainment area of twenty thousand square meters, including a Michín aquarium.
7
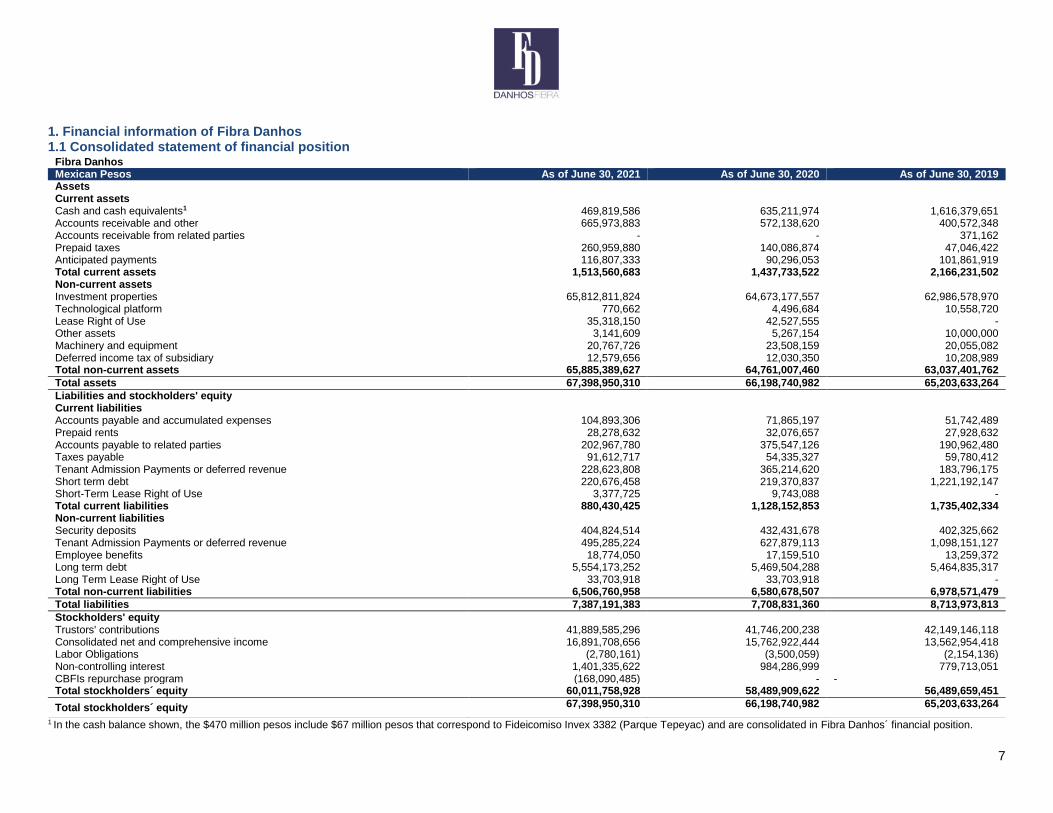
1. Financial information of Fibra Danhos 1.1 Consolidated statement of financial position
1 In the cash balance shown, the $470 million pesos include $67 million pesos that correspond to Fideicomiso Invex 3382 (Parque Tepeyac) and are consolidated in Fibra Danhos´ financial position.
Fibra Danhos Mexican Pesos As of June 30, 2021 As of June 30, 2020 As of June 30, 2019 Assets Current assets Cash and cash equivalents1 469,819,586 635,211,974 1,616,379,651 Accounts receivable and other 665,973,883 572,138,620 400,572,348 Accounts receivable from related parties - - 371,162 Prepaid taxes 260,959,880 140,086,874 47,046,422 Anticipated payments 116,807,333 90,296,053 101,861,919 Total current assets 1,513,560,683 1,437,733,522 2,166,231,502 Non-current assets Investment properties 65,812,811,824 64,673,177,557 62,986,578,970 Technological platform 770,662 4,496,684 10,558,720 Lease Right of Use 35,318,150 42,527,555 - Other assets 3,141,609 5,267,154 10,000,000 Machinery and equipment 20,767,726 23,508,159 20,055,082 Deferred income tax of subsidiary 12,579,656 12,030,350 10,208,989 Total non-current assets 65,885,389,627 64,761,007,460 63,037,401,762
Total assets 67,398,950,310 66,198,740,982 65,203,633,264
Liabilities and stockholders' equity Current liabilities Accounts payable and accumulated expenses 104,893,306 71,865,197 51,742,489 Prepaid rents 28,278,632 32,076,657 27,928,632 Accounts payable to related parties 202,967,780 375,547,126 190,962,480 Taxes payable 91,612,717 54,335,327 59,780,412 Tenant Admission Payments or deferred revenue 228,623,808 365,214,620 183,796,175 Short term debt 220,676,458 219,370,837 1,221,192,147 Short-Term Lease Right of Use 3,377,725 9,743,088 - Total current liabilities 880,430,425 1,128,152,853 1,735,402,334 Non-current liabilities Security deposits 404,824,514 432,431,678 402,325,662 Tenant Admission Payments or deferred revenue 495,285,224 627,879,113 1,098,151,127 Employee benefits 18,774,050 17,159,510 13,259,372 Long term debt 5,554,173,252 5,469,504,288 5,464,835,317 Long Term Lease Right of Use 33,703,918 33,703,918 - Total non-current liabilities 6,506,760,958 6,580,678,507 6,978,571,479
Total liabilities 7,387,191,383 7,708,831,360 8,713,973,813
Stockholders' equity Trustors' contributions 41,889,585,296 41,746,200,238 42,149,146,118 Consolidated net and comprehensive income 16,891,708,656 15,762,922,444 13,562,954,418 Labor Obligations (2,780,161) (3,500,059) (2,154,136) Non-controlling interest 1,401,335,622 984,286,999 779,713,051 CBFIs repurchase program (168,090,485) - - Total stockholders´ equity 60,011,758,928 58,489,909,622 56,489,659,451
Total stockholders´ equity 67,398,950,310 66,198,740,982 65,203,633,264
8
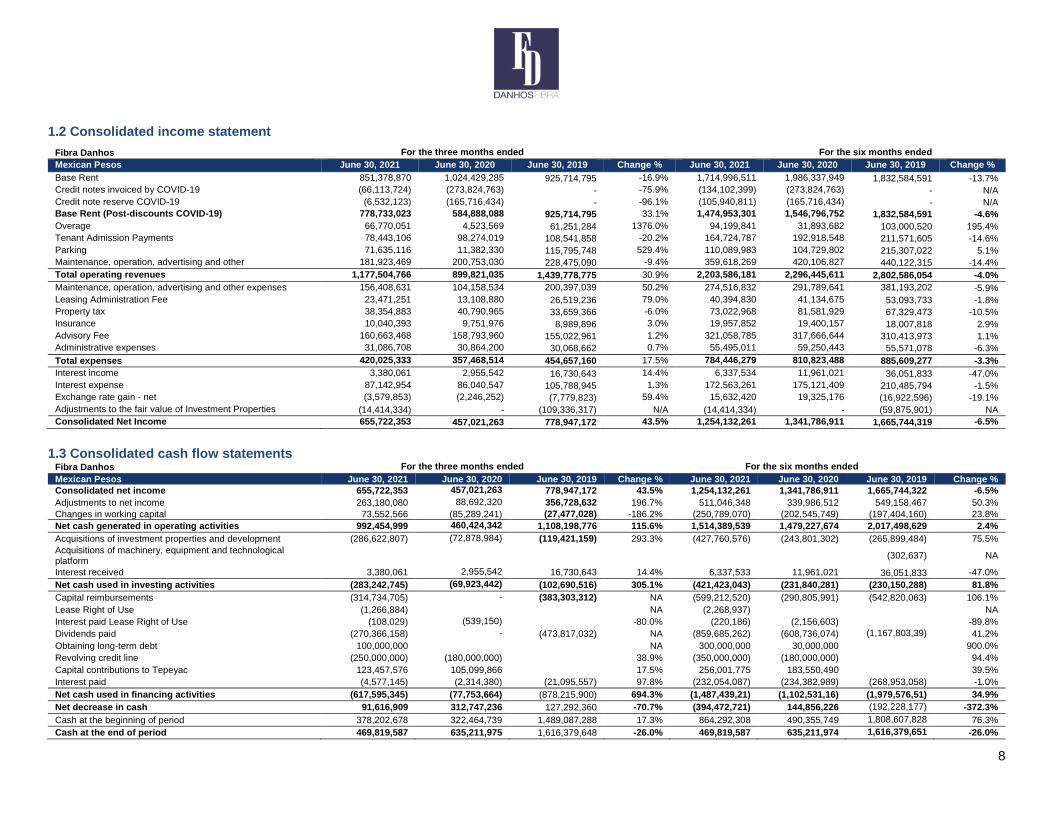
1.2 Consolidated income statement
Fibra Danhos For the three months ended For the six months ended
Mexican Pesos June 30, 2021 June 30, 2020 June 30, 2019 Change % June 30, 2021 June 30, 2020 June 30, 2019 Change %
Base Rent 851,378,870 1,024,429,285 925,714,795 -16.9% 1,714,996,511 1,986,337,949 1,832,584,591 -13.7%
Credit notes invoiced by COVID-19 (66,113,724) (273,824,763) - -75.9% (134,102,399) (273,824,763) - N/A
Credit note reserve COVID-19 (6,532,123) (165,716,434) - -96.1% (105,940,811) (165,716,434) - N/A
Base Rent (Post-discounts COVID-19) 778,733,023 584,888,088 925,714,795 33.1% 1,474,953,301 1,546,796,752 1,832,584,591 -4.6%
Overage 66,770,051 4,523,569 61,251,284 1376.0% 94,199,841 31,893,682 103,000,520 195.4%
Tenant Admission Payments 78,443,106 98,274,019 108,541,858 -20.2% 164,724,787 192,918,548 211,571,605 -14.6%
Parking 71,635,116 11,382,330 115,795,748 529.4% 110,089,983 104,729,802 215,307,022 5.1%
Maintenance, operation, advertising and other 181,923,469 200,753,030 228,475,090 -9.4% 359,618,269 420,106,827 440,122,315 -14.4%
Total operating revenues 1,177,504,766 899,821,035 1,439,778,775 30.9% 2,203,586,181 2,296,445,611 2,802,586,054 -4.0%
Maintenance, operation, advertising and other expenses 156,408,631 104,158,534 200,397,039 50.2% 274,516,832 291,789,641 381,193,202 -5.9%
Leasing Administration Fee 23,471,251 13,108,880 26,519,236 79.0% 40,394,830 41,134,675 53,093,733 -1.8%
Property tax 38,354,883 40,790,965 33,659,366 -6.0% 73,022,968 81,581,929 67,329,473 -10.5%
Insurance 10,040,393 9,751,976 8,989,896 3.0% 19,957,852 19,400,157 18,007,818 2.9%
Advisory Fee 160,663,468 158,793,960 155,022,961 1.2% 321,058,785 317,666,644 310,413,973 1.1%
Administrative expenses 31,086,708 30,864,200 30,068,662 0.7% 55,495,011 59,250,443 55,571,078 -6.3%
Total expenses 420,025,333 357,468,514 454,657,160 17.5% 784,446,279 810,823,488 885,609,277 -3.3%
Interest income 3,380,061 2,955,542 16,730,643 14.4% 6,337,534 11,961,021 36,051,833 -47.0%
Interest expense 87,142,954 86,040,547 105,788,945 1.3% 172,563,261 175,121,409 210,485,794 -1.5%
Exchange rate gain - net (3,579,853) (2,246,252) (7,779,823) 59.4% 15,632,420 19,325,176 (16,922,596) -19.1%
Adjustments to the fair value of Investment Properties (14,414,334) - (109,336,317) N/A (14,414,334) - (59,875,901) NA
Consolidated Net Income 655,722,353 457,021,263 778,947,172 43.5% 1,254,132,261 1,341,786,911 1,665,744,319 -6.5%
1.3 Consolidated cash flow statements
Fibra Danhos For the three months ended For the six months ended
Mexican Pesos June 30, 2021 June 30, 2020 June 30, 2019 Change % June 30, 2021 June 30, 2020 June 30, 2019 Change %
Consolidated net income 655,722,353 457,021,263 778,947,172 43.5% 1,254,132,261 1,341,786,911 1,665,744,322 -6.5%
Adjustments to net income 263,180,080 88,692,320 356,728,632 196.7% 511,046,348 339,986,512 549,158,467 50.3%
Changes in working capital 73,552,566 (85,289,241) (27,477,028) -186.2% (250,789,070) (202,545,749) (197,404,160) 23.8%
Net cash generated in operating activities 992,454,999 460,424,342 1,108,198,776 115.6% 1,514,389,539 1,479,227,674 2,017,498,629 2.4%
Acquisitions of investment properties and development (286,622,807) (72,878,984) (119,421,159) 293.3% (427,760,576) (243,801,302) (265,899,484) 75.5%
Acquisitions of machinery, equipment and technological platform
(302,637) NA
Interest received 3,380,061 2,955,542 16,730,643 14.4% 6,337,533 11,961,021 36,051,833 -47.0%
Net cash used in investing activities (283,242,745) (69,923,442) (102,690,516) 305.1% (421,423,043) (231,840,281) (230,150,288) 81.8%
Capital reimbursements (314,734,705) - (383,303,312) NA (599,212,520) (290,805,991) (542,820,063) 106.1%
Lease Right of Use (1,266,884)
NA (2,268,937) NA
Interest paid Lease Right of Use (108,029) (539,150) -80.0% (220,186) (2,156,603) -89.8%
Dividends paid (270,366,158) - (473,817,032) NA (859,685,262) (608,736,074) (1,167,803,39) 41.2%
Obtaining long-term debt 100,000,000
NA 300,000,000 30,000,000 900.0%
Revolving credit line (250,000,000) (180,000,000) 38.9% (350,000,000) (180,000,000) 94.4%
Capital contributions to Tepeyac 123,457,576 105,099,866 17.5% 256,001,775 183,550,490 39.5%
Interest paid (4,577,145) (2,314,380) (21,095,557) 97.8% (232,054,087) (234,382,989) (268,953,058) -1.0%
Net cash used in financing activities (617,595,345) (77,753,664) (878,215,900) 694.3% (1,487,439,21) (1,102,531,16) (1,979,576,51) 34.9%
Net decrease in cash 91,616,909 312,747,236 127,292,360 -70.7% (394,472,721) 144,856,226 (192,228,177) -372.3%
Cash at the beginning of period 378,202,678 322,464,739 1,489,087,288 17.3% 864,292,308 490,355,749 1,808,607,828 76.3%
Cash at the end of period 469,819,587 635,211,975 1,616,379,648 -26.0% 469,819,587 635,211,974 1,616,379,651 -26.0%
9
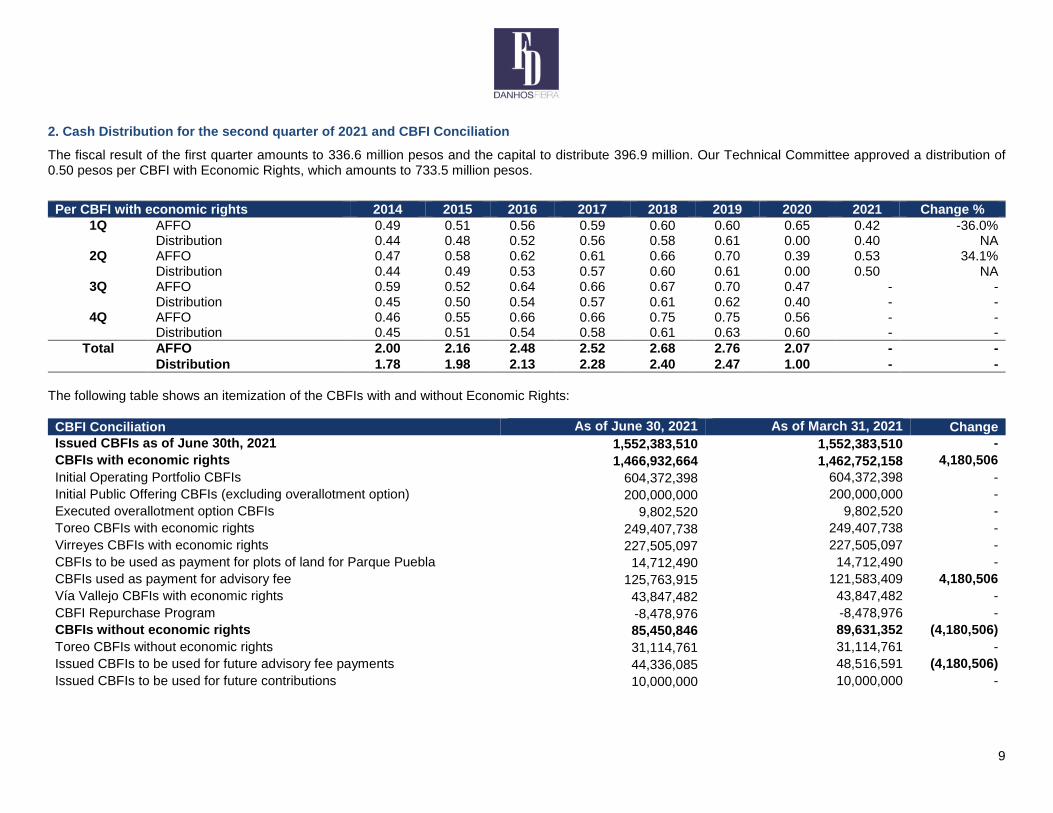
2. Cash Distribution for the second quarter of 2021 and CBFI Conciliation
The fiscal result of the first quarter amounts to 336.6 million pesos and the capital to distribute 396.9 million. Our Technical Committee approved a distribution of 0.50 pesos per CBFI with Economic Rights, which amounts to 733.5 million pesos.
Per CBFI with economic rights 2014 2015 2016 2017 2018 2019 2020 2021 Change %
1Q AFFO 0.49 0.51 0.56 0.59 0.60 0.60 0.65 0.42 -36.0% Distribution 0.44 0.48 0.52 0.56 0.58 0.61 0.00 0.40 NA
2Q AFFO 0.47 0.58 0.62 0.61 0.66 0.70 0.39 0.53 34.1% Distribution 0.44 0.49 0.53 0.57 0.60 0.61 0.00 0.50 NA
3Q AFFO 0.59 0.52 0.64 0.66 0.67 0.70 0.47 - - Distribution 0.45 0.50 0.54 0.57 0.61 0.62 0.40 - -
4Q AFFO 0.46 0.55 0.66 0.66 0.75 0.75 0.56 - - Distribution 0.45 0.51 0.54 0.58 0.61 0.63 0.60 - -
Total AFFO 2.00 2.16 2.48 2.52 2.68 2.76 2.07 - -
Distribution 1.78 1.98 2.13 2.28 2.40 2.47 1.00 - -
The following table shows an itemization of the CBFIs with and without Economic Rights:
CBFI Conciliation As of June 30, 2021 As of March 31, 2021 Change
Issued CBFIs as of June 30th, 2021 1,552,383,510 1,552,383,510 -
CBFIs with economic rights 1,466,932,664 1,462,752,158 4,180,506
Initial Operating Portfolio CBFIs 604,372,398 604,372,398 -
Initial Public Offering CBFIs (excluding overallotment option) 200,000,000 200,000,000 -
Executed overallotment option CBFIs 9,802,520 9,802,520 -
Toreo CBFIs with economic rights 249,407,738 249,407,738 -
Virreyes CBFIs with economic rights 227,505,097 227,505,097 -
CBFIs to be used as payment for plots of land for Parque Puebla 14,712,490 14,712,490 -
CBFIs used as payment for advisory fee 125,763,915 121,583,409 4,180,506
Vía Vallejo CBFIs with economic rights 43,847,482 43,847,482 -
CBFI Repurchase Program -8,478,976 -8,478,976 -
CBFIs without economic rights 85,450,846 89,631,352 (4,180,506)
Toreo CBFIs without economic rights 31,114,761 31,114,761 -
Issued CBFIs to be used for future advisory fee payments 44,336,085 48,516,591 (4,180,506)
Issued CBFIs to be used for future contributions 10,000,000 10,000,000 -
10
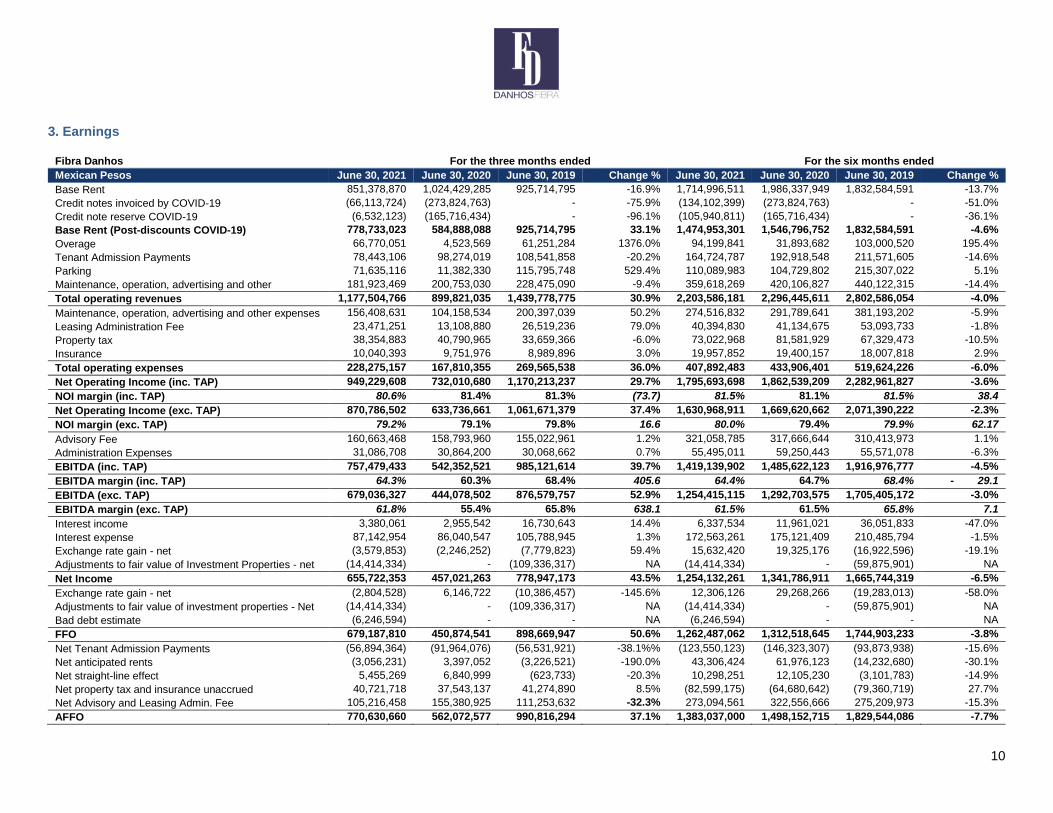
3. Earnings
Fibra Danhos For the three months ended For the six months ended
Mexican Pesos June 30, 2021 June 30, 2020 June 30, 2019 Change % June 30, 2021 June 30, 2020 June 30, 2019 Change %
Base Rent 851,378,870 1,024,429,285 925,714,795 -16.9% 1,714,996,511 1,986,337,949 1,832,584,591 -13.7%
Credit notes invoiced by COVID-19 (66,113,724) (273,824,763) - -75.9% (134,102,399) (273,824,763) - -51.0%
Credit note reserve COVID-19 (6,532,123) (165,716,434) - -96.1% (105,940,811) (165,716,434) - -36.1%
Base Rent (Post-discounts COVID-19) 778,733,023 584,888,088 925,714,795 33.1% 1,474,953,301 1,546,796,752 1,832,584,591 -4.6%
Overage 66,770,051 4,523,569 61,251,284 1376.0% 94,199,841 31,893,682 103,000,520 195.4%
Tenant Admission Payments 78,443,106 98,274,019 108,541,858 -20.2% 164,724,787 192,918,548 211,571,605 -14.6%
Parking 71,635,116 11,382,330 115,795,748 529.4% 110,089,983 104,729,802 215,307,022 5.1%
Maintenance, operation, advertising and other 181,923,469 200,753,030 228,475,090 -9.4% 359,618,269 420,106,827 440,122,315 -14.4%
Total operating revenues 1,177,504,766 899,821,035 1,439,778,775 30.9% 2,203,586,181 2,296,445,611 2,802,586,054 -4.0%
Maintenance, operation, advertising and other expenses 156,408,631 104,158,534 200,397,039 50.2% 274,516,832 291,789,641 381,193,202 -5.9%
Leasing Administration Fee 23,471,251 13,108,880 26,519,236 79.0% 40,394,830 41,134,675 53,093,733 -1.8%
Property tax 38,354,883 40,790,965 33,659,366 -6.0% 73,022,968 81,581,929 67,329,473 -10.5%
Insurance 10,040,393 9,751,976 8,989,896 3.0% 19,957,852 19,400,157 18,007,818 2.9%
Total operating expenses 228,275,157 167,810,355 269,565,538 36.0% 407,892,483 433,906,401 519,624,226 -6.0%
Net Operating Income (inc. TAP) 949,229,608 732,010,680 1,170,213,237 29.7% 1,795,693,698 1,862,539,209 2,282,961,827 -3.6%
NOI margin (inc. TAP) 80.6% 81.4% 81.3% (73.7) 81.5% 81.1% 81.5% 38.4
Net Operating Income (exc. TAP) 870,786,502 633,736,661 1,061,671,379 37.4% 1,630,968,911 1,669,620,662 2,071,390,222 -2.3%
NOI margin (exc. TAP) 79.2% 79.1% 79.8% 16.6 80.0% 79.4% 79.9% 62.17
Advisory Fee 160,663,468 158,793,960 155,022,961 1.2% 321,058,785 317,666,644 310,413,973 1.1%
Administration Expenses 31,086,708 30,864,200 30,068,662 0.7% 55,495,011 59,250,443 55,571,078 -6.3%
EBITDA (inc. TAP) 757,479,433 542,352,521 985,121,614 39.7% 1,419,139,902 1,485,622,123 1,916,976,777 -4.5%
EBITDA margin (inc. TAP) 64.3% 60.3% 68.4% 405.6 64.4% 64.7% 68.4% - 29.1
EBITDA (exc. TAP) 679,036,327 444,078,502 876,579,757 52.9% 1,254,415,115 1,292,703,575 1,705,405,172 -3.0%
EBITDA margin (exc. TAP) 61.8% 55.4% 65.8% 638.1 61.5% 61.5% 65.8% 7.1
Interest income 3,380,061 2,955,542 16,730,643 14.4% 6,337,534 11,961,021 36,051,833 -47.0%
Interest expense 87,142,954 86,040,547 105,788,945 1.3% 172,563,261 175,121,409 210,485,794 -1.5%
Exchange rate gain - net (3,579,853) (2,246,252) (7,779,823) 59.4% 15,632,420 19,325,176 (16,922,596) -19.1%
Adjustments to fair value of Investment Properties - net (14,414,334) - (109,336,317) NA (14,414,334) - (59,875,901) NA
Net Income 655,722,353 457,021,263 778,947,173 43.5% 1,254,132,261 1,341,786,911 1,665,744,319 -6.5%
Exchange rate gain - net (2,804,528) 6,146,722 (10,386,457) -145.6% 12,306,126 29,268,266 (19,283,013) -58.0%
Adjustments to fair value of investment properties - Net (14,414,334) - (109,336,317) NA (14,414,334) - (59,875,901) NA
Bad debt estimate (6,246,594) - - NA (6,246,594) - - NA
FFO 679,187,810 450,874,541 898,669,947 50.6% 1,262,487,062 1,312,518,645 1,744,903,233 -3.8%
Net Tenant Admission Payments (56,894,364) (91,964,076) (56,531,921) -38.1%% (123,550,123) (146,323,307) (93,873,938) -15.6%
Net anticipated rents (3,056,231) 3,397,052 (3,226,521) -190.0% 43,306,424 61,976,123 (14,232,680) -30.1%
Net straight-line effect 5,455,269 6,840,999 (623,733) -20.3% 10,298,251 12,105,230 (3,101,783) -14.9%
Net property tax and insurance unaccrued 40,721,718 37,543,137 41,274,890 8.5% (82,599,175) (64,680,642) (79,360,719) 27.7%
Net Advisory and Leasing Admin. Fee 105,216,458 155,380,925 111,253,632 -32.3% 273,094,561 322,556,666 275,209,973 -15.3%
AFFO 770,630,660 562,072,577 990,816,294 37.1% 1,383,037,000 1,498,152,715 1,829,544,086 -7.7%
11
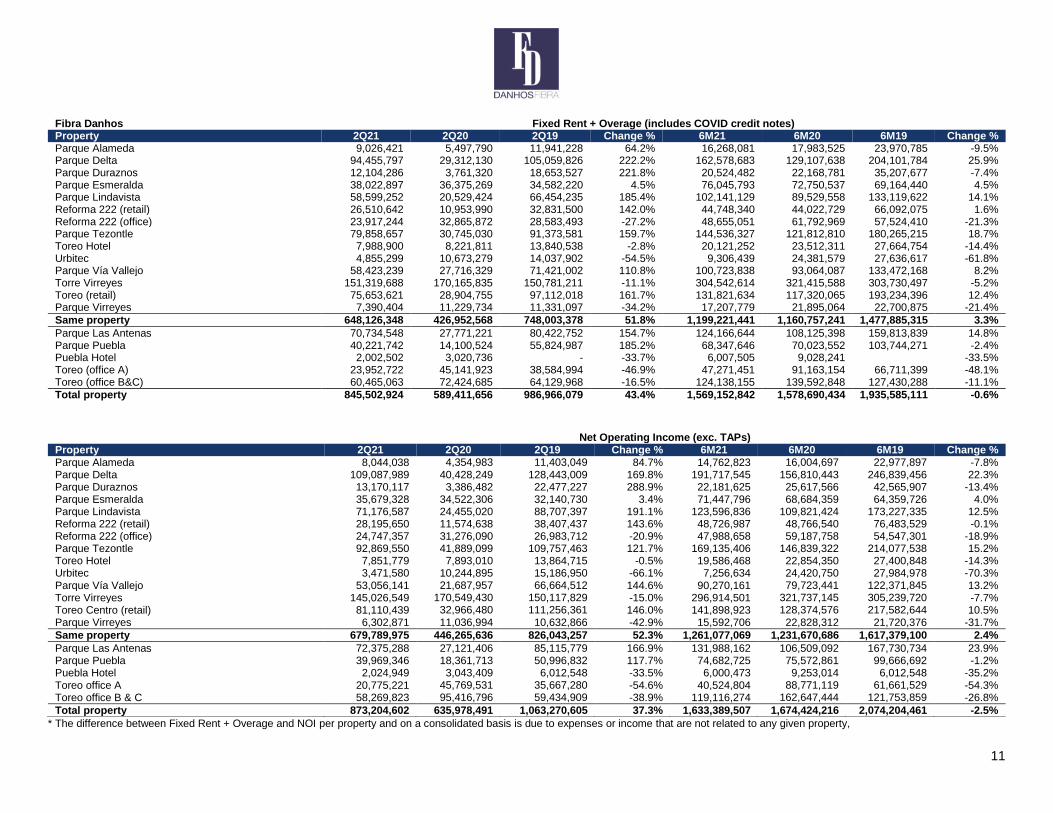
* The difference between Fixed Rent + Overage and NOI per property and on a consolidated basis is due to expenses or income that are not related to any given property,
Fibra Danhos Fixed Rent + Overage (includes COVID credit notes) Property 2Q21 2Q20 2Q19 Change % 6M21 6M20 6M19 Change % Parque Alameda 9,026,421 5,497,790 11,941,228 64.2% 16,268,081 17,983,525 23,970,785 -9.5% Parque Delta 94,455,797 29,312,130 105,059,826 222.2% 162,578,683 129,107,638 204,101,784 25.9% Parque Duraznos 12,104,286 3,761,320 18,653,527 221.8% 20,524,482 22,168,781 35,207,677 -7.4% Parque Esmeralda 38,022,897 36,375,269 34,582,220 4.5% 76,045,793 72,750,537 69,164,440 4.5% Parque Lindavista 58,599,252 20,529,424 66,454,235 185.4% 102,141,129 89,529,558 133,119,622 14.1% Reforma 222 (retail) 26,510,642 10,953,990 32,831,500 142.0% 44,748,340 44,022,729 66,092,075 1.6% Reforma 222 (office) 23,917,244 32,865,872 28,583,493 -27.2% 48,655,051 61,792,969 57,524,410 -21.3% Parque Tezontle 79,858,657 30,745,030 91,373,581 159.7% 144,536,327 121,812,810 180,265,215 18.7% Toreo Hotel 7,988,900 8,221,811 13,840,538 -2.8% 20,121,252 23,512,311 27,664,754 -14.4% Urbitec 4,855,299 10,673,279 14,037,902 -54.5% 9,306,439 24,381,579 27,636,617 -61.8% Parque Vía Vallejo 58,423,239 27,716,329 71,421,002 110.8% 100,723,838 93,064,087 133,472,168 8.2% Torre Virreyes 151,319,688 170,165,835 150,781,211 -11.1% 304,542,614 321,415,588 303,730,497 -5.2% Toreo (retail) 75,653,621 28,904,755 97,112,018 161.7% 131,821,634 117,320,065 193,234,396 12.4% Parque Virreyes 7,390,404 11,229,734 11,331,097 -34.2% 17,207,779 21,895,064 22,700,875 -21.4%
Same property 648,126,348 426,952,568 748,003,378 51.8% 1,199,221,441 1,160,757,241 1,477,885,315 3.3%
Parque Las Antenas 70,734,548 27,771,221 80,422,752 154.7% 124,166,644 108,125,398 159,813,839 14.8% Parque Puebla 40,221,742 14,100,524 55,824,987 185.2% 68,347,646 70,023,552 103,744,271 -2.4% Puebla Hotel 2,002,502 3,020,736 - -33.7% 6,007,505 9,028,241 -33.5% Toreo (office A) 23,952,722 45,141,923 38,584,994 -46.9% 47,271,451 91,163,154 66,711,399 -48.1% Toreo (office B&C) 60,465,063 72,424,685 64,129,968 -16.5% 124,138,155 139,592,848 127,430,288 -11.1%
Total property 845,502,924 589,411,656 986,966,079 43.4% 1,569,152,842 1,578,690,434 1,935,585,111 -0.6%
Fibra Danhos
Net Operating Income (exc. TAPs) Property 2Q21 2Q20 2Q19 Change % 6M21 6M20 6M19 Change %
Parque Alameda 8,044,038 4,354,983 11,403,049 84.7% 14,762,823 16,004,697 22,977,897 -7.8% Parque Delta 109,087,989 40,428,249 128,443,009 169.8% 191,717,545 156,810,443 246,839,456 22.3% Parque Duraznos 13,170,117 3,386,482 22,477,227 288.9% 22,181,625 25,617,566 42,565,907 -13.4% Parque Esmeralda 35,679,328 34,522,306 32,140,730 3.4% 71,447,796 68,684,359 64,359,726 4.0% Parque Lindavista 71,176,587 24,455,020 88,707,397 191.1% 123,596,836 109,821,424 173,227,335 12.5% Reforma 222 (retail) 28,195,650 11,574,638 38,407,437 143.6% 48,726,987 48,766,540 76,483,529 -0.1% Reforma 222 (office) 24,747,357 31,276,090 26,983,712 -20.9% 47,988,658 59,187,758 54,547,301 -18.9% Parque Tezontle 92,869,550 41,889,099 109,757,463 121.7% 169,135,406 146,839,322 214,077,538 15.2% Toreo Hotel 7,851,779 7,893,010 13,864,715 -0.5% 19,586,468 22,854,350 27,400,848 -14.3% Urbitec 3,471,580 10,244,895 15,186,950 -66.1% 7,256,634 24,420,750 27,984,978 -70.3% Parque Vía Vallejo 53,056,141 21,687,957 66,664,512 144.6% 90,270,161 79,723,441 122,371,845 13.2% Torre Virreyes 145,026,549 170,549,430 150,117,829 -15.0% 296,914,501 321,737,145 305,239,720 -7.7% Toreo Centro (retail) 81,110,439 32,966,480 111,256,361 146.0% 141,898,923 128,374,576 217,582,644 10.5% Parque Virreyes 6,302,871 11,036,994 10,632,866 -42.9% 15,592,706 22,828,312 21,720,376 -31.7%
Same property 679,789,975 446,265,636 826,043,257 52.3% 1,261,077,069 1,231,670,686 1,617,379,100 2.4%
Parque Las Antenas 72,375,288 27,121,406 85,115,779 166.9% 131,988,162 106,509,092 167,730,734 23.9% Parque Puebla 39,969,346 18,361,713 50,996,832 117.7% 74,682,725 75,572,861 99,666,692 -1.2% Puebla Hotel 2,024,949 3,043,409 6,012,548 -33.5% 6,000,473 9,253,014 6,012,548 -35.2% Toreo office A 20,775,221 45,769,531 35,667,280 -54.6% 40,524,804 88,771,119 61,661,529 -54.3% Toreo office B & C 58,269,823 95,416,796 59,434,909 -38.9% 119,116,274 162,647,444 121,753,859 -26.8%
Total property 873,204,602 635,978,491 1,063,270,605 37.3% 1,633,389,507 1,674,424,216 2,074,204,461 -2.5%
12
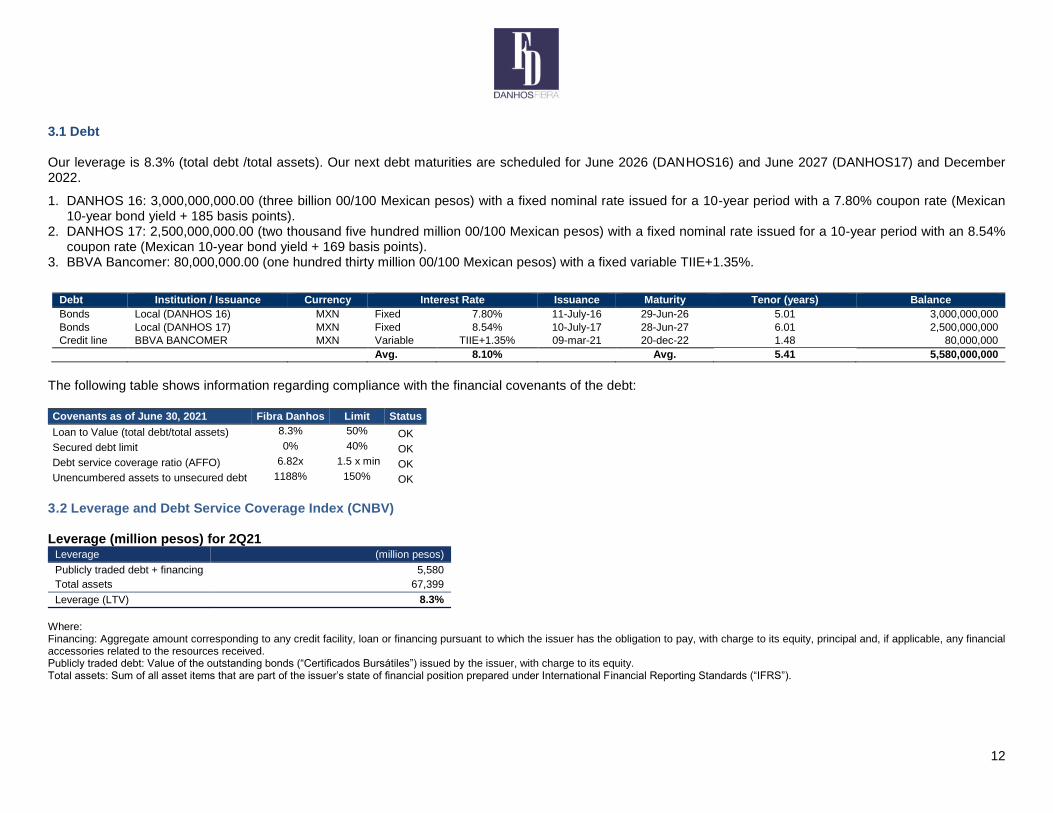
3.1 Debt Our leverage is 8.3% (total debt /total assets). Our next debt maturities are scheduled for June 2026 (DANHOS16) and June 2027 (DANHOS17) and December 2022.
1. DANHOS 16: 3,000,000,000.00 (three billion 00/100 Mexican pesos) with a fixed nominal rate issued for a 10-year period with a 7.80% coupon rate (Mexican 10-year bond yield + 185 basis points).
2. DANHOS 17: 2,500,000,000.00 (two thousand five hundred million 00/100 Mexican pesos) with a fixed nominal rate issued for a 10-year period with an 8.54% coupon rate (Mexican 10-year bond yield + 169 basis points).
3. BBVA Bancomer: 80,000,000.00 (one hundred thirty million 00/100 Mexican pesos) with a fixed variable TIIE+1.35%.
Debt Institution / Issuance Currency Interest Rate Issuance Maturity Tenor (years) Balance
Bonds Local (DANHOS 16) MXN Fixed 7.80% 11-July-16 29-Jun-26 5.01 3,000,000,000
Bonds Local (DANHOS 17) MXN Fixed 8.54% 10-July-17 28-Jun-27 6.01 2,500,000,000
Credit line BBVA BANCOMER MXN Variable TIIE+1.35% 09-mar-21 20-dec-22 1.48 80,000,000
Avg. 8.10% Avg. 5.41 5,580,000,000
The following table shows information regarding compliance with the financial covenants of the debt: Covenants as of June 30, 2021 Fibra Danhos Limit Status
Loan to Value (total debt/total assets) 8.3% 50% OK
Secured debt limit 0% 40% OK
Debt service coverage ratio (AFFO) 6.82x 1.5 x min OK
Unencumbered assets to unsecured debt 1188% 150% OK
3.2 Leverage and Debt Service Coverage Index (CNBV) Leverage (million pesos) for 2Q21
Leverage (million pesos)
Publicly traded debt + financing 5,580
Total assets 67,399
Leverage (LTV) 8.3%
Where: Financing: Aggregate amount corresponding to any credit facility, loan or financing pursuant to which the issuer has the obligation to pay, with charge to its equity, principal and, if applicable, any financial accessories related to the resources received. Publicly traded debt: Value of the outstanding bonds (“Certificados Bursátiles”) issued by the issuer, with charge to its equity. Total assets: Sum of all asset items that are part of the issuer’s state of financial position prepared under International Financial Reporting Standards (“IFRS”).
13
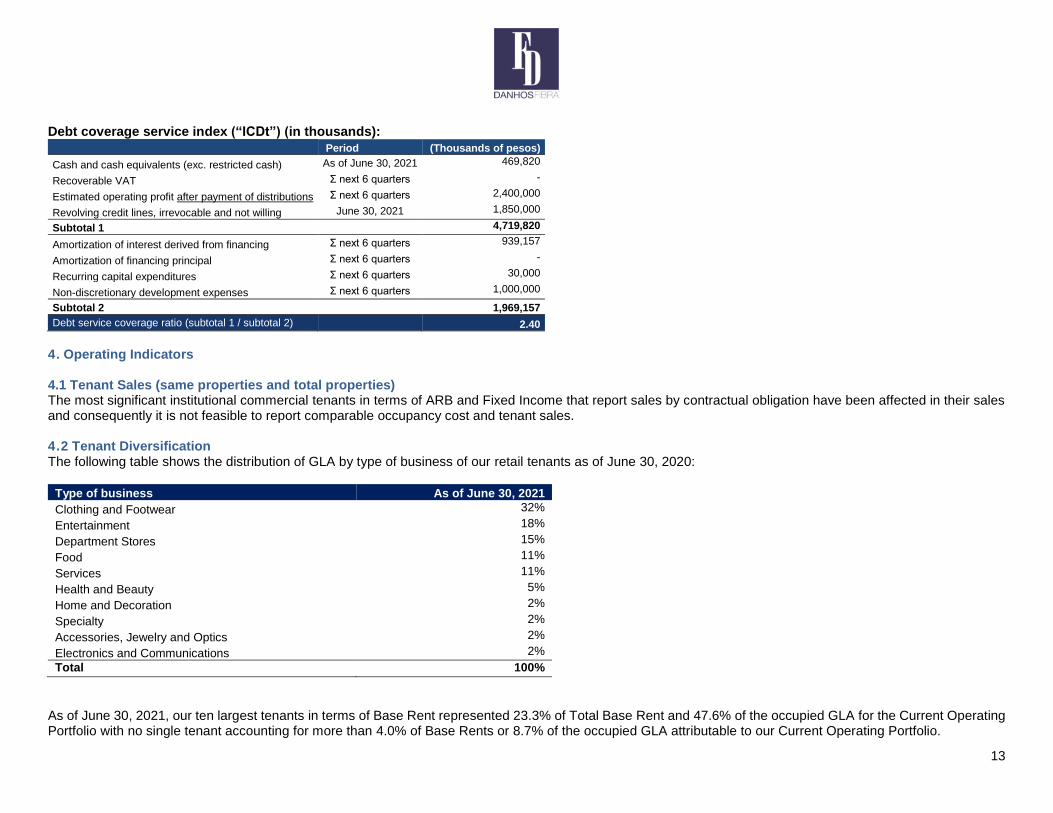
Debt coverage service index (“ICDt”) (in thousands):
Period (Thousands of pesos)
Cash and cash equivalents (exc. restricted cash) As of June 30, 2021 469,820
Recoverable VAT Σ next 6 quarters -
Estimated operating profit after payment of distributions Σ next 6 quarters 2,400,000
Revolving credit lines, irrevocable and not willing June 30, 2021 1,850,000
Subtotal 1 4,719,820
Amortization of interest derived from financing Σ next 6 quarters 939,157
Amortization of financing principal Σ next 6 quarters -
Recurring capital expenditures Σ next 6 quarters 30,000
Non-discretionary development expenses Σ next 6 quarters 1,000,000
Subtotal 2 1,969,157
Debt service coverage ratio (subtotal 1 / subtotal 2) 2.40
4. Operating Indicators 4.1 Tenant Sales (same properties and total properties) The most significant institutional commercial tenants in terms of ARB and Fixed Income that report sales by contractual obligation have been affected in their sales and consequently it is not feasible to report comparable occupancy cost and tenant sales. 4.2 Tenant Diversification The following table shows the distribution of GLA by type of business of our retail tenants as of June 30, 2020:
Type of business As of June 30, 2021
Clothing and Footwear 32%
Entertainment 18%
Department Stores 15%
Food 11%
Services 11%
Health and Beauty 5%
Home and Decoration 2%
Specialty 2%
Accessories, Jewelry and Optics 2%
Electronics and Communications 2%
Total 100%
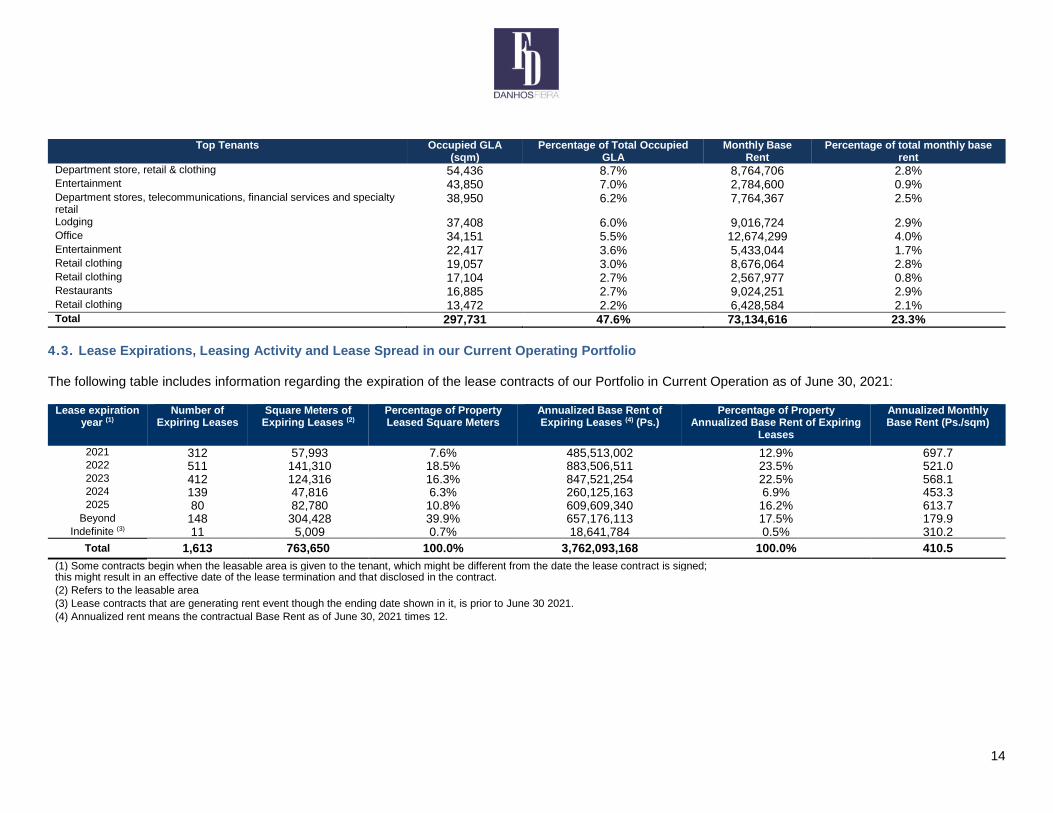
As of June 30, 2021, our ten largest tenants in terms of Base Rent represented 23.3% of Total Base Rent and 47.6% of the occupied GLA for the Current Operating Portfolio with no single tenant accounting for more than 4.0% of Base Rents or 8.7% of the occupied GLA attributable to our Current Operating Portfolio.
14
Top Tenants Occupied GLA
(sqm) Percentage of Total Occupied
GLA Monthly Base
Rent Percentage of total monthly base
rent Department store, retail & clothing 54,436 8.7% 8,764,706 2.8% Entertainment 43,850 7.0% 2,784,600 0.9% Department stores, telecommunications, financial services and specialty retail
38,950 6.2% 7,764,367 2.5%
Lodging 37,408 6.0% 9,016,724 2.9% Office 34,151 5.5% 12,674,299 4.0% Entertainment 22,417 3.6% 5,433,044 1.7% Retail clothing 19,057 3.0% 8,676,064 2.8% Retail clothing 17,104 2.7% 2,567,977 0.8% Restaurants 16,885 2.7% 9,024,251 2.9% Retail clothing 13,472 2.2% 6,428,584 2.1%
Total 297,731 47.6% 73,134,616 23.3%
4.3. Lease Expirations, Leasing Activity and Lease Spread in our Current Operating Portfolio The following table includes information regarding the expiration of the lease contracts of our Portfolio in Current Operation as of June 30, 2021:
Lease expiration year (1)
Number of Expiring Leases
Square Meters of Expiring Leases (2)
Percentage of Property Leased Square Meters
Annualized Base Rent of Expiring Leases (4) (Ps.)
Percentage of Property Annualized Base Rent of Expiring
Leases
Annualized Monthly Base Rent (Ps./sqm)
2021 312 57,993 7.6% 485,513,002 12.9% 697.7 2022 511 141,310 18.5% 883,506,511 23.5% 521.0 2023 412 124,316 16.3% 847,521,254 22.5% 568.1 2024 139 47,816 6.3% 260,125,163 6.9% 453.3 2025 80 82,780 10.8% 609,609,340 16.2% 613.7
Beyond 148 304,428 39.9% 657,176,113 17.5% 179.9 Indefinite (3) 11 5,009 0.7% 18,641,784 0.5% 310.2
Total 1,613 763,650 100.0% 3,762,093,168 100.0% 410.5
(1) Some contracts begin when the leasable area is given to the tenant, which might be different from the date the lease contract is signed; this might result in an effective date of the lease termination and that disclosed in the contract.
(2) Refers to the leasable area
(3) Lease contracts that are generating rent event though the ending date shown in it, is prior to June 30 2021.
(4) Annualized rent means the contractual Base Rent as of June 30, 2021 times 12.
15
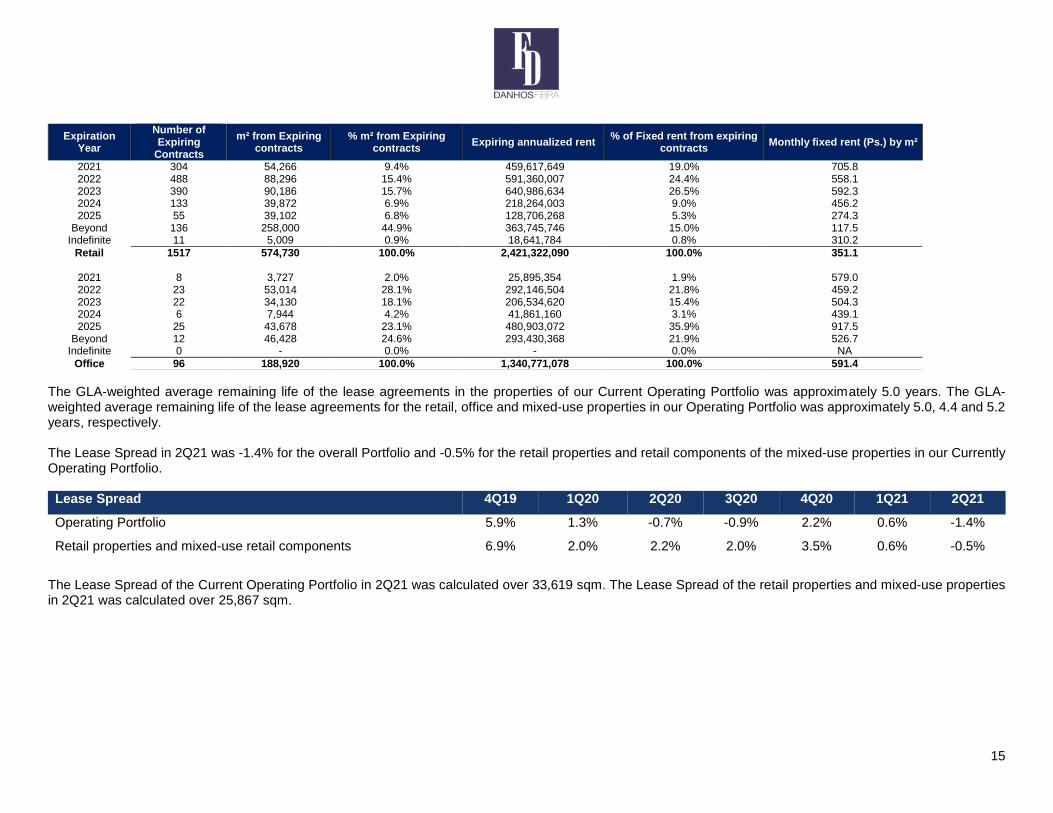
The GLA-weighted average remaining life of the lease agreements in the properties of our Current Operating Portfolio was approximately 5.0 years. The GLA-weighted average remaining life of the lease agreements for the retail, office and mixed-use properties in our Operating Portfolio was approximately 5.0, 4.4 and 5.2 years, respectively. The Lease Spread in 2Q21 was -1.4% for the overall Portfolio and -0.5% for the retail properties and retail components of the mixed-use properties in our Currently Operating Portfolio. Lease Spread 4Q19 1Q20 2Q20 3Q20 4Q20 1Q21 2Q21
Operating Portfolio 5.9% 1.3% -0.7% -0.9% 2.2% 0.6% -1.4%
Retail properties and mixed-use retail components 6.9% 2.0% 2.2% 2.0% 3.5% 0.6% -0.5%
The Lease Spread of the Current Operating Portfolio in 2Q21 was calculated over 33,619 sqm. The Lease Spread of the retail properties and mixed-use properties in 2Q21 was calculated over 25,867 sqm.
Expiration Year
Number of Expiring
Contracts
m² from Expiring contracts
% m² from Expiring contracts
Expiring annualized rent % of Fixed rent from expiring
contracts Monthly fixed rent (Ps.) by m²
2021 304 54,266 9.4% 459,617,649 19.0% 705.8 2022 488 88,296 15.4% 591,360,007 24.4% 558.1 2023 390 90,186 15.7% 640,986,634 26.5% 592.3 2024 133 39,872 6.9% 218,264,003 9.0% 456.2 2025 55 39,102 6.8% 128,706,268 5.3% 274.3
Beyond 136 258,000 44.9% 363,745,746 15.0% 117.5 Indefinite 11 5,009 0.9% 18,641,784 0.8% 310.2
Retail 1517 574,730 100.0% 2,421,322,090 100.0% 351.1
2021 8 3,727 2.0% 25,895,354 1.9% 579.0 2022 23 53,014 28.1% 292,146,504 21.8% 459.2 2023 22 34,130 18.1% 206,534,620 15.4% 504.3 2024 6 7,944 4.2% 41,861,160 3.1% 439.1 2025 25 43,678 23.1% 480,903,072 35.9% 917.5
Beyond 12 46,428 24.6% 293,430,368 21.9% 526.7 Indefinite 0 - 0.0% - 0.0% NA
Office 96 188,920 100.0% 1,340,771,078 100.0% 591.4
16
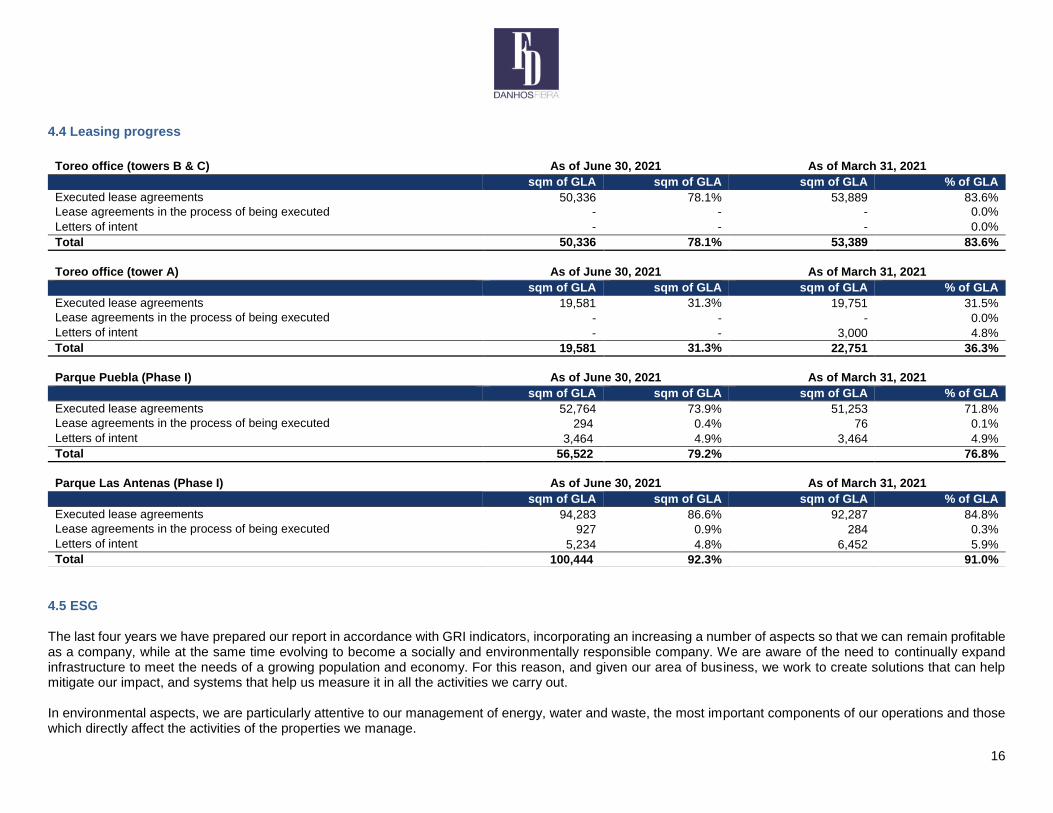
4.4 Leasing progress
4.5 ESG The last four years we have prepared our report in accordance with GRI indicators, incorporating an increasing a number of aspects so that we can remain profitable as a company, while at the same time evolving to become a socially and environmentally responsible company. We are aware of the need to continually expand infrastructure to meet the needs of a growing population and economy. For this reason, and given our area of business, we work to create solutions that can help mitigate our impact, and systems that help us measure it in all the activities we carry out. In environmental aspects, we are particularly attentive to our management of energy, water and waste, the most important components of our operations and those which directly affect the activities of the properties we manage.
Toreo office (towers B & C) As of June 30, 2021 As of March 31, 2021
sqm of GLA sqm of GLA sqm of GLA % of GLA
Executed lease agreements 50,336 78.1% 53,889 83.6%
Lease agreements in the process of being executed - - - 0.0%
Letters of intent - - - 0.0%
Total 50,336 78.1% 53,389 83.6%
Toreo office (tower A) As of June 30, 2021 As of March 31, 2021
sqm of GLA sqm of GLA sqm of GLA % of GLA
Executed lease agreements 19,581 31.3% 19,751 31.5%
Lease agreements in the process of being executed - - - 0.0%
Letters of intent - - 3,000 4.8%
Total 19,581 31.3% 22,751 36.3%
Parque Puebla (Phase I) As of June 30, 2021 As of March 31, 2021
sqm of GLA sqm of GLA sqm of GLA % of GLA
Executed lease agreements 52,764 73.9% 51,253 71.8%
Lease agreements in the process of being executed 294 0.4% 76 0.1%
Letters of intent 3,464 4.9% 3,464 4.9%
Total 56,522 79.2% 54,793
76.8%
Parque Las Antenas (Phase I) As of June 30, 2021 As of March 31, 2021
sqm of GLA sqm of GLA sqm of GLA % of GLA
Executed lease agreements 94,283 86.6% 92,287 84.8%
Lease agreements in the process of being executed 927 0.9% 284 0.3%
Letters of intent 5,234 4.8% 6,452 5.9%
Total 100,444 92.3% 99,023
91.0%
17
In the area of social responsibility, we create positive impacts by being a profitable company and creating jobs, but we also offer our employees a comprehensive compensation and benefits package that exceeds the regulatory minimum, and with this we try to attract and retain the best talent and help improve their quality of life. In addition to competitive salaries, we offer benefits beyond what the law requires. On the matter of corporate governance, we know that this is the framework within all the other elements are managed. Accordingly, we strive to demonstrate a clear and aligned governance structure. We have financial, environmental and social targets, as well as various policies that address each of the material aspects of our management. First, the Code of Ethics, which establishes the foundations for the performance of all members of Fibra Danhos and everyone with whom we have relations. We also have specific policies like Diversity and Inclusion; Occupational Safety; Environmental Protection; anti-corruption; Sustainable Sourcing; Stakeholder Relations and Sustainability; Recruitment, Selection and Hiring of Personnel; and a Supplier policy. In 2018 we obtained the “Green Star” recognition from GRESB (Global Real Estate Sustainability Benchmark), we are pleased to announce that in 2019 we maintained such achievement with a considerable improvement in our score.
We participated in the S&P Sam index rating for our third consecutive year and we are waiting for the results to be announced.
In 2019 we received an upgraded rating from MSCI ESG Ratings from B to BB.
We became members of the UN Global Compact.
We have adopted the AMEFIBRA´s ESG Manual which includes:
Standardization of Metrics.
Elevate the standard of transparency in results.
Make a commitment to the ESG initiative in the FIBRAs sector.
18
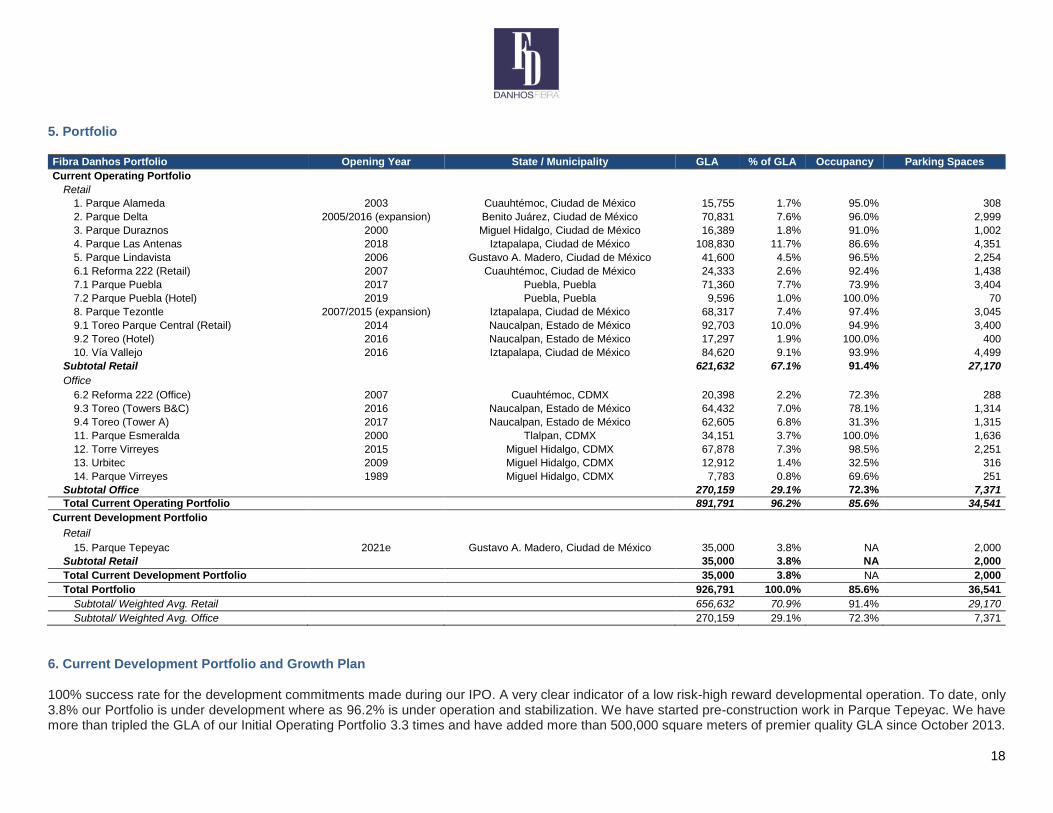
5. Portfolio Fibra Danhos Portfolio Opening Year State / Municipality GLA % of GLA Occupancy Parking Spaces
Current Operating Portfolio
Retail
1. Parque Alameda 2003 Cuauhtémoc, Ciudad de México 15,755 1.7% 95.0% 308
2. Parque Delta 2005/2016 (expansion) Benito Juárez, Ciudad de México 70,831 7.6% 96.0% 2,999
3. Parque Duraznos 2000 Miguel Hidalgo, Ciudad de México 16,389 1.8% 91.0% 1,002
4. Parque Las Antenas 2018 Iztapalapa, Ciudad de México 108,830 11.7% 86.6% 4,351
5. Parque Lindavista 2006 Gustavo A. Madero, Ciudad de México 41,600 4.5% 96.5% 2,254
6.1 Reforma 222 (Retail) 2007 Cuauhtémoc, Ciudad de México 24,333 2.6% 92.4% 1,438
7.1 Parque Puebla 2017 Puebla, Puebla 71,360 7.7% 73.9% 3,404
7.2 Parque Puebla (Hotel) 2019 Puebla, Puebla 9,596 1.0% 100.0% 70
8. Parque Tezontle 2007/2015 (expansion) Iztapalapa, Ciudad de México 68,317 7.4% 97.4% 3,045
9.1 Toreo Parque Central (Retail) 2014 Naucalpan, Estado de México 92,703 10.0% 94.9% 3,400
9.2 Toreo (Hotel) 2016 Naucalpan, Estado de México 17,297 1.9% 100.0% 400
10. Vía Vallejo 2016 Iztapalapa, Ciudad de México 84,620 9.1% 93.9% 4,499
Subtotal Retail 621,632 67.1% 91.4% 27,170
Office 6.2 Reforma 222 (Office) 2007 Cuauhtémoc, CDMX 20,398 2.2% 72.3% 288
9.3 Toreo (Towers B&C) 2016 Naucalpan, Estado de México 64,432 7.0% 78.1% 1,314
9.4 Toreo (Tower A) 2017 Naucalpan, Estado de México 62,605 6.8% 31.3% 1,315
11. Parque Esmeralda 2000 Tlalpan, CDMX 34,151 3.7% 100.0% 1,636
12. Torre Virreyes 2015 Miguel Hidalgo, CDMX 67,878 7.3% 98.5% 2,251
13. Urbitec 2009 Miguel Hidalgo, CDMX 12,912 1.4% 32.5% 316
14. Parque Virreyes 1989 Miguel Hidalgo, CDMX 7,783 0.8% 69.6% 251
Subtotal Office 270,159 29.1% 72.3% 7,371
Total Current Operating Portfolio 891,791 96.2% 85.6% 34,541
Current Development Portfolio Retail
15. Parque Tepeyac 2021e Gustavo A. Madero, Ciudad de México 35,000 3.8% NA 2,000
Subtotal Retail 35,000 3.8% NA 2,000
Total Current Development Portfolio 35,000 3.8% NA 2,000
Total Portfolio 926,791 100.0% 85.6% 36,541
Subtotal/ Weighted Avg. Retail 656,632 70.9% 91.4% 29,170
Subtotal/ Weighted Avg. Office 270,159 29.1% 72.3% 7,371
6. Current Development Portfolio and Growth Plan 100% success rate for the development commitments made during our IPO. A very clear indicator of a low risk-high reward developmental operation. To date, only 3.8% our Portfolio is under development where as 96.2% is under operation and stabilization. We have started pre-construction work in Parque Tepeyac. We have more than tripled the GLA of our Initial Operating Portfolio 3.3 times and have added more than 500,000 square meters of premier quality GLA since October 2013.
19
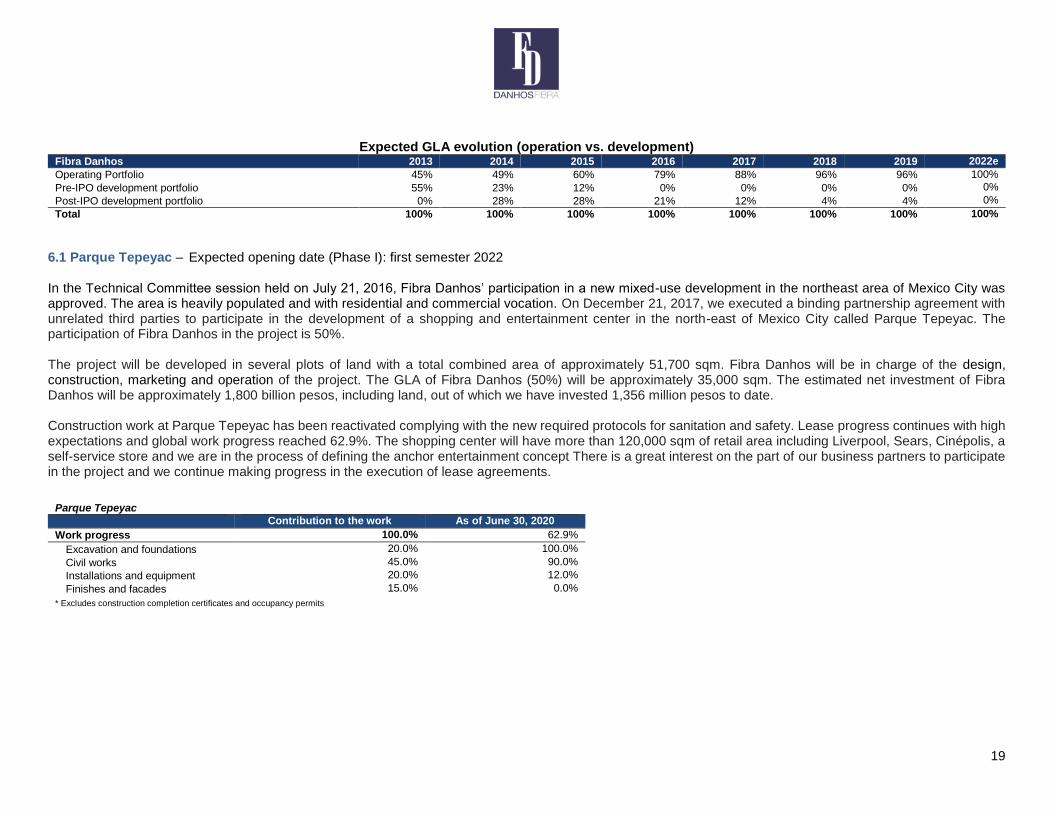
Expected GLA evolution (operation vs. development)
Fibra Danhos 2013 2014 2015 2016 2017 2018 2019 2022e
Operating Portfolio 45% 49% 60% 79% 88% 96% 96% 100%
Pre-IPO development portfolio 55% 23% 12% 0% 0% 0% 0% 0%
Post-IPO development portfolio 0% 28% 28% 21% 12% 4% 4% 0%
Total 100% 100% 100% 100% 100% 100% 100% 100%
6.1 Parque Tepeyac – Expected opening date (Phase I): first semester 2022 In the Technical Committee session held on July 21, 2016, Fibra Danhos’ participation in a new mixed-use development in the northeast area of Mexico City was approved. The area is heavily populated and with residential and commercial vocation. On December 21, 2017, we executed a binding partnership agreement with unrelated third parties to participate in the development of a shopping and entertainment center in the north-east of Mexico City called Parque Tepeyac. The participation of Fibra Danhos in the project is 50%. The project will be developed in several plots of land with a total combined area of approximately 51,700 sqm. Fibra Danhos will be in charge of the design, construction, marketing and operation of the project. The GLA of Fibra Danhos (50%) will be approximately 35,000 sqm. The estimated net investment of Fibra Danhos will be approximately 1,800 billion pesos, including land, out of which we have invested 1,356 million pesos to date. Construction work at Parque Tepeyac has been reactivated complying with the new required protocols for sanitation and safety. Lease progress continues with high expectations and global work progress reached 62.9%. The shopping center will have more than 120,000 sqm of retail area including Liverpool, Sears, Cinépolis, a self-service store and we are in the process of defining the anchor entertainment concept There is a great interest on the part of our business partners to participate in the project and we continue making progress in the execution of lease agreements.
Parque Tepeyac Contribution to the work As of June 30, 2020
Work progress 100.0% 62.9%
Excavation and foundations 20.0% 100.0%
Civil works 45.0% 90.0%
Installations and equipment 20.0% 12.0%
Finishes and facades 15.0% 0.0%
* Excludes construction completion certificates and occupancy permits
20
7. Glossary Adjusted Funds From Operations (AFFO): Result of adjusting FFO by adding or subtracting, as applicable, the following items: (i) subtracting capital expenditures to maintain and improve the quality of assets; (ii) net Tenant Admission Payments, which are composed of Tenant Admission Payments collected in the current period that are unearned and Tenant Admission Payments collected in prior periods accrued in the current period; (iii) net rents collected in advance, which are composed of rents collected in advance in the current period that are unearned and rents collected in advance in prior periods that are accrued in the current period; (iv) net Leasing and net Advisory Fees accrued, which are composed of Leasing and Advisory Fees accrued in advance, Leasing and Advisory Fees accrued in the current period that remain unpaid and Leasing and Advisory Fees from previous periods; (v) adjusting for the straight-line effect (effect of recognizing the amounts of Base Rent, proportionately in straight line throughout the term of lease agreements, no matter the payment method agreed upon with the tenant); (vi) net Property Tax and Insurance expenses, which are composed of un-accrued Property Tax and Insurance expenses from the current period and Property Tax and Insurance expenses that correspond to previous periods. AFFO is a measure of the capacity to generate cash flows.
Base rent: Minimum fixed rent payable by tenants as determined in the lease agreement.
Delinquency Rate: Rental payment delayed beyond 60 days. When it is presented as a percentage, Delinquency Rate is rental payment delayed beyond 60 days as a percentage of annualized Base Rent of the respective period.
Current Development Portfolio: Means the properties and components of properties that are currently under development and/or conclusive phase. (Parque Tepeyac).
Current Operating Portfolio: Means, collectively, the properties that are part of the Initial Operating Portfolio, the retail component of Toreo Parque Central and Torre Virreyes. (Parque Alameda, Parque Delta, Parque Duraznos, Parque Esmeralda, Parque Las Antenas, Parque Lindavista, Reforma 222, Parque Puebla, Hotel Puebla, Parque Tezontle, retail component of Toreo Parque Central, office towers A, B & C of Toreo Parque Central, the hotel in Toreo Parque Central, Parque Vía Vallejo, Urbitec and Parque Virreyes.)
EBITDA: Earnings before interests, taxes, depreciation and amortization. In the case of pro forma financial information of the 9 properties in our Operating Portfolio, the Advisory Fee is subtracted from revenues to calculate EBITDA. In the case of financial information of Fibra Danhos, the Advisory Fee and professional fees to fourth parties, if any, are subtracted from revenues to calculate EBITDA. In any case, EBITDA is calculated before any adjustments relating to changes in the market value of assets reflected in results.
Issued CBFIs: Total stocks issued by the company, including stocks held on treasury as reserves.
Outstanding CBFIs (BMV): Stocks that are currently held or being traded by an investor or company insider.
Economic Rights: Rights of CBFI holders to receive cash distributions, pursuant to the legal documents of Fibra Danhos’ IPO.
Market Cap. Calculation: (Outstanding CBFIs)*(Average Quarterly Closing Price)
Funds From Operations (FFO): As applicable, the result of adding to or subtracting from Net Income adjustments relating to negative or positive changes, respectively, in the market value of assets reflected in results.
Initial Development Portfolio: Means the two properties that were contributed to the Trust for its IPO. (Toreo Parque Central and Torre Virreyes)
Initial Operating Portfolio: Means the nine properties that were contributed to the Trust for its IPO. (Parque Alameda, Parque Delta, Parque Duraznos, Parque Esmeralda, Parque Lindavista, Reforma 222, Parque Tezontle, Urbitec and Parque Virreyes.)
21
Lease Spread: Compares in a given period of time the price per sqm of Fixed Rent of the renewed and new lease agreements with respect to the price per sqm of the expired and terminated lease agreements in the same period of time
Net Income: Result of (i) subtracting from operating revenues (Base Rent, Overage Rent, Tenant Admission Payments, parking revenues, and maintenance, operation, advertising and other revenues) operation and maintenance expenses; property taxes; insurance; Advisory Fee; Leasing Administration Fee; professional fees to fourth parties; net financial revenues/expenses; taxes attributable to the Management Subsidiary; and (ii) adding or subtracting, as applicable, any adjustments relating to changes in the market value of assets reflected in results.
Net Operating Income: Calculated by subtracting operating expenses of the properties (excluding net financial revenues/expenses and the Advisory Fee) from operating revenues of the properties.
Occupancy Cost: In the case of those retail tenants who are the most significant in terms of GLA and Fixed Rent, cost incurred associated to occupying a premise, which consists of Base Rent, Overage Rent and common area maintenance and advertising fees, expressed as a percentage of the corresponding Tenant Sales.
Overage Rent: The difference paid as rent (when positive), between Base Rent and the rent consisting of a percentage of Tenant Sales, as determined in the lease agreements of retail spaces.
Renewal Rate: Result of dividing the gross leasable area of premises that were renewed, by the total gross leasable area of the portfolio.
Rent loss: Rental payment delayed beyond 180 days. When it is presented as a percentage, Rental Loss is rental payment delayed beyond 180 days as a percentage of annualized Base Rent of the respective period.
Tenant Admission Payments: A one-time non-reimbursable payment made to us by some entering tenants in our retail properties and in the retail components of our mixed-use properties. Tenant Admission Payments are usually received at the time of leasing new space or when an expiring lease agreement is not renewed and the corresponding premise is leased to a new entering tenant.
Tenant Sales: Sales generated in the leased premises in a given period for those retail tenants who are the most significant in terms of GLA and Fixed Rent and have a contractual obligation to report sales under their lease agreements.
.
Top Related