


Languages
Pages
Legal


Supplemental InformationFirst Quarter 2006
This information is preliminary and based on company data available at the time of the presentation. It speaks only as
of the particular date or dates included in the accompanying pages. Bank of America does not undertake an obligation
to, and disclaims any duty to, correct or update any of the information provided. Any forward-looking statements in this
information are subject to the forward-looking language contained in Bank of America's reports filed with the SEC pursuant
to the Securities Exchange Act of 1934, which are available at the SEC's website (www.sec.gov) or at Bank of America's
website (www.bankofamerica.com). Bank of America's future financial performance is subject to risks and uncertainties as
described in its SEC filings.
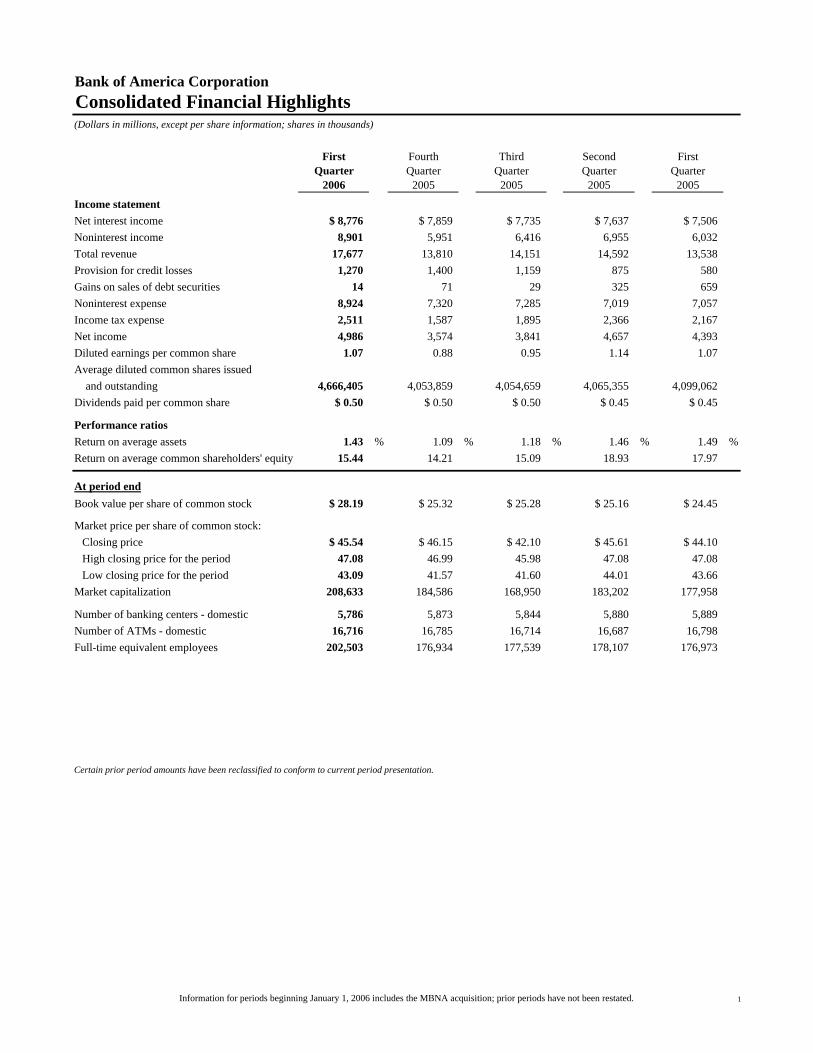
Bank of America Corporation Consolidated Financial Highlights(Dollars in millions, except per share information; shares in thousands)
First Fourth Third Second FirstQuarter Quarter Quarter Quarter Quarter
2006 2005 2005 2005 2005
Income statement Net interest income $ 8,776 $ 7,859 $ 7,735 $ 7,637 $ 7,506Noninterest income 8,901 5,951 6,416 6,955 6,032 Total revenue 17,677 13,810 14,151 14,592 13,538 Provision for credit losses 1,270 1,400 1,159 875 580 Gains on sales of debt securities 14 71 29 325 659 Noninterest expense 8,924 7,320 7,285 7,019 7,057 Income tax expense 2,511 1,587 1,895 2,366 2,167 Net income 4,986 3,574 3,841 4,657 4,393 Diluted earnings per common share 1.07 0.88 0.95 1.14 1.07Average diluted common shares issued and outstanding 4,666,405 4,053,859 4,054,659 4,065,355 4,099,062 Dividends paid per common share $ 0.50 $ 0.50 $ 0.50 $ 0.45 $ 0.45
Performance ratiosReturn on average assets 1.43 % 1.09 % 1.18 % 1.46 % 1.49 %Return on average common shareholders' equity 15.44 14.21 15.09 18.93 17.97
At period endBook value per share of common stock $ 28.19 $ 25.32 $ 25.28 $ 25.16 $ 24.45
Market price per share of common stock:Closing price $ 45.54 $ 46.15 $ 42.10 $ 45.61 $ 44.10High closing price for the period 47.08 46.99 45.98 47.08 47.08 Low closing price for the period 43.09 41.57 41.60 44.01 43.66
Market capitalization 208,633 184,586 168,950 183,202 177,958
Number of banking centers - domestic 5,786 5,873 5,844 5,880 5,889 Number of ATMs - domestic 16,716 16,785 16,714 16,687 16,798 Full-time equivalent employees 202,503 176,934 177,539 178,107 176,973
Certain prior period amounts have been reclassified to conform to current period presentation.
Information for periods beginning January 1, 2006 includes the MBNA acquisition; prior periods have not been restated. 1
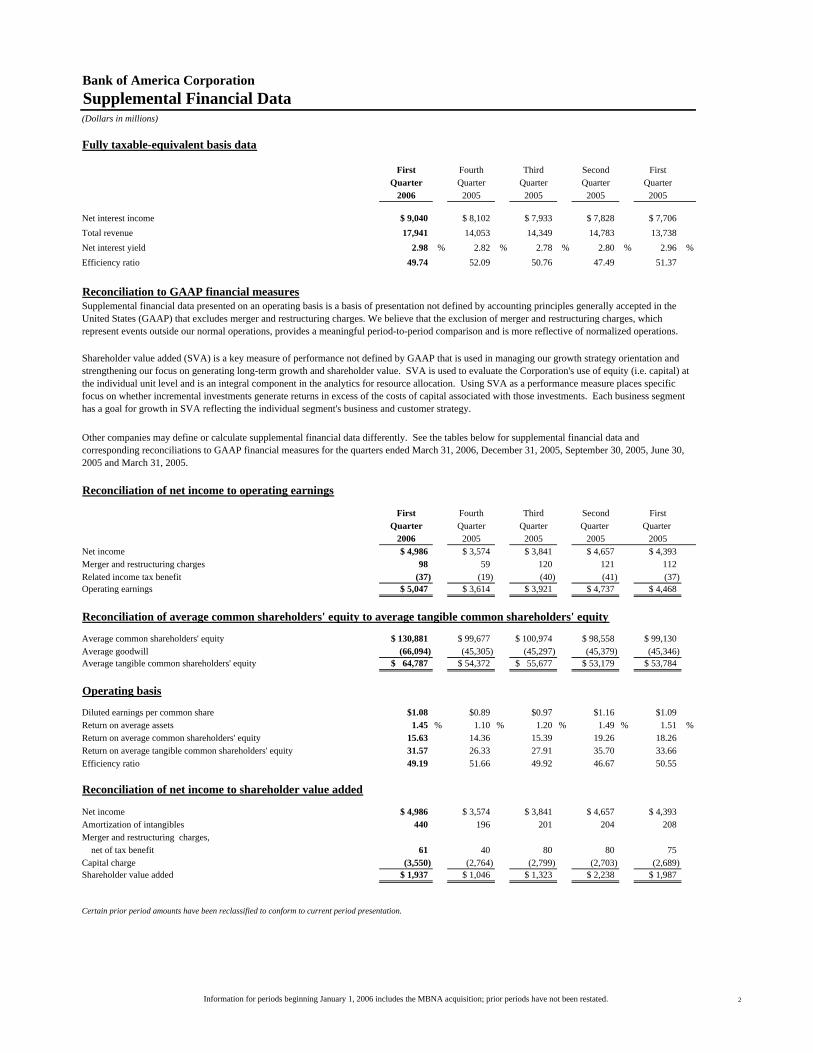
Bank of America Corporation Supplemental Financial Data (Dollars in millions)
Fully taxable-equivalent basis data
First Fourth Third Second FirstQuarter Quarter Quarter Quarter Quarter
2006 2005 2005 2005 2005
Net interest income $ 9,040 $ 8,102 $ 7,933 $ 7,828 $ 7,706Total revenue 17,941 14,053 14,349 14,783 13,738 Net interest yield 2.98 % 2.82 % 2.78 % 2.80 % 2.96 %Efficiency ratio 49.74 52.09 50.76 47.49 51.37
Reconciliation to GAAP financial measures
Reconciliation of net income to operating earnings
First Fourth Third Second FirstQuarter Quarter Quarter Quarter Quarter
2006 2005 2005 2005 2005Net income $ 4,986 $ 3,574 $ 3,841 $ 4,657 $ 4,393Merger and restructuring charges 98 59 120 121 112 Related income tax benefit (37) (19) (40) (41) (37) Operating earnings $ 5,047 $ 3,614 $ 3,921 $ 4,737 $ 4,468
Reconciliation of average common shareholders' equity to average tangible common shareholders' equity
Average common shareholders' equity $ 130,881 $ 99,677 $ 100,974 $ 98,558 $ 99,130Average goodwill (66,094) (45,305) (45,297) (45,379) (45,346) Average tangible common shareholders' equity $ 64,787 $ 54,372 $ 55,677 $ 53,179 $ 53,784
Operating basis
Diluted earnings per common share $1.08 $0.89 $0.97 $1.16 $1.09Return on average assets 1.45 % 1.10 % 1.20 % 1.49 % 1.51 %Return on average common shareholders' equity 15.63 14.36 15.39 19.26 18.26 Return on average tangible common shareholders' equity 31.57 26.33 27.91 35.70 33.66 Efficiency ratio 49.19 51.66 49.92 46.67 50.55
Reconciliation of net income to shareholder value added
Net income $ 4,986 $ 3,574 $ 3,841 $ 4,657 $ 4,393Amortization of intangibles 440 196 201 204 208 Merger and restructuring charges, net of tax benefit 61 40 80 80 75 Capital charge (3,550) (2,764) (2,799) (2,703) (2,689) Shareholder value added $ 1,937 $ 1,046 $ 1,323 $ 2,238 $ 1,987
Certain prior period amounts have been reclassified to conform to current period presentation.
Other companies may define or calculate supplemental financial data differently. See the tables below for supplemental financial data and corresponding reconciliations to GAAP financial measures for the quarters ended March 31, 2006, December 31, 2005, September 30, 2005, June 30, 2005 and March 31, 2005.
Supplemental financial data presented on an operating basis is a basis of presentation not defined by accounting principles generally accepted in the United States (GAAP) that excludes merger and restructuring charges. We believe that the exclusion of merger and restructuring charges, which represent events outside our normal operations, provides a meaningful period-to-period comparison and is more reflective of normalized operations.
Shareholder value added (SVA) is a key measure of performance not defined by GAAP that is used in managing our growth strategy orientation and strengthening our focus on generating long-term growth and shareholder value. SVA is used to evaluate the Corporation's use of equity (i.e. capital) at the individual unit level and is an integral component in the analytics for resource allocation. Using SVA as a performance measure places specific focus on whether incremental investments generate returns in excess of the costs of capital associated with those investments. Each business segment has a goal for growth in SVA reflecting the individual segment's business and customer strategy.
Information for periods beginning January 1, 2006 includes the MBNA acquisition; prior periods have not been restated. 2

Bank of America Corporation
(Dollars in millions, except per share information; shares in thousands)First Fourth Third Second First
Quarter Quarter Quarter Quarter Quarter2006 2005 2005 2005 2005
Interest incomeInterest and fees on loans and leases $ 11,127 $ 9,536 $ 8,933 $ 8,294 $ 8,080Interest and dividends on securities 3,014 2,815 2,793 2,796 2,533 Federal funds sold and securities purchased under agreements to resell 1,709 1,477 1,382 1,249 904 Trading account assets 1,548 1,585 1,550 1,426 1,182 Other interest income 727 605 547 502 437
Total interest income 18,125 16,018 15,205 14,267 13,136 Interest expenseDeposits 3,007 2,476 2,471 2,363 2,182 Short-term borrowings 4,309 3,855 3,190 2,582 1,988 Trading account liabilities 517 619 707 611 427 Long-term debt 1,516 1,209 1,102 1,074 1,033
Total interest expense 9,349 8,159 7,470 6,630 5,630 Net interest income 8,776 7,859 7,735 7,637 7,506 Noninterest incomeService charges 1,901 1,927 2,080 1,920 1,777 Investment and brokerage services 1,103 1,062 1,060 1,049 1,013 Mortgage banking income 137 215 180 189 221 Investment banking income 501 537 522 431 366 Equity investment gains 660 481 668 492 399 Card income 3,436 1,507 1,520 1,437 1,289 Trading account profits 1,074 299 557 222 685 Other income 89 (77) (171) 1,215 282 Total noninterest income 8,901 5,951 6,416 6,955 6,032
Total revenue 17,677 13,810 14,151 14,592 13,538
Provision for credit losses 1,270 1,400 1,159 875 580
Gains on sales of debt securities 14 71 29 325 659
Noninterest expensePersonnel 4,813 3,845 3,837 3,671 3,701 Occupancy 701 699 638 615 636 Equipment 344 305 300 297 297 Marketing 575 265 307 346 337 Professional fees 218 283 254 216 177 Amortization of intangibles 440 196 201 204 208 Data processing 410 394 361 368 364 Telecommunications 220 219 206 196 206 Other general operating 1,105 1,055 1,061 985 1,019 Merger and restructuring charges 98 59 120 121 112
Total noninterest expense 8,924 7,320 7,285 7,019 7,057 Income before income taxes 7,497 5,161 5,736 7,023 6,560 Income tax expense 2,511 1,587 1,895 2,366 2,167 Net income $ 4,986 $ 3,574 $ 3,841 $ 4,657 $ 4,393Net income available to common shareholders $ 4,981 $ 3,570 $ 3,836 $ 4,653 $ 4,388
Per common share informationEarnings $ 1.08 $ 0.89 $ 0.96 $ 1.16 $ 1.09Diluted earnings $ 1.07 $ 0.88 $ 0.95 $ 1.14 $ 1.07Dividends paid $ 0.50 $ 0.50 $ 0.50 $ 0.45 $ 0.45Average common shares issued and outstanding 4,609,481 3,996,024 4,000,573 4,005,356 4,032,550 Average diluted common shares issued and outstanding 4,666,405 4,053,859 4,054,659 4,065,355 4,099,062
Certain prior period amounts have been reclassified to conform to current period presentation.
Consolidated Statement of Income
Information for periods beginning January 1, 2006 includes the MBNA acquisition; prior periods have not been restated. 3
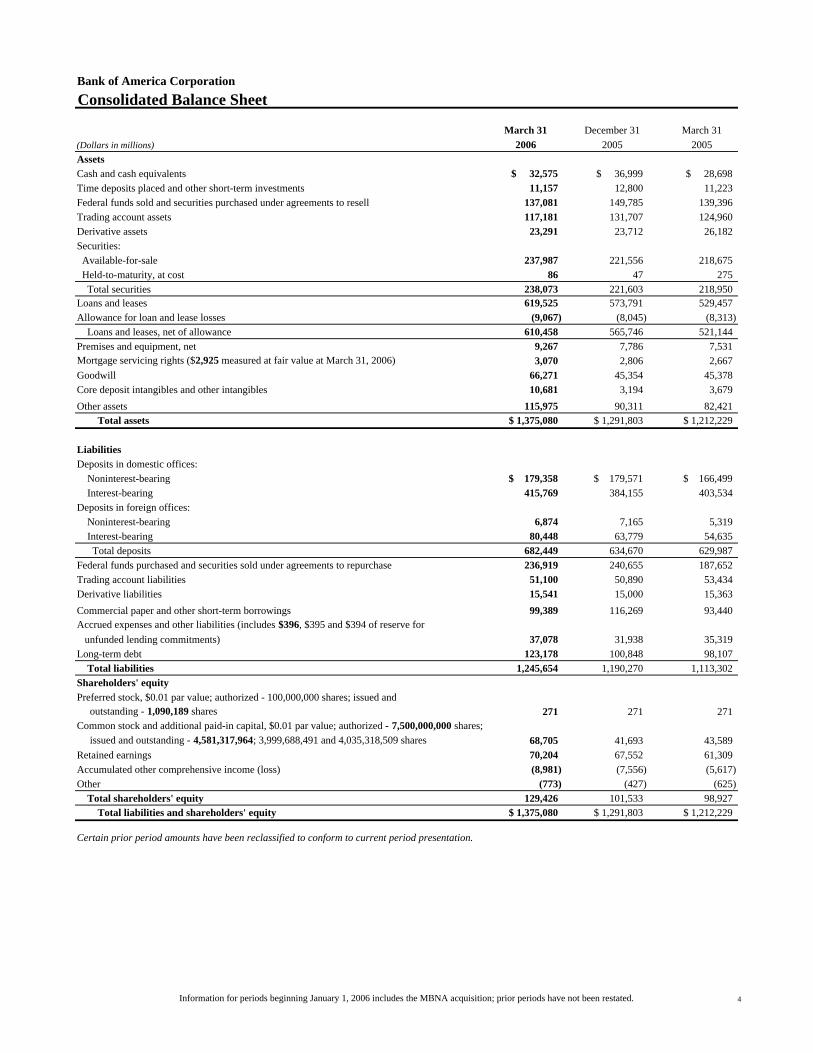
Bank of America CorporationConsolidated Balance Sheet
March 31 December 31 March 31(Dollars in millions) 2006 2005 2005AssetsCash and cash equivalents $ 32,575 $ 36,999 $ 28,698Time deposits placed and other short-term investments 11,157 12,800 11,223 Federal funds sold and securities purchased under agreements to resell 137,081 149,785 139,396 Trading account assets 117,181 131,707 124,960 Derivative assets 23,291 23,712 26,182 Securities: Available-for-sale 237,987 221,556 218,675 Held-to-maturity, at cost 86 47 275 Total securities 238,073 221,603 218,950 Loans and leases 619,525 573,791 529,457 Allowance for loan and lease losses (9,067) (8,045) (8,313) Loans and leases, net of allowance 610,458 565,746 521,144 Premises and equipment, net 9,267 7,786 7,531 Mortgage servicing rights ($2,925 measured at fair value at March 31, 2006) 3,070 2,806 2,667 Goodwill 66,271 45,354 45,378 Core deposit intangibles and other intangibles 10,681 3,194 3,679 Other assets 115,975 90,311 82,421 Total assets $ 1,375,080 $ 1,291,803 $ 1,212,229
LiabilitiesDeposits in domestic offices: Noninterest-bearing $ 179,358 $ 179,571 $ 166,499 Interest-bearing 415,769 384,155 403,534 Deposits in foreign offices: Noninterest-bearing 6,874 7,165 5,319 Interest-bearing 80,448 63,779 54,635 Total deposits 682,449 634,670 629,987 Federal funds purchased and securities sold under agreements to repurchase 236,919 240,655 187,652 Trading account liabilities 51,100 50,890 53,434 Derivative liabilities 15,541 15,000 15,363 Commercial paper and other short-term borrowings 99,389 116,269 93,440 Accrued expenses and other liabilities (includes $396, $395 and $394 of reserve for unfunded lending commitments) 37,078 31,938 35,319 Long-term debt 123,178 100,848 98,107 Total liabilities 1,245,654 1,190,270 1,113,302 Shareholders' equityPreferred stock, $0.01 par value; authorized - 100,000,000 shares; issued and outstanding - 1,090,189 shares 271 271 271 Common stock and additional paid-in capital, $0.01 par value; authorized - 7,500,000,000 shares; issued and outstanding - 4,581,317,964; 3,999,688,491 and 4,035,318,509 shares 68,705 41,693 43,589 Retained earnings 70,204 67,552 61,309 Accumulated other comprehensive income (loss) (8,981) (7,556) (5,617) Other (773) (427) (625) Total shareholders' equity 129,426 101,533 98,927 Total liabilities and shareholders' equity $ 1,375,080 $ 1,291,803 $ 1,212,229
Certain prior period amounts have been reclassified to conform to current period presentation.
Information for periods beginning January 1, 2006 includes the MBNA acquisition; prior periods have not been restated. 4
Bank of America Corporation
First Fourth Third Second First
Quarter Quarter Quarter Quarter Quarter2006(1) 2005 2005 2005 2005
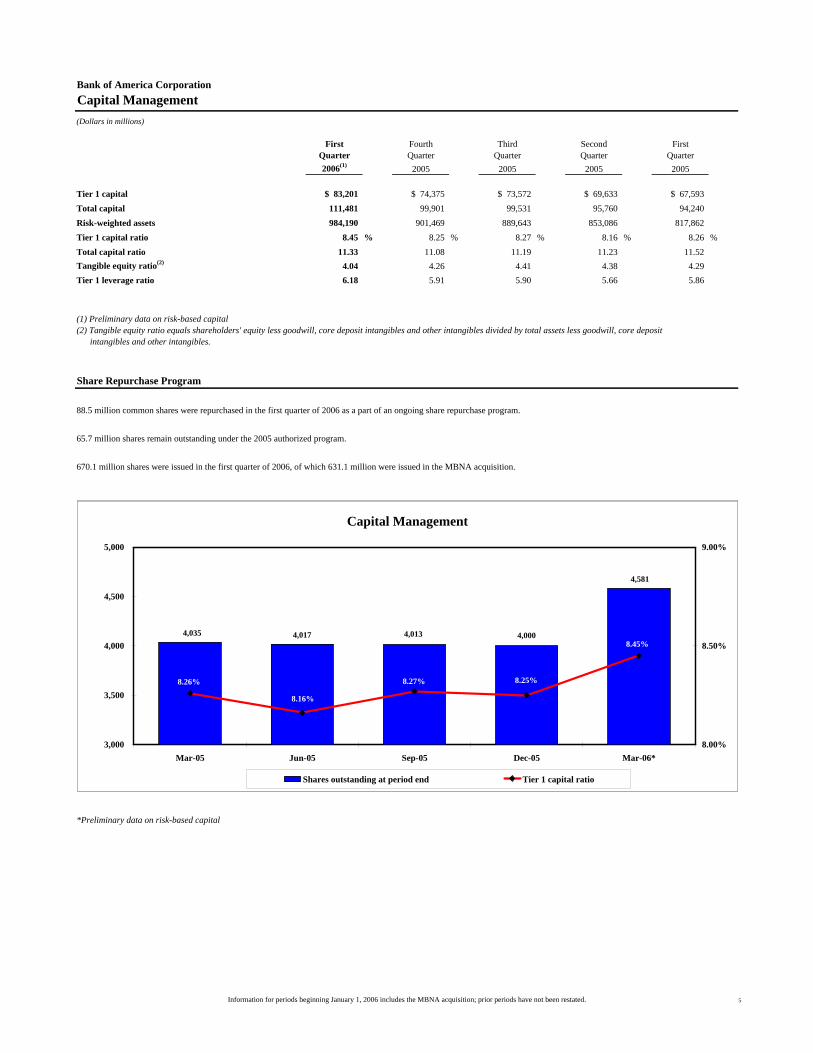
Tier 1 capital $ 83,201 $ 74,375 $ 73,572 $ 69,633 $ 67,593Total capital 111,481 99,901 99,531 95,760 94,240Risk-weighted assets 984,190 901,469 889,643 853,086 817,862Tier 1 capital ratio 8.45 % 8.25 % 8.27 % 8.16 % 8.26 %Total capital ratio 11.33 11.08 11.19 11.23 11.52Tangible equity ratio(2) 4.04 4.26 4.41 4.38 4.29Tier 1 leverage ratio 6.18 5.91 5.90 5.66 5.86
(1) Preliminary data on risk-based capital(2) Tangible equity ratio equals shareholders' equity less goodwill, core deposit intangibles and other intangibles divided by total assets less goodwill, core deposit intangibles and other intangibles.
Share Repurchase Program
88.5 million common shares were repurchased in the first quarter of 2006 as a part of an ongoing share repurchase program.
65.7 million shares remain outstanding under the 2005 authorized program.
670.1 million shares were issued in the first quarter of 2006, of which 631.1 million were issued in the MBNA acquisition.
*Preliminary data on risk-based capital
Capital Management(Dollars in millions)
Capital Management
0.0818.48% 0.0821
0.0806
1,450
1,475
1,500
1,525
1,550
1,575
Dec-04 Mar-05 Jun-05 Sep-05
(Sha
res i
n m
illio
ns)
0.07
0.075
0.08
0.085
0.09
Shares outstanding at period end Tier 1 capital ratio
Capital Management
4,047 4,017
4,013
4,0004,0350.081
0.0821
0.0821
0.0806
0.082
2,800
3,300
3,800
4,300
Dec-04 Mar-05 Jun-05 Sep-05 Dec-05*0.07
0.075
0.08
0.085
Shares outstanding at period end Tier 1 capital ratio
Capital Management
0.0825
8.48%
0.082
0.0773
1,450
1,475
1,500
1,525
1,550
1,575
37865 37956 38047 38139
(Sha
res i
n m
illio
ns)
0.07
0.075
0.08
0.085
0.09
Shares outstanding at period end Tier 1 capital ratio
Capital Management
4,035 4,013 4,000
4,581
4,017
8.26%
8.45%
8.25%8.27%
8.16%
3,000
3,500
4,000
4,500
5,000
Mar-05 Jun-05 Sep-05 Dec-05 Mar-06*8.00%
8.50%
9.00%
Shares outstanding at period end Tier 1 capital ratio
Information for periods beginning January 1, 2006 includes the MBNA acquisition; prior periods have not been restated. 5
Bank of America Corporation
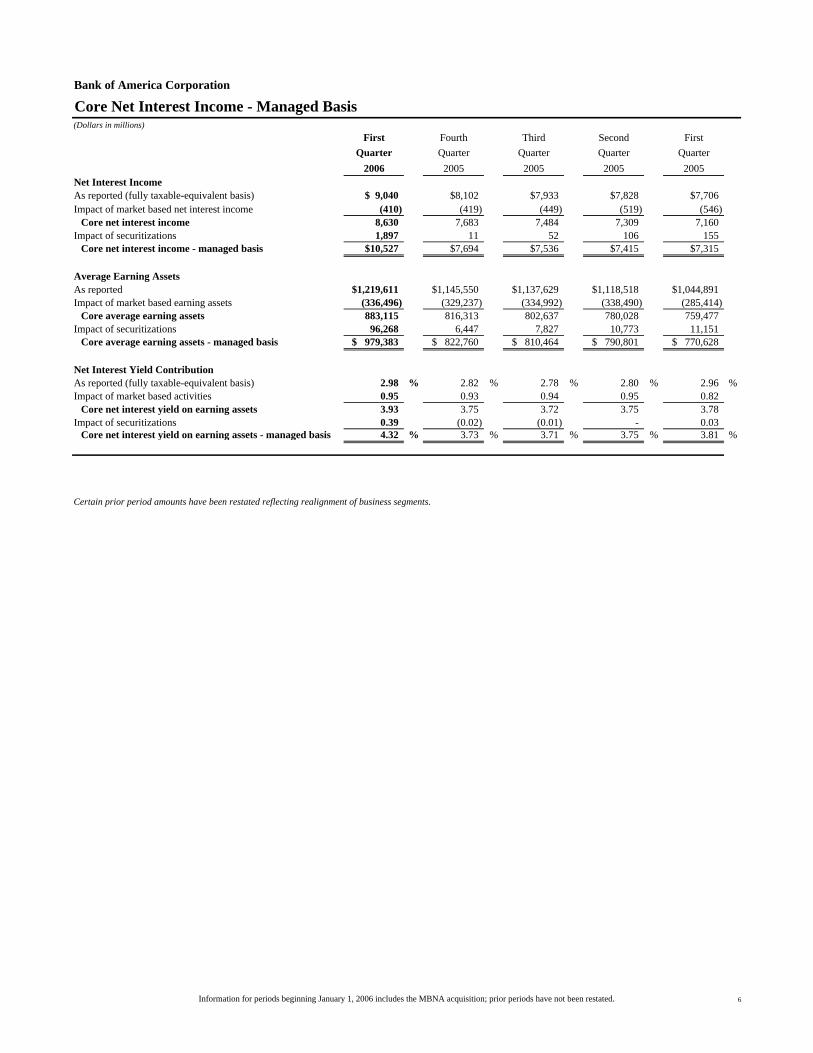
(Dollars in millions)First Fourth Third Second First
Quarter Quarter Quarter Quarter Quarter2006 2005 2005 2005 2005
Net Interest IncomeAs reported (fully taxable-equivalent basis) $ 9,040 $8,102 $7,933 $7,828 $7,706Impact of market based net interest income (410) (419) (449) (519) (546)
Core net interest income 8,630 7,683 7,484 7,309 7,160Impact of securitizations 1,897 11 52 106 155
Core net interest income - managed basis $10,527 $7,694 $7,536 $7,415 $7,315
Average Earning AssetsAs reported $1,219,611 $1,145,550 $1,137,629 $1,118,518 $1,044,891Impact of market based earning assets (336,496) (329,237) (334,992) (338,490) (285,414)
Core average earning assets 883,115 816,313 802,637 780,028 759,477Impact of securitizations 96,268 6,447 7,827 10,773 11,151
Core average earning assets - managed basis $ 979,383 $ 822,760 $ 810,464 $ 790,801 $ 770,628
Net Interest Yield ContributionAs reported (fully taxable-equivalent basis) 2.98 % 2.82 % 2.78 % 2.80 % 2.96 %Impact of market based activities 0.95 0.93 0.94 0.95 0.82
Core net interest yield on earning assets 3.93 3.75 3.72 3.75 3.78 Impact of securitizations 0.39 (0.02) (0.01) - 0.03
Core net interest yield on earning assets - managed basis 4.32 % 3.73 % 3.71 % 3.75 % 3.81 %
Certain prior period amounts have been restated reflecting realignment of business segments.
Core Net Interest Income - Managed Basis
Information for periods beginning January 1, 2006 includes the MBNA acquisition; prior periods have not been restated. 6
Bank of America Corporation
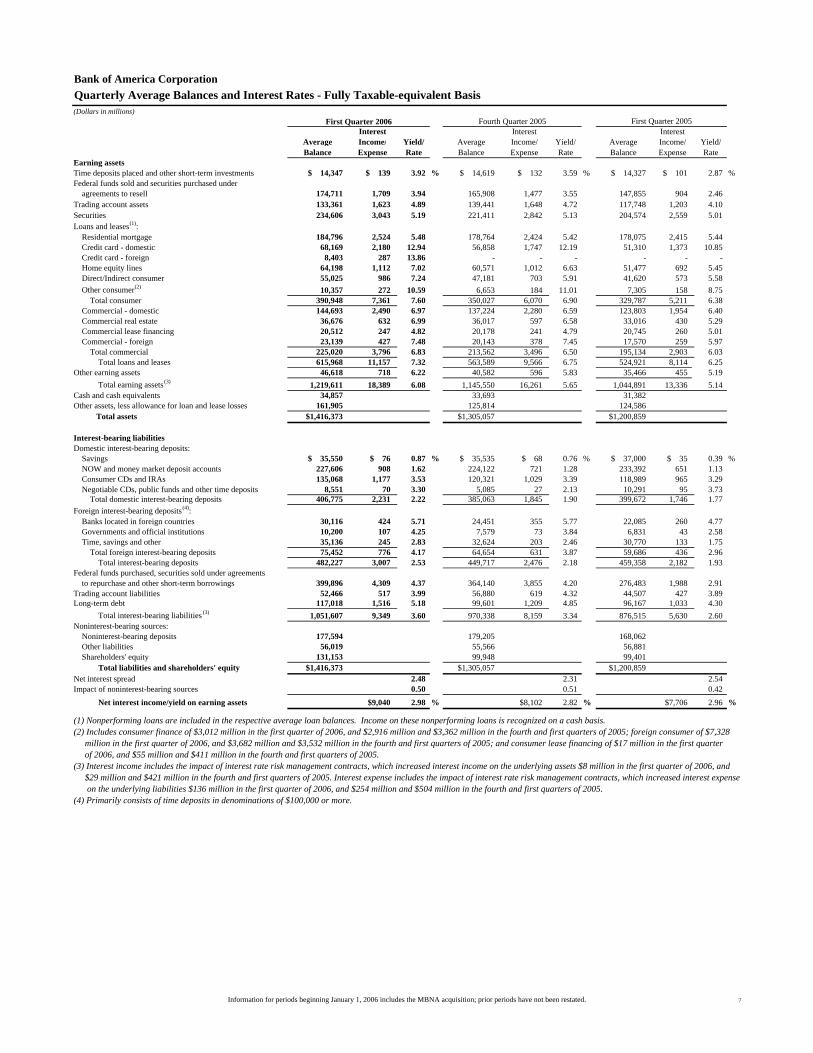
(Dollars in millions)
Interest Interest InterestAverage Income/ Yield/ Average Income/ Yield/ Average Income/ Yield/Balance Expense Rate Balance Expense Rate Balance Expense Rate
Earning assetsTime deposits placed and other short-term investments $ 14,347 $ 139 3.92 % $ 14,619 $ 132 3.59 % $ 14,327 $ 101 2.87 %Federal funds sold and securities purchased under agreements to resell 174,711 1,709 3.94 165,908 1,477 3.55 147,855 904 2.46Trading account assets 133,361 1,623 4.89 139,441 1,648 4.72 117,748 1,203 4.10Securities 234,606 3,043 5.19 221,411 2,842 5.13 204,574 2,559 5.01Loans and leases(1): Residential mortgage 184,796 2,524 5.48 178,764 2,424 5.42 178,075 2,415 5.44 Credit card - domestic 68,169 2,180 12.94 56,858 1,747 12.19 51,310 1,373 10.85 Credit card - foreign 8,403 287 13.86 - - - - - - Home equity lines 64,198 1,112 7.02 60,571 1,012 6.63 51,477 692 5.45 Direct/Indirect consumer 55,025 986 7.24 47,181 703 5.91 41,620 573 5.58 Other consumer(2) 10,357 272 10.59 6,653 184 11.01 7,305 158 8.75 Total consumer 390,948 7,361 7.60 350,027 6,070 6.90 329,787 5,211 6.38 Commercial - domestic 144,693 2,490 6.97 137,224 2,280 6.59 123,803 1,954 6.40 Commercial real estate 36,676 632 6.99 36,017 597 6.58 33,016 430 5.29 Commercial lease financing 20,512 247 4.82 20,178 241 4.79 20,745 260 5.01 Commercial - foreign 23,139 427 7.48 20,143 378 7.45 17,570 259 5.97 Total commercial 225,020 3,796 6.83 213,562 3,496 6.50 195,134 2,903 6.03 Total loans and leases 615,968 11,157 7.32 563,589 9,566 6.75 524,921 8,114 6.25Other earning assets 46,618 718 6.22 40,582 596 5.83 35,466 455 5.19 Total earning assets(3) 1,219,611 18,389 6.08 1,145,550 16,261 5.65 1,044,891 13,336 5.14Cash and cash equivalents 34,857 33,693 31,382Other assets, less allowance for loan and lease losses 161,905 125,814 124,586 Total assets $1,416,373 $1,305,057 $1,200,859
Interest-bearing liabilitiesDomestic interest-bearing deposits: Savings $ 35,550 $ 76 0.87 % $ 35,535 $ 68 0.76 % $ 37,000 $ 35 0.39 % NOW and money market deposit accounts 227,606 908 1.62 224,122 721 1.28 233,392 651 1.13 Consumer CDs and IRAs 135,068 1,177 3.53 120,321 1,029 3.39 118,989 965 3.29 Negotiable CDs, public funds and other time deposits 8,551 70 3.30 5,085 27 2.13 10,291 95 3.73 Total domestic interest-bearing deposits 406,775 2,231 2.22 385,063 1,845 1.90 399,672 1,746 1.77Foreign interest-bearing deposits(4): Banks located in foreign countries 30,116 424 5.71 24,451 355 5.77 22,085 260 4.77 Governments and official institutions 10,200 107 4.25 7,579 73 3.84 6,831 43 2.58 Time, savings and other 35,136 245 2.83 32,624 203 2.46 30,770 133 1.75 Total foreign interest-bearing deposits 75,452 776 4.17 64,654 631 3.87 59,686 436 2.96 Total interest-bearing deposits 482,227 3,007 2.53 449,717 2,476 2.18 459,358 2,182 1.93Federal funds purchased, securities sold under agreements to repurchase and other short-term borrowings 399,896 4,309 4.37 364,140 3,855 4.20 276,483 1,988 2.91Trading account liabilities 52,466 517 3.99 56,880 619 4.32 44,507 427 3.89Long-term debt 117,018 1,516 5.18 99,601 1,209 4.85 96,167 1,033 4.30 Total interest-bearing liabilities (3) 1,051,607 9,349 3.60 970,338 8,159 3.34 876,515 5,630 2.60Noninterest-bearing sources: Noninterest-bearing deposits 177,594 179,205 168,062 Other liabilities 56,019 55,566 56,881 Shareholders' equity 131,153 99,948 99,401 Total liabilities and shareholders' equity $1,416,373 $1,305,057 $1,200,859Net interest spread 2.48 2.31 2.54Impact of noninterest-bearing sources 0.50 0.51 0.42 Net interest income/yield on earning assets $9,040 2.98 % $8,102 2.82 % $7,706 2.96 %
(1) Nonperforming loans are included in the respective average loan balances. Income on these nonperforming loans is recognized on a cash basis.(2) Includes consumer finance of $3,012 million in the first quarter of 2006, and $2,916 million and $3,362 million in the fourth and first quarters of 2005; foreign consumer of $7,328 million in the first quarter of 2006, and $3,682 million and $3,532 million in the fourth and first quarters of 2005; and consumer lease financing of $17 million in the first quarter of 2006, and $55 million and $411 million in the fourth and first quarters of 2005.(3) Interest income includes the impact of interest rate risk management contracts, which increased interest income on the underlying assets $8 million in the first quarter of 2006, and $29 million and $421 million in the fourth and first quarters of 2005. Interest expense includes the impact of interest rate risk management contracts, which increased interest expense on the underlying liabilities $136 million in the first quarter of 2006, and $254 million and $504 million in the fourth and first quarters of 2005.(4) Primarily consists of time deposits in denominations of $100,000 or more.
Quarterly Average Balances and Interest Rates - Fully Taxable-equivalent Basis
First Quarter 2006 Fourth Quarter 2005 First Quarter 2005
Information for periods beginning January 1, 2006 includes the MBNA acquisition; prior periods have not been restated. 7
Bank of America Corporation
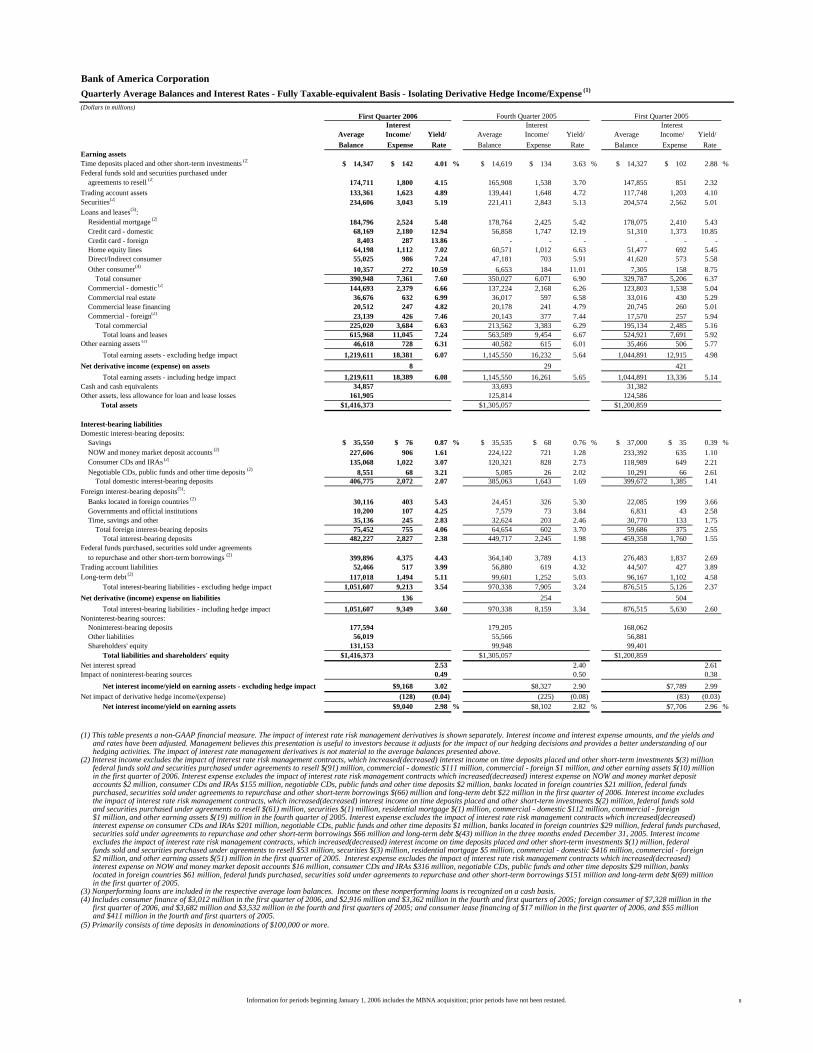
(Dollars in millions)
Interest Interest InterestAverage Income/ Yield/ Average Income/ Yield/ Average Income/ Yield/Balance Expense Rate Balance Expense Rate Balance Expense Rate
Earning assetsTime deposits placed and other short-term investments (2) $ 14,347 $ 142 4.01 % $ 14,619 $ 134 3.63 % $ 14,327 $ 102 2.88 %Federal funds sold and securities purchased under agreements to resell (2) 174,711 1,800 4.15 165,908 1,538 3.70 147,855 851 2.32Trading account assets 133,361 1,623 4.89 139,441 1,648 4.72 117,748 1,203 4.10Securities(2) 234,606 3,043 5.19 221,411 2,843 5.13 204,574 2,562 5.01Loans and leases(3): Residential mortgage (2) 184,796 2,524 5.48 178,764 2,425 5.42 178,075 2,410 5.43 Credit card - domestic 68,169 2,180 12.94 56,858 1,747 12.19 51,310 1,373 10.85 Credit card - foreign 8,403 287 13.86 - - - - - - Home equity lines 64,198 1,112 7.02 60,571 1,012 6.63 51,477 692 5.45 Direct/Indirect consumer 55,025 986 7.24 47,181 703 5.91 41,620 573 5.58 Other consumer(4) 10,357 272 10.59 6,653 184 11.01 7,305 158 8.75 Total consumer 390,948 7,361 7.60 350,027 6,071 6.90 329,787 5,206 6.37 Commercial - domestic (2) 144,693 2,379 6.66 137,224 2,168 6.26 123,803 1,538 5.04 Commercial real estate 36,676 632 6.99 36,017 597 6.58 33,016 430 5.29 Commercial lease financing 20,512 247 4.82 20,178 241 4.79 20,745 260 5.01 Commercial - foreign(2) 23,139 426 7.46 20,143 377 7.44 17,570 257 5.94 Total commercial 225,020 3,684 6.63 213,562 3,383 6.29 195,134 2,485 5.16 Total loans and leases 615,968 11,045 7.24 563,589 9,454 6.67 524,921 7,691 5.92Other earning assets (2) 46,618 728 6.31 40,582 615 6.01 35,466 506 5.77 Total earning assets - excluding hedge impact 1,219,611 18,381 6.07 1,145,550 16,232 5.64 1,044,891 12,915 4.98Net derivative income (expense) on assets 8 29 421 Total earning assets - including hedge impact 1,219,611 18,389 6.08 1,145,550 16,261 5.65 1,044,891 13,336 5.14Cash and cash equivalents 34,857 33,693 31,382Other assets, less allowance for loan and lease losses 161,905 125,814 124,586 Total assets $1,416,373 $1,305,057 $1,200,859
Interest-bearing liabilitiesDomestic interest-bearing deposits: Savings $ 35,550 $ 76 0.87 % $ 35,535 $ 68 0.76 % $ 37,000 $ 35 0.39 % NOW and money market deposit accounts (2) 227,606 906 1.61 224,122 721 1.28 233,392 635 1.10 Consumer CDs and IRAs (2) 135,068 1,022 3.07 120,321 828 2.73 118,989 649 2.21 Negotiable CDs, public funds and other time deposits (2) 8,551 68 3.21 5,085 26 2.02 10,291 66 2.61 Total domestic interest-bearing deposits 406,775 2,072 2.07 385,063 1,643 1.69 399,672 1,385 1.41Foreign interest-bearing deposits(5): Banks located in foreign countries (2) 30,116 403 5.43 24,451 326 5.30 22,085 199 3.66 Governments and official institutions 10,200 107 4.25 7,579 73 3.84 6,831 43 2.58 Time, savings and other 35,136 245 2.83 32,624 203 2.46 30,770 133 1.75 Total foreign interest-bearing deposits 75,452 755 4.06 64,654 602 3.70 59,686 375 2.55 Total interest-bearing deposits 482,227 2,827 2.38 449,717 2,245 1.98 459,358 1,760 1.55Federal funds purchased, securities sold under agreements to repurchase and other short-term borrowings (2) 399,896 4,375 4.43 364,140 3,789 4.13 276,483 1,837 2.69Trading account liabilities 52,466 517 3.99 56,880 619 4.32 44,507 427 3.89Long-term debt (2) 117,018 1,494 5.11 99,601 1,252 5.03 96,167 1,102 4.58 Total interest-bearing liabilities - excluding hedge impact 1,051,607 9,213 3.54 970,338 7,905 3.24 876,515 5,126 2.37Net derivative (income) expense on liabilities 136 254 504 Total interest-bearing liabilities - including hedge impact 1,051,607 9,349 3.60 970,338 8,159 3.34 876,515 5,630 2.60Noninterest-bearing sources: Noninterest-bearing deposits 177,594 179,205 168,062 Other liabilities 56,019 55,566 56,881 Shareholders' equity 131,153 99,948 99,401 Total liabilities and shareholders' equity $1,416,373 $1,305,057 $1,200,859Net interest spread 2.53 2.40 2.61Impact of noninterest-bearing sources 0.49 0.50 0.38 Net interest income/yield on earning assets - excluding hedge impact $9,168 3.02 $8,327 2.90 $7,789 2.99Net impact of derivative hedge income/(expense) (128) (0.04) (225) (0.08) (83) (0.03) Net interest income/yield on earning assets $9,040 2.98 % $8,102 2.82 % $7,706 2.96 %
(1) This table presents a non-GAAP financial measure. The impact of interest rate risk management derivatives is shown separately. Interest income and interest expense amounts, and the yields and and rates have been adjusted. Management believes this presentation is useful to investors because it adjusts for the impact of our hedging decisions and provides a better understanding of our hedging activities. The impact of interest rate management derivatives is not material to the average balances presented above.(2) Interest income excludes the impact of interest rate risk management contracts, which increased(decreased) interest income on time deposits placed and other short-term investments $(3) million, federal funds sold and securities purchased under agreements to resell $(91) million, commercial - domestic $111 million, commercial - foreign $1 million, and other earning assets $(10) million in the first quarter of 2006. Interest expense excludes the impact of interest rate risk management contracts which increased(decreased) interest expense on NOW and money market deposit accounts $2 million, consumer CDs and IRAs $155 million, negotiable CDs, public funds and other time deposits $2 million, banks located in foreign countries $21 million, federal funds purchased, securities sold under agreements to repurchase and other short-term borrowings $(66) million and long-term debt $22 million in the first quarter of 2006. Interest income excludes the impact of interest rate risk management contracts, which increased(decreased) interest income on time deposits placed and other short-term investments $(2) million, federal funds sold and securities purchased under agreements to resell $(61) million, securities $(1) million, residential mortgage $(1) million, commercial - domestic $112 million, commercial - foreign $1 million, and other earning assets $(19) million in the fourth quarter of 2005. Interest expense excludes the impact of interest rate risk management contracts which increased(decreased) interest expense on consumer CDs and IRAs $201 million, negotiable CDs, public funds and other time deposits $1 million, banks located in foreign countries $29 million, federal funds purchased, securities sold under agreements to repurchase and other short-term borrowings $66 million and long-term debt $(43) million in the three months ended December 31, 2005. Interest income excludes the impact of interest rate risk management contracts, which increased(decreased) interest income on time deposits placed and other short-term investments $(1) million, federal funds sold and securities purchased under agreements to resell $53 million, securities $(3) million, residential mortgage $5 million, commercial - domestic $416 million, commercial - foreign $2 million, and other earning assets $(51) million in the first quarter of 2005. Interest expense excludes the impact of interest rate risk management contracts which increased(decreased) interest expense on NOW and money market deposit accounts $16 million, consumer CDs and IRAs $316 million, negotiable CDs, public funds and other time deposits $29 million, banks located in foreign countries $61 million, federal funds purchased, securities sold under agreements to repurchase and other short-term borrowings $151 million and long-term debt $(69) million in the first quarter of 2005.(3) Nonperforming loans are included in the respective average loan balances. Income on these nonperforming loans is recognized on a cash basis.(4) Includes consumer finance of $3,012 million in the first quarter of 2006, and $2,916 million and $3,362 million in the fourth and first quarters of 2005; foreign consumer of $7,328 million in the first quarter of 2006, and $3,682 million and $3,532 million in the fourth and first quarters of 2005; and consumer lease financing of $17 million in the first quarter of 2006, and $55 million and $411 million in the fourth and first quarters of 2005.(5) Primarily consists of time deposits in denominations of $100,000 or more.
Quarterly Average Balances and Interest Rates - Fully Taxable-equivalent Basis - Isolating Derivative Hedge Income/Expense (1)
First Quarter 2006 Fourth Quarter 2005 First Quarter 2005
Information for periods beginning January 1, 2006 includes the MBNA acquisition; prior periods have not been restated. 8

Bank of America CorporationBusiness Segment View
*Fully taxable-equivalent basis
Net Income First Quarter 2006
All Other 2%
Global Corporate and InvestmentBanking
32%
Global Wealth and InvestmentManagement
12%
Global Consumer and Small BusinessBanking
54%
Revenue* First Quarter 2006
Global Consumer and Small Business Banking
57%
Global Corporate and Investment Banking
31%
Global Wealth and Investment Management
11%All Other
1%
Information for periods beginning January 1, 2006 includes the MBNA acquisition; prior periods have not been restated. 9
Bank of America Corporation
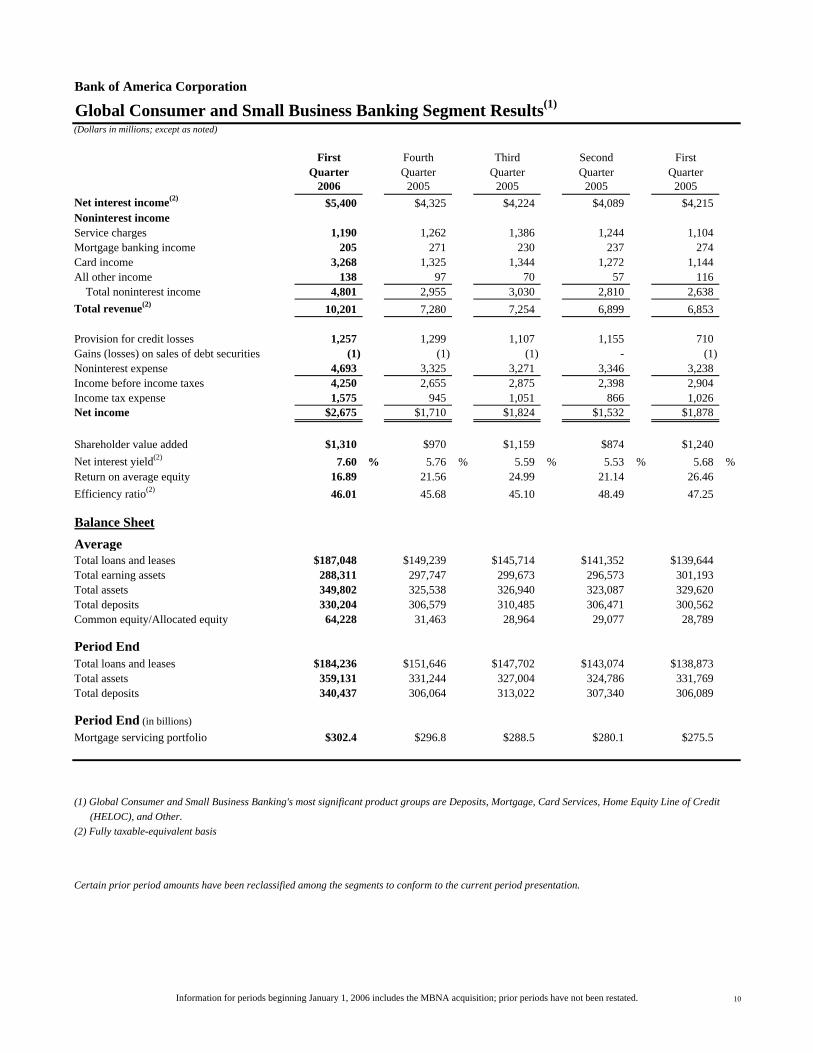
(Dollars in millions; except as noted)
First Fourth Third Second FirstQuarter Quarter Quarter Quarter Quarter
2006 2005 2005 2005 2005Net interest income(2) $5,400 $4,325 $4,224 $4,089 $4,215Noninterest incomeService charges 1,190 1,262 1,386 1,244 1,104 Mortgage banking income 205 271 230 237 274 Card income 3,268 1,325 1,344 1,272 1,144 All other income 138 97 70 57 116 Total noninterest income 4,801 2,955 3,030 2,810 2,638 Total revenue(2) 10,201 7,280 7,254 6,899 6,853
Provision for credit losses 1,257 1,299 1,107 1,155 710Gains (losses) on sales of debt securities (1) (1) (1) - (1) Noninterest expense 4,693 3,325 3,271 3,346 3,238Income before income taxes 4,250 2,655 2,875 2,398 2,904 Income tax expense 1,575 945 1,051 866 1,026 Net income $2,675 $1,710 $1,824 $1,532 $1,878
Shareholder value added $1,310 $970 $1,159 $874 $1,240Net interest yield(2) 7.60 % 5.76 % 5.59 % 5.53 % 5.68 %Return on average equity 16.89 21.56 24.99 21.14 26.46 Efficiency ratio(2) 46.01 45.68 45.10 48.49 47.25
Balance SheetAverageTotal loans and leases $187,048 $149,239 $145,714 $141,352 $139,644Total earning assets 288,311 297,747 299,673 296,573 301,193 Total assets 349,802 325,538 326,940 323,087 329,620 Total deposits 330,204 306,579 310,485 306,471 300,562 Common equity/Allocated equity 64,228 31,463 28,964 29,077 28,789
Period End Total loans and leases $184,236 $151,646 $147,702 $143,074 $138,873Total assets 359,131 331,244 327,004 324,786 331,769 Total deposits 340,437 306,064 313,022 307,340 306,089
Period End (in billions)Mortgage servicing portfolio $302.4 $296.8 $288.5 $280.1 $275.5
(1) Global Consumer and Small Business Banking's most significant product groups are Deposits, Mortgage, Card Services, Home Equity Line of Credit (HELOC), and Other.(2) Fully taxable-equivalent basis
Certain prior period amounts have been reclassified among the segments to conform to the current period presentation.
Global Consumer and Small Business Banking Segment Results(1)
Information for periods beginning January 1, 2006 includes the MBNA acquisition; prior periods have not been restated. 10
Bank of America Corporation
(Dollars in millions)
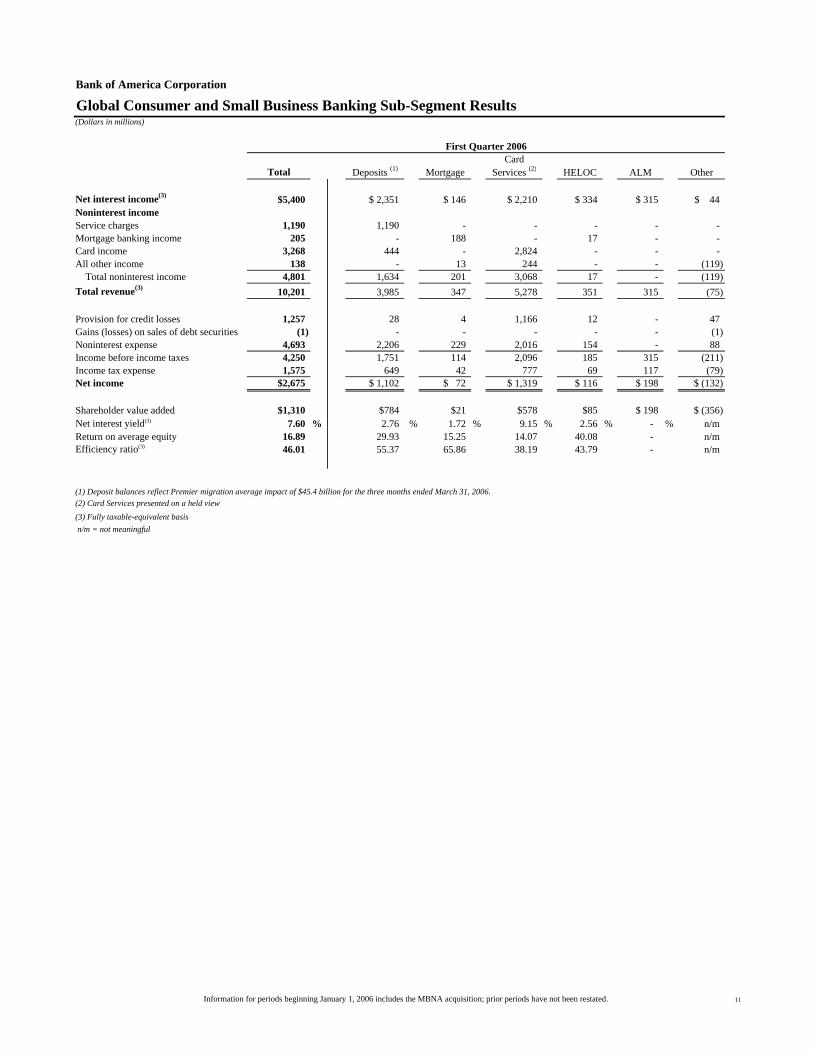
First Quarter 2006Card
Total Deposits (1) Mortgage Services (2) HELOC ALM Other
Net interest income(3) $5,400 $ 2,351 $ 146 $ 2,210 $ 334 $ 315 $ 44Noninterest incomeService charges 1,190 1,190 - - - - - Mortgage banking income 205 - 188 - 17 - - Card income 3,268 444 - 2,824 - - - All other income 138 - 13 244 - - (119) Total noninterest income 4,801 1,634 201 3,068 17 - (119) Total revenue(3) 10,201 3,985 347 5,278 351 315 (75)
Provision for credit losses 1,257 28 4 1,166 12 - 47 Gains (losses) on sales of debt securities (1) - - - - - (1) Noninterest expense 4,693 2,206 229 2,016 154 - 88 Income before income taxes 4,250 1,751 114 2,096 185 315 (211) Income tax expense 1,575 649 42 777 69 117 (79) Net income $2,675 $ 1,102 $ 72 $ 1,319 $ 116 $ 198 $ (132)
Shareholder value added $1,310 $784 $21 $578 $85 $ 198 $ (356)Net interest yield(3) 7.60 % 2.76 % 1.72 % 9.15 % 2.56 % - % n/mReturn on average equity 16.89 29.93 15.25 14.07 40.08 - n/mEfficiency ratio(3) 46.01 55.37 65.86 38.19 43.79 - n/m
(1) Deposit balances reflect Premier migration average impact of $45.4 billion for the three months ended March 31, 2006. (2) Card Services presented on a held view(3) Fully taxable-equivalent basis n/m = not meaningful
Global Consumer and Small Business Banking Sub-Segment Results
Information for periods beginning January 1, 2006 includes the MBNA acquisition; prior periods have not been restated. 11
Bank of America Corporation
(Dollars in millions)
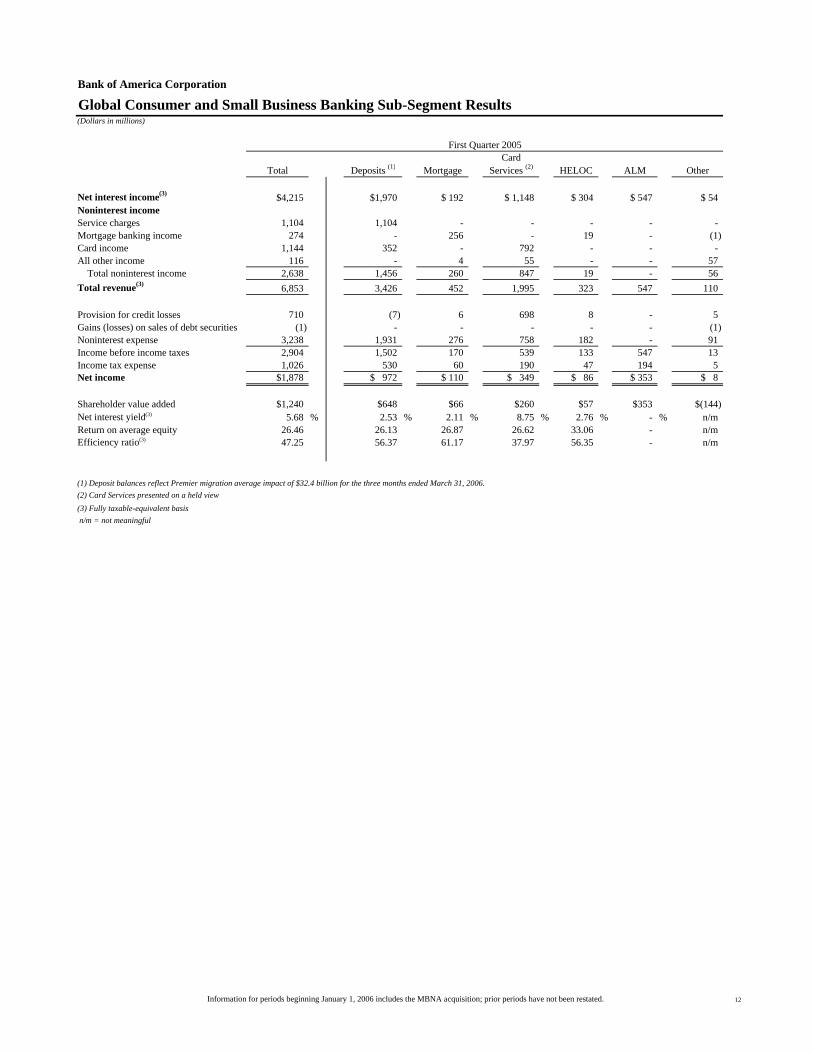
First Quarter 2005Card
Total Deposits (1) Mortgage Services (2) HELOC ALM Other
Net interest income(3) $4,215 $1,970 $ 192 $ 1,148 $ 304 $ 547 $ 54Noninterest incomeService charges 1,104 1,104 - - - - - Mortgage banking income 274 - 256 - 19 - (1) Card income 1,144 352 - 792 - - - All other income 116 - 4 55 - - 57 Total noninterest income 2,638 1,456 260 847 19 - 56 Total revenue(3) 6,853 3,426 452 1,995 323 547 110
Provision for credit losses 710 (7) 6 698 8 - 5 Gains (losses) on sales of debt securities (1) - - - - - (1) Noninterest expense 3,238 1,931 276 758 182 - 91 Income before income taxes 2,904 1,502 170 539 133 547 13 Income tax expense 1,026 530 60 190 47 194 5 Net income $1,878 $ 972 $ 110 $ 349 $ 86 $ 353 $ 8
Shareholder value added $1,240 $648 $66 $260 $57 $353 $(144)Net interest yield(3) 5.68 % 2.53 % 2.11 % 8.75 % 2.76 % - % n/mReturn on average equity 26.46 26.13 26.87 26.62 33.06 - n/mEfficiency ratio(3) 47.25 56.37 61.17 37.97 56.35 - n/m
(1) Deposit balances reflect Premier migration average impact of $32.4 billion for the three months ended March 31, 2006. (2) Card Services presented on a held view(3) Fully taxable-equivalent basis n/m = not meaningful
Global Consumer and Small Business Banking Sub-Segment Results
Information for periods beginning January 1, 2006 includes the MBNA acquisition; prior periods have not been restated. 12
Bank of America Corporation
(Dollars in millions; except as noted)
First Fourth Third Second FirstQuarter Quarter Quarter Quarter Quarter
2006 2005 2005 2005 2005
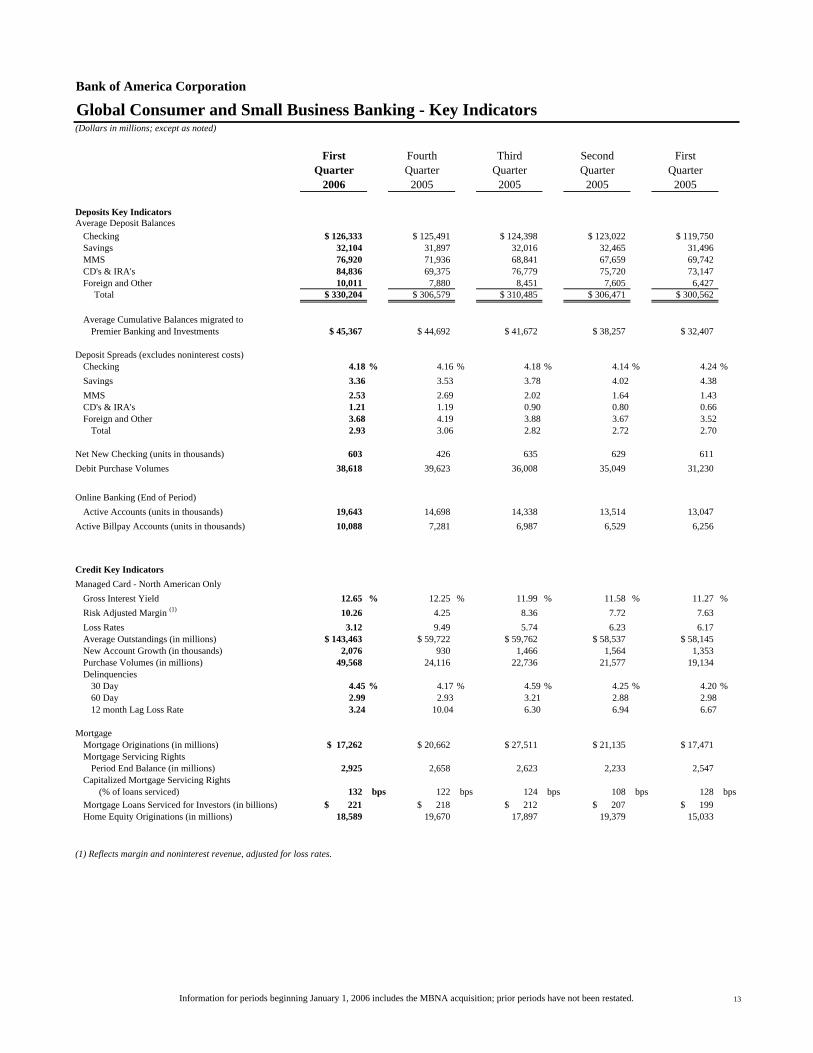
Deposits Key IndicatorsAverage Deposit Balances
Checking $ 126,333 $ 125,491 $ 124,398 $ 123,022 $ 119,750Savings 32,104 31,897 32,016 32,465 31,496 MMS 76,920 71,936 68,841 67,659 69,742 CD's & IRA's 84,836 69,375 76,779 75,720 73,147 Foreign and Other 10,011 7,880 8,451 7,605 6,427
Total $ 330,204 $ 306,579 $ 310,485 $ 306,471 $ 300,562
Average Cumulative Balances migrated toPremier Banking and Investments $ 45,367 $ 44,692 $ 41,672 $ 38,257 $ 32,407
Deposit Spreads (excludes noninterest costs)Checking 4.18 % 4.16 % 4.18 % 4.14 % 4.24 %Savings 3.36 3.53 3.78 4.02 4.38MMS 2.53 2.69 2.02 1.64 1.43CD's & IRA's 1.21 1.19 0.90 0.80 0.66Foreign and Other 3.68 4.19 3.88 3.67 3.52
Total 2.93 3.06 2.82 2.72 2.70
Net New Checking (units in thousands) 603 426 635 629 611 Debit Purchase Volumes 38,618 39,623 36,008 35,049 31,230
Online Banking (End of Period) Active Accounts (units in thousands) 19,643 14,698 14,338 13,514 13,047
Active Billpay Accounts (units in thousands) 10,088 7,281 6,987 6,529 6,256
Credit Key IndicatorsManaged Card - North American Only
Gross Interest Yield 12.65 % 12.25 % 11.99 % 11.58 % 11.27 %Risk Adjusted Margin (1) 10.26 4.25 8.36 7.72 7.63 Loss Rates 3.12 9.49 5.74 6.23 6.17 Average Outstandings (in millions) $ 143,463 $ 59,722 $ 59,762 $ 58,537 $ 58,145New Account Growth (in thousands) 2,076 930 1,466 1,564 1,353 Purchase Volumes (in millions) 49,568 24,116 22,736 21,577 19,134 Delinquencies
30 Day 4.45 % 4.17 % 4.59 % 4.25 % 4.20 %60 Day 2.99 2.93 3.21 2.88 2.9812 month Lag Loss Rate 3.24 10.04 6.30 6.94 6.67
Mortgage Mortgage Originations (in millions) $ 17,262 $ 20,662 $ 27,511 $ 21,135 $ 17,471Mortgage Servicing Rights
Period End Balance (in millions) 2,925 2,658 2,623 2,233 2,547 Capitalized Mortgage Servicing Rights
(% of loans serviced) 132 bps 122 bps 124 bps 108 bps 128 bpsMortgage Loans Serviced for Investors (in billions) $ 221 $ 218 $ 212 $ 207 $ 199Home Equity Originations (in millions) 18,589 19,670 17,897 19,379 15,033
(1) Reflects margin and noninterest revenue, adjusted for loss rates.
Global Consumer and Small Business Banking - Key Indicators
Information for periods beginning January 1, 2006 includes the MBNA acquisition; prior periods have not been restated. 13
Bank of America Corporation
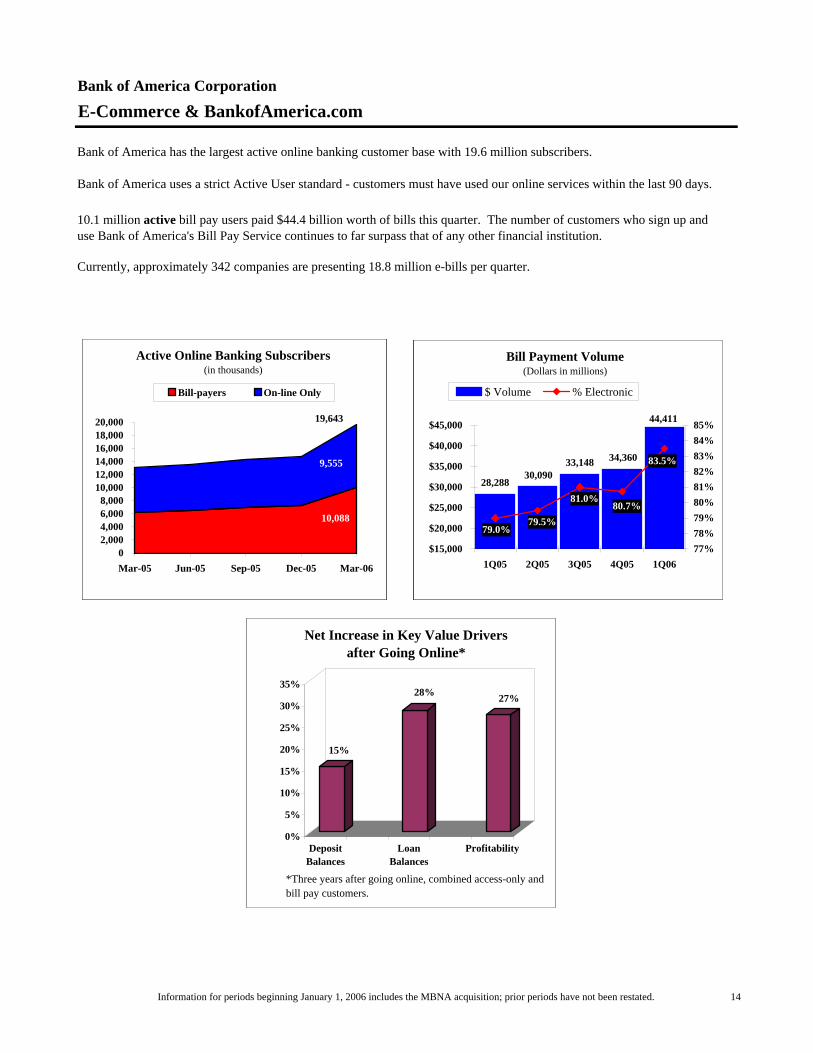
E-Commerce & BankofAmerica.com
Bank of America has the largest active online banking customer base with 19.6 million subscribers.
Bank of America uses a strict Active User standard - customers must have used our online services within the last 90 days.
10.1 million active bill pay users paid $44.4 billion worth of bills this quarter. The number of customers who sign up anduse Bank of America's Bill Pay Service continues to far surpass that of any other financial institution.
Currently, approximately 342 companies are presenting 18.8 million e-bills per quarter.
Bill Payment Volume(Dollars in millions)
11,02712,897
16,25314,494
9,570
0.803
0.7950.7950.7978%
$6,000
$8,000
$10,000
$12,000
$14,000
$16,000
$18,000
$20,000
1Q03 2Q03 3Q03 4Q03 1Q040.72
0.74
0.76
0.78
0.8
0.82
$ Volume % Electronic
*Estimated
Active On-line Banking Subscribers(in thousands)
3,659
4435
01,0002,0003,0004,0005,0006,0007,0008,0009,000
37681 37773 37865 37956 38047
Bill-payers On-line Only
8,094
*
Bill Payment Volume(Dollars in millions)
25,728
33,148 34,360
30,09028,288
79% 0.790.795
0.8181%
$10,000
$15,000
$20,000
$25,000
$30,000
$35,000
4Q04 1Q05 2Q05 3Q05 4Q050.77
0.78
0.79
0.8
0.81
0.82
0.83
$ Volume % Electronic
Active Online Banking Subscribers(in thousands)
7,281
7417
0
4,000
8,000
12,000
16,000
38322 38412 38504 38596 38687
Bill-payers On-line Only
14,338
15%
28% 27%
0%
5%
10%
15%
20%
25%
30%
35%
DepositBalances
LoanBalances
Profitability
Net Increase in Key Value Driversafter Going Online*
*Three years after going online, combined access-only and bill pay customers.
Bill Payment Volume(Dollars in millions)
11,02712,897
16,25314,494
9,570
0.803
0.7950.7950.7978%
$6,000
$8,000
$10,000
$12,000
$14,000
$16,000
$18,000
$20,000
1Q03 2Q03 3Q03 4Q03 1Q040.72
0.74
0.76
0.78
0.8
0.82
$ Volume % Electronic
*Estimated
Active On-line Banking Subscribers(in thousands)
3,659
4435
01,0002,0003,0004,0005,0006,0007,0008,0009,000
37681 37773 37865 37956 38047
Bill-payers On-line Only
8,094
*
Bill Payment Volume(Dollars in millions)
28,28830,090
33,40033,148
25,728
0.79 0.790.795
0.81 0.807
$15,000
$20,000
$25,000
$30,000
$35,000
$40,000
4Q04 1Q05 2Q05 3Q05 4Q050.77
0.78
0.79
0.8
0.81
0.82
0.83
$ Volume % Electronic
Active Online Banking Subscribers(in thousands)
7,281
7417
02,0004,0006,0008,000
10,00012,00014,00016,00018,000
38322 38412 38504 38596 38687
Bill-payers On-line Only
14,698
15%
28% 27%
0%
5%
10%
15%
20%
25%
30%
35%
DepositBalances
LoanBalances
Profitability
Net Increase in Key Value Driversafter Going Online*
*Three years after going online, combined access-only and bill pay customers.
Bill Payment Volume(Dollars in millions)
11,02712,897
16,25314,494
9,570
0.803
0.7950.7950.7978%
$6,000
$8,000
$10,000
$12,000
$14,000
$16,000
$18,000
$20,000
1Q03 2Q03 3Q03 4Q03 1Q040.72
0.74
0.76
0.78
0.8
0.82
$ Volume % Electronic
*Estimated
Active On-line Banking Subscribers(in thousands)
3,659
4435
01,0002,0003,0004,0005,0006,0007,0008,0009,000
37681 37773 37865 37956 38047
Bill-payers On-line Only
8,094
*
Bill Payment Volume(Dollars in millions)
30,09033,148
44,411
34,360
28,288
80.7%81.0%
79.5%79.0%
83.5%
$15,000
$20,000
$25,000
$30,000
$35,000
$40,000
$45,000
1Q05 2Q05 3Q05 4Q05 1Q0677%78%79%80%81%82%83%84%85%
$ Volume % Electronic
Active Online Banking Subscribers(in thousands)
10,088
9,555
02,0004,0006,0008,000
10,00012,00014,00016,00018,00020,000
Mar-05 Jun-05 Sep-05 Dec-05 Mar-06
Bill-payers On-line Only
19,643
15%
28% 27%
0%
5%
10%
15%
20%
25%
30%
35%
DepositBalances
LoanBalances
Profitability
Net Increase in Key Value Driversafter Going Online*
*Three years after going online, combined access-only and bill pay customers.
Information for periods beginning January 1, 2006 includes the MBNA acquisition; prior periods have not been restated. 14

Bank of America Corporation
(Dollars in millions)
First Fourth Third Second FirstQuarter Quarter Quarter Quarter Quarter
Key Measures 2006(1) 2005 2005 2005 2005
LoansOn-balance sheet (Period end) $ 90,942 $ 58,548 $ 56,079 $ 53,863 $ 51,012Managed (Period end) 185,301 60,786 59,701 59,283 57,920
On-balance sheet (Average) 94,364 56,858 55,271 52,474 51,310 Managed (Average) 187,140 59,722 59,762 58,537 58,145
Managed Income StatementHeld total revenue (2) $5,278 $2,213 $2,219 $2,063 $1,995Securitizations impact 654 63 92 135 145 Managed total revenue $5,932 $2,276 $2,311 $2,198 $2,140 % of average managed outstandings 12.9 % 14.5 % 14.8 % 14.6 % 14.5 %
Held provision for credit losses (2) $1,166 $1,191 $1,010 $1,099 $698Securitizations impact 654 63 92 135 145 Managed provision for credit losses $1,820 $1,254 $1,102 $1,234 $843 % of average managed outstandings 3.9 % 8.0 % 7.1 % 8.2 % 5.7 %
Held noninterest expense (2) $2,016 $730 $739 $768 $758Securitizations impact - - - - - Managed noninterest expense $2,016 $730 $739 $768 $758 % of average managed outstandings 4.4 % 4.6 % 4.7 % 5.1 % 5.1 %
Held income before income taxes (2) $2,096 $292 $470 $196 $539Securitizations impact - - - - - Managed income before income taxes $2,096 $292 $470 $196 $539 % of average managed outstandings 4.5 % 1.9 % 3.0 % 1.3 % 3.7 %
Shareholder Value Added - Managed $562 $63 $187 $19 $259
Merchant Acquiring Business: Processing volume $88,335 $101,601 $91,321 $84,262 $75,754 Total transactions 1,897 2,334 1,906 1,832 1,620
(1) For the first quarter of 2006, Card Services includes U.S. Consumer and Small Business Credit Card, Consumer Finance, International Card Operations and Merchant Services. Prior to January 1, 2006, Card Services included only U.S. Consumer Credit Card.(2) Held basis is a GAAP measure.
Card Services Results - Purchase View
Information for periods beginning January 1, 2006 includes the MBNA acquisition; prior periods have not been restated. 15
Bank of America Corporation
(Dollars in millions)
First Fourth Third Second FirstQuarter Quarter Quarter Quarter Quarter
Key Measures 2006 2005 2005 2005 2005
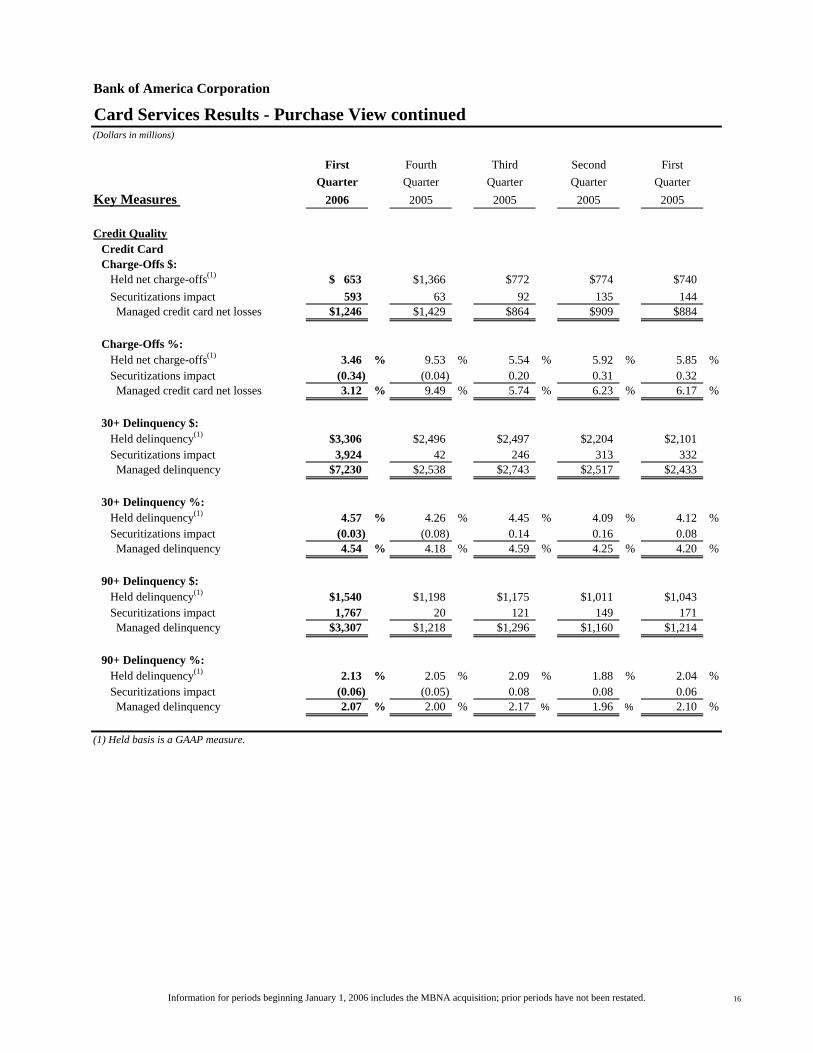
Credit QualityCredit CardCharge-Offs $: Held net charge-offs(1) $ 653 $1,366 $772 $774 $740 Securitizations impact 593 63 92 135 144 Managed credit card net losses $1,246 $1,429 $864 $909 $884
Charge-Offs %: Held net charge-offs(1) 3.46 % 9.53 % 5.54 % 5.92 % 5.85 % Securitizations impact (0.34) (0.04) 0.20 0.31 0.32 Managed credit card net losses 3.12 % 9.49 % 5.74 % 6.23 % 6.17 %
30+ Delinquency $: Held delinquency(1) $3,306 $2,496 $2,497 $2,204 $2,101 Securitizations impact 3,924 42 246 313 332 Managed delinquency $7,230 $2,538 $2,743 $2,517 $2,433
30+ Delinquency %: Held delinquency(1) 4.57 % 4.26 % 4.45 % 4.09 % 4.12 % Securitizations impact (0.03) (0.08) 0.14 0.16 0.08 Managed delinquency 4.54 % 4.18 % 4.59 % 4.25 % 4.20 %
90+ Delinquency $: Held delinquency(1) $1,540 $1,198 $1,175 $1,011 $1,043 Securitizations impact 1,767 20 121 149 171 Managed delinquency $3,307 $1,218 $1,296 $1,160 $1,214
90+ Delinquency %: Held delinquency(1) 2.13 % 2.05 % 2.09 % 1.88 % 2.04 % Securitizations impact (0.06) (0.05) 0.08 0.08 0.06 Managed delinquency 2.07 % 2.00 % 2.17 % 1.96 % 2.10 %
(1) Held basis is a GAAP measure.
Card Services Results - Purchase View continued
Information for periods beginning January 1, 2006 includes the MBNA acquisition; prior periods have not been restated. 16

Bank of America Corporation
(Dollars in millions)
First Fourth Third Second FirstQuarter Quarter Quarter Quarter Quarter
Key Measures 2006 2005 2005 2005 2005
LoansOn-balance sheet (Period end) $ 90,942 $ 97,208 $ 92,257 $ 86,546 $ 82,908Managed (Period end) 185,301 189,414 182,879 176,886 174,845
On-balance sheet (Average) 94,364 92,886 89,757 82,794 82,903 Managed (Average) 187,140 184,670 179,275 174,687 176,305
Managed Income StatementHeld total revenue (2) $5,278 $4,753 $4,983 $4,663 $4,444Securitizations impact 654 1,493 1,093 1,204 1,149 Managed total revenue $5,932 $6,246 $6,076 $5,867 $5,593 % of average managed outstandings 12.9 % 13.4 % 13.4 % 13.5 % 12.9 %
Held provision for credit losses (2) $1,166 $1,485 $1,290 $1,288 $1,000Securitizations impact 654 1,493 1,093 1,204 1,149 Managed provision for credit losses $1,820 $2,978 $2,383 $2,492 $2,149 % of average managed outstandings 3.9 % 6.4 % 5.3 % 5.7 % 4.9 %
Held noninterest expense (2) $2,016 $2,404 $2,170 $2,243 $2,184Securitizations impact - - - - - Managed noninterest expense $2,016 $2,404 $2,170 $2,243 $2,184 % of average managed outstandings 4.4 % 5.2 % 4.8 % 5.2 % 5.0 %
Held income before income taxes (2) $2,096 $864 $1,523 $1,132 $1,260Securitizations impact - - - - - Managed income before income taxes $2,096 $864 $1,523 $1,132 $1,260 % of average managed outstandings 4.5 % 1.9 % 3.4 % 2.6 % 2.9 %
Shareholder Value Added - Managed $562 ($157) $266 $42 $148
Merchant Acquiring Business: Processing volume $88,335 $101,601 $91,321 $84,262 $75,754 Total transactions 1,897 2,334 1,906 1,832 1,620
(1) Card Services includes U.S. Consumer and Small Business Credit Card, Consumer Finance, International Card Operations and Merchant Services. (2) Held basis is a GAAP measure.
Card Services Results - Proforma View (1)
Information for periods beginning January 1, 2006 includes the MBNA acquisition; prior periods have not been restated. 17
Bank of America Corporation
(Dollars in millions)
First Fourth Third Second FirstQuarter Quarter Quarter Quarter Quarter
Key Measures 2006 2005 2005 2005 2005
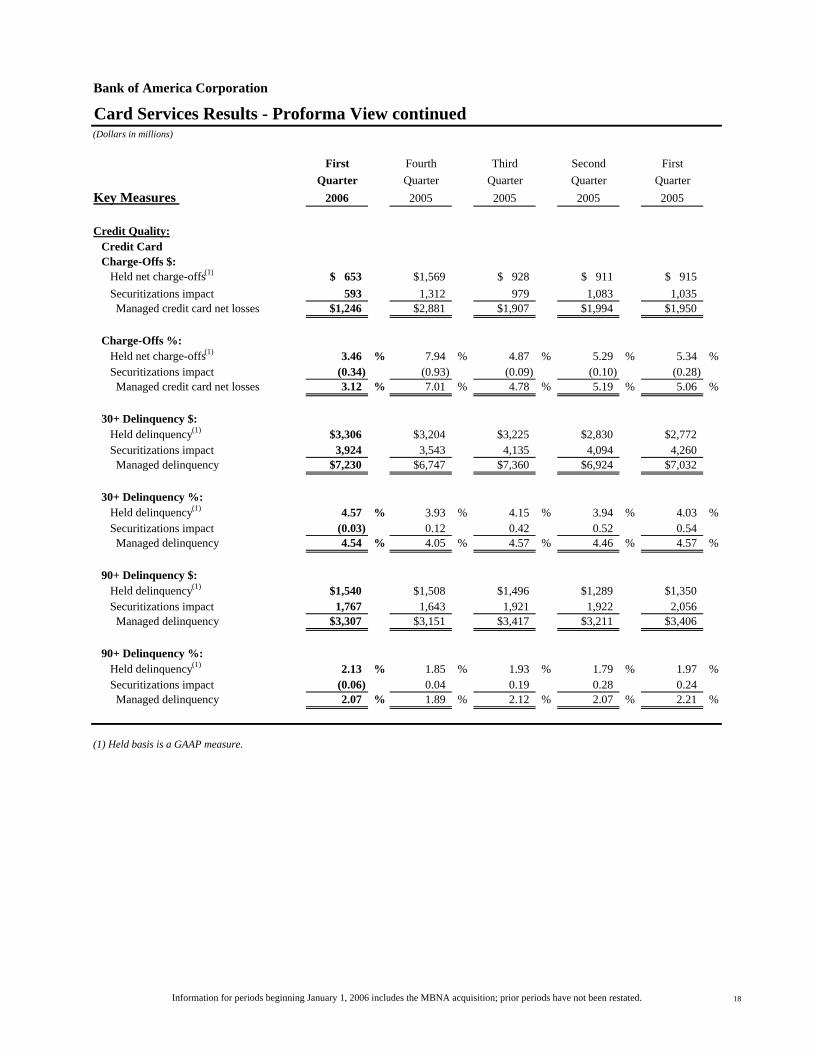
Credit Quality:Credit Card Charge-Offs $: Held net charge-offs(1) $ 653 $1,569 $ 928 $ 911 $ 915 Securitizations impact 593 1,312 979 1,083 1,035 Managed credit card net losses $1,246 $2,881 $1,907 $1,994 $1,950
Charge-Offs %: Held net charge-offs(1) 3.46 % 7.94 % 4.87 % 5.29 % 5.34 % Securitizations impact (0.34) (0.93) (0.09) (0.10) (0.28) Managed credit card net losses 3.12 % 7.01 % 4.78 % 5.19 % 5.06 %
30+ Delinquency $: Held delinquency(1) $3,306 $3,204 $3,225 $2,830 $2,772 Securitizations impact 3,924 3,543 4,135 4,094 4,260 Managed delinquency $7,230 $6,747 $7,360 $6,924 $7,032
30+ Delinquency %: Held delinquency(1) 4.57 % 3.93 % 4.15 % 3.94 % 4.03 % Securitizations impact (0.03) 0.12 0.42 0.52 0.54 Managed delinquency 4.54 % 4.05 % 4.57 % 4.46 % 4.57 %
90+ Delinquency $: Held delinquency(1) $1,540 $1,508 $1,496 $1,289 $1,350 Securitizations impact 1,767 1,643 1,921 1,922 2,056 Managed delinquency $3,307 $3,151 $3,417 $3,211 $3,406
90+ Delinquency %: Held delinquency(1) 2.13 % 1.85 % 1.93 % 1.79 % 1.97 % Securitizations impact (0.06) 0.04 0.19 0.28 0.24 Managed delinquency 2.07 % 1.89 % 2.12 % 2.07 % 2.21 %
(1) Held basis is a GAAP measure.
Card Services Results - Proforma View continued
Information for periods beginning January 1, 2006 includes the MBNA acquisition; prior periods have not been restated. 18
Bank of America Corporation
( Dollars in millions)
Fourth Quarter 2005 Third Quarter 2005Bank of America
Adjustments to include MBNA (1) Combined
Bank of America
Adjustments to include MBNA (1) Combined
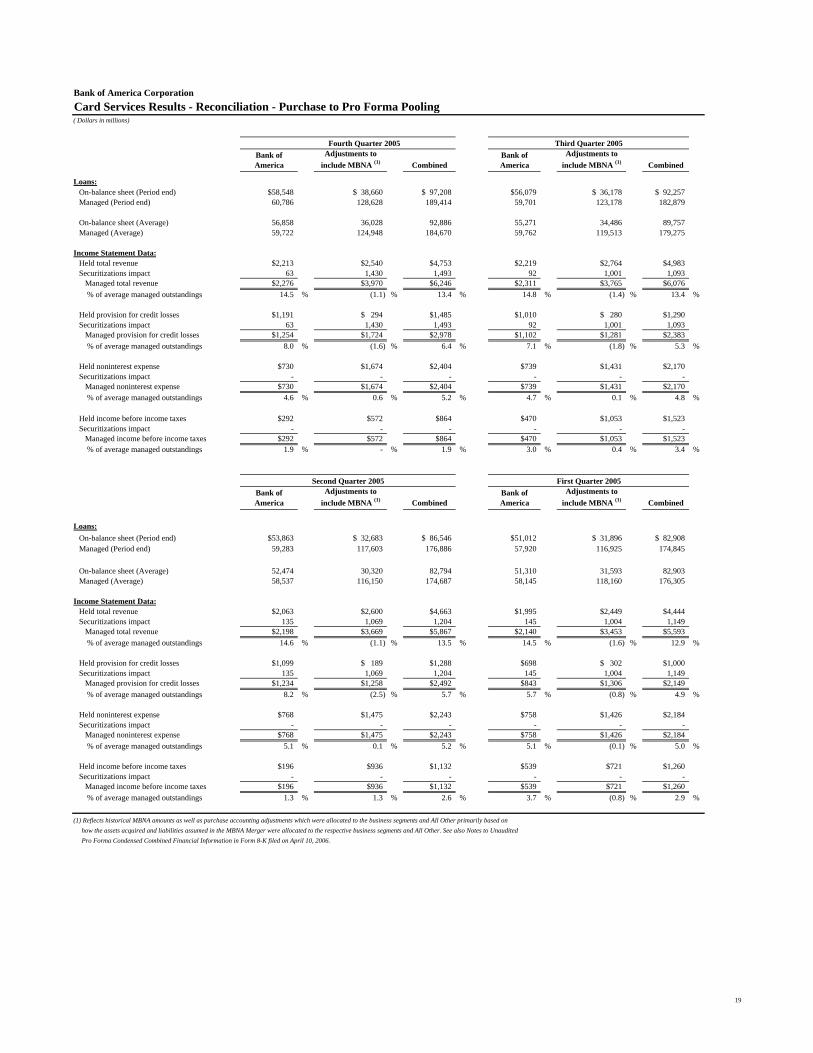
Loans:On-balance sheet (Period end) $58,548 $ 38,660 $ 97,208 $56,079 $ 36,178 $ 92,257Managed (Period end) 60,786 128,628 189,414 59,701 123,178 182,879
On-balance sheet (Average) 56,858 36,028 92,886 55,271 34,486 89,757 Managed (Average) 59,722 124,948 184,670 59,762 119,513 179,275
Income Statement Data:Held total revenue $2,213 $2,540 $4,753 $2,219 $2,764 $4,983Securitizations impact 63 1,430 1,493 92 1,001 1,093 Managed total revenue $2,276 $3,970 $6,246 $2,311 $3,765 $6,076 % of average managed outstandings 14.5 % (1.1) % 13.4 % 14.8 % (1.4) % 13.4 %
Held provision for credit losses $1,191 $ 294 $1,485 $1,010 $ 280 $1,290Securitizations impact 63 1,430 1,493 92 1,001 1,093 Managed provision for credit losses $1,254 $1,724 $2,978 $1,102 $1,281 $2,383 % of average managed outstandings 8.0 % (1.6) % 6.4 % 7.1 % (1.8) % 5.3 %
Held noninterest expense $730 $1,674 $2,404 $739 $1,431 $2,170Securitizations impact - - - - - - Managed noninterest expense $730 $1,674 $2,404 $739 $1,431 $2,170 % of average managed outstandings 4.6 % 0.6 % 5.2 % 4.7 % 0.1 % 4.8 %
Held income before income taxes $292 $572 $864 $470 $1,053 $1,523Securitizations impact - - - - - - Managed income before income taxes $292 $572 $864 $470 $1,053 $1,523 % of average managed outstandings 1.9 % - % 1.9 % 3.0 % 0.4 % 3.4 %
Second Quarter 2005 First Quarter 2005Bank of America
Adjustments to include MBNA (1) Combined
Bank of America
Adjustments to include MBNA (1) Combined
Loans:On-balance sheet (Period end) $53,863 $ 32,683 $ 86,546 $51,012 $ 31,896 $ 82,908Managed (Period end) 59,283 117,603 176,886 57,920 116,925 174,845
On-balance sheet (Average) 52,474 30,320 82,794 51,310 31,593 82,903 Managed (Average) 58,537 116,150 174,687 58,145 118,160 176,305
Income Statement Data:Held total revenue $2,063 $2,600 $4,663 $1,995 $2,449 $4,444Securitizations impact 135 1,069 1,204 145 1,004 1,149 Managed total revenue $2,198 $3,669 $5,867 $2,140 $3,453 $5,593 % of average managed outstandings 14.6 % (1.1) % 13.5 % 14.5 % (1.6) % 12.9 %
Held provision for credit losses $1,099 $ 189 $1,288 $698 $ 302 $1,000Securitizations impact 135 1,069 1,204 145 1,004 1,149 Managed provision for credit losses $1,234 $1,258 $2,492 $843 $1,306 $2,149 % of average managed outstandings 8.2 % (2.5) % 5.7 % 5.7 % (0.8) % 4.9 %
Held noninterest expense $768 $1,475 $2,243 $758 $1,426 $2,184Securitizations impact - - - - - - Managed noninterest expense $768 $1,475 $2,243 $758 $1,426 $2,184 % of average managed outstandings 5.1 % 0.1 % 5.2 % 5.1 % (0.1) % 5.0 %
Held income before income taxes $196 $936 $1,132 $539 $721 $1,260Securitizations impact - - - - - - Managed income before income taxes $196 $936 $1,132 $539 $721 $1,260 % of average managed outstandings 1.3 % 1.3 % 2.6 % 3.7 % (0.8) % 2.9 %
(1) Reflects historical MBNA amounts as well as purchase accounting adjustments which were allocated to the business segments and All Other primarily based on how the assets acquired and liabilities assumed in the MBNA Merger were allocated to the respective business segments and All Other. See also Notes to Unaudited Pro Forma Condensed Combined Financial Information in Form 8-K filed on April 10, 2006.
Card Services Results - Reconciliation - Purchase to Pro Forma Pooling
19

Bank of America Corporation
(Dollars in millions)
First Fourth Third Second FirstQuarter Quarter Quarter Quarter Quarter
2006 2005 2005 2005 2005Net interest income(2) $2,714 $2,771 $2,747 $2,783 $2,856Noninterest incomeService charges 687 641 671 655 650 Investment and brokerage services 272 271 267 262 246 Investment banking income 522 547 532 441 372 Trading account profits 1,008 307 571 232 661 All other income 357 421 499 535 662 Total noninterest income 2,846 2,187 2,540 2,125 2,591 Total revenue(2) 5,560 4,958 5,287 4,908 5,447
Provision for credit losses 39 97 12 (249) (151) Gains (losses) on sales of debt securities 23 95 17 121 30 Noninterest expense 3,026 2,956 2,849 2,603 2,705 Income before income taxes 2,518 2,000 2,443 2,675 2,923Income tax expense 932 711 890 970 1,072 Net income $1,586 $1,289 $1,553 $1,705 $1,851
Shareholder value added $466 $159 $451 $620 $749Net interest yield(2) 1.88 % 1.93 % 1.92 % 1.99 % 2.31 %Return on average equity 15.02 12.06 14.93 16.62 17.76 Efficiency ratio(2) 54.42 59.61 53.88 53.02 49.66
Balance Sheet
AverageTotal loans and leases $236,828 $229,011 $216,133 $207,936 $205,963Total earning assets 586,927 571,111 566,686 562,143 501,641 Total assets 667,794 654,668 648,325 645,876 583,237 Total deposits 197,922 192,807 188,946 191,520 186,285 Common equity/Allocated equity 42,820 42,413 41,267 41,146 42,273
Period EndTotal loans and leases $239,077 $232,642 $220,885 $210,799 $208,977Total assets 630,956 633,374 602,070 605,093 593,525 Total deposits 198,602 198,390 184,554 189,727 181,978
(1) Effective January 1, 2006, we combined Global Business and Financial Services and Global Capital Markets and Investment Banking creating this new segment, Global Corporate and Investment Banking. Global Corporate and Investment Banking offers clients a comprehensive range of global capabilities through four financial services: Business Lending, Capital Markets and Advisory Services, Treasury Services, and Other.(2) Fully taxable-equivalent basis
Certain prior period amounts have been reclassified among the segments to conform to the current period presentation.
Global Corporate and Investment Banking Segment Results(1)
Information for periods beginning January 1, 2006 includes the MBNA acquisition; prior periods have not been restated. 20
Bank of America Corporation
(Dollars in millions)
First Quarter 2006CapitalMarkets
andBusiness Advisory Treasury
Total Lending Services Services ALM Other(1)
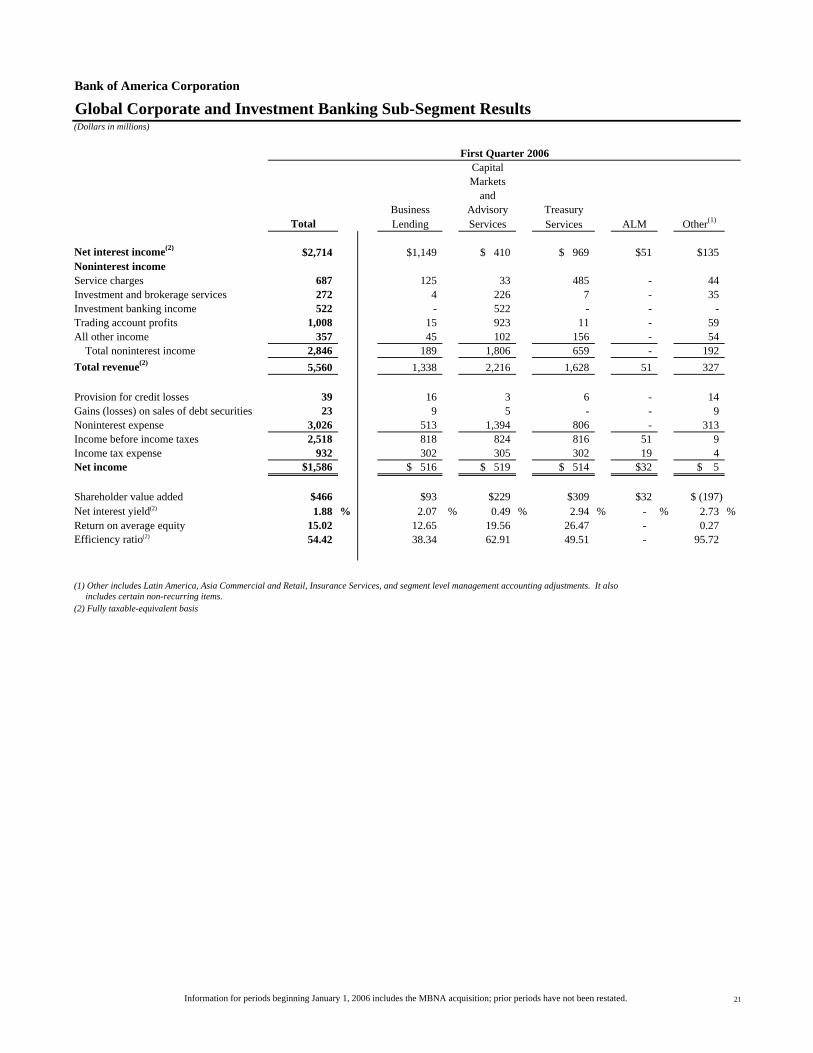
Net interest income(2) $2,714 $1,149 $ 410 $ 969 $51 $135Noninterest incomeService charges 687 125 33 485 - 44Investment and brokerage services 272 4 226 7 - 35Investment banking income 522 - 522 - - - Trading account profits 1,008 15 923 11 - 59All other income 357 45 102 156 - 54 Total noninterest income 2,846 189 1,806 659 - 192 Total revenue(2) 5,560 1,338 2,216 1,628 51 327
Provision for credit losses 39 16 3 6 - 14Gains (losses) on sales of debt securities 23 9 5 - - 9 Noninterest expense 3,026 513 1,394 806 - 313Income before income taxes 2,518 818 824 816 51 9 Income tax expense 932 302 305 302 19 4 Net income $1,586 $ 516 $ 519 $ 514 $32 $ 5
Shareholder value added $466 $93 $229 $309 $32 $ (197)Net interest yield(2) 1.88 % 2.07 % 0.49 % 2.94 % - % 2.73 %Return on average equity 15.02 12.65 19.56 26.47 - 0.27 Efficiency ratio(2) 54.42 38.34 62.91 49.51 - 95.72
(1) Other includes Latin America, Asia Commercial and Retail, Insurance Services, and segment level management accounting adjustments. It also includes certain non-recurring items.(2) Fully taxable-equivalent basis
Global Corporate and Investment Banking Sub-Segment Results
Information for periods beginning January 1, 2006 includes the MBNA acquisition; prior periods have not been restated. 21
Bank of America Corporation
(Dollars in millions)
First Quarter 2005CapitalMarkets
andBusiness Advisory Treasury
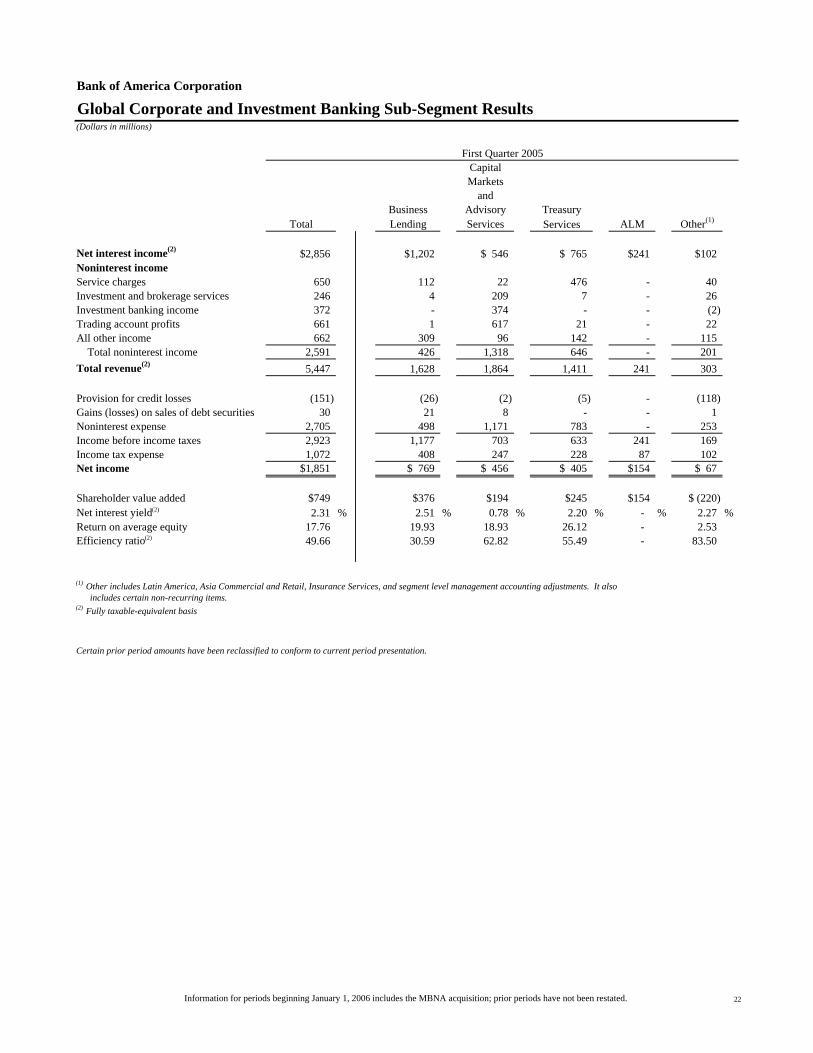
Total Lending Services Services ALM Other(1)
Net interest income(2) $2,856 $1,202 $ 546 $ 765 $241 $102Noninterest incomeService charges 650 112 22 476 - 40Investment and brokerage services 246 4 209 7 - 26Investment banking income 372 - 374 - - (2)Trading account profits 661 1 617 21 - 22All other income 662 309 96 142 - 115 Total noninterest income 2,591 426 1,318 646 - 201 Total revenue(2) 5,447 1,628 1,864 1,411 241 303
Provision for credit losses (151) (26) (2) (5) - (118)Gains (losses) on sales of debt securities 30 21 8 - - 1 Noninterest expense 2,705 498 1,171 783 - 253Income before income taxes 2,923 1,177 703 633 241 169 Income tax expense 1,072 408 247 228 87 102 Net income $1,851 $ 769 $ 456 $ 405 $154 $ 67
Shareholder value added $749 $376 $194 $245 $154 $ (220)Net interest yield(2) 2.31 % 2.51 % 0.78 % 2.20 % - % 2.27 %Return on average equity 17.76 19.93 18.93 26.12 - 2.53 Efficiency ratio(2) 49.66 30.59 62.82 55.49 - 83.50
(1) Other includes Latin America, Asia Commercial and Retail, Insurance Services, and segment level management accounting adjustments. It also includes certain non-recurring items.(2) Fully taxable-equivalent basis
Certain prior period amounts have been reclassified to conform to current period presentation.
Global Corporate and Investment Banking Sub-Segment Results
Information for periods beginning January 1, 2006 includes the MBNA acquisition; prior periods have not been restated. 22

Bank of America Corporation
Global Corporate and Investment Banking - Capital Markets and Advisory ServicesKey Indicators(Dollars in millions)
First Fourth Third Second FirstQuarter Quarter Quarter Quarter Quarter
2006 2005 2005 2005 2005Investment banking incomeAdvisory fees $ 76 $ 73 $ 89 $ 73 $ 60Debt underwriting 380 390 355 312 276 Equity underwriting 66 84 94 57 38 Total investment banking income $522 $547 $538 $442 $374
Sales and tradingFixed income Liquid products 608 467 470 498 507 Credit products 327 71 226 81 256 Structured products 288 239 268 231 265 Total fixed income 1,223 777 964 810 1,028 Equity income 476 262 361 300 470 Total sales and trading 1,699 1,039 1,325 1,110 1,498 Total capital markets and advisory services revenue (1) $2,221 $1,586 $1,863 $1,552 $1,872(1) Includes gains (losses) on sales of debt securities.
Balance sheet (average)Trading account securities $130,323 $136,058 $138,874 $131,831 $115,103Reverse repurchases 75,141 75,229 78,918 77,080 59,561 Securities borrowed 88,682 79,993 85,377 97,597 77,454 Derivative assets 19,894 21,918 21,437 22,103 22,945 Trading-related assets $314,040 $313,198 $324,606 $328,611 $275,063
Sales credits from secondary tradingLiquid products 230 197 192 223 201 Credit products 184 160 152 177 168 Structured products 162 128 167 139 131 Equities 221 211 201 215 199 Total 797 696 712 754 699
Volatility of product revenues - 1 std devLiquid products $ 5.9 $ 7.0 $11.1 $ 8.7 $10.0Credit products 3.3 4.1 3.7 13.2 4.3Structured products 4.6 6.8 8.1 4.9 6.9Equities 2.0 1.3 6.0 2.4 2.0Total 8.8 12.2 16.0 17.6 15.8
Information for periods beginning January 1, 2006 includes the MBNA acquisition; prior periods have not been restated. 23
Bank of America Corporation
Global Corporate and Investment Banking - Business Lending Key Indicators(Dollars in millions)
First Fourth Third Second FirstQuarter Quarter Quarter Quarter Quarter
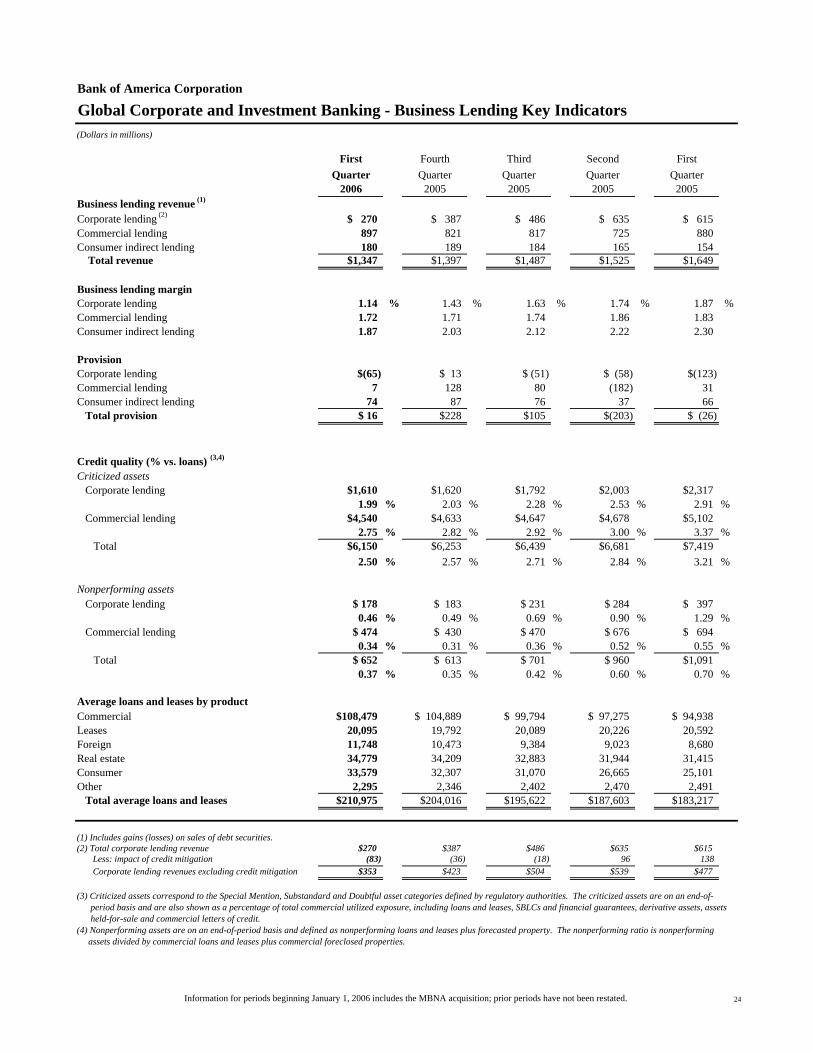
2006 2005 2005 2005 2005Business lending revenue (1)
Corporate lending (2) $ 270 $ 387 $ 486 $ 635 $ 615Commercial lending 897 821 817 725 880 Consumer indirect lending 180 189 184 165 154 Total revenue $1,347 $1,397 $1,487 $1,525 $1,649
Business lending marginCorporate lending 1.14 % 1.43 % 1.63 % 1.74 % 1.87 %Commercial lending 1.72 1.71 1.74 1.86 1.83 Consumer indirect lending 1.87 2.03 2.12 2.22 2.30
ProvisionCorporate lending $(65) $ 13 $ (51) $ (58) $(123)Commercial lending 7 128 80 (182) 31 Consumer indirect lending 74 87 76 37 66 Total provision $ 16 $228 $105 $(203) $ (26)
Credit quality (% vs. loans) (3,4)
Criticized assets Corporate lending $1,610 $1,620 $1,792 $2,003 $2,317
1.99 % 2.03 % 2.28 % 2.53 % 2.91 % Commercial lending $4,540 $4,633 $4,647 $4,678 $5,102
2.75 % 2.82 % 2.92 % 3.00 % 3.37 % Total $6,150 $6,253 $6,439 $6,681 $7,419
2.50 % 2.57 % 2.71 % 2.84 % 3.21 %
Nonperforming assets Corporate lending $ 178 $ 183 $ 231 $ 284 $ 397
0.46 % 0.49 % 0.69 % 0.90 % 1.29 % Commercial lending $ 474 $ 430 $ 470 $ 676 $ 694
0.34 % 0.31 % 0.36 % 0.52 % 0.55 % Total $ 652 $ 613 $ 701 $ 960 $1,091
0.37 % 0.35 % 0.42 % 0.60 % 0.70 %
Average loans and leases by productCommercial $108,479 $ 104,889 $ 99,794 $ 97,275 $ 94,938Leases 20,095 19,792 20,089 20,226 20,592 Foreign 11,748 10,473 9,384 9,023 8,680 Real estate 34,779 34,209 32,883 31,944 31,415 Consumer 33,579 32,307 31,070 26,665 25,101 Other 2,295 2,346 2,402 2,470 2,491 Total average loans and leases $210,975 $204,016 $195,622 $187,603 $183,217
(1) Includes gains (losses) on sales of debt securities.(2) Total corporate lending revenue $270 $387 $486 $635 $615 Less: impact of credit mitigation (83) (36) (18) 96 138 Corporate lending revenues excluding credit mitigation $353 $423 $504 $539 $477
(3) Criticized assets correspond to the Special Mention, Substandard and Doubtful asset categories defined by regulatory authorities. The criticized assets are on an end-of- period basis and are also shown as a percentage of total commercial utilized exposure, including loans and leases, SBLCs and financial guarantees, derivative assets, assets held-for-sale and commercial letters of credit.(4) Nonperforming assets are on an end-of-period basis and defined as nonperforming loans and leases plus forecasted property. The nonperforming ratio is nonperforming assets divided by commercial loans and leases plus commercial foreclosed properties.
Information for periods beginning January 1, 2006 includes the MBNA acquisition; prior periods have not been restated. 24

Bank of America Corporation
Source: Thomson Financial except Syndicated Loans and Leveraged Loans from Loan Pricing Corporation.
Significant U.S. market share gains
#1 in syndicated loans and leveraged loans, ranked by number of deals
Top 5 rankings in:Syndicated loansLeveraged loansHigh-yield debt
Global Corporate and Investment Banking Strategic Progress Continues
Banc of America Securities Market Share and Industry Ranking
20.3%
17.7%
10.7%
8.3%
9.3%
5.2%
9.4%
6.9%
4.0%
2.9%3.2%
4.9%
5.9%
6.5%
7.4%
7.6%
11.9%
12.0%
15.6%
18.3%
0% 5% 10% 15% 20% 25%
YTD 05
YTD 04
Syndicated loans #2
Mergers & acquisitions #10
Investment grade debt #5
Leveraged loans #3
High-yield debt #2
Public finance #7
Asset-backed securities #10
Mortgage-backed securities #6
Common stock underwriting #11
Convertible debt #8
Banc of America Securities Market Share and Industry Ranking
19.7%
18.3%
12.0%
8.5%
8.9%
9.5%
4.4%
5.5%
5.5%
2.4%3.4%
4.1%
4.9%
5.6%
5.8%
6.8%
7.7%
12.0%
13.8%
19.2%
0% 5% 10% 15% 20% 25%
1Q 06
1Q 05
Syndicated loans #2
Investment grade debt #6
Mergers & acquisitions #15
Leveraged loans #3
High-yield debt #2
Public finance #7
Asset-backed securities #10
Mortgage-backed securities #6
Common stock underwriting #11
Convertible debt #8
Information for periods beginning January 1, 2006 includes the MBNA acquisition; prior periods have not been restated. 25

Bank of America Corporation
(Dollars in millions, except as noted)
First Fourth Third Second FirstQuarter Quarter Quarter Quarter Quarter
2006 2005 2005 2005 2005Net interest income(2) $ 981 $1,001 $ 937 $ 923 $ 955Noninterest incomeInvestment and brokerage services 833 792 793 788 767 All other income 154 98 88 78 91 Total noninterest income 987 890 881 866 858 Total revenue(2) 1,968 1,891 1,818 1,789 1,813
Provision for credit losses (1) 1 (1) (9) 2 Noninterest expense 992 946 922 926 909 Income before income taxes 977 944 897 872 902 Income tax expense 363 337 328 315 318 Net income $ 614 $ 607 $ 569 $ 557 $ 584
Shareholder value added $336 $323 $311 $294 $336Net interest yield(2) 3.41 % 3.38 % 3.10 % 3.02 % 3.27 %Return on average equity 22.70 21.98 22.54 21.68 24.01 Efficiency ratio(2) 50.37 50.05 50.73 51.81 50.13
Balance Sheet
AverageTotal loans and leases $ 58,766 $ 57,187 $ 55,260 $ 53,049 $ 50,836Total earning assets 116,785 117,535 119,974 122,628 118,294 Total assets 124,571 125,312 127,805 130,485 125,977 Total deposits 114,001 114,859 118,136 120,256 116,108 Common equity/Allocated equity 10,975 10,954 10,014 10,298 9,863
Period EndTotal loans and leases $ 59,512 $ 58,380 $ 56,147 $ 54,332 $ 51,845Total assets 125,819 129,232 125,684 129,840 129,970 Total deposits 115,290 115,454 116,364 119,000 119,584
Client Assets (in billions)Assets under management $493.9 $482.4 $457.4 $442.8 $433.4Client brokerage assets 170.6 161.7 155.6 150.9 150.7 Assets in custody 97.0 94.2 96.1 101.7 100.8 Total client assets $761.5 $738.3 $709.1 $695.4 $684.9
(1) Global Wealth and Investment Management services clients through four major businesses: The Private Bank, Columbia Management, Premier Banking and Investments, and Other.(2) Fully taxable-equivalent basis
Certain prior period amounts have been reclassified among the segments to conform to the current period presentation.
Global Wealth and Investment Management Segment Results(1)
Information for periods beginning January 1, 2006 includes the MBNA acquisition; prior periods have not been restated. 26
Bank of America Corporation
(Dollars in millions)
First Quarter 2006PremierBanking
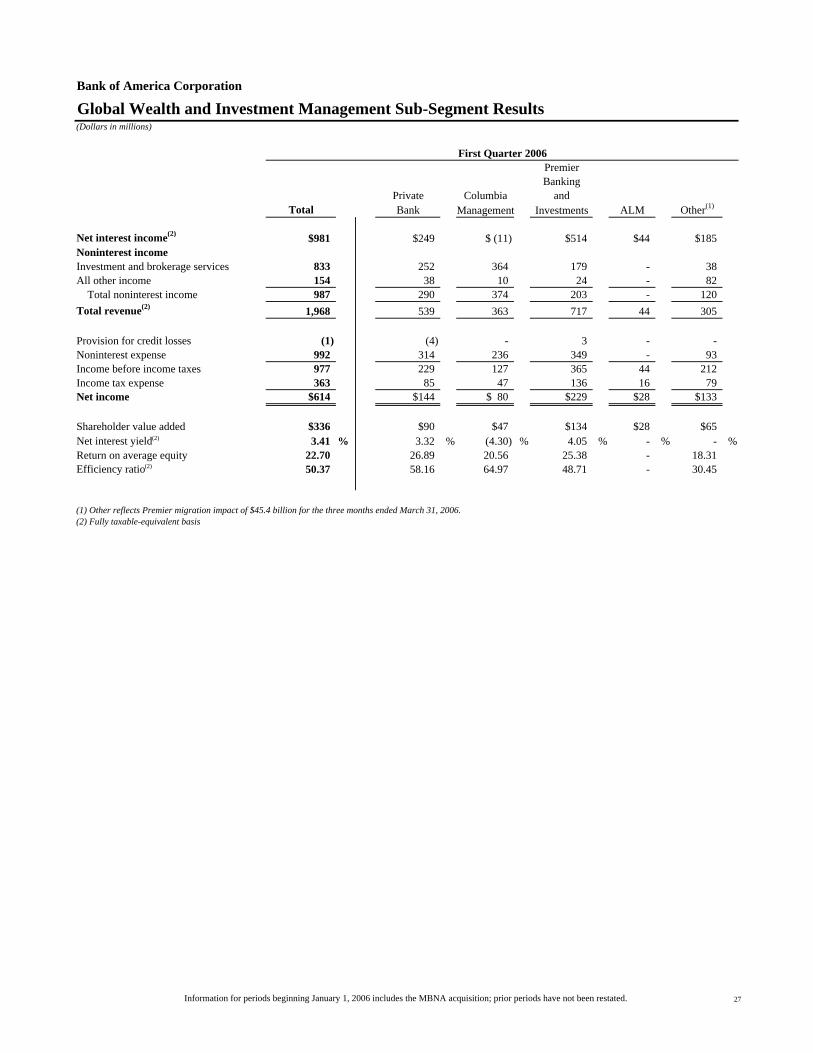
Private Columbia andTotal Bank Management Investments ALM Other(1)
Net interest income(2) $981 $249 $ (11) $514 $44 $185Noninterest incomeInvestment and brokerage services 833 252 364 179 - 38 All other income 154 38 10 24 - 82 Total noninterest income 987 290 374 203 - 120 Total revenue(2) 1,968 539 363 717 44 305
Provision for credit losses (1) (4) - 3 - - Noninterest expense 992 314 236 349 - 93 Income before income taxes 977 229 127 365 44 212 Income tax expense 363 85 47 136 16 79 Net income $614 $144 $ 80 $229 $28 $133
Shareholder value added $336 $90 $47 $134 $28 $65Net interest yield(2) 3.41 % 3.32 % (4.30) % 4.05 % - % - %Return on average equity 22.70 26.89 20.56 25.38 - 18.31 Efficiency ratio(2) 50.37 58.16 64.97 48.71 - 30.45
(1) Other reflects Premier migration impact of $45.4 billion for the three months ended March 31, 2006.(2) Fully taxable-equivalent basis
Global Wealth and Investment Management Sub-Segment Results
Information for periods beginning January 1, 2006 includes the MBNA acquisition; prior periods have not been restated. 27

Bank of America Corporation
(Dollars in millions)
First Quarter 2005PremierBanking
Private Columbia andTotal Bank Management Investments ALM Other(1)
Net interest income(2) $ 955 $242 $ 6 $377 $206 $124Noninterest incomeInvestment and brokerage services 767 256 315 164 - 32 All other income 91 15 11 34 - 31 Total noninterest income 858 271 326 198 - 63 Total revenue(2) 1,813 513 332 575 206 187
Provision for credit losses 2 (2) - 4 - - Noninterest expense 909 305 222 314 - 68 Income before income taxes 902 210 110 257 206 119 Income tax expense 318 75 39 87 76 41 Net income $ 584 $135 $ 71 $170 $130 $78
Shareholder value added $336 $84 $31 $85 $130 $136Net interest yield(2) 3.27 % 3.32 % 2.48 % 2.72 % - % - %Return on average equity 24.01 26.60 15.73 21.71 - 11.72 Efficiency ratio(2) 50.13 59.44 66.79 54.70 - 36.17
(1) Other reflects Premier migration impact of $32.4 billion for the three months ended March 31, 2005.(2) Fully taxable-equivalent basis
Certain prior period amounts have been reclassified to conform to current period presentation.
Global Wealth and Investment Management Sub-Segment Results
Information for periods beginning January 1, 2006 includes the MBNA acquisition; prior periods have not been restated. 28
Bank of America Corporation
(Dollars in millions, except as noted)
First Fourth Third Second FirstQuarter Quarter Quarter Quarter Quarter
2006 2005 2005 2005 2005
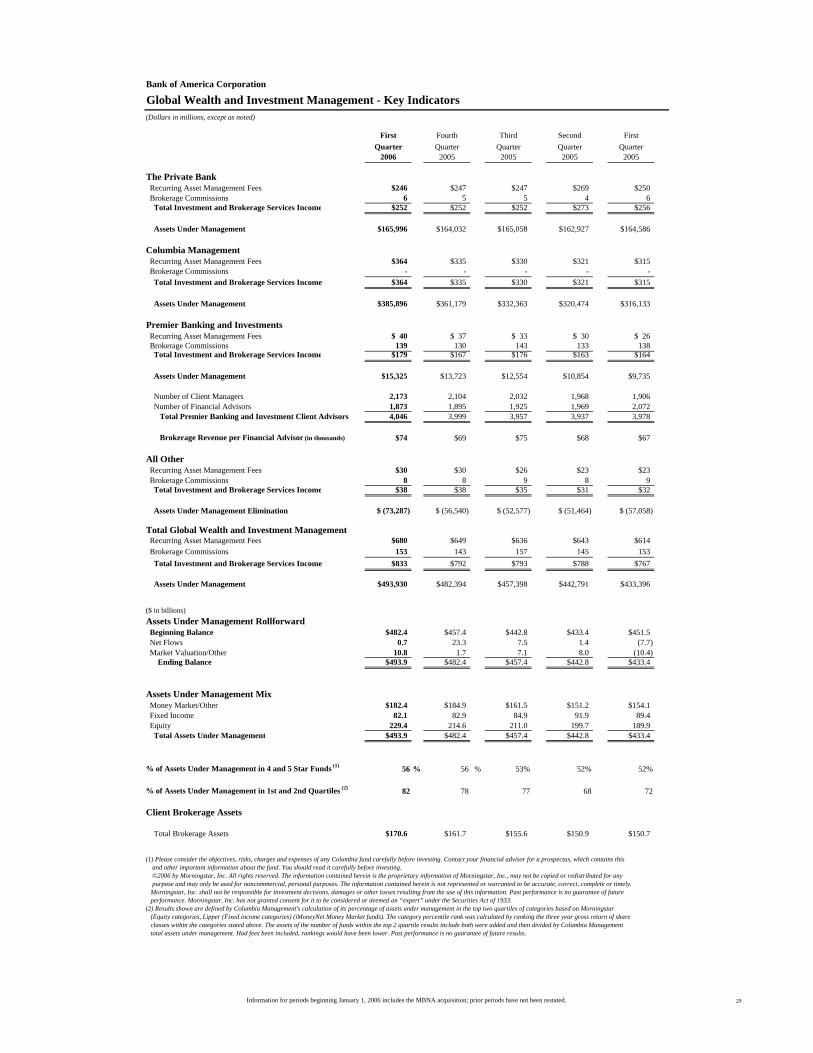
The Private Bank Recurring Asset Management Fees $246 $247 $247 $269 $250 Brokerage Commissions 6 5 5 4 6 Total Investment and Brokerage Services Income $252 $252 $252 $273 $256
Assets Under Management $165,996 $164,032 $165,058 $162,927 $164,586
Columbia Management Recurring Asset Management Fees $364 $335 $330 $321 $315 Brokerage Commissions - - - - - Total Investment and Brokerage Services Income $364 $335 $330 $321 $315
Assets Under Management $385,896 $361,179 $332,363 $320,474 $316,133
Premier Banking and Investments Recurring Asset Management Fees $ 40 $ 37 $ 33 $ 30 $ 26 Brokerage Commissions 139 130 143 133 138 Total Investment and Brokerage Services Income $179 $167 $176 $163 $164
Assets Under Management $15,325 $13,723 $12,554 $10,854 $9,735
Number of Client Managers 2,173 2,104 2,032 1,968 1,906 Number of Financial Advisors 1,873 1,895 1,925 1,969 2,072 Total Premier Banking and Investment Client Advisors 4,046 3,999 3,957 3,937 3,978
Brokerage Revenue per Financial Advisor (in thousands) $74 $69 $75 $68 $67
All Other Recurring Asset Management Fees $30 $30 $26 $23 $23 Brokerage Commissions 8 8 9 8 9 Total Investment and Brokerage Services Income $38 $38 $35 $31 $32
Assets Under Management Elimination $ (73,287) $ (56,540) $ (52,577) $ (51,464) $ (57,058)
Total Global Wealth and Investment Management Recurring Asset Management Fees $680 $649 $636 $643 $614 Brokerage Commissions 153 143 157 145 153 Total Investment and Brokerage Services Income $833 $792 $793 $788 $767
Assets Under Management $493,930 $482,394 $457,398 $442,791 $433,396
($ in billions)Assets Under Management Rollforward Beginning Balance $482.4 $457.4 $442.8 $433.4 $451.5 Net Flows 0.7 23.3 7.5 1.4 (7.7) Market Valuation/Other 10.8 1.7 7.1 8.0 (10.4) Ending Balance $493.9 $482.4 $457.4 $442.8 $433.4
Assets Under Management Mix Money Market/Other $182.4 $184.9 $161.5 $151.2 $154.1 Fixed Income 82.1 82.9 84.9 91.9 89.4 Equity 229.4 214.6 211.0 199.7 189.9 Total Assets Under Management $493.9 $482.4 $457.4 $442.8 $433.4
% of Assets Under Management in 4 and 5 Star Funds (1) 56 % 56 % 53% 52% 52%
% of Assets Under Management in 1st and 2nd Quartiles (2) 82 78 77 68 72
Client Brokerage Assets
Total Brokerage Assets $170.6 $161.7 $155.6 $150.9 $150.7
(1) Please consider the objectives, risks, charges and expenses of any Columbia fund carefully before investing. Contact your financial advisor for a prospectus, which contains this and other important information about the fund. You should read it carefully before investing. ©2006 by Morningstar, Inc. All rights reserved. The information contained herein is the proprietary information of Morningstar, Inc., may not be copied or redistributed for any purpose and may only be used for noncommercial, personal purposes. The information contained herein is not represented or warranted to be accurate, correct, complete or timely. Morningstar, Inc. shall not be responsible for investment decisions, damages or other losses resulting from the use of this information. Past performance is no guarantee of future performance. Morningstar, Inc. has not granted consent for it to be considered or deemed an “expert” under the Securities Act of 1933.(2) Results shown are defined by Columbia Management's calculation of its percentage of assets under management in the top two quartiles of categories based on Morningstar (Equity categories, Lipper (Fixed income categories) (iMoneyNet Money Market funds). The category percentile rank was calculated by ranking the three year gross return of share classes within the categories stated above. The assets of the number of funds within the top 2 quartile results include both were added and then divided by Columbia Management total assets under management. Had fees been included, rankings would have been lower. Past performance is no guarantee of future results.
Global Wealth and Investment Management - Key Indicators
Information for periods beginning January 1, 2006 includes the MBNA acquisition; prior periods have not been restated. 29

Bank of America Corporation
(Dollars in millions)
First Fourth Third Second FirstQuarter Quarter Quarter Quarter Quarter
2006 2005 2005 2005 2005Net interest income(2) $ (55) $ 5 $ 25 $ 33 $ (320)Noninterest incomeEquity investment gains 513 453 596 479 264 All other income (246) (534) (631) 675 (319) Total noninterest income 267 (81) (35) 1,154 (55) Total revenue(2) 212 (76) (10) 1,187 (375)
Provision for credit losses (25) 3 41 (22) 19 Gains (losses) on sales of debt securities (8) (23) 13 204 630 Merger and restructuring charges 98 59 120 121 112 All other noninterest expense 115 34 123 23 93 Income before income taxes 16 (195) (281) 1,269 31 Income tax expense (benefit) (95) (163) (176) 406 (49) Net income $111 $ (32) $ (105) $ 863 $ 80
Shareholder value added $ (175) $ (406) $ (598) $450 $ (338)
Balance SheetAverageTotal loans and leases $133,326 $128,152 $122,390 $118,078 $128,478Total earning assets 227,588 159,157 151,296 137,174 123,763 Total assets 274,206 199,539 191,684 178,030 162,025 Total deposits 17,694 14,677 15,204 22,346 24,465
Period EndTotal loans and leases $136,700 $131,123 $129,878 $121,223 $129,762Total assets 259,174 197,953 197,509 186,620 156,965 Total deposits 28,120 14,762 12,537 19,350 22,336
(1) All Other consists primarily of Equity Investments, the residual impact of the allowance for credit losses process, Merger and Restructuring charges, intersegment eliminations, and the results of certain consumer finance and commercial lending businesses that are being liquidated.(2) Fully taxable-equivalent basis
Certain prior period amounts have been reclassified among the segments to conform to the current period presentation.
All Other Results(1)
Information for periods beginning January 1, 2006 includes the MBNA acquisition; prior periods have not been restated. 30

Bank of America Corporation
Outstanding Loans and Leases(Dollars in millions)
March 31 December 31 Increase2006 2005 from 12/31/05
ConsumerResidential mortgage $188,261 $182,596 $ 5,665Credit card - domestic 64,490 58,548 5,942 Credit card - foreign 7,789 - 7,789 Home equity lines 65,516 62,098 3,418 Direct/Indirect consumer 55,127 45,490 9,637 Other consumer(1) 10,528 6,725 3,803
Total consumer 391,711 355,457 36,254
CommercialCommercial - domestic 146,737 140,533 6,204 Commercial real estate(2) 36,337 35,766 571 Commercial lease financing 20,813 20,705 108 Commercial - foreign 23,927 21,330 2,597
Total commercial 227,814 218,334 9,480 Total $619,525 $573,791 $45,734
(1) Includes consumer finance of $2,950 million and $2,849 million; foreign consumer of $7,560 million and $3,841 million; and consumer lease financing of $18 million and $35 million at March 31, 2006 and December 31, 2005.(2) Includes domestic commercial real estate loans of $35,666 million and $35,181 million; and foreign commercial real estate loans of $671 million and $585 million at March 31, 2006 and December 31, 2005.
Information for periods beginning January 1, 2006 includes the MBNA acquisition; prior periods have not been restated. 31
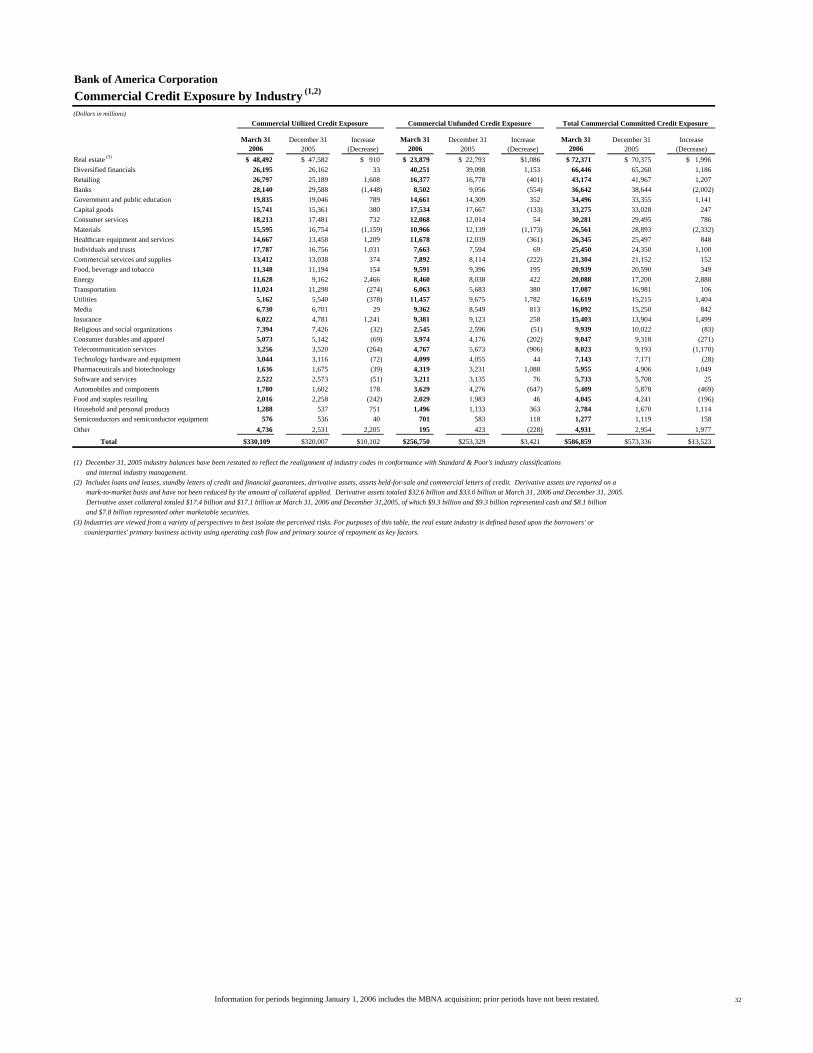
Bank of America CorporationCommercial Credit Exposure by Industry (1,2)
(Dollars in millions)
March 31 2006
December 31 2005
Increase (Decrease)
March 31 2006
December 31 2005
Increase (Decrease)
March 31 2006
December 31 2005
Increase (Decrease)
Real estate (3) $ 48,492 $ 47,582 $ 910 $ 23,879 $ 22,793 $1,086 $ 72,371 $ 70,375 $ 1,996Diversified financials 26,195 26,162 33 40,251 39,098 1,153 66,446 65,260 1,186 Retailing 26,797 25,189 1,608 16,377 16,778 (401) 43,174 41,967 1,207 Banks 28,140 29,588 (1,448) 8,502 9,056 (554) 36,642 38,644 (2,002) Government and public education 19,835 19,046 789 14,661 14,309 352 34,496 33,355 1,141 Capital goods 15,741 15,361 380 17,534 17,667 (133) 33,275 33,028 247 Consumer services 18,213 17,481 732 12,068 12,014 54 30,281 29,495 786 Materials 15,595 16,754 (1,159) 10,966 12,139 (1,173) 26,561 28,893 (2,332) Healthcare equipment and services 14,667 13,458 1,209 11,678 12,039 (361) 26,345 25,497 848 Individuals and trusts 17,787 16,756 1,031 7,663 7,594 69 25,450 24,350 1,100 Commercial services and supplies 13,412 13,038 374 7,892 8,114 (222) 21,304 21,152 152 Food, beverage and tobacco 11,348 11,194 154 9,591 9,396 195 20,939 20,590 349 Energy 11,628 9,162 2,466 8,460 8,038 422 20,088 17,200 2,888 Transportation 11,024 11,298 (274) 6,063 5,683 380 17,087 16,981 106 Utilities 5,162 5,540 (378) 11,457 9,675 1,782 16,619 15,215 1,404 Media 6,730 6,701 29 9,362 8,549 813 16,092 15,250 842 Insurance 6,022 4,781 1,241 9,381 9,123 258 15,403 13,904 1,499 Religious and social organizations 7,394 7,426 (32) 2,545 2,596 (51) 9,939 10,022 (83) Consumer durables and apparel 5,073 5,142 (69) 3,974 4,176 (202) 9,047 9,318 (271) Telecommunication services 3,256 3,520 (264) 4,767 5,673 (906) 8,023 9,193 (1,170) Technology hardware and equipment 3,044 3,116 (72) 4,099 4,055 44 7,143 7,171 (28) Pharmaceuticals and biotechnology 1,636 1,675 (39) 4,319 3,231 1,088 5,955 4,906 1,049 Software and services 2,522 2,573 (51) 3,211 3,135 76 5,733 5,708 25 Automobiles and components 1,780 1,602 178 3,629 4,276 (647) 5,409 5,878 (469) Food and staples retailing 2,016 2,258 (242) 2,029 1,983 46 4,045 4,241 (196) Household and personal products 1,288 537 751 1,496 1,133 363 2,784 1,670 1,114 Semiconductors and semiconductor equipment 576 536 40 701 583 118 1,277 1,119 158 Other 4,736 2,531 2,205 195 423 (228) 4,931 2,954 1,977
Total $330,109 $320,007 $10,102 $256,750 $253,329 $3,421 $586,859 $573,336 $13,523
(1) December 31, 2005 industry balances have been restated to reflect the realignment of industry codes in conformance with Standard & Poor's industry classifications and internal industry management.(2) Includes loans and leases, standby letters of credit and financial guarantees, derivative assets, assets held-for-sale and commercial letters of credit. Derivative assets are reported on a mark-to-market basis and have not been reduced by the amount of collateral applied. Derivative assets totaled $32.6 billion and $33.0 billion at March 31, 2006 and December 31, 2005. Derivative asset collateral totaled $17.4 billion and $17.1 billion at March 31, 2006 and December 31,2005, of which $9.3 billion and $9.3 billion represented cash and $8.1 billion and $7.8 billion represented other marketable securities.(3) Industries are viewed from a variety of perspectives to best isolate the perceived risks. For purposes of this table, the real estate industry is defined based upon the borrowers' or counterparties' primary business activity using operating cash flow and primary source of repayment as key factors.
Commercial Utilized Credit Exposure Commercial Unfunded Credit Exposure Total Commercial Committed Credit Exposure
Information for periods beginning January 1, 2006 includes the MBNA acquisition; prior periods have not been restated. 32
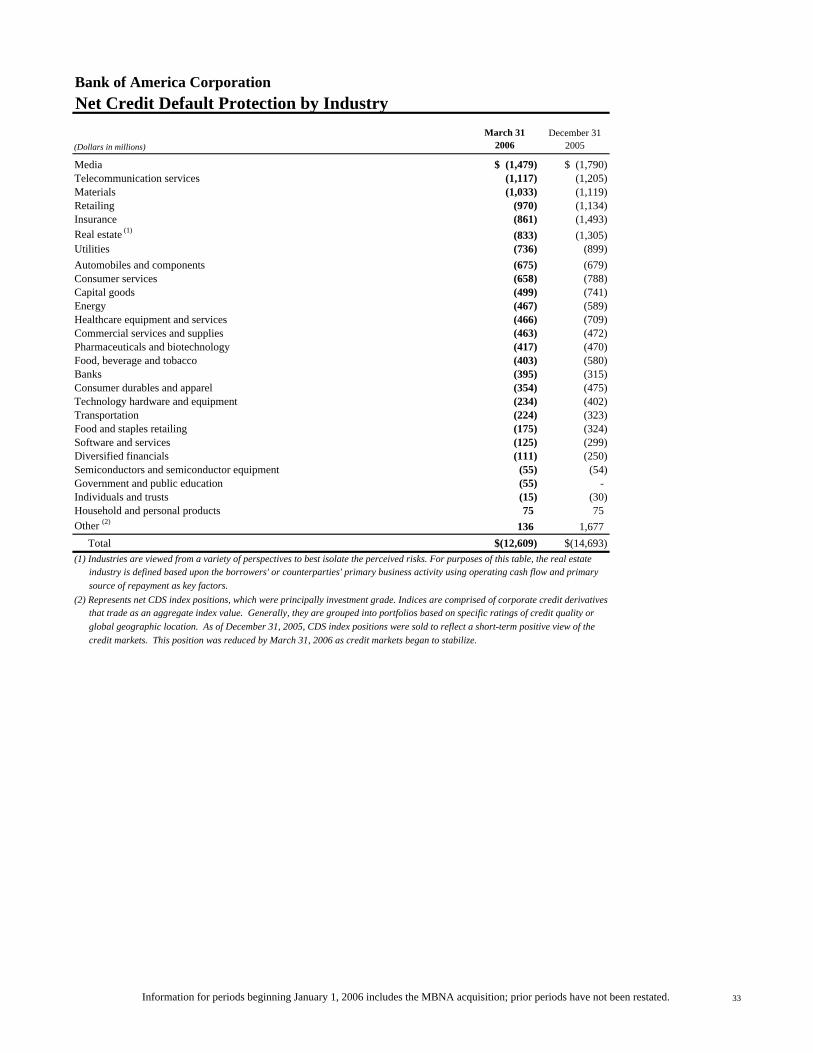
Bank of America CorporationNet Credit Default Protection by Industry
(Dollars in millions)March 31
2006December 31
2005 Media $ (1,479) $ (1,790)Telecommunication services (1,117) (1,205) Materials (1,033) (1,119) Retailing (970) (1,134) Insurance (861) (1,493) Real estate (1) (833) (1,305) Utilities (736) (899) Automobiles and components (675) (679) Consumer services (658) (788) Capital goods (499) (741) Energy (467) (589) Healthcare equipment and services (466) (709) Commercial services and supplies (463) (472) Pharmaceuticals and biotechnology (417) (470) Food, beverage and tobacco (403) (580) Banks (395) (315) Consumer durables and apparel (354) (475) Technology hardware and equipment (234) (402) Transportation (224) (323) Food and staples retailing (175) (324) Software and services (125) (299) Diversified financials (111) (250) Semiconductors and semiconductor equipment (55) (54) Government and public education (55) - Individuals and trusts (15) (30) Household and personal products 75 75 Other (2) 136 1,677 Total $(12,609) $(14,693)(1) Industries are viewed from a variety of perspectives to best isolate the perceived risks. For purposes of this table, the real estate industry is defined based upon the borrowers' or counterparties' primary business activity using operating cash flow and primary source of repayment as key factors. (2) Represents net CDS index positions, which were principally investment grade. Indices are comprised of corporate credit derivatives that trade as an aggregate index value. Generally, they are grouped into portfolios based on specific ratings of credit quality or global geographic location. As of December 31, 2005, CDS index positions were sold to reflect a short-term positive view of the credit markets. This position was reduced by March 31, 2006 as credit markets began to stabilize.
Information for periods beginning January 1, 2006 includes the MBNA acquisition; prior periods have not been restated. 33

Bank of America CorporationNet Credit Default Protection by Maturity Profile
March 31 December 31
2006 2005
Less than or equal to one year 3 % - %
Greater than one year and less than or equal to five years 64 65Greater than five years 33 35 Total 100 % 100 %
Net Credit Default Protection by Credit Exposure Debt Rating(Dollars in millions)
Ratings Net Notional Percent Net Notional Percent
AAA $ (5) - % $ 22 0.2 %
AA 255 2.0 523 3.6 A 3,894 30.9 4,861 33.1 BBB 6,455 51.2 8,572 58.2 BB 1,377 10.9 1,792 12.2 B 597 4.7 424 2.9 CCC and below 141 1.1 149 1.0 NR (1) (105) (0.8) (1,650) (11.2) Total $12,609 100.0 % $14,693 100.0 %
(1) In addition to unrated names, "NR" includes $136 million and $1,677 million in net CDS index positions at March 31, 2006 and
December 31, 2005. While index positions are principally investment grade, CDS indices include names in and across each of
the ratings categories.
March 31, 2006 December 31, 2005
Information for periods beginning January 1, 2006 includes the MBNA acquisition; prior periods have not been restated. 34
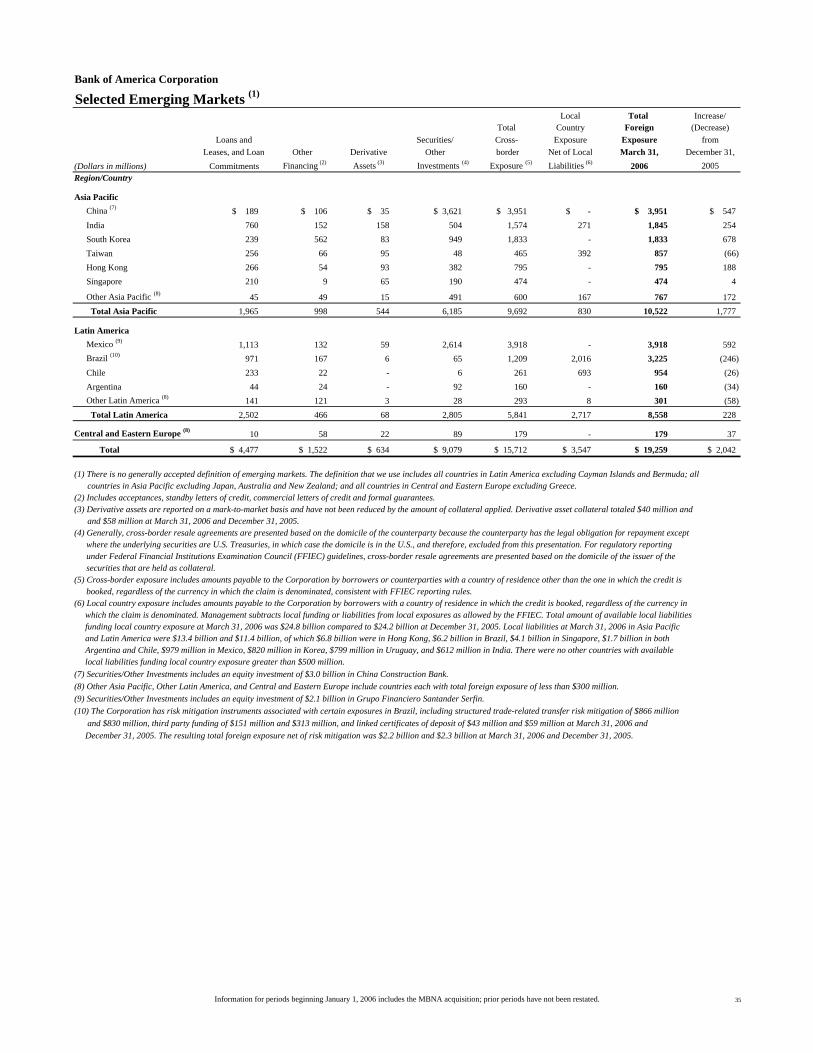
Bank of America Corporation
Selected Emerging Markets (1)
Local Total Increase/Total Country Foreign (Decrease)
Loans and Securities/ Cross- Exposure Exposure fromLeases, and Loan Other Derivative Other border Net of Local March 31, December 31,
(Dollars in millions) Commitments Financing (2) Assets (3) Investments (4) Exposure (5) Liabilities (6) 2006 2005 Region/Country
Asia PacificChina (7) $ 189 $ 106 $ 35 $ 3,621 $ 3,951 $ - $ 3,951 $ 547India 760 152 158 504 1,574 271 1,845 254 South Korea 239 562 83 949 1,833 - 1,833 678 Taiwan 256 66 95 48 465 392 857 (66) Hong Kong 266 54 93 382 795 - 795 188 Singapore 210 9 65 190 474 - 474 4
Other Asia Pacific (8) 45 49 15 491 600 167 767 172 Total Asia Pacific 1,965 998 544 6,185 9,692 830 10,522 1,777
Latin AmericaMexico (9) 1,113 132 59 2,614 3,918 - 3,918 592 Brazil (10) 971 167 6 65 1,209 2,016 3,225 (246) Chile 233 22 - 6 261 693 954 (26) Argentina 44 24 - 92 160 - 160 (34) Other Latin America (8) 141 121 3 28 293 8 301 (58) Total Latin America 2,502 466 68 2,805 5,841 2,717 8,558 228
Central and Eastern Europe (8) 10 58 22 89 179 - 179 37
Total $ 4,477 $ 1,522 $ 634 $ 9,079 $ 15,712 $ 3,547 $ 19,259 $ 2,042
(1) There is no generally accepted definition of emerging markets. The definition that we use includes all countries in Latin America excluding Cayman Islands and Bermuda; all countries in Asia Pacific excluding Japan, Australia and New Zealand; and all countries in Central and Eastern Europe excluding Greece.(2) Includes acceptances, standby letters of credit, commercial letters of credit and formal guarantees.(3) Derivative assets are reported on a mark-to-market basis and have not been reduced by the amount of collateral applied. Derivative asset collateral totaled $40 million and and $58 million at March 31, 2006 and December 31, 2005.(4) Generally, cross-border resale agreements are presented based on the domicile of the counterparty because the counterparty has the legal obligation for repayment except
where the underlying securities are U.S. Treasuries, in which case the domicile is in the U.S., and therefore, excluded from this presentation. For regulatory reporting under Federal Financial Institutions Examination Council (FFIEC) guidelines, cross-border resale agreements are presented based on the domicile of the issuer of the securities that are held as collateral.
(5) Cross-border exposure includes amounts payable to the Corporation by borrowers or counterparties with a country of residence other than the one in which the credit is booked, regardless of the currency in which the claim is denominated, consistent with FFIEC reporting rules.
(6) Local country exposure includes amounts payable to the Corporation by borrowers with a country of residence in which the credit is booked, regardless of the currency in which the claim is denominated. Management subtracts local funding or liabilities from local exposures as allowed by the FFIEC. Total amount of available local liabilities funding local country exposure at March 31, 2006 was $24.8 billion compared to $24.2 billion at December 31, 2005. Local liabilities at March 31, 2006 in Asia Pacific and Latin America were $13.4 billion and $11.4 billion, of which $6.8 billion were in Hong Kong, $6.2 billion in Brazil, $4.1 billion in Singapore, $1.7 billion in both Argentina and Chile, $979 million in Mexico, $820 million in Korea, $799 million in Uruguay, and $612 million in India. There were no other countries with available local liabilities funding local country exposure greater than $500 million.(7) Securities/Other Investments includes an equity investment of $3.0 billion in China Construction Bank.(8) Other Asia Pacific, Other Latin America, and Central and Eastern Europe include countries each with total foreign exposure of less than $300 million.(9) Securities/Other Investments includes an equity investment of $2.1 billion in Grupo Financiero Santander Serfin.(10) The Corporation has risk mitigation instruments associated with certain exposures in Brazil, including structured trade-related transfer risk mitigation of $866 million and $830 million, third party funding of $151 million and $313 million, and linked certificates of deposit of $43 million and $59 million at March 31, 2006 and December 31, 2005. The resulting total foreign exposure net of risk mitigation was $2.2 billion and $2.3 billion at March 31, 2006 and December 31, 2005.
Information for periods beginning January 1, 2006 includes the MBNA acquisition; prior periods have not been restated. 35

Bank of America Corporation
March 31 December 31 September 30 June 30 March 312006 2005 2005 2005 2005
Residential mortgage $ 538 $ 570 $ 493 $ 494 $ 536Home equity lines 121 117 88 75 70 Direct/Indirect consumer 34 37 32 33 32 Other consumer 92 61 75 76 83 Total consumer 785 785 688 678 721 Commercial - domestic 631 581 641 662 811Commercial real estate 72 49 44 60 64 Commercial lease financing 53 62 61 282 249 Commercial - foreign 43 34 64 88 228 Total commercial 799 726 810 1,092 1,352 Total nonperforming loans and leases 1,584 1,511 1,498 1,770 2,073 Nonperforming securities(1) - - - 14 153 Foreclosed properties 96 92 99 111 112 Total nonperforming assets(2) $1,680 $1,603 $1,597 $1,895 $2,338
Loans past due 90 days or more and still accruing $1,924 $1,455 $1,417 $1,235 $1,211Nonperforming assets / Total assets 0.12 % 0.12 % 0.13 % 0.15 % 0.19 %Nonperforming assets / Total loans, leases and foreclosed properties 0.27 0.28 0.29 0.36 0.44 Nonperforming loans and leases / Total loans and leases 0.26 0.26 0.27 0.33 0.39
Allowance for credit losses: Allowance for loan and lease losses $9,067 $8,045 $8,326 $8,319 $8,313 Reserve for unfunded lending commitments 395 395 390 383 394 Total $9,462 $8,440 $8,716 $8,702 $8,707
Allowance for loan and lease losses / Total loans and leases 1.46 % 1.40 % 1.50 % 1.57 % 1.57 %Allowance for loan and lease losses / Total nonperforming loans and leases 572 532 556 470 401
Commercial criticized exposure $7,262 $7,527 $7,632 $7,731 $8,858Commercial criticized exposure / Commercial utilized exposure 2.20 % 2.35 % 2.47 % 2.59 % 2.95 %
Loans are classified as domestic or foreign based upon the domicile of the borrower.
(1) The decline in nonperforming securities was primarily driven by an exchange of nonperforming securities for performing securities in Argentina that resulted from the completion of a government mandated securities exchange program.(2) Balances do not include $62 million, $50 million, $93 million, $49 million and $76 million of nonperforming commercial assets, primarily commercial loans held-for-sale, included in Other Assets at March 31, 2006, December 31, 2005, September 30, 2005, June 30, 2005 and March 31, 2005, respectively.
Nonperforming Assets(Dollars in millions)
Information for periods beginning January 1, 2006 includes the MBNA acquisition; prior periods have not been restated. 36
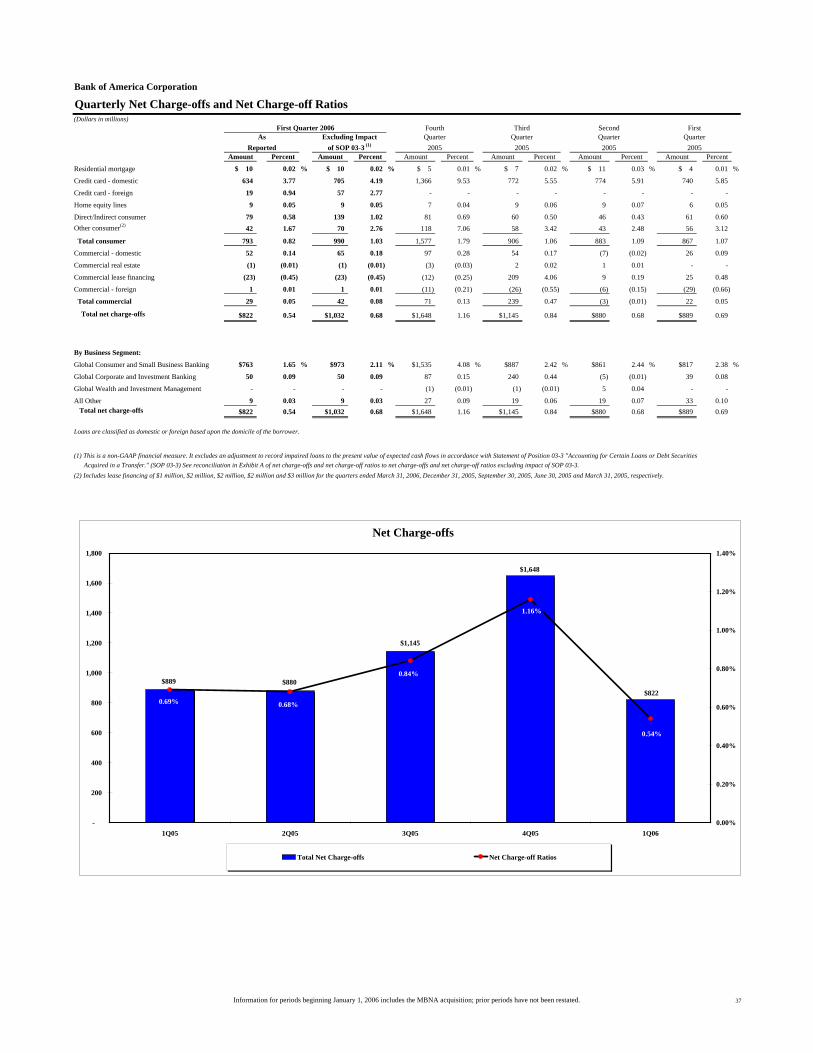
Bank of America Corporation
Amount Percent Amount Percent Amount Percent Amount Percent Amount Percent Amount Percent
Residential mortgage $ 10 0.02 % $ 10 0.02 % $ 5 0.01 % $ 7 0.02 % $ 11 0.03 % $ 4 0.01 %
Credit card - domestic 634 3.77 705 4.19 1,366 9.53 772 5.55 774 5.91 740 5.85
Credit card - foreign 19 0.94 57 2.77 - - - - - - - -
Home equity lines 9 0.05 9 0.05 7 0.04 9 0.06 9 0.07 6 0.05
Direct/Indirect consumer 79 0.58 139 1.02 81 0.69 60 0.50 46 0.43 61 0.60 Other consumer(2) 42 1.67 70 2.76 118 7.06 58 3.42 43 2.48 56 3.12
Total consumer 793 0.82 990 1.03 1,577 1.79 906 1.06 883 1.09 867 1.07
Commercial - domestic 52 0.14 65 0.18 97 0.28 54 0.17 (7) (0.02) 26 0.09
Commercial real estate (1) (0.01) (1) (0.01) (3) (0.03) 2 0.02 1 0.01 - -
Commercial lease financing (23) (0.45) (23) (0.45) (12) (0.25) 209 4.06 9 0.19 25 0.48
Commercial - foreign 1 0.01 1 0.01 (11) (0.21) (26) (0.55) (6) (0.15) (29) (0.66)
Total commercial 29 0.05 42 0.08 71 0.13 239 0.47 (3) (0.01) 22 0.05
Total net charge-offs $822 0.54 $1,032 0.68 $1,648 1.16 $1,145 0.84 $880 0.68 $889 0.69
By Business Segment:
Global Consumer and Small Business Banking $763 1.65 % $973 2.11 % $1,535 4.08 % $887 2.42 % $861 2.44 % $817 2.38 %
Global Corporate and Investment Banking 50 0.09 50 0.09 87 0.15 240 0.44 (5) (0.01) 39 0.08
Global Wealth and Investment Management - - - - (1) (0.01) (1) (0.01) 5 0.04 - -
All Other 9 0.03 9 0.03 27 0.09 19 0.06 19 0.07 33 0.10 Total net charge-offs $822 0.54 $1,032 0.68 $1,648 1.16 $1,145 0.84 $880 0.68 $889 0.69
Loans are classified as domestic or foreign based upon the domicile of the borrower.
(1) This is a non-GAAP financial measure. It excludes an adjustment to record impaired loans to the present value of expected cash flows in accordance with Statement of Position 03-3 "Accounting for Certain Loans or Debt Securities Acquired in a Transfer." (SOP 03-3) See reconciliation in Exhibit A of net charge-offs and net charge-off ratios to net charge-offs and net charge-off ratios excluding impact of SOP 03-3.(2) Includes lease financing of $1 million, $2 million, $2 million, $2 million and $3 million for the quarters ended March 31, 2006, December 31, 2005, September 30, 2005, June 30, 2005 and March 31, 2005, respectively.
AsReported
Quarterly Net Charge-offs and Net Charge-off Ratios(Dollars in millions)
Fourth Third Second FirstFirst Quarter 2006Quarter
2005Excluding Impact Quarter Quarter Quarter
of SOP 03-3 (1) 2005 2005 2005
(Dollars in millions)(Dollars in millions)
Net Charge-offs
$889
$1,145
$1,648
$880 $822
0.69% 0.68%
0.84%
1.16%
0.54%
-
200
400
600
800
1,000
1,200
1,400
1,600
1,800
1Q05 2Q05 3Q05 4Q05 1Q060.00%
0.20%
0.40%
0.60%
0.80%
1.00%
1.20%
1.40%
Total Net Charge-offs Net Charge-off Ratios
Information for periods beginning January 1, 2006 includes the MBNA acquisition; prior periods have not been restated. 37
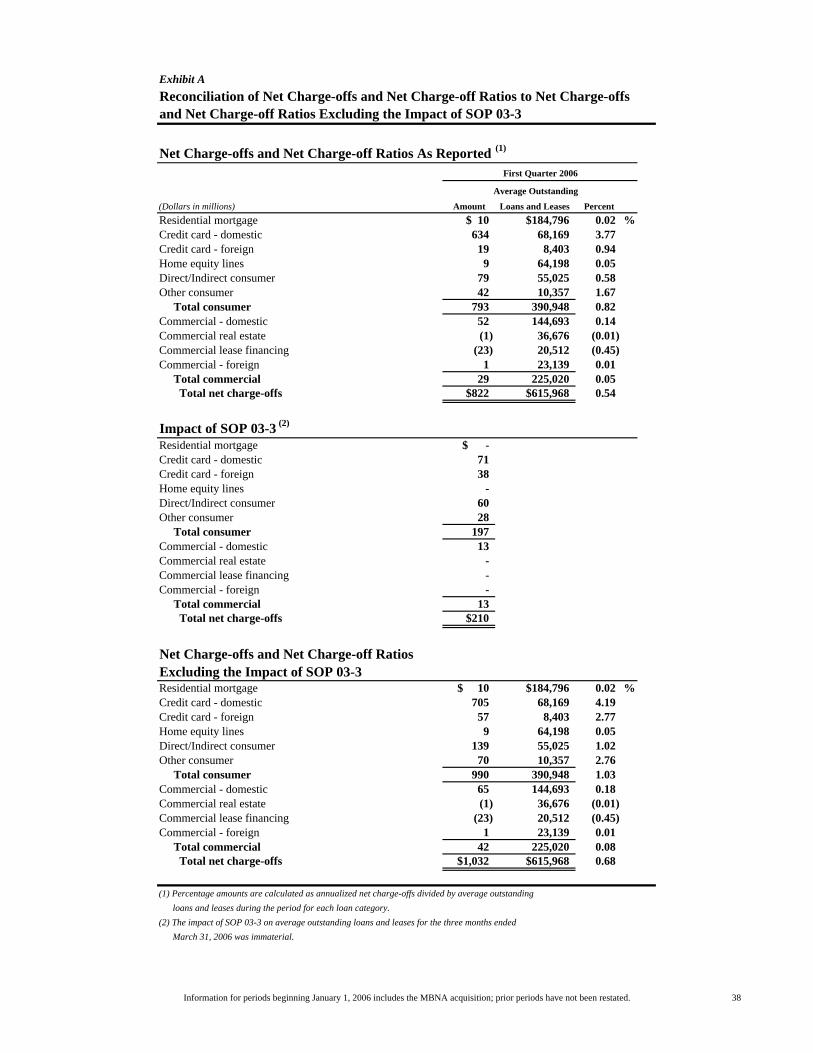
Exhibit A Reconciliation of Net Charge-offs and Net Charge-off Ratios to Net Charge-offs and Net Charge-off Ratios Excluding the Impact of SOP 03-3
Net Charge-offs and Net Charge-off Ratios As Reported (1)
Average Outstanding
(Dollars in millions) Amount Loans and Leases PercentResidential mortgage $ 10 $184,796 0.02 %Credit card - domestic 634 68,169 3.77Credit card - foreign 19 8,403 0.94Home equity lines 9 64,198 0.05Direct/Indirect consumer 79 55,025 0.58Other consumer 42 10,357 1.67 Total consumer 793 390,948 0.82Commercial - domestic 52 144,693 0.14Commercial real estate (1) 36,676 (0.01)Commercial lease financing (23) 20,512 (0.45)Commercial - foreign 1 23,139 0.01 Total commercial 29 225,020 0.05 Total net charge-offs $822 $615,968 0.54
Impact of SOP 03-3 (2)
Residential mortgage $ -Credit card - domestic 71Credit card - foreign 38Home equity lines -Direct/Indirect consumer 60Other consumer 28 Total consumer 197 Commercial - domestic 13Commercial real estate -Commercial lease financing -Commercial - foreign - Total commercial 13 Total net charge-offs $210
Net Charge-offs and Net Charge-off Ratios Excluding the Impact of SOP 03-3Residential mortgage $ 10 $184,796 0.02 %Credit card - domestic 705 68,169 4.19Credit card - foreign 57 8,403 2.77Home equity lines 9 64,198 0.05Direct/Indirect consumer 139 55,025 1.02Other consumer 70 10,357 2.76 Total consumer 990 390,948 1.03Commercial - domestic 65 144,693 0.18Commercial real estate (1) 36,676 (0.01)Commercial lease financing (23) 20,512 (0.45)Commercial - foreign 1 23,139 0.01 Total commercial 42 225,020 0.08 Total net charge-offs $1,032 $615,968 0.68
(1) Percentage amounts are calculated as annualized net charge-offs divided by average outstanding loans and leases during the period for each loan category.(2) The impact of SOP 03-3 on average outstanding loans and leases for the three months ended March 31, 2006 was immaterial.
First Quarter 2006
Information for periods beginning January 1, 2006 includes the MBNA acquisition; prior periods have not been restated. 38
Top Related