


Languages
Pages
Legal

Liquid Chromatography
Sample Preparation
Gas Chromatography
Standards
Accessories
Chiral Chromatography
ReporterVolume 28.5
Separation of Closely Related Compounds
Ascentis Express F5 HPLC columns, due to enhanced shape selectivity,
provide the separation of closely related compounds.
2
Reporter Visit us on the web at
sigma-aldrich.com/thereporter
Reporter is published 5 times a year by Supelco Marketing, 595 North Harrison Road, Bellefonte, PA 16823-0048.
What Supelco Brings to the Table
Wayne Way
Market Segment Manager
HPLCDear Colleague:
In my role as Market Segment Manager for HPLC, I have the privilege of meeting fellow chromatographers.
Often I am asked to tell them about Supelco, who we are and what we represent, compared to the other
chromatography companies. In the few words I have for this editorial, I’d like to share my thoughts on this.
The Sigma-Aldrich Mission is Enabling Science to Improve the Quality of Life.
That sounds good, but from a practical standpoint, what does it mean to our customers?
How do we Enable Science, within the Supelco Analytical HPLC Offering?
It's through a combination of internal product development, partnering with companies to be their
innovation outlet, and providing the supply chain power of our parent company, Sigma-Aldrich, to leading
chromatography products from many manufacturers. No other chromatography company, whether it is a
major distributor or a world-class innovator, can offer this breadth of products. As an example of this breadth,
let's take a look at a sampling of what Supelco can provide to the HPLC chromatographer.
Small Molecule HPLC Columns● Ascentis® Express with Fused-Core® Particle Technology – Delivers twice the speed and
performance of traditional columns at half of the backpressure of sub-2 micron columns.
● SUPELCOSIL® – One of the most well-known chromatography products worldwide which is benchmarked in many reference journals.
● Kromasil® Eternity – A silica platform column capable of wide pH operation that provides method development flexibility and increased loading of bases for purification.
● Hamilton® PRP Columns – Well-known polymeric columns that are written into many methods.
● Other Important HPLC Column Brands – Nucleosil®, Spherisorb®, and Lichrosorb®, just to name a few, are historically important products written into many HPLC methods.
Large Molecule HPLC Columns● TSKGEL® Columns – World class leader in GFC, IEX column technology.
● Discovery® HPLC Columns – Supelco brand HPLC columns designed for protein and peptide separations.
Chiral HPLC Columns● Astec Chiral Columns – CHIROBIOTIC® and CYCLOBOND™ columns for reversed-phase and
LC-MS chiral applications developed in collaboration with Prof Dan Armstrong.
● Kromasil AmyCoat™ and CelluCoat™ Columns – For traditional normal phase chiral separations including scale-up and purification.
HPLC Accessories● Upchurch Fittings, Rheodyne® Valves, Optimize Guards and Pre-column Filters – High-quality HPLC
consumables. Available through our partnership with IDEX® and Optimize® Technologies.
● Supel™-Fit connections – Specialty interconnects that provide the most advanced performance for making all of your HPLC connections.
I hope to leave you with this message: You’ve trusted Supelco for over 40 years. Continue to look to us to be
your supplier of innovative and reliable chromatography products to solve your analytical challenges and
supported by the service you expect from Sigma-Aldrich. Please tell me how we can help you!
Kind regards,
Wayne K. Way
Market Segment Manager – HPLC/GC
Table of Contents
Liquid Chromatography
Alternative Retention and
Selectivity Using Fluorinated
Stationary Phases.................................................3
Efficient Conversion of HPLC
Instruments between Normal-Phase
and Reversed-Phase Solvents ......................6
Astec CLC-L and CLC-D ....................................8
Reversed-phase HPLC Buffers ......................9
Sample Preparation
Selective Phospholipid Extractions
for Cleanup or Enrichment Using
HybridSPE-Phospholipid ..............................16
Preventing Contamination of Thermal
Desorption Tubes During Storage
Using TDS3 Storage Containers ................18
Gas Chromatography
Analytical Tools to Determine the
Ethanol Content of Denatured
Fuel Ethanol by ASTM D5501 ....................10
Headspace Solvents for
Analysis of OVI ....................................................14
Standards
Fuel Ethanol: Fermentation
Analysis by HPLC ...............................................12
High-Purity DNPH Standards
for Monitoring of Atmospheric
Carbonyls ...............................................................22
Drinking Water Odor Standards ..............23
Accessories
Compatible Vials and Closures in
Easy-to-Use Kits .................................................21
Precise Manual Injections Every Time
with the Merlin MicroShot Injector .......21
Silanization Service for Vials .......................23
Volume 28.5
sigma-aldrich.com/analytical ORDER: 800-247-6628 (US ONLY) / 814-359-3441 Reporter 28.5
3
Liqu
id C
hro
mato
grap
hy
Reporter 28.5 sigma-aldrich.com/express
Alternative Retention and Selectivity Using Fluorinated Stationary PhasesSeparation of Closely Related Compounds
David S. Bell and Carmen T. Santasania
Mechanisms of Retention on Fluorinated Phases
The use of fluorinated stationary phases in liquid chromatography
and hyphenated techniques has become significant in recent
years. Early applications in the effective separation of paclitaxel
provided such phases much notoriety, however more recent
studies focusing on orthogonality to traditional alkyl phases has
invited even broader attention. Due to the different retention
mechanisms fluorinated stationary phases provide, they are often
employed for the separations not easily obtained using common
C18 phases. Applications in arenas such as biopharmaceutical,
pharmaceutical, natural product and environmental analyses are
increasingly being reported.
Fluorinated phases have been shown to exhibit greater ion-
exchange character than their alkyl counterparts. Fluorinated
phases often provide excellent chromatographic results when
analytes to be separated differ in their ionization constants or
where some ion-exchange is necessary for the retention of
polar metabolites or degradation products. A second important
attribute of the fluorinated phases lies in their apparent
increased shape selectivity relative to common stationary phase
chemistries. Fluorinated phases, therefore, are often superior
to their alkyl counterparts for the separation of closely related
compounds that differ in size and shape.
In order to effectively utilize this interesting and useful tool, it
is important to have a basic understanding of the underlying
mechanisms that govern retention and selectivity. This report will
focus on two main mechanistic features of fluorinated phases that
differentiate them from common alkyl phases; increased ionic
interactions relative to alkyl phases and shape selectivity.
Practical Implications of Alternative
Retention Mechanisms
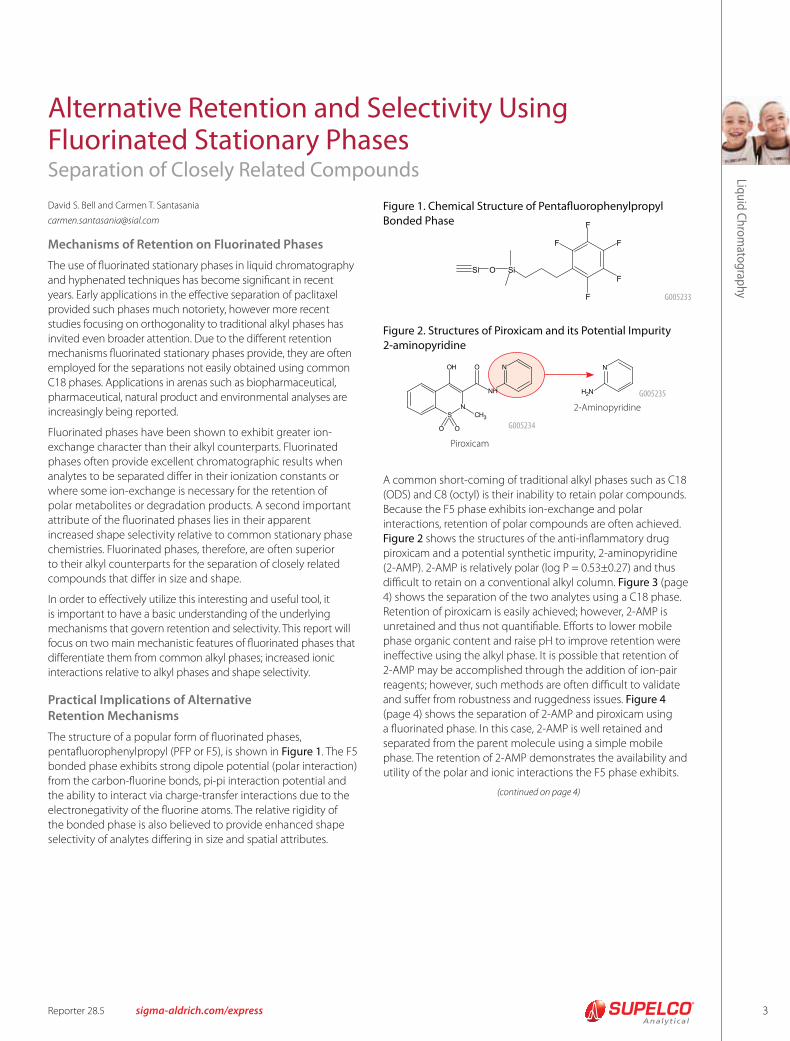
The structure of a popular form of fluorinated phases,
pentafluorophenylpropyl (PFP or F5), is shown in Figure 1. The F5
bonded phase exhibits strong dipole potential (polar interaction)
from the carbon-fluorine bonds, pi-pi interaction potential and
the ability to interact via charge-transfer interactions due to the
electronegativity of the fluorine atoms. The relative rigidity of
the bonded phase is also believed to provide enhanced shape
selectivity of analytes differing in size and spatial attributes.
A common short-coming of traditional alkyl phases such as C18
(ODS) and C8 (octyl) is their inability to retain polar compounds.
Because the F5 phase exhibits ion-exchange and polar
interactions, retention of polar compounds are often achieved.
Figure 2 shows the structures of the anti-inflammatory drug
piroxicam and a potential synthetic impurity, 2-aminopyridine
(2-AMP). 2-AMP is relatively polar (log P = 0.53±0.27) and thus
difficult to retain on a conventional alkyl column. Figure 3 (page
4) shows the separation of the two analytes using a C18 phase.
Retention of piroxicam is easily achieved; however, 2-AMP is
unretained and thus not quantifiable. Efforts to lower mobile
phase organic content and raise pH to improve retention were
ineffective using the alkyl phase. It is possible that retention of
2-AMP may be accomplished through the addition of ion-pair
reagents; however, such methods are often difficult to validate
and suffer from robustness and ruggedness issues. Figure 4
(page 4) shows the separation of 2-AMP and piroxicam using
a fluorinated phase. In this case, 2-AMP is well retained and
separated from the parent molecule using a simple mobile
phase. The retention of 2-AMP demonstrates the availability and
utility of the polar and ionic interactions the F5 phase exhibits.
G005233
Figure 1. Chemical Structure of Pentafluorophenylpropyl
Bonded Phase
Figure 2. Structures of Piroxicam and its Potential Impurity
2-aminopyridine
2-Aminopyridine
G005234
G005235
Piroxicam
(continued on page 4)
4
Liq
uid
Ch
rom
ato
gra
ph
y
sigma-aldrich.com/express TECHNICAL SERVICE: 800-359-3041 (US AND CANADA ONLY) / 814-359-3041 Reporter 28.5
(continued from page 3)
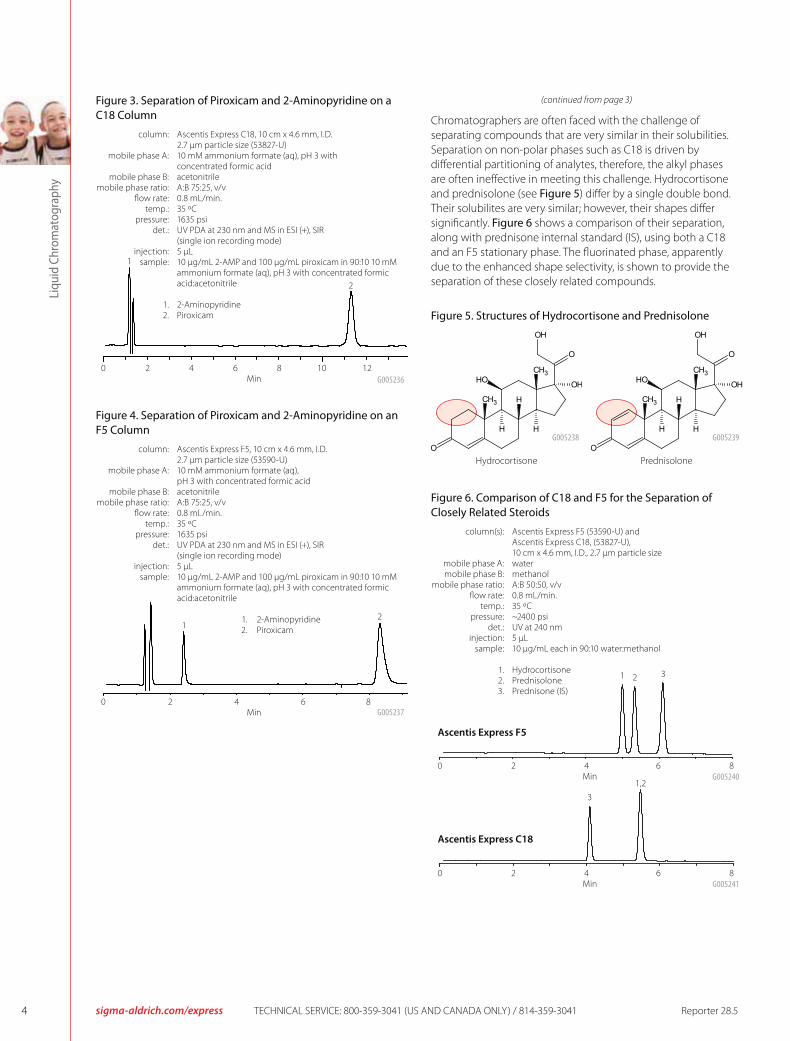
Chromatographers are often faced with the challenge of
separating compounds that are very similar in their solubilities.
Separation on non-polar phases such as C18 is driven by
differential partitioning of analytes, therefore, the alkyl phases
are often ineffective in meeting this challenge. Hydrocortisone
and prednisolone (see Figure 5) differ by a single double bond.
Their solubilites are very similar; however, their shapes differ
significantly. Figure 6 shows a comparison of their separation,
along with prednisone internal standard (IS), using both a C18
and an F5 stationary phase. The fluorinated phase, apparently
due to the enhanced shape selectivity, is shown to provide the
separation of these closely related compounds.
Figure 5. Structures of Hydrocortisone and Prednisolone
Hydrocortisone Prednisolone
G005238 G005239
Figure 6. Comparison of C18 and F5 for the Separation of
Closely Related Steroids
column(s): Ascentis Express F5 (53590-U) and Ascentis Express C18, (53827-U), 10 cm x 4.6 mm, I.D., 2.7 μm particle size mobile phase A: water mobile phase B: methanol mobile phase ratio: A:B 50:50, v/v flow rate: 0.8 mL/min. temp.: 35 ºC pressure: ~2400 psi det.: UV at 240 nm injection: 5 μL sample: 10 μg/mL each in 90:10 water:methanol
1. Hydrocortisone 2. Prednisolone 3. Prednisone (IS)
Ascentis Express F5
Ascentis Express C18
0 2 4 6 8Min
1 2
G005240
3
1,2
G005241
3
0 2 4 6 8Min
0 2 4 6 8 10 12Min
1
2
G005236
Figure 3. Separation of Piroxicam and 2-Aminopyridine on a
C18 Column
column: Ascentis Express C18, 10 cm x 4.6 mm, I.D. 2.7 μm particle size (53827-U) mobile phase A: 10 mM ammonium formate (aq), pH 3 with concentrated formic acid mobile phase B: acetonitrile mobile phase ratio: A:B 75:25, v/v flow rate: 0.8 mL/min. temp.: 35 ºC pressure: 1635 psi det.: UV PDA at 230 nm and MS in ESI (+), SIR (single ion recording mode) injection: 5 μL sample: 10 μg/mL 2-AMP and 100 μg/mL piroxicam in 90:10 10 mM ammonium formate (aq), pH 3 with concentrated formic acid:acetonitrile
1. 2-Aminopyridine 2. Piroxicam
Figure 4. Separation of Piroxicam and 2-Aminopyridine on an
F5 Column
column: Ascentis Express F5, 10 cm x 4.6 mm, I.D. 2.7 μm particle size (53590-U) mobile phase A: 10 mM ammonium formate (aq), pH 3 with concentrated formic acid mobile phase B: acetonitrile mobile phase ratio: A:B 75:25, v/v flow rate: 0.8 mL/min. temp.: 35 ºC pressure: 1635 psi det.: UV PDA at 230 nm and MS in ESI (+), SIR (single ion recording mode) injection: 5 μL sample: 10 μg/mL 2-AMP and 100 μg/mL piroxicam in 90:10 10 mM ammonium formate (aq), pH 3 with concentrated formic acid:acetonitrile
1. 2-Aminopyridine 2. Piroxicam
0 2 4 6 8Min
12
G005237
5
Liqu
id C
hro
mato
grap
hy
Reporter 28.5 sigma-aldrich.com/express
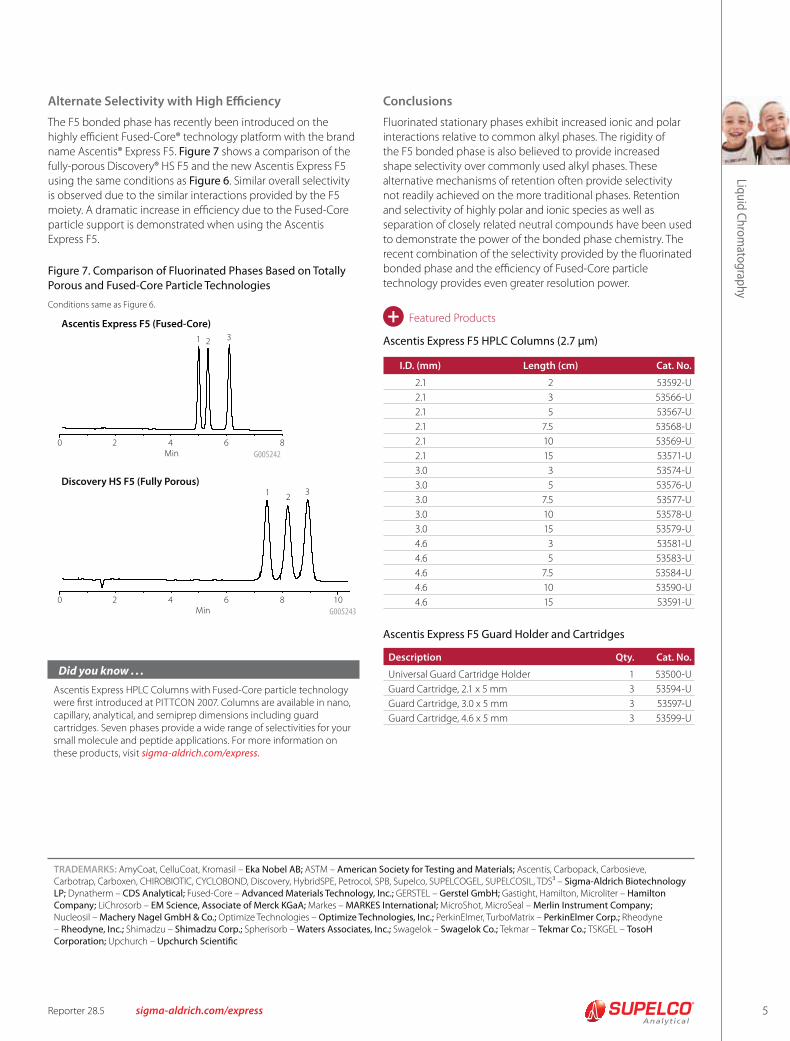
Figure 7. Comparison of Fluorinated Phases Based on Totally
Porous and Fused-Core Particle Technologies
Conditions same as Figure 6.
Discovery HS F5 (Fully Porous)
Ascentis Express F5 (Fused-Core)
0 2 4 6 8 10Min
12
G005243
3
0 2 4 6 8Min
1 2
G005242
3
Alternate Selectivity with High Efficiency
The F5 bonded phase has recently been introduced on the
highly efficient Fused-Core® technology platform with the brand
name Ascentis® Express F5. Figure 7 shows a comparison of the
fully-porous Discovery® HS F5 and the new Ascentis Express F5
using the same conditions as Figure 6. Similar overall selectivity
is observed due to the similar interactions provided by the F5
moiety. A dramatic increase in efficiency due to the Fused-Core
particle support is demonstrated when using the Ascentis
Express F5.
Featured Products+Ascentis Express F5 HPLC Columns (2.7 μm)
I.D. (mm) Length (cm) Cat. No.
2.1 2 53592-U
2.1 3 53566-U
2.1 5 53567-U
2.1 7.5 53568-U
2.1 10 53569-U
2.1 15 53571-U
3.0 3 53574-U
3.0 5 53576-U
3.0 7.5 53577-U
3.0 10 53578-U
3.0 15 53579-U
4.6 3 53581-U
4.6 5 53583-U
4.6 7.5 53584-U
4.6 10 53590-U
4.6 15 53591-U
Ascentis Express F5 Guard Holder and Cartridges
Description Qty. Cat. No.
Universal Guard Cartridge Holder 1 53500-U
Guard Cartridge, 2.1 x 5 mm 3 53594-U
Guard Cartridge, 3.0 x 5 mm 3 53597-U
Guard Cartridge, 4.6 x 5 mm 3 53599-U
Conclusions
Fluorinated stationary phases exhibit increased ionic and polar
interactions relative to common alkyl phases. The rigidity of
the F5 bonded phase is also believed to provide increased
shape selectivity over commonly used alkyl phases. These
alternative mechanisms of retention often provide selectivity
not readily achieved on the more traditional phases. Retention
and selectivity of highly polar and ionic species as well as
separation of closely related neutral compounds have been used
to demonstrate the power of the bonded phase chemistry. The
recent combination of the selectivity provided by the fluorinated
bonded phase and the efficiency of Fused-Core particle
technology provides even greater resolution power.
Did you know . . .
Ascentis Express HPLC Columns with Fused-Core particle technology were first introduced at PITTCON 2007. Columns are available in nano, capillary, analytical, and semiprep dimensions including guard cartridges. Seven phases provide a wide range of selectivities for your small molecule and peptide applications. For more information on these products, visit sigma-aldrich.com/express.
TRADEMARKS: AmyCoat, CelluCoat, Kromasil – Eka Nobel AB; ASTM – American Society for Testing and Materials; Ascentis, Carbopack, Carbosieve,
Carbotrap, Carboxen, CHIROBIOTIC, CYCLOBOND, Discovery, HybridSPE, Petrocol, SPB, Supelco, SUPELCOGEL, SUPELCOSIL, TDS3 – Sigma-Aldrich Biotechnology
LP; Dynatherm – CDS Analytical; Fused-Core – Advanced Materials Technology, Inc.; GERSTEL – Gerstel GmbH; Gastight, Hamilton, Microliter – Hamilton
Company; LiChrosorb – EM Science, Associate of Merck KGaA; Markes – MARKES International; MicroShot, MicroSeal – Merlin Instrument Company;
Nucleosil – Machery Nagel GmbH & Co.; Optimize Technologies – Optimize Technologies, Inc.; PerkinElmer, TurboMatrix – PerkinElmer Corp.; Rheodyne
– Rheodyne, Inc.; Shimadzu – Shimadzu Corp.; Spherisorb – Waters Associates, Inc.; Swagelok – Swagelok Co.; Tekmar – Tekmar Co.; TSKGEL – TosoH
Corporation; Upchurch – Upchurch Scientific
6
Liq
uid
Ch
rom
ato
gra
ph
y
sigma-aldrich.com/hplc ORDER: 800-247-6628 (US ONLY) / 814-359-3441 Reporter 28.5
Efficient Conversion of HPLC Instruments between Normal-Phase and Reversed-Phase SolventsRichard Henry and Carmen T. Santasania
While reversed-phase (RP) HPLC is still by far the most common
mode, normal-phase (NP) HPLC is increasing in popularity
with the introduction of new highly polar columns with
excellent retention, selectivity and stability. It is easy to inter-
convert between RP and HILIC (a type of NP) because both
modes employ polar aqueous mobile phases; however, many
compounds are not polar enough to be retained under aqueous
HILIC conditions. When aqueous solvents must be replaced
with non-aqueous conditions to study non-polar samples,
immiscibility situations can arise during changeover.
Customers often contact our Technical Service Department
with a practical question that might go something like, “I need to
change my HPLC instrument from RP mode to NP mode. Do you have
any suggestions or guidelines for such a changeover?” This article
describes our best practices for converting between reversed-
phase and normal phase solvents, which are often immiscible.
The first best practice is to dedicate instruments to a specific
mode. Significant seal wear-and-tear can be caused by
expansion, contraction and extra friction of changing solvents.
If possible, columns should also be dedicated to one mode for
trouble-free operation. If dedicating the instrument or column is
not possible, one should use the following procedure.
Our regular practice is to replace the column with tubing or
a union and flush extensively with isopropanol (IPA) before
going over to water or hydrocarbon. Before beginning the
changeover process, remove the HPLC column, cap and store
in the appropriate storage solvent unless the same column
is to be used in the new mode. Columns such as Cyano and
Fluorophenyl (F5) can work in either RP or NP mode and can
remain installed if desired. After IPA flush, the column can be
removed and capped to avoid excessive wear on the valuable
component. In the flushing steps, be sure to include the entire
fluid path (pump, autosampler, valves, detector, etc.). Also,
include the sample loop and any other fluid paths that are
encountered for the normal operation of making injections. This
can vary considerably depending on whether the autosampler
is an external loop design, or an internal loop design. As part of
all the washes, make certain the injection needle gets washed as
well. It is best to do several full loop injections of a solvent such
as IPA that is miscible with both high aqueous and high organic
mobile phases. The total volume of IPA needed will vary with
instrument design, but the waste volume should be monitored
(record the volume as a guide for future changeovers) and
observed for uniform appearance. UV detectors may remain on
(ca. 250 nm) during this step to indicate when the system has
returned to a stable baseline.
The second wash step after the IPA should be with methanol
(or ethanol). Follow the previous procedure that was used
for the IPA wash before going to water. Methanol will help
flush the IPA out faster than going directly from IPA to water. If
excessive baseline noise or drift is observed with a UV detector,
repeat the procedures and allow more time to flush out any
poorly swept flow regions.
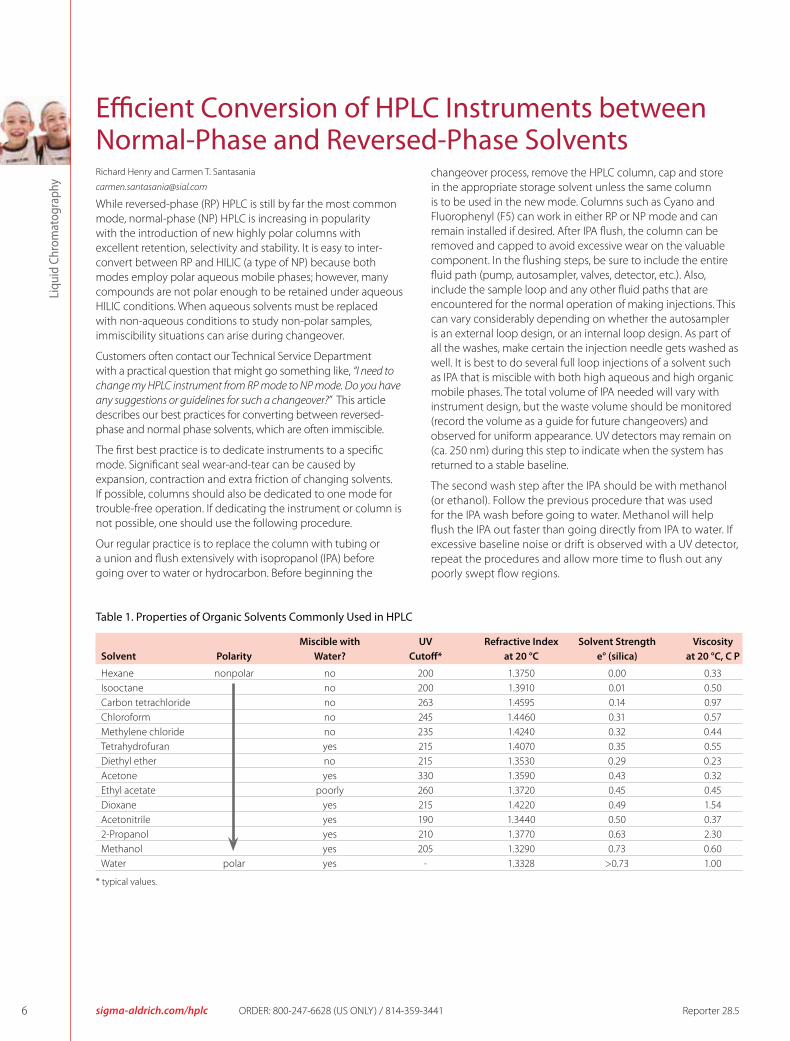
Table 1. Properties of Organic Solvents Commonly Used in HPLC
Miscible with UV Refractive Index Solvent Strength Viscosity
Solvent Polarity Water? Cutoff* at 20 °C e° (silica) at 20 °C, C P
Hexane nonpolar no 200 1.3750 0.00 0.33
Isooctane no 200 1.3910 0.01 0.50
Carbon tetrachloride no 263 1.4595 0.14 0.97
Chloroform no 245 1.4460 0.31 0.57
Methylene chloride no 235 1.4240 0.32 0.44
Tetrahydrofuran yes 215 1.4070 0.35 0.55
Diethyl ether no 215 1.3530 0.29 0.23
Acetone yes 330 1.3590 0.43 0.32
Ethyl acetate poorly 260 1.3720 0.45 0.45
Dioxane yes 215 1.4220 0.49 1.54
Acetonitrile yes 190 1.3440 0.50 0.37
2-Propanol yes 210 1.3770 0.63 2.30
Methanol yes 205 1.3290 0.73 0.60
Water polar yes - 1.3328 >0.73 1.00
* typical values.
7
Liqu
id C
hro
mato
grap
hy
Reporter 28.5 sigma-aldrich.com/hplc
● Incomplete mixing shows up as severe detector baseline
noise or pressure fluctuations (globules of immiscible solvent
can resemble bubbles or particles).
● Do flush detectors and all other components even if baseline
is not monitored.
● Total time for changeover can vary but should take about an
hour. Do not rush; this may actually slow down the process.
● Do record the volumes of solvent used during changeover for
use as a future guide; if changeover is unsuccessful, use more
solvent the next time.
● Don’t expect fast changeover and baseline equilibration with
refractive index detectors- they are extremely slow to equili-
brate after changeover.
● Do check gradient blank runs for excessive baseline noise and
drift that might indicate pockets of immiscible solvent.
● Good chromatography in the target mode is the most
sensitive final test- start with simple binary mobile phases
and standard test mixes and work toward real samples with
mobile phase additives.
Finally, it is also good practice to contact your LC instrument
manufacturer to be sure all details of the changeover are
covered. The manufacturer may have additional details and tips
for successful changeover to a different chromatographic mode.
If columns and instruments are frequently used in different
modes, adopt a labeling system to alert a new user about
possible solvent compatibility issues.
Some Dos and Don’ts for Solvent Changeover:
● Do remove all additives and start with 100% isopropanol in all
reservoirs.
● Isopropanol is fully miscible with all common solvents and is
the safest changeover solvent for either direction.
● Do use low flow - about half of normal to avoid excessive seal
wear and damage due to over-pressuring.
● Don’t use acetonitrile routinely as the changeover solvent- it
is better than methanol, but is not fully miscible with pure
hydrocarbons.
● Don’t use methanol routinely as the organic- it is not fully
miscible with many normal phase conditions.
● Either acetonitrile or methanol may be used to routinely change
from reversed-phase and back (remember to remove additives).
● Do check miscibility (use small external vessel) with target
mobile phase before starting, especially if IPA is not selected.
● Do use organic (such as IPA) in all lines of a gradient instru-
ment to make certain that water or hydrocarbon is removed
from all fluid areas.
● Do operate the injector valve and any other selector valves
while doing the IPA flush procedure.
● Do monitor pressure and detector signals during changeover
as these are excellent methods to confirm full system equili-
bration; evaporative detectors such as MS and ELSD cannot
be used for this purpose.
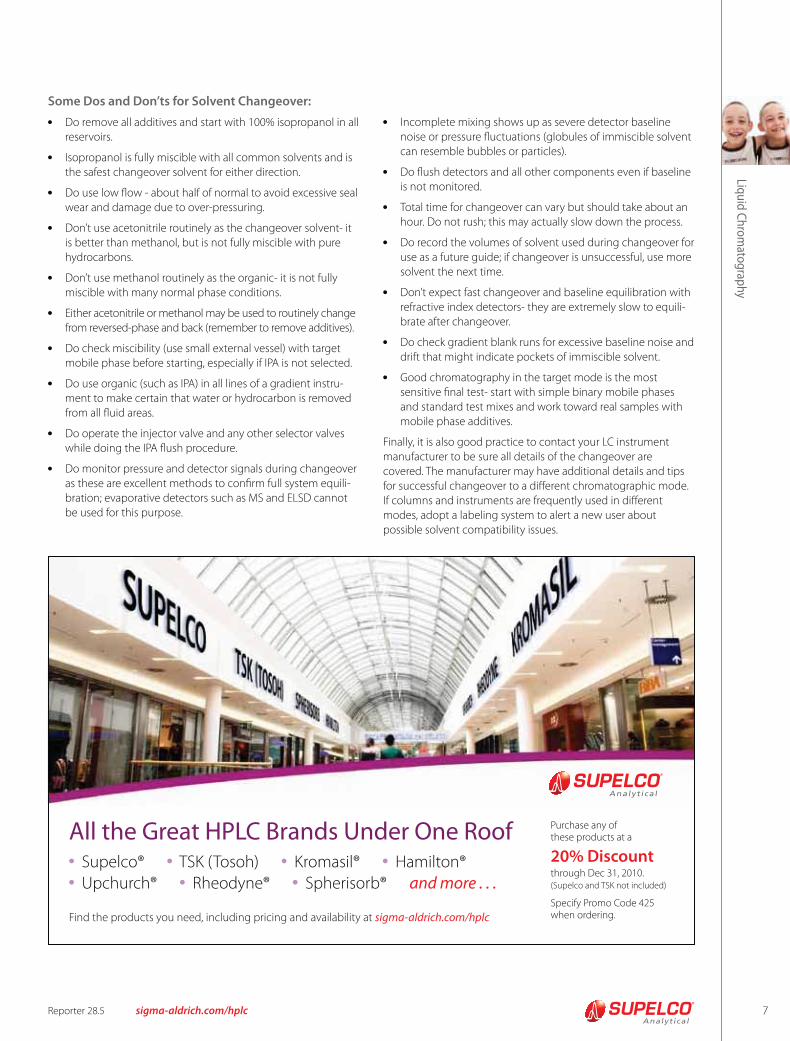
All the Great HPLC Brands Under One Roof● Supelco® ● TSK (Tosoh) ● Kromasil® ● Hamilton®● Upchurch® ● Rheodyne® ● Spherisorb® and more . . .
Find the products you need, including pricing and availability at sigma-aldrich.com/hplc
Purchase any of these products at a
20% Discount through Dec 31, 2010. (Supelco and TSK not included)
Specify Promo Code 425 when ordering.
8
Ch
iral
Ch
rom
ato
gra
ph
y
sigma-aldrich.com/chiral TECHNICAL SERVICE: 800-359-3041 (US AND CANADA ONLY) / 814-359-3041 Reporter 28.5
Astec CLC-L and CLC-DCopper Ligand Exchange HPLC Columns for Chiral Separation
of Acids and AminesAstec CLC columns use the ligand-exchange concept described
by Davankov to affect enantiomer separation (1). The method
uses a small, chiral bidentate ligand attached to the silica surface
and a copper sulphate-containing mobile phase. The copper
ions coordinate with the chiral selector stationary phase and
certain functional groups on the analytes to form transient
diastereomeric complexes in solution. The technique also has
the advantage of giving small acids with no UV chromophore a
strong 254 nm signal.
Astec CLC columns are ideal for analysis of -hydroxy acids, like
lactic, malic, tartaric and mandelic acids, amino acids, other amines
and bi-functional racemates, like amino alcohols. Two versions of
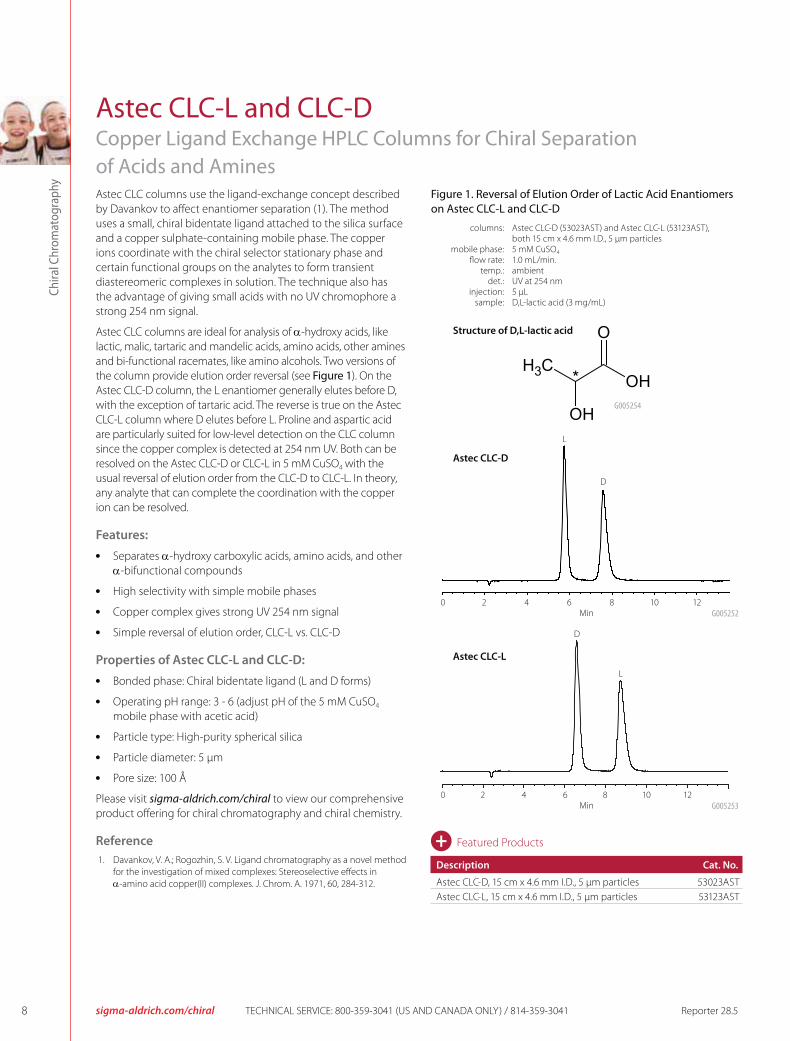
the column provide elution order reversal (see Figure 1). On the
Astec CLC-D column, the L enantiomer generally elutes before D,
with the exception of tartaric acid. The reverse is true on the Astec
CLC-L column where D elutes before L. Proline and aspartic acid
are particularly suited for low-level detection on the CLC column
since the copper complex is detected at 254 nm UV. Both can be
resolved on the Astec CLC-D or CLC-L in 5 mM CuSO4 with the
usual reversal of elution order from the CLC-D to CLC-L. In theory,
any analyte that can complete the coordination with the copper
ion can be resolved.
Features:
● Separates -hydroxy carboxylic acids, amino acids, and other
-bifunctional compounds
● High selectivity with simple mobile phases
● Copper complex gives strong UV 254 nm signal
● Simple reversal of elution order, CLC-L vs. CLC-D
Properties of Astec CLC-L and CLC-D:
● Bonded phase: Chiral bidentate ligand (L and D forms)
● Operating pH range: 3 - 6 (adjust pH of the 5 mM CuSO4
mobile phase with acetic acid)
● Particle type: High-purity spherical silica
● Particle diameter: 5 μm
● Pore size: 100 Å
Please visit sigma-aldrich.com/chiral to view our comprehensive
product offering for chiral chromatography and chiral chemistry.
Reference
1. Davankov, V. A.; Rogozhin, S. V. Ligand chromatography as a novel method
for the investigation of mixed complexes: Stereoselective effects in
-amino acid copper(II) complexes. J. Chrom. A. 1971, 60, 284-312.
Description Cat. No.
Astec CLC-D, 15 cm x 4.6 mm I.D., 5 μm particles 53023AST
Astec CLC-L, 15 cm x 4.6 mm I.D., 5 μm particles 53123AST
Featured Products+
Figure 1. Reversal of Elution Order of Lactic Acid Enantiomers
on Astec CLC-L and CLC-D
columns: Astec CLC-D (53023AST) and Astec CLC-L (53123AST), both 15 cm x 4.6 mm I.D., 5 μm particles mobile phase: 5 mM CuSO4
flow rate: 1.0 mL/min. temp.: ambient det.: UV at 254 nm injection: 5 μL sample: D,L-lactic acid (3 mg/mL)
0 2 4 6 8 10 12Min G005252
0 2 4 6 8 10 12Min G005253
Astec CLC-D
Astec CLC-L
L
D
D
L
Structure of D,L-lactic acid
G005254
9
Reversed-phase HPLC BuffersHigh-quality buffers (solutions, solids or concentrates)
Shyam Verma
Consideration of the affects of pH on analyte retention,
type of buffer to use, and its concentration, solubility in the
organic modifier and its affect on detection are important in
reversed-phase chromatography (RPC) method development
of ionic analytes. An improper choice of buffer, in terms of
buffering species, ionic strength and pH, can result in poor or
irreproducible retention and tailing in reverse-phase separation
of polar and ionizable compounds.
Problems, such as, partial ionization of the analyte and strong
interaction between analytes and residual silanoles or other
active sites on the stationary phases can be overcome by proper
mobile phase buffering (maintaining the pH within a narrow
range) and choosing the right ionic species and its concentration
(ionic strength) in the mobile phase (1-2). In sensitive LC-MS
separations that depend heavily on the correct choice of acid
base buffering species and other additives (3). A buffer must be
chosen based on its ability to maintain, and not suppress analyte
ionization in the MS interface.
Buffer Selection
The typical pH range for reversed-phase on silica-based packing
is pH 2 to 8. Choice of buffer is typically governed by the desired
pH. It is important that the buffer has a pKa close to the desired
pH since buffers control pH best at their pKa. A rule of thumb is to
choose a buffer with a pKa value <2 units of the desired mobile
phase pH (see Table 1).
Table 1. HPLC Buffers, pKa Values and Useful pH Range
Buffer pKa (25°C) Useful pH Range
TFA 0.5 <1.5
Sulfonate 1.8 <1-2.8
Phosphate 2.1 1.1-3.1
Chloroacetate 2.9 1.9-3.9
Formate 3.8 2.8-4.8
Acetate 4.8 3.8-5.8
Sulfonate 6.9 5.9-7.9
Phosphate 7.2 6.2-8.2
Ammonia 9.2 8.2-10.2
Phosphate 12.3 11.3-13.3
Buffer Concentration: Generally, a buffer concentration of
10-50 mM is adequate for small molecules.
Buffer Solubility: A general rule is no more than 50% organic
should be used with a buffer. This will depend on the specific
buffer as well as its concentration.
Buffer’s Effect on Detection: The choice of buffer is also
dependent upon means of detection. For traditional UV
detection, the buffer needs to be effectively transparent in this
region, especially, critical for gradient separations. Buffers listed in
Table 1 have low enough absorption below 220 nm.
Phosphoric acid and its sodium or potassium salts are the most
common buffer systems for reversed-phase HPLC. Phosphonate
buffers can be replaced with sulfonate buffers when analyzing
organophosphate compounds. With the growth in popularity of
LC-MS, volatile buffer systems, such as TFA, acetate, formate, and
ammonia, are frequently used due to compatibility with mass
spectral (MS) detection. In regard to the issue of suppression of
ionization, formate and acetate are ideal choices for positive-ion
mode detection. TFA, however, can negatively impact detector
response even in positive-ion mode (4,5), while it strongly
suppresses ionization with negative ion mode. Acetic acid is
good for negative-ion mode. LC-MS applications further limit
buffer selection and buffer concentration.
References
1. McMaster, M.C. HPLC A Practical User’s Guide, VCH Publishers, Inc.: New
York, NY, 1994; 85.
2. Poole, C.F. and Poole, S.K. Chromatography Today, Elsevier Science:
Amsterdam, The Netherlands, 1991; 431.
3. Analytix, Five-part series on Mobile Phase Additives for LC-MS, Issue 3,
2006 (www.sigma-aldrich.com/analytix).
4. Temesi, D., Law, B., 1999, The Effect of LC Eluent Composition on MS
Response Using Electrospray Ionization, LC-GC, 17:626.
5. Apffel, A. et. al. 1995. Enhanced Sensitivity for Peptide Mapping with
Electrospray Liquid Chromatography-Mass Spectrometry in the Presence
of Signal Suppression Due to Trifluoroacetic Acid-Containing Mobile
Phases, J. Chrom. A. 712:177.
Reporter 28.5 sigma-aldrich.com/hplc
Reag
ents
Description Qty. Cat. No.
HPLC-grade Buffers and Additives from Sigma-Aldrich/Fluka
Ammonium acetate 50 g, 250 g 17836
Ammonium formate 50 g, 250 g 17843
Ammonium hydroxide solution in water 100 mL, 1 L 17837
Ammonium phosphate monobasic 250 g 17842
Ammonium trifluoroacetate 10 g, 50 g 17839
Potassium phosphate dibasic anhydrous 250 g 17835
Sodium formate 50 g, 250 g 17841
Sodium phosphate dibasic dehydrate 250 g 71633
Sodium phosphate monobasic anhydrous 50 g, 250 g 17844
Sodium trifluoroacetate 10 g 17840
Trifluoroacetic acid:Triethylamine 2M:1M 500 mL 09746
Trifluoroacetic acid:Triethylamine 2M:2M 100 mL 09747
For a complete list of HPLC buffers and additives, please refer to
our online product catalog: sigma-aldrich.com
Featured Products+
10
Gas
Ch
rom
ato
gra
ph
y
sigma-aldrich.com/biofuels ORDER: 800-247-6628 (US ONLY) / 814-359-3441 Reporter 28.5
Analytical Tools to Determine the Ethanol Content of Denatured Fuel Ethanol by ASTM D5501Vicki Yearick, Steven P. Cecil, Katherine K. Stenerson, and Michael D. Buchanan
Introduction
The desire for cleaner-burning fuels coupled with the desire
to reduce use of non-renewable fossil fuels has required an
increase in the production of bulk ethanol for fuel purposes.
One use of ethanol in fuel applications is as an oxygenated
additive in gasoline, resulting in a cleaner-burning fuel. Blends
typically range from E10 (10% ethanol and 90% gasoline) to E25
(25% ethanol and 75% gasoline). (1,2) Another use of ethanol
in fuel applications is in ‘flex-fuel’ vehicles that can operate with
higher ethanol percentages. In the USA, an E85 blend (85%
ethanol and 15% gasoline) is used. (3) In Brazil, where ethanol
is made from sugar-cane, over half of their cars can operate
on E100. (2) Whether used as an additive or as a flex-fuel, the
demand for bulk ethanol for fuel purposes is sure to increase in
the coming decades.
ASTM Methodologies
Mandated fuel ethanol specifications are available for bulk
producers and blenders, as outlined in ASTM® D4806 - Standard
Specification for Denatured Fuel Ethanol for Blending with
Gasolines for Use as Automotive Spark-Ignition Engine Fuel. (4)
Bulk ethanol producers are typically required by law to render
the fuel ethanol unfit for human consumption by adding a
denaturant, typically natural gasoline. ASTM D4806 requires the
fuel ethanol to contain a minimum of 92.1% ethanol by volume
with the denaturant volume ranging from 1.96% to 4.76%.
Producers and blenders must monitor and report the content
of ethanol and the denaturant to show they are in compliance
with local country laws. Monitoring is accomplished by following
the analytical method ASTM D5501 - Standard Test Method for
Determination of Ethanol Content of Denatured Fuel Ethanol by
Gas Chromatography. (5)
Capillary GC Column
ASTM D5501, a gas chromatography (GC) method, specifies the
use of a temperature program and a flame ionization detector
to analyze the sample on a long polydimethylsiloxane capillary
column, such as the Petrocol™ DH 150. This non-polar column is
characterized by high efficiency and great reproducibility.
ASTM D5501 requires that peak identification be established,
followed by the quantitation of ethanol. To perform this,
a mixture containing known amounts of each alcohol in
proportion to what is expected in the final blend is injected into
the GC column, using n-heptane as a solvent. Retention times
of the fuel ethanol sample are then compared to the analytical
standard to verify identity.
Chemical Standard Kit
Quantitation per ASTM D5501 requires preparation of six multi-
component calibration solutions, each containing ethanol,
methanol and n-heptane in varying concentrations, to establish
a linearity curve for the GC system. Because D4806 specifies a
minimum ethanol content of 92.1% for denatured fuel ethanol, the
ethanol content found in the six solutions range from 92 to 97%.
N-heptane is included in the solutions in place of the denaturant.
Preparation of these calibration standards is time consuming and
requires maintaining an inventory of high-purity raw materials.
Calibration standards preparation is made easier by using Sigma-
Aldrich’s ASTM D5501 Denatured Fuel Ethanol Standards Kit.
This kit contains pre-made Supelco brand multi-component,
quantitative solutions covering the required range for accurate
calibration, per ASTM D5501. A certificate of analysis is provided
for each calibration solution.
The resulting chromatogram from a Supelco brand mid-level
standard is shown in Figure 1. The chromatogram from the
analysis of an E85 sample is shown in Figure 2. Per ASTM D5501,
mass relative response factors for the fuel ethanol sample are
calculated to the nearest 0.01 mass percent, and then compared
to the values obtained for each of the six calibration solutions
to determine the ethanol content in the denatured fuel ethanol
sample for reporting purposes.
Did you know…?
The Renewable & Alternative Energy portal on the Sigma-Aldrich web site contains a wealth of information for scientists looking for products and information to aid in their research.
sigma-aldrich.com/renewable

11Reporter 28.5 sigma-aldrich.com/biofuels
Gas C
hro
mato
grap
hy
Description Cat. No.
Petrocol DH 150, 150 m x 0.25 mm I.D., 1.0 μm 24155
ASTM D5501 Denatured Fuel Ethanol Standard Kit 40361-U
Kit contains seven ampuls (prepared wt/wt).
Solution 1 = Ethanol:Heptane:Methanol (92%:7.40%:0.60%)
Solution 2 = Ethanol:Heptane:Methanol (93%:6.50%:0.50%)
Solution 3 = Ethanol:Heptane:Methanol (94%:5.60%:0.40%)
Solution 4 = Ethanol:Heptane:Methanol (95%:4.70%:0.30%)
Solution 5 = Ethanol:Heptane:Methanol (96%:3.80%:0.20%)
Solution 6 = Ethanol:Heptane:Methanol (97%:2.90%:0.10%)
Solution 7 = Ethanol:Heptane:Methanol (98%:1.95%:0.05%)
Featured Products+
Related Information+Additional information about this, or other analytical
methodologies used for bioethanol and biodiesel
applications, can be found by visiting our biofuels web
node at sigma-aldrich.com/biofuels
For a list of commonly
used GC items, refer to
Maximize Performance!
Gas Chromatography
Accessories and Gas
Purification/Management
Products (T407103 JWE).
This brochure contains
products such as GC
septa, inlet liners, ferrules,
solvents, autosampler
syringes, autosampler vials,
purifiers, and more, all
designed to be used with
the most common GC models, such as those manufactured
by Agilent/HP, PerkinElmer, Shimadzu, Thermo, and Varian.
Related Products+
Figure 1. Calibration Standard
column: Petrocol DH 150, 150 m x 0.25 mm I.D., 1.0 μm (24155) oven: 60 °C (15 min.), 30 °C/min. to 250 °C (23 min.) inj.: 300 °C det.: FID, 250 °C carrier gas: helium, 24 cm/sec @ 60 °C injection: 0.5 μL, 150:1 split liner: 4 mm I.D., single taper sample: Denatured Fuel Ethanol Solution 4, from ASTM D5501 Denatured Fuel Ethanol Standards Kit (40361-U)
1. Methanol, 95.00% 2. Ethanol, 4.70% 3. n-Heptane, 0.30%
Figure 2. E85 Sample
sample: E85 denatured fuel ethanol
Other conditions the same as Figure 1.See Figure 1 for Peak IDs.
References
1. US EPA web site, Fuels and Fuel Additives web page (www.epa.gov).
2. US DOE web site, Country Analysis Briefs: Brazil (www.eia.doe.gov/cabs/
Brazil/Full.html).
3. US EPA web site, SmartWay Grow & Go web page (www.epa.gov).
4. ASTM D4806; Standard Specification for Denatured Fuel Ethanol for
Blending with Gasolines for Use as Automotive Spark-Ignition Engine Fuel,
ASTM International (www.astm.org).
5. ASTM D5501; Standard Test Method for Determination of Ethanol Content
of Denatured Fuel Ethanol by Gas Chromatography, ASTM International
(www.astm.org).
10 20 30 40Min
1
G005248
2 3
10 20 30 40Min G004753
1
2
Conclusion
As the demand for bulk ethanol for fuel purposes increases,
so will the need for testing. Supelco capillary GC columns and
chemical standards are the perfect complement to one another
for this application.
12 sigma-aldrich.com/standards TECHNICAL SERVICE: 800-359-3041 (US AND CANADA ONLY) / 814-359-3041 Reporter 28.5
Stan
dar
ds
Fuel Ethanol: Fermentation Analysis by HPLCOne Source Solution of Column and Quantitative Calibration Standard
Steve Cecil
Fuel ethanol continues to be the mainstay in the biofuel
arena, with increasing production yield and higher conversion
percentages of corn-to-ethanol driving discussion of both
economic and environmental viability of the product.
Ethanol is traditionally produced by the fermentation of sugar by
yeast. Typically, commercial production of fuel ethanol involves
breakdown of the starch into simple sugars, yeast fermentation
of these sugars, and finally recovery of the main ethanol product
and byproducts (e.g., animal feed).
Many areas of the process are important to ensure a quality
end product, such as the breakdown of the corn substrate to
fermentable sugars and distillation. However, none are more
critical than the ethanol-producing step of fermentation.
Optimized fermentation leads to increased ethanol yield
and profitability of the biofuel facility. Residual sugars left
unfermented lower ethanol concentrations, increase plant water
usage and often require additional fermentation equipment
cleaning and maintenance. Consequently, fuel ethanol producers
continually look for more efficient processing techniques.
Importance of HPLC Analysis of Residual Saccharides
A key measurement is the residual sugar and ethanol
concentrations in the fermentation broth. Fuel ethanol facilities
use High Performance Liquid Chromatography (HPLC) as the
technique of choice to monitor the ethanol fermentation
process. HPLC permits detailed monitoring of the complete
cycle, including conversion of the sugars to ethanol and ethanol
breakdown to acetic acid.
The HPLC analysis utilizes a crosslinked polystyrene/divinyl-
benzene resin ion exchange column. Traditional methods suffer
from A) poor resolution or B) long run times.
A) Methods with fast run times (< 12 minutes) sacrifice resolution
of the early eluting saccharides. These fast methods often show
co-elution of the dextrin, maltotriose and maltose peaks.
B) Methods focused on improved resolution of the simple sug-
ars suffer from long run times. To achieve improved resolution
for the early eluting saccharides, these methods have run
times exceeding 22 minutes.
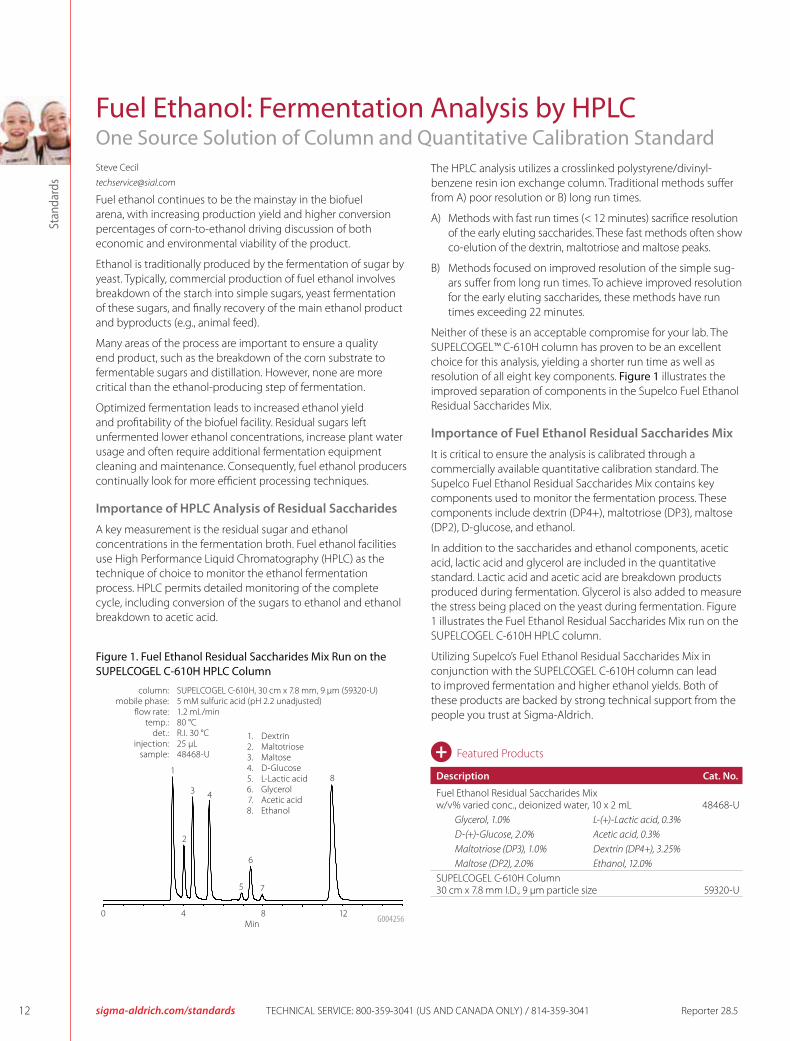
Neither of these is an acceptable compromise for your lab. The
SUPELCOGEL™ C-610H column has proven to be an excellent
choice for this analysis, yielding a shorter run time as well as
resolution of all eight key components. Figure 1 illustrates the
improved separation of components in the Supelco Fuel Ethanol
Residual Saccharides Mix.
Importance of Fuel Ethanol Residual Saccharides Mix
It is critical to ensure the analysis is calibrated through a
commercially available quantitative calibration standard. The
Supelco Fuel Ethanol Residual Saccharides Mix contains key
components used to monitor the fermentation process. These
components include dextrin (DP4+), maltotriose (DP3), maltose
(DP2), D-glucose, and ethanol.
In addition to the saccharides and ethanol components, acetic
acid, lactic acid and glycerol are included in the quantitative
standard. Lactic acid and acetic acid are breakdown products
produced during fermentation. Glycerol is also added to measure
the stress being placed on the yeast during fermentation. Figure
1 illustrates the Fuel Ethanol Residual Saccharides Mix run on the
SUPELCOGEL C-610H HPLC column.
Utilizing Supelco’s Fuel Ethanol Residual Saccharides Mix in
conjunction with the SUPELCOGEL C-610H column can lead
to improved fermentation and higher ethanol yields. Both of
these products are backed by strong technical support from the
people you trust at Sigma-Aldrich.
Description Cat. No.
Fuel Ethanol Residual Saccharides Mix w/v% varied conc., deionized water, 10 x 2 mL 48468-U
Glycerol, 1.0% L-(+)-Lactic acid, 0.3%
D-(+)-Glucose, 2.0% Acetic acid, 0.3%
Maltotriose (DP3), 1.0% Dextrin (DP4+), 3.25%
Maltose (DP2), 2.0% Ethanol, 12.0%
SUPELCOGEL C-610H Column 30 cm x 7.8 mm I.D., 9 μm particle size 59320-U
Featured Products+
Figure 1. Fuel Ethanol Residual Saccharides Mix Run on the
SUPELCOGEL C-610H HPLC Column
column: SUPELCOGEL C-610H, 30 cm x 7.8 mm, 9 μm (59320-U) mobile phase: 5 mM sulfuric acid (pH 2.2 unadjusted) flow rate: 1.2 mL/min temp.: 80 °C det.: R.I. 30 °C injection: 25 μL sample: 48468-U
G004256
1
2
3 4
6
5 7
8
1. Dextrin 2. Maltotriose 3. Maltose 4. D-Glucose 5. L-Lactic acid 6. Glycerol 7. Acetic acid 8. Ethanol
0 4 8 12Min
13Reporter 28.5 sigma-aldrich.com/.............sigma-aldrich.com/hybridspe-ppt ORDER: 800-247-6628 (US ONLY) / 814-359-3441 Volume 28.5
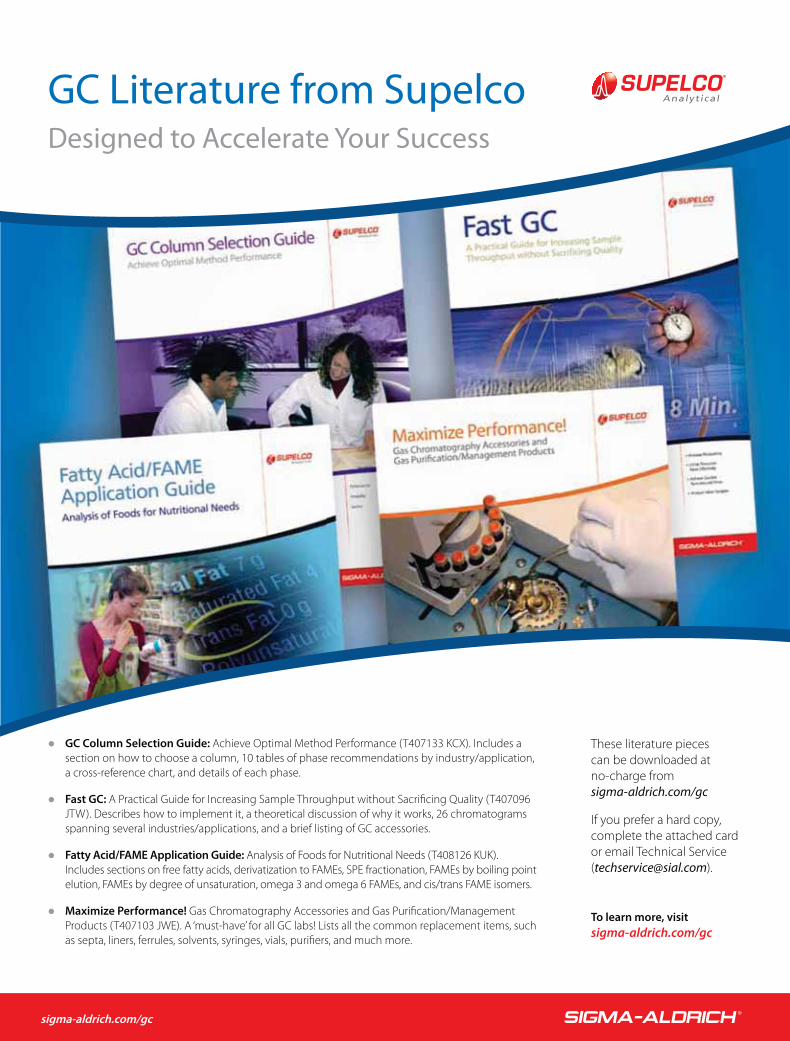
GC Literature from Supelco
GC Column Selection Guide: Achieve Optimal Method Performance (T407133 KCX). Includes a
section on how to choose a column, 10 tables of phase recommendations by industry/application,
a cross-reference chart, and details of each phase.
Fast GC: A Practical Guide for Increasing Sample Throughput without Sacrificing Quality (T407096
JTW). Describes how to implement it, a theoretical discussion of why it works, 26 chromatograms
spanning several industries/applications, and a brief listing of GC accessories.
Fatty Acid/FAME Application Guide: Analysis of Foods for Nutritional Needs (T408126 KUK).
Includes sections on free fatty acids, derivatization to FAMEs, SPE fractionation, FAMEs by boiling point
elution, FAMEs by degree of unsaturation, omega 3 and omega 6 FAMEs, and cis/trans FAME isomers.
Maximize Performance! Gas Chromatography Accessories and Gas Purification/Management
Products (T407103 JWE). A ‘must-have’ for all GC labs! Lists all the common replacement items, such
as septa, liners, ferrules, solvents, syringes, vials, purifiers, and much more.
To learn more, visit
sigma-aldrich.com/gc
Designed to Accelerate Your Success
These literature pieces
can be downloaded at
no-charge from
sigma-aldrich.com/gc
If you prefer a hard copy,
complete the attached card
or email Technical Service
sigma-aldrich.com/gc
14
Headspace Solvents for Analysis of OVIHigh Purity and Superior Performance
Katherine K. Stenerson and Shyam Verma
The purity of dissolution solvents used in the headspace
analysis is essential for avoiding extraneous peaks in the
subsequent chromatographic analysis, and preventing
interference with the analytes of interest. Many protocols
followed by laboratories doing Organic Volatile Impurity (OVI)
analysis require the analysis of an acceptable blank, and some
published methodologies (1-3) require the analysis of a blank to
verify the absence of interfering peaks.
In earlier publications (4) we have reported the suitability of
headspace grade (GC-HS) solvents offered by Sigma-Aldrich
for use in the analysis of the OVIs listed in United States
Pharmacopeia (USP) Method <467>, European Pharmacopoeia
(EP) Method 2.4.24, and the International Conference on
Harmonization (ICH) guidelines. Comparing headspace grade
solvents with the conventional organic synthesis grade solvents,
it was demonstrated that the GC-HS grade solvents produced
cleaner blanks and showed no major interference peaks in the
elution range of the target analytes.
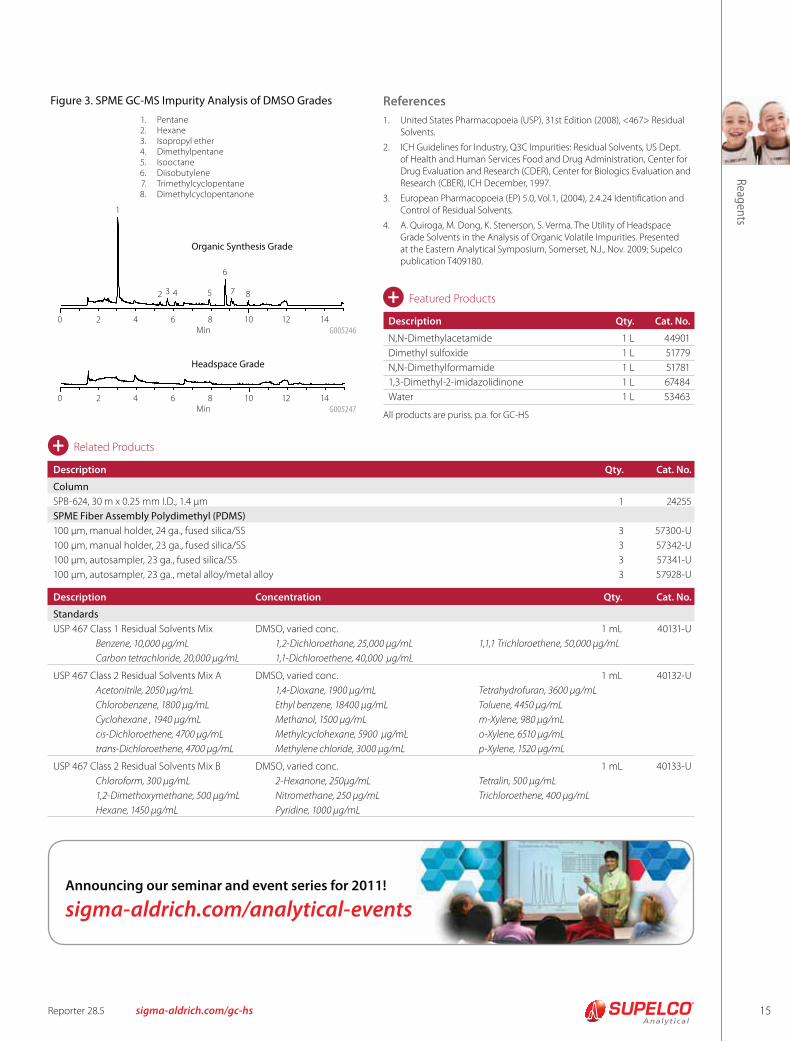
Chromatograms of headspace blanks (4) using GC-HS and
organic synthesis grades of DMSO are presented in Figures
1 and 2. Overall, the GC-HS grade blank had fewer peaks in
the OVI elution range than the organic synthesis grade blank.
Comparing the blanks with the chromatogram of a working OVI
standard prepared in GC-HS grade DMSO, it was reported (4)
that both blanks contained some dimethylformamide (DMF).
The organic synthesis blank contained a peak eluting close to
the retention time (tR) of ethanol. This peak could potentially
interfere with the proper detection and analysis of ethanol
as an OVI. A peak corresponding to the tR of 1,3-dimethyl-2-
imidazolidinone (DMI) was detected in the GC-HS blank. This
same peak was also detected in the OVI working standard
prepared in GC-HS grade DMSO (4).
Additional purity tests were done on both grades of DMSO using
gas chromatography-mass spectrometry (GC-MS). These tests
were carried out to make tentative identification of impurities
eluting in the primary range of OVIs. The analysis of impurities in
these solvents was performed using solid phase microextraction
(SPME) to do a headspace extraction. The samples of DMSO
were diluted 1:1 with deionized water, and a 2 mL aliquot was
extracted by headspace SPME and analyzed by GC-MS using the
conditions listed in Table 1.
Table 1. Headspace SPME, GC-MS Parameters
sample matrix: 1 mL DMSO + 1 mL deionized water in 4 mL vial
SPME fiber: 100 μm PDMS
extraction: Headspace, 50 °C, 5 min. with stirring
desorption process: 250 °C for 3 min.
column: SPB™-624, 30 m x 0.25 mm I.D., 1.4 μm (24255)
oven: 35 °C (3 min.), 8 °C/min. to 220 °C (10 min.)
MSD interface: 220 °C
scan range: m/z 40 – 450
carrier gas: helium, 1 mL/min.
liner: 0.75 mm I.D., SPME
Figure 1. Headspace Blank, DMSO – Organic Synthesis Grade
Figure 2. Headspace Blank, DMSO – Fluka GC-HS Grade
4 6 8 10 12 14 16 18 20Min G005244
4.482
15.467
tR close to ethanol
tR matches DMF
4 6 8 10 12 14 16 18 20Min G005245
15.486
19.173
tR matches DMF
tR matches
DMI
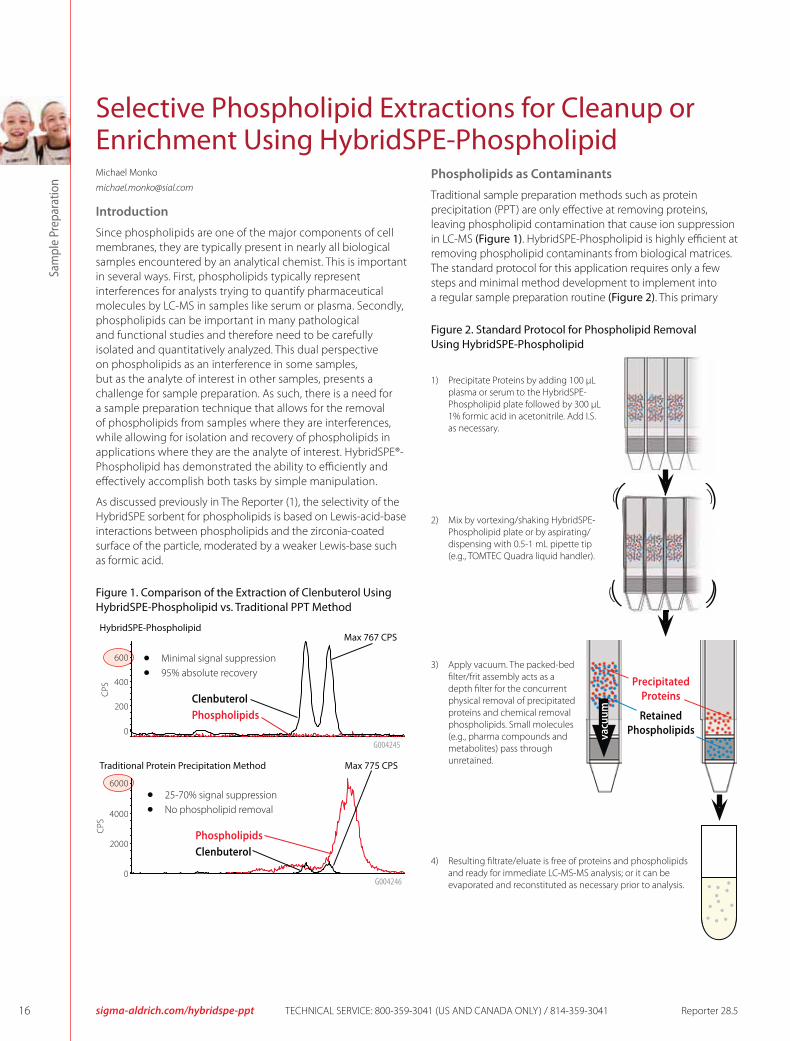
Figure 3 presents Total ion chromatograms (TICs) from the
analysis of GC-HS and organic synthesis grade DMSO. The scale
of both TICs is the same, and the elution range prior to DMSO
is shown. The baseline disturbances present in both TICs are
a result of background artifacts resulting from the headspace
SPME. The organic synthesis grade was found to contain many
peaks not detected in the GC-HS grade DMSO. These peaks were
tentatively identified by spectral library match and peaks 1 and 2
(pentane and hexane) are class 3 and 2 solvents respectively.
These results suggest that the GC-HS grade DMSO is more suitable
for the analysis of OVIs. The GC-HS grade produced a cleaner
headspace blank and did not show any major interference peaks in
the elution range of the target analytes. In comparison, the organic
synthesis grade showed a large peak in this range.
Additional purity testing of the solvents by headspace SPME/
GC-MS was able to detect and tentatively identify compounds in
the organic synthesis grade DMSO that were not present in the
GC-HS grade. Two of these compounds were solvents listed in
the ICH guidelines, USP Method <467>, and EP Method 2.4.24.
The GC-HS DMSO evaluated in this study was Fluka Brand and
is specified for headspace use. DMSO, as well as other Fluka
Brand solvents (see featured products next page) designated
for headspace use are manufactured under strictly controlled
processes, including micro-filtration and packaged under an
inert atmosphere. This ensures their suitability for meeting the
demands of headspace analysis.
Rea
gen
ts
sigma-aldrich.com/gc-hs ORDER: 800-247-6628 (US ONLY) / 814-359-3441 Reporter 28.5
15
Figure 3. SPME GC-MS Impurity Analysis of DMSO Grades
1. Pentane 2. Hexane 3. Isopropyl ether 4. Dimethylpentane 5. Isooctane 6. Diisobutylene 7. Trimethylcyclopentane 8. Dimethylcyclopentanone
Description Qty. Cat. No.
N,N-Dimethylacetamide 1 L 44901
Dimethyl sulfoxide 1 L 51779
N,N-Dimethylformamide 1 L 51781
1,3-Dimethyl-2-imidazolidinone 1 L 67484
Water 1 L 53463
All products are puriss. p.a. for GC-HS
Featured Products+ 0 2 4 6 8 10 12 14
Min
1
Organic Synthesis Grade
G005246
2 4 5
6
7 83
Headspace Grade
0 2 4 6 8 10 12 14Min G005247
References
1. United States Pharmacopoeia (USP), 31st Edition (2008), <467> Residual
Solvents.
2. ICH Guidelines for Industry, Q3C Impurities: Residual Solvents, US Dept.
of Health and Human Services Food and Drug Administration, Center for
Drug Evaluation and Research (CDER), Center for Biologics Evaluation and
Research (CBER), ICH December, 1997.
3. European Pharmacopoeia (EP) 5.0, Vol.1, (2004), 2.4.24 Identification and
Control of Residual Solvents.
4. A. Quiroga, M. Dong, K. Stenerson, S. Verma. The Utility of Headspace
Grade Solvents in the Analysis of Organic Volatile Impurities. Presented
at the Eastern Analytical Symposium, Somerset, N.J., Nov. 2009; Supelco
publication T409180.
Reag
ents
Description Qty. Cat. No.
Column
SPB-624, 30 m x 0.25 mm I.D., 1.4 μm 1 24255
SPME Fiber Assembly Polydimethyl (PDMS)
100 μm, manual holder, 24 ga., fused silica/SS 3 57300-U
100 μm, manual holder, 23 ga., fused silica/SS 3 57342-U
100 μm, autosampler, 23 ga., fused silica/SS 3 57341-U
100 μm, autosampler, 23 ga., metal alloy/metal alloy 3 57928-U
Description Concentration Qty. Cat. No.
Standards
USP 467 Class 1 Residual Solvents Mix DMSO, varied conc. 1 mL 40131-U
Benzene, 10,000 μg/mL 1,2-Dichloroethane, 25,000 μg/mL 1,1,1 Trichloroethene, 50,000 μg/mL
Carbon tetrachloride, 20,000 μg/mL 1,1-Dichloroethene, 40,000 μg/mL
USP 467 Class 2 Residual Solvents Mix A DMSO, varied conc. 1 mL 40132-U
Acetonitrile, 2050 μg/mL 1,4-Dioxane, 1900 μg/mL Tetrahydrofuran, 3600 μg/mL
Chlorobenzene, 1800 μg/mL Ethyl benzene, 18400 μg/mL Toluene, 4450 μg/mL
Cyclohexane , 1940 μg/mL Methanol, 1500 μg/mL m-Xylene, 980 μg/mL
cis-Dichloroethene, 4700 μg/mL Methylcyclohexane, 5900 μg/mL o-Xylene, 6510 μg/mL
trans-Dichloroethene, 4700 μg/mL Methylene chloride, 3000 μg/mL p-Xylene, 1520 μg/mL
USP 467 Class 2 Residual Solvents Mix B DMSO, varied conc. 1 mL 40133-U
Chloroform, 300 μg/mL 2-Hexanone, 250μg/mL Tetralin, 500 μg/mL
1,2-Dimethoxymethane, 500 μg/mL Nitromethane, 250 μg/mL Trichloroethene, 400 μg/mL
Hexane, 1450 μg/mL Pyridine, 1000 μg/mL
Related Products+
Reporter 28.5 sigma-aldrich.com/gc-hs
Announcing our seminar and event series for 2011!
sigma-aldrich.com/analytical-events
16 sigma-aldrich.com/hybridspe-ppt TECHNICAL SERVICE: 800-359-3041 (US AND CANADA ONLY) / 814-359-3041 Reporter 28.5
Sam
ple
Pre
par
atio
n
Selective Phospholipid Extractions for Cleanup or Enrichment Using HybridSPE-PhospholipidMichael Monko
Introduction
Since phospholipids are one of the major components of cell
membranes, they are typically present in nearly all biological
samples encountered by an analytical chemist. This is important
in several ways. First, phospholipids typically represent
interferences for analysts trying to quantify pharmaceutical
molecules by LC-MS in samples like serum or plasma. Secondly,
phospholipids can be important in many pathological
and functional studies and therefore need to be carefully
isolated and quantitatively analyzed. This dual perspective
on phospholipids as an interference in some samples,
but as the analyte of interest in other samples, presents a
challenge for sample preparation. As such, there is a need for
a sample preparation technique that allows for the removal
of phospholipids from samples where they are interferences,
while allowing for isolation and recovery of phospholipids in
applications where they are the analyte of interest. HybridSPE®-
Phospholipid has demonstrated the ability to efficiently and
effectively accomplish both tasks by simple manipulation.
As discussed previously in The Reporter (1), the selectivity of the
HybridSPE sorbent for phospholipids is based on Lewis-acid-base
interactions between phospholipids and the zirconia-coated
surface of the particle, moderated by a weaker Lewis-base such
as formic acid.
Phospholipids as Contaminants
Traditional sample preparation methods such as protein
precipitation (PPT) are only effective at removing proteins,
leaving phospholipid contamination that cause ion suppression
in LC-MS (Figure 1). HybridSPE-Phospholipid is highly efficient at
removing phospholipid contaminants from biological matrices.
The standard protocol for this application requires only a few
steps and minimal method development to implement into
a regular sample preparation routine (Figure 2). This primary
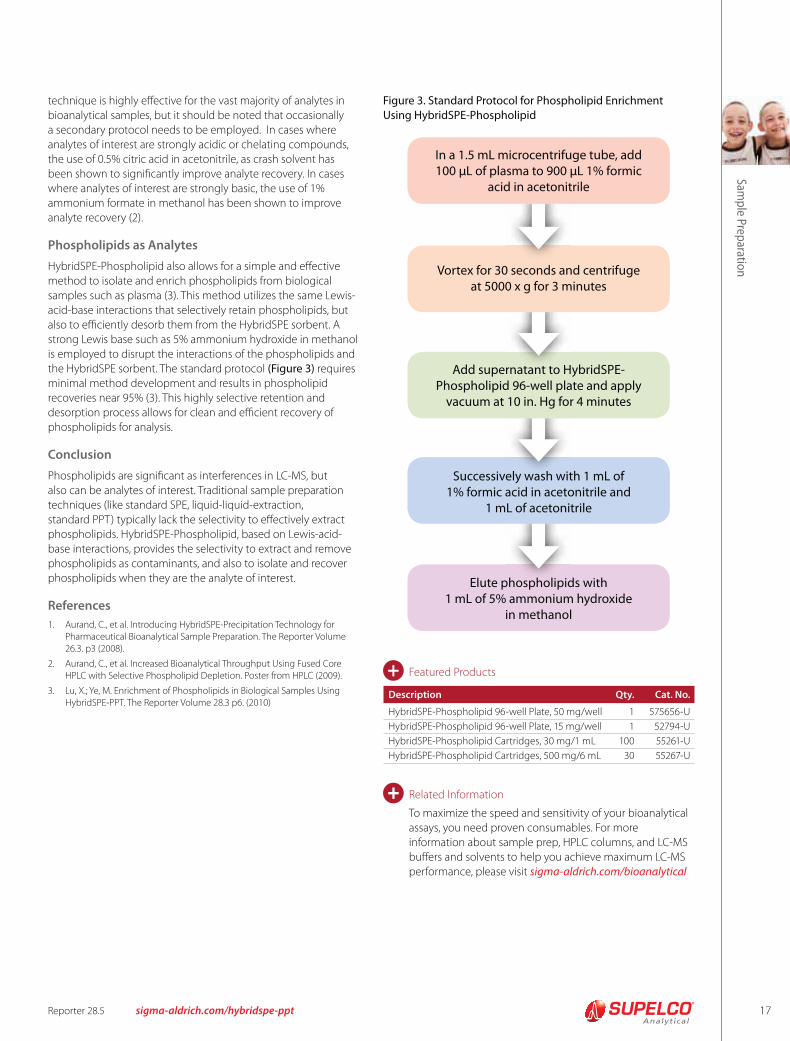
Figure 1. Comparison of the Extraction of Clenbuterol Using
HybridSPE-Phospholipid vs. Traditional PPT Method
G004245
CP
S
0
600
400
200
● Minimal signal suppression
● 95% absolute recovery
Clenbuterol
Phospholipids
Max 767 CPS
● 25-70% signal suppression
● No phospholipid removal
Phospholipids
Clenbuterol
G004246
CP
S
0
6000
4000
2000
Max 775 CPS
HybridSPE-Phospholipid
Traditional Protein Precipitation Method
Figure 2. Standard Protocol for Phospholipid Removal
Using HybridSPE-Phospholipid
((
((
))
))
Precipitated
Proteins
Retained
Phospholipids
vacu
um
1) Precipitate Proteins by adding 100 μL
plasma or serum to the HybridSPE-
Phospholipid plate followed by 300 μL
1% formic acid in acetonitrile. Add I.S.
as necessary.
2) Mix by vortexing/shaking HybridSPE-
Phospholipid plate or by aspirating/
dispensing with 0.5-1 mL pipette tip
(e.g., TOMTEC Quadra liquid handler).
3) Apply vacuum. The packed-bed
filter/frit assembly acts as a
depth filter for the concurrent
physical removal of precipitated
proteins and chemical removal
phospholipids. Small molecules
(e.g., pharma compounds and
metabolites) pass through
unretained.
4) Resulting filtrate/eluate is free of proteins and phospholipids
and ready for immediate LC-MS-MS analysis; or it can be
evaporated and reconstituted as necessary prior to analysis.
17
Related Information+
Reporter 28.5 sigma-aldrich.com/hybridspe-ppt
Samp
le Preparatio
n
Figure 3. Standard Protocol for Phospholipid Enrichment
Using HybridSPE-Phospholipid
Description Qty. Cat. No.
HybridSPE-Phospholipid 96-well Plate, 50 mg/well 1 575656-U
HybridSPE-Phospholipid 96-well Plate, 15 mg/well 1 52794-U
HybridSPE-Phospholipid Cartridges, 30 mg/1 mL 100 55261-U
HybridSPE-Phospholipid Cartridges, 500 mg/6 mL 30 55267-U
Featured Products+
To maximize the speed and sensitivity of your bioanalytical
assays, you need proven consumables. For more
information about sample prep, HPLC columns, and LC-MS
buffers and solvents to help you achieve maximum LC-MS
performance, please visit sigma-aldrich.com/bioanalytical
technique is highly effective for the vast majority of analytes in
bioanalytical samples, but it should be noted that occasionally
a secondary protocol needs to be employed. In cases where
analytes of interest are strongly acidic or chelating compounds,
the use of 0.5% citric acid in acetonitrile, as crash solvent has
been shown to significantly improve analyte recovery. In cases
where analytes of interest are strongly basic, the use of 1%
ammonium formate in methanol has been shown to improve
analyte recovery (2).
Phospholipids as Analytes
HybridSPE-Phospholipid also allows for a simple and effective
method to isolate and enrich phospholipids from biological
samples such as plasma (3). This method utilizes the same Lewis-
acid-base interactions that selectively retain phospholipids, but
also to efficiently desorb them from the HybridSPE sorbent. A
strong Lewis base such as 5% ammonium hydroxide in methanol
is employed to disrupt the interactions of the phospholipids and
the HybridSPE sorbent. The standard protocol (Figure 3) requires
minimal method development and results in phospholipid
recoveries near 95% (3). This highly selective retention and
desorption process allows for clean and efficient recovery of
phospholipids for analysis.
Conclusion
Phospholipids are significant as interferences in LC-MS, but
also can be analytes of interest. Traditional sample preparation
techniques (like standard SPE, liquid-liquid-extraction,
standard PPT) typically lack the selectivity to effectively extract
phospholipids. HybridSPE-Phospholipid, based on Lewis-acid-
base interactions, provides the selectivity to extract and remove
phospholipids as contaminants, and also to isolate and recover
phospholipids when they are the analyte of interest.
References
1. Aurand, C., et al. Introducing HybridSPE-Precipitation Technology for
Pharmaceutical Bioanalytical Sample Preparation. The Reporter Volume
26.3. p3 (2008).
2. Aurand, C., et al. Increased Bioanalytical Throughput Using Fused Core
HPLC with Selective Phospholipid Depletion. Poster from HPLC (2009).
3. Lu, X.; Ye, M. Enrichment of Phospholipids in Biological Samples Using
HybridSPE-PPT. The Reporter Volume 28.3 p6. (2010)
Elute phospholipids with
1 mL of 5% ammonium hydroxide
in methanol
phospholipid
Successively wash with 1 mL of
1% formic acid in acetonitrile and
1 mL of acetonitrile
l h it
Add supernatant to HybridSPE-
Phospholipid 96-well plate and apply
vacuum at 10 in. Hg for 4 minutes
rnatant to H
Vortex for 30 seconds and centrifuge
at 5000 x g for 3 minutes
In a 1.5 mL microcentrifuge tube, add
100 μL of plasma to 900 μL 1% formic
acid in acetonitrile
18 sigma-aldrich.com/air_monitoring ORDER: 800-247-6628 (US ONLY) / 814-359-3441 Reporter 28.5
Sam
ple
Pre
par
atio
n
Preventing Contamination of Thermal Desorption Tubes
During Storage Using TDS3 Storage ContainersJamie Brown and Kristen Schultz
Introduction
The goal of this study was to evaluate the usefulness of the
Supelco “Thermal Desorption Tube Sampling and Storage
System" ( TDS3™ ) in preventing thermal desorption tubes from
becoming contaminated if stored in a highly contaminated
atmosphere. It’s crucial that the thermal desorption tube is kept
clean prior to sampling, and that new contaminants are not
adsorbed by the adsorbents after sampling and during transport
back to the laboratory. The TDS3 storage container was tested
along with the popular brass Swagelok® endcap with a PTFE
one-piece ferrule. The TDS3 container offers users an alternative
to brass endcaps. They are 84% lighter (reduced shipping cost)
and the clear body allows the user to conveniently read the
serial number or the barcode* on the tube without the need to
remove it from the container.
This study challenges the TDS3 storage container by subjecting
pre-conditioned tubes to a highly contaminated atmosphere for
seven days. The tubes were then analyzed to determine if any
contaminants migrated through the storage container and were
adsorbed by the adsorbents in the tube. This study was conducted
using Supelco’s new glass-fritted 89 mm long thermal desorption
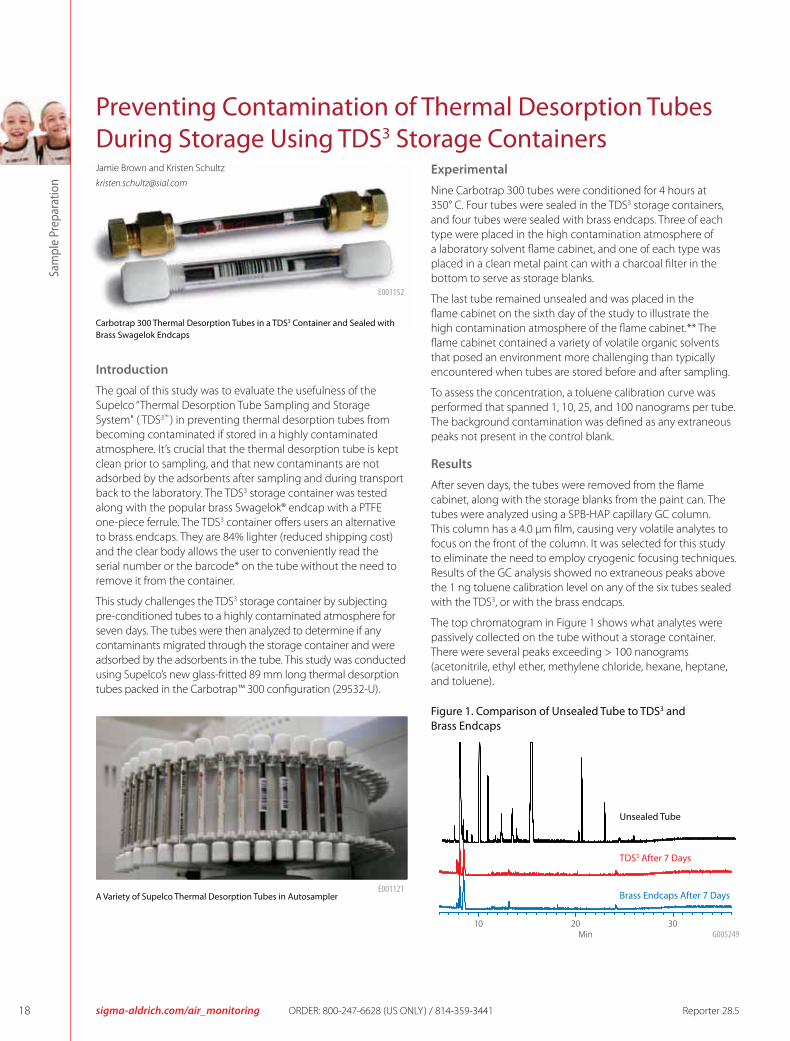
tubes packed in the Carbotrap™ 300 configuration (29532-U).
Carbotrap 300 Thermal Desorption Tubes in a TDS3 Container and Sealed with
Brass Swagelok Endcaps
Experimental
Nine Carbotrap 300 tubes were conditioned for 4 hours at
350° C. Four tubes were sealed in the TDS3 storage containers,
and four tubes were sealed with brass endcaps. Three of each
type were placed in the high contamination atmosphere of
a laboratory solvent flame cabinet, and one of each type was
placed in a clean metal paint can with a charcoal filter in the
bottom to serve as storage blanks.
The last tube remained unsealed and was placed in the
flame cabinet on the sixth day of the study to illustrate the
high contamination atmosphere of the flame cabinet.** The
flame cabinet contained a variety of volatile organic solvents
that posed an environment more challenging than typically
encountered when tubes are stored before and after sampling.
To assess the concentration, a toluene calibration curve was
performed that spanned 1, 10, 25, and 100 nanograms per tube.
The background contamination was defined as any extraneous
peaks not present in the control blank.
Results
After seven days, the tubes were removed from the flame
cabinet, along with the storage blanks from the paint can. The
tubes were analyzed using a SPB-HAP capillary GC column.
This column has a 4.0 μm film, causing very volatile analytes to
focus on the front of the column. It was selected for this study
to eliminate the need to employ cryogenic focusing techniques.
Results of the GC analysis showed no extraneous peaks above
the 1 ng toluene calibration level on any of the six tubes sealed
with the TDS3, or with the brass endcaps.
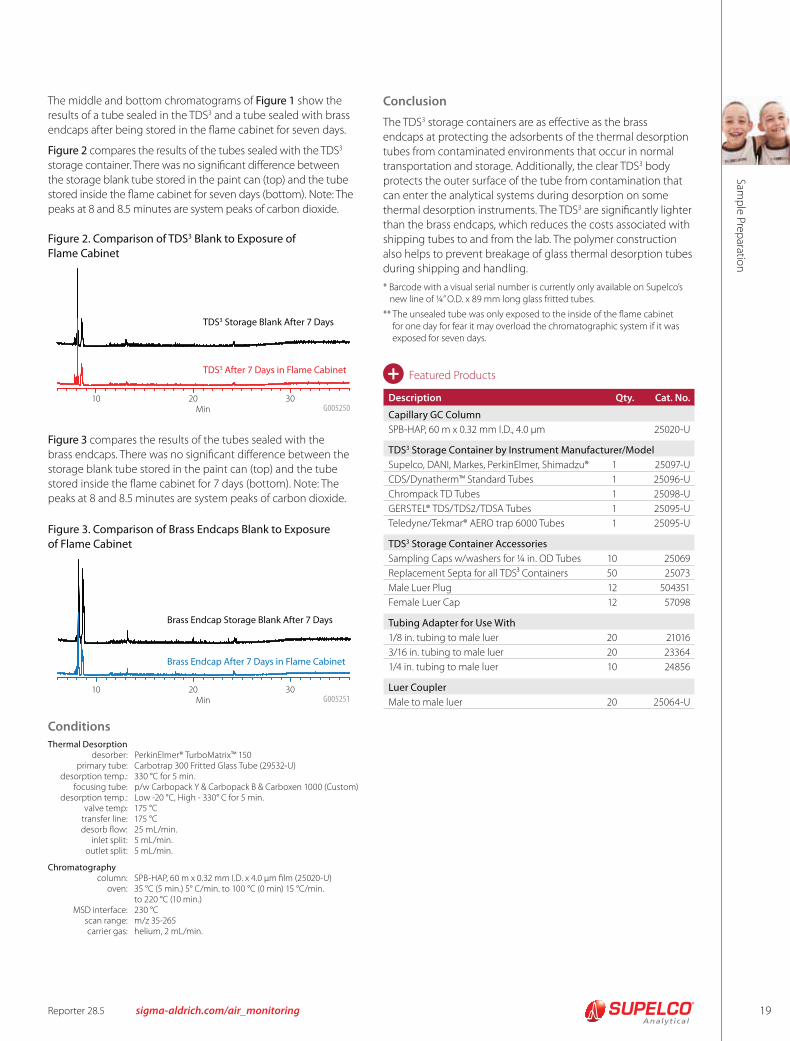
The top chromatogram in Figure 1 shows what analytes were
passively collected on the tube without a storage container.
There were several peaks exceeding > 100 nanograms
(acetonitrile, ethyl ether, methylene chloride, hexane, heptane,
and toluene).
Figure 1. Comparison of Unsealed Tube to TDS3 and
Brass Endcaps
Unsealed Tube
TDS3 After 7 Days
Brass Endcaps After 7 Days
G005249 10 20 30
Min
E001152
A Variety of Supelco Thermal Desorption Tubes in AutosamplerE001121
19Reporter 28.5 sigma-aldrich.com/air_monitoring
Samp
le P
rep
aration
Figure 2. Comparison of TDS3 Blank to Exposure of
Flame Cabinet
Figure 3. Comparison of Brass Endcaps Blank to Exposure
of Flame Cabinet
The middle and bottom chromatograms of Figure 1 show the
results of a tube sealed in the TDS3 and a tube sealed with brass
endcaps after being stored in the flame cabinet for seven days.
Figure 2 compares the results of the tubes sealed with the TDS3
storage container. There was no significant difference between
the storage blank tube stored in the paint can (top) and the tube
stored inside the flame cabinet for seven days (bottom). Note: The
peaks at 8 and 8.5 minutes are system peaks of carbon dioxide.
Figure 3 compares the results of the tubes sealed with the
brass endcaps. There was no significant difference between the
storage blank tube stored in the paint can (top) and the tube
stored inside the flame cabinet for 7 days (bottom). Note: The
peaks at 8 and 8.5 minutes are system peaks of carbon dioxide.
Conditions
Thermal Desorption desorber: PerkinElmer® TurboMatrix™ 150 primary tube: Carbotrap 300 Fritted Glass Tube (29532-U) desorption temp.: 330 °C for 5 min. focusing tube: p/w Carbopack Y & Carbopack B & Carboxen 1000 (Custom) desorption temp.: Low -20 °C, High - 330° C for 5 min. valve temp: 175 °C transfer line: 175 °C desorb flow: 25 mL/min. inlet split: 5 mL/min. outlet split: 5 mL/min.
Chromatography column: SPB-HAP, 60 m x 0.32 mm I.D. x 4.0 μm film (25020-U) oven: 35 °C (5 min.) 5° C/min. to 100 °C (0 min) 15 °C/min. to 220 °C (10 min.) MSD interface: 230 °C scan range: m/z 35-265 carrier gas: helium, 2 mL/min.
TDS3 Storage Blank After 7 Days
TDS3 After 7 Days in Flame Cabinet
Brass Endcap Storage Blank After 7 Days
Brass Endcap After 7 Days in Flame Cabinet
10 20 30Min G005250
10 20 30Min G005251
Conclusion
The TDS3 storage containers are as effective as the brass
endcaps at protecting the adsorbents of the thermal desorption
tubes from contaminated environments that occur in normal
transportation and storage. Additionally, the clear TDS3 body
protects the outer surface of the tube from contamination that
can enter the analytical systems during desorption on some
thermal desorption instruments. The TDS3 are significantly lighter
than the brass endcaps, which reduces the costs associated with
shipping tubes to and from the lab. The polymer construction
also helps to prevent breakage of glass thermal desorption tubes
during shipping and handling.
* Barcode with a visual serial number is currently only available on Supelco’s
new line of ¼” O.D. x 89 mm long glass fritted tubes.
** The unsealed tube was only exposed to the inside of the flame cabinet
for one day for fear it may overload the chromatographic system if it was
exposed for seven days.
Description Qty. Cat. No.
Capillary GC Column
SPB-HAP, 60 m x 0.32 mm I.D., 4.0 μm 25020-U
TDS3 Storage Container by Instrument Manufacturer/Model
Supelco, DANI, Markes, PerkinElmer, Shimadzu® 1 25097-U
CDS/Dynatherm™ Standard Tubes 1 25096-U
Chrompack TD Tubes 1 25098-U
GERSTEL® TDS/TDS2/TDSA Tubes 1 25095-U
Teledyne/Tekmar® AERO trap 6000 Tubes 1 25095-U
TDS3 Storage Container Accessories
Sampling Caps w/washers for ¼ in. OD Tubes 10 25069
Replacement Septa for all TDS3 Containers 50 25073
Male Luer Plug 12 504351
Female Luer Cap 12 57098
Tubing Adapter for Use With
1/8 in. tubing to male luer 20 21016
3/16 in. tubing to male luer 20 23364
1/4 in. tubing to male luer 10 24856
Luer Coupler
Male to male luer 20 25064-U
Featured Products+
20 sigma-aldrich.com/silicagel
Silica Gelfor your day-to-day purification needs
at 70% discount
Silica gel is used for many different purposes in research labs.
60 angstrom silica is the most common silica gel product and
is used in routine day-to-day purification applications. Sigma-
Aldrich offers a broad range of silica gel products and other
separation media from high purity to specialty bonded silica
gels to match your application requirements.
In addition to the high purity and specialty silica products, we
also offer cost-effective alternatives for less critical application
requirements. Order any of the silica gel products listed here
using Promotion Code 982 and get a 70% discount off list price.
For high volume or special requirements, request a quotation for
special consideration.
Particle/Pore Size Description Pack Size* Cat. No.
40-63 μm/60 Å High purity silica gel 1KG 60737-1KG
25KG 60737-25KG
40-63 μm/60 Å High purity silica gel 1KG 60752-1KG
With 0.1% calcium 25KG 60752-25KG
35-70 μm/60 Å High purity silica gel 1KG 60738-1KG
25KG 60738-25KG
63-200 μm/60 Å High purity silica gel 1KG 60741-1KG
25KG 60741-25KG
* Other pack sizes are available.
For additional details please contact your Sigma-Aldrich sales representative or your local Sigma-Aldrich office.
Special promotion discount expires December 31, 2010.
21Reporter 28.5 sigma-aldrich.com/syringes
Accesso
ries
Precise Manual Injections Every Time with the Merlin MicroShot Injector
Featured Products+Volume Cat. No.
Merlin MicroShot Injector
0.1 μL 29464-U
0.2 μL 29466-U
0.5 μL 29468-U
1.0 μL 29471-U
2.0 μL 29472-U
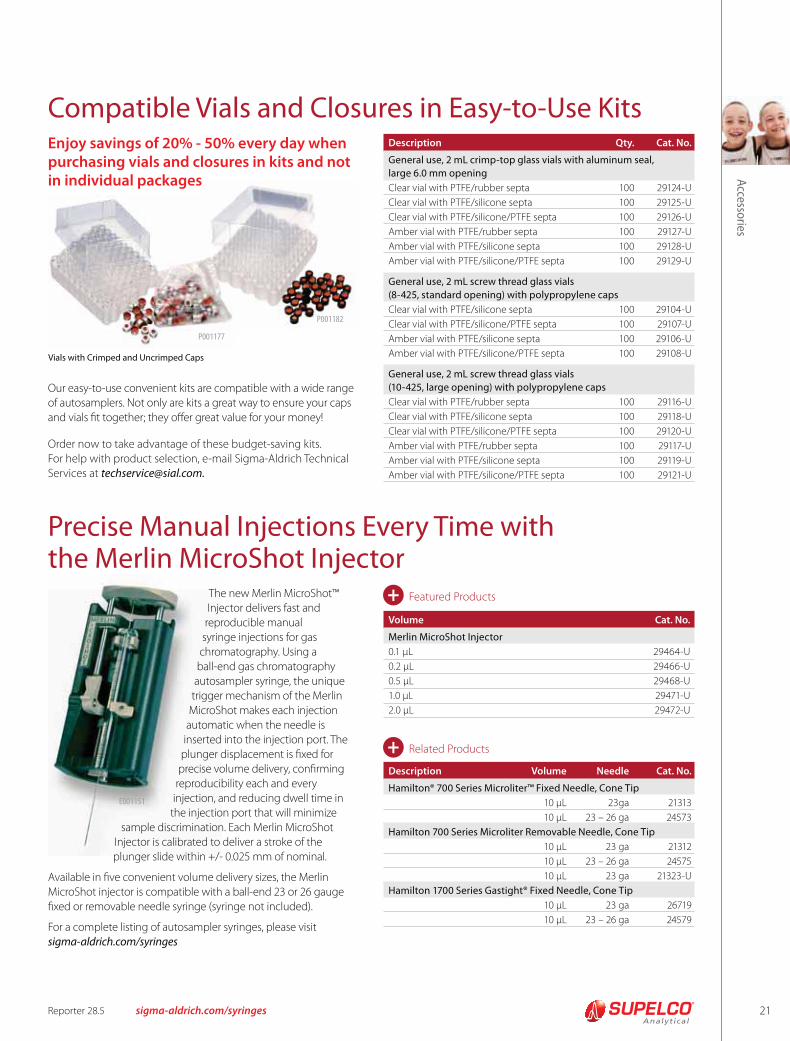
The new Merlin MicroShot™
Injector delivers fast and
reproducible manual
syringe injections for gas
chromatography. Using a
ball-end gas chromatography
autosampler syringe, the unique
trigger mechanism of the Merlin
MicroShot makes each injection
automatic when the needle is
inserted into the injection port. The
plunger displacement is fixed for
precise volume delivery, confirming
reproducibility each and every
injection, and reducing dwell time in
the injection port that will minimize
sample discrimination. Each Merlin MicroShot
Injector is calibrated to deliver a stroke of the
plunger slide within +/- 0.025 mm of nominal.
Available in five convenient volume delivery sizes, the Merlin
MicroShot injector is compatible with a ball-end 23 or 26 gauge
fixed or removable needle syringe (syringe not included).
For a complete listing of autosampler syringes, please visit
sigma-aldrich.com/syringes
E001151
Description Volume Needle Cat. No.
Hamilton® 700 Series Microliter™ Fixed Needle, Cone Tip
10 μL 23ga 21313
10 μL 23 – 26 ga 24573
Hamilton 700 Series Microliter Removable Needle, Cone Tip
10 μL 23 ga 21312
10 μL 23 – 26 ga 24575
10 μL 23 ga 21323-U
Hamilton 1700 Series Gastight® Fixed Needle, Cone Tip
10 μL 23 ga 26719
10 μL 23 – 26 ga 24579
Related Products+
Compatible Vials and Closures in Easy-to-Use KitsDescription Qty. Cat. No.
General use, 2 mL crimp-top glass vials with aluminum seal,
large 6.0 mm opening
Clear vial with PTFE/rubber septa 100 29124-U
Clear vial with PTFE/silicone septa 100 29125-U
Clear vial with PTFE/silicone/PTFE septa 100 29126-U
Amber vial with PTFE/rubber septa 100 29127-U
Amber vial with PTFE/silicone septa 100 29128-U
Amber vial with PTFE/silicone/PTFE septa 100 29129-U
General use, 2 mL screw thread glass vials
(8-425, standard opening) with polypropylene caps
Clear vial with PTFE/silicone septa 100 29104-U
Clear vial with PTFE/silicone/PTFE septa 100 29107-U
Amber vial with PTFE/silicone septa 100 29106-U
Amber vial with PTFE/silicone/PTFE septa 100 29108-U
General use, 2 mL screw thread glass vials
(10-425, large opening) with polypropylene caps
Clear vial with PTFE/rubber septa 100 29116-U
Clear vial with PTFE/silicone septa 100 29118-U
Clear vial with PTFE/silicone/PTFE septa 100 29120-U
Amber vial with PTFE/rubber septa 100 29117-U
Amber vial with PTFE/silicone septa 100 29119-U
Amber vial with PTFE/silicone/PTFE septa 100 29121-U
Vials with Crimped and Uncrimped Caps
P001182
Enjoy savings of 20% - 50% every day when purchasing vials and closures in kits and not in individual packages
P001177
Our easy-to-use convenient kits are compatible with a wide range
of autosamplers. Not only are kits a great way to ensure your caps
and vials fit together; they offer great value for your money!
Order now to take advantage of these budget-saving kits.
For help with product selection, e-mail Sigma-Aldrich Technical
Services at [email protected].
22 sigma-aldrich.com/standards ORDER: 800-247-6628 (US ONLY) / 814-359-3441 Reporter 28.5
Stan
dar
ds
High-Purity DNPH Standards for Monitoring of Atmospheric CarbonylsKetones and aldehydes are released into the atmosphere on a daily
basis by motor vehicle emissions, building materials, household
products, cigarette smoke and the photo-oxidation of volatile
organic compounds. Short-term exposure to these carbonyl
compounds can result in burning sensations to the eyes, nose,
and throat, fatigue and nausea. Long-term exposure may result in
cancer as carbonyls are considered probable carcinogens.
Analysts monitoring for atmospheric carbonyls follow
prescribed methods published by the US Environmental
Protection Agency, the California Air Resource Board, and
the American Society for Testing and Materials (ASTM). These
methods call for trapping carbonyls on an adsorbent coated
with dinitrophenylhydrazine (DNPH). The captured carbonyls
react with the 2,4-DNPH compound to form a more stable
dinitrophenylhydrazone derivative that can be analyzed by
HPLC-UV using reference standards.
Sigma Aldrich offers more than fifty 2,4-DNPH carbonyl derivative
reference standards for use in the quantitation of atmospheric
carbonyl compounds. They are available in the form of neats,
single component solutions and method specific mixtures. A
Certificate of Analysis stating both the DNPH derivatized and
non-derivatized concentration for each carbonyl is supplied
with each purchase. Free data packets detailing the preparation
and testing of both the raw materials and the final product are
available upon request. To view a complete listing of all DNPH-
derivative products, please visit sigma-aldrich.com/standards
Featured Products+Description Qty. Cat. No.
Neats
Acetaldehyde-2,4-DNPH 100 mg 442434
Acetone-2,4-DNPH 50 mg 442436
Acrolein-2,4-DNPH 25 mg 442441
2-Butanone-2,4-DNPH 100 mg 442339
Formaldehyde-2,4-DNPH 100 mg 442597
Description Concentration Qty. Cat. No.
European Standards
Carbonyl DNPH Mix 1 20 μg/mL in acetonitrile (except where noted) 1 mL 47672-U
Acetaldehyde-2,4-DNPH 2-Butanone-2,4-DNPH Methacrolein-2,4-DNPH
Acetone-2,4-DNPH Crotonaldehyde-2,4-DNPH Propionaldehyde-2,4-DNPH
Acrolein-2,4-DNPH Formaldehyde-2,4-DNPH (40 μg/mL) p-Tolualdehyde-2,4-DNPH
Benzaldehyde-2,4-DNPH Hexaldehyde-2,4-DNPH Valeraldehyde-2,4-DNPH
Butyraldehyde-2,4-DNPH
California Air Resource Board
CARB Method 1004 DNPH Mix 1 3 μg/mL each component in acetonitrile 1 mL 47650-U
CARB Method 1004 DNPH Mix 2 30 μg/mL each component in acetonitrile 1 mL 47651-U
Acetaldehyde-2,4-DNPH 2-Butanone-2,4-DNPH Methacrolein-2,4-DNPH
Acetone-2,4-DNPH Crotonaldehyde-2,4-DNPH Propionaldehyde-2,4-DNPH
Acrolein-2,4-DNPH Formaldehyde-2,4-DNPH m-Tolualdehyde-2,4-DNPH
Benzaldehyde-2,4-DNPH Hexaldehyde-2,4-DNPH Valeraldehyde-2,4-DNPH
Butyraldehyde-2,4-DNPH
US Environmental Protection Agency
TO-11/1P-6A Aldehyde & Ketone DNPH Mix 15 μg/mL each component in acetonitrile 1 mL 47285-U
Acetaldehyde-2,4-DNPH Crotonaldehyde-2,4-DNPH Propionaldehyde-2,4-DNPH
Acetone-2,4-DNPH 2,5-Dimethylbenzaldehyde-2,4-DNPH o-Tolualdehyde-2,4-DNPH
Acrolein-2,4-DNPH Formaldehyde-2,4-DNPH m-Tolualdehyde-2,4-DNPH
Benzaldehyde-2,4-DNPH Hexaldehyde-2,4-DNPH p-Tolualdehyde-2,4-DNPH
Butyraldehyde-2,4-DNPH Isovaleraldehyde-2,4-DNPH Valeralddehyde-2,4-DNPH
Did you know…?
Supelco offers a wide range of DNPH air-sampling cartridges designated for sampling carbonyls (like formaldehyde) in ambient, indoor and industrial hygiene atmospheres. Our LpDNPH cartridges are suitable for use in the following regulatory methods: NIOSH 2016, ASTM D5197, US EPA 100, IP-6A, and TO-11A. For more information visit sigma-aldrich.com/LpDNPH.
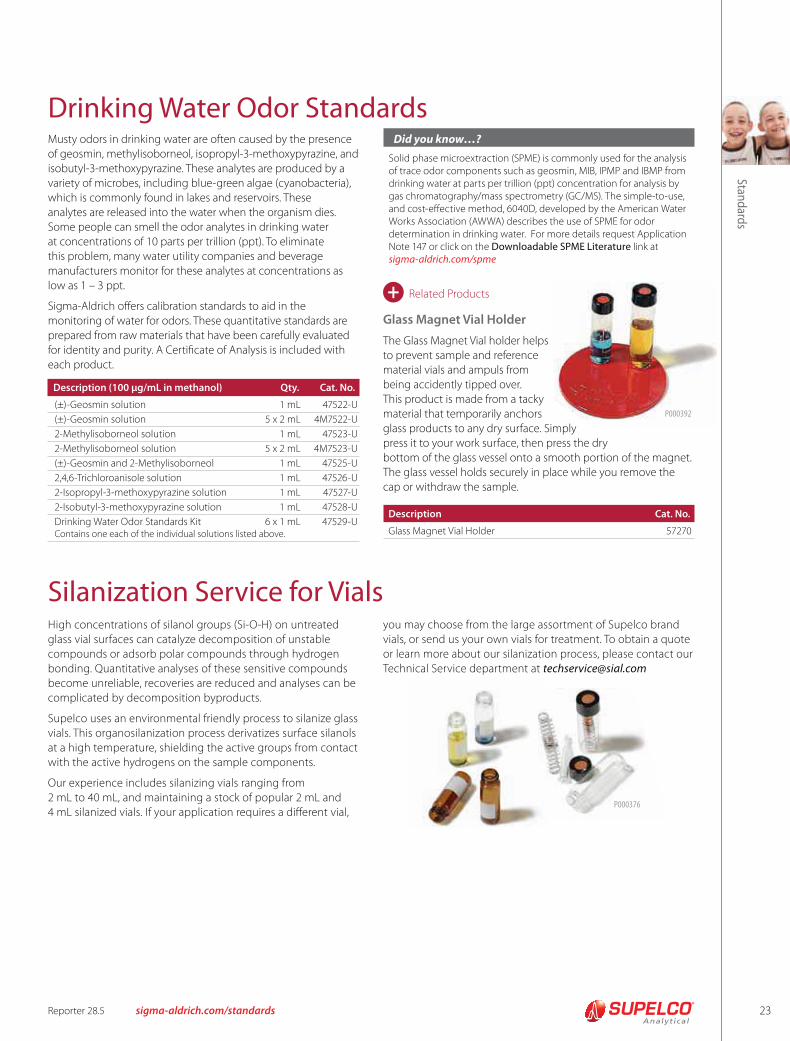
23Reporter 28.5 sigma-aldrich.com/standards
Stand
ards
Drinking Water Odor StandardsMusty odors in drinking water are often caused by the presence
of geosmin, methylisoborneol, isopropyl-3-methoxypyrazine, and
isobutyl-3-methoxypyrazine. These analytes are produced by a
variety of microbes, including blue-green algae (cyanobacteria),
which is commonly found in lakes and reservoirs. These
analytes are released into the water when the organism dies.
Some people can smell the odor analytes in drinking water
at concentrations of 10 parts per trillion (ppt). To eliminate
this problem, many water utility companies and beverage
manufacturers monitor for these analytes at concentrations as
low as 1 – 3 ppt.
Sigma-Aldrich offers calibration standards to aid in the
monitoring of water for odors. These quantitative standards are
prepared from raw materials that have been carefully evaluated
for identity and purity. A Certificate of Analysis is included with
each product.
Description (100 μg/mL in methanol) Qty. Cat. No.
(±)-Geosmin solution 1 mL 47522-U
(±)-Geosmin solution 5 x 2 mL 4M7522-U
2-Methylisoborneol solution 1 mL 47523-U
2-Methylisoborneol solution 5 x 2 mL 4M7523-U
(±)-Geosmin and 2-Methylisoborneol 1 mL 47525-U
2,4,6-Trichloroanisole solution 1 mL 47526-U
2-Isopropyl-3-methoxypyrazine solution 1 mL 47527-U
2-Isobutyl-3-methoxypyrazine solution 1 mL 47528-U
Drinking Water Odor Standards Kit 6 x 1 mL 47529-U Contains one each of the individual solutions listed above.
Description Cat. No.
Glass Magnet Vial Holder 57270
Related Products+Glass Magnet Vial Holder
The Glass Magnet Vial holder helps
to prevent sample and reference
material vials and ampuls from
being accidently tipped over.
This product is made from a tacky
material that temporarily anchors
glass products to any dry surface. Simply
press it to your work surface, then press the dry
bottom of the glass vessel onto a smooth portion of the magnet.
The glass vessel holds securely in place while you remove the
cap or withdraw the sample.
P000392
Silanization Service for VialsHigh concentrations of silanol groups (Si-O-H) on untreated
glass vial surfaces can catalyze decomposition of unstable
compounds or adsorb polar compounds through hydrogen
bonding. Quantitative analyses of these sensitive compounds
become unreliable, recoveries are reduced and analyses can be
complicated by decomposition byproducts.
Supelco uses an environmental friendly process to silanize glass
vials. This organosilanization process derivatizes surface silanols
at a high temperature, shielding the active groups from contact
with the active hydrogens on the sample components.
Our experience includes silanizing vials ranging from
2 mL to 40 mL, and maintaining a stock of popular 2 mL and
4 mL silanized vials. If your application requires a different vial,
you may choose from the large assortment of Supelco brand
vials, or send us your own vials for treatment. To obtain a quote
or learn more about our silanization process, please contact our
Technical Service department at [email protected]
P000376
Did you know…?
Solid phase microextraction (SPME) is commonly used for the analysis of trace odor components such as geosmin, MIB, IPMP and IBMP from drinking water at parts per trillion (ppt) concentration for analysis by gas chromatography/mass spectrometry (GC/MS). The simple-to-use, and cost-effective method, 6040D, developed by the American Water Works Association (AWWA) describes the use of SPME for odor determination in drinking water. For more details request Application Note 147 or click on the Downloadable SPME Literature link at sigma-aldrich.com/spme
MFA
T210005
Top Related