


Languages
Pages
Legal


SUMMARY OF THE SAN JUAN STRUCTURAL BASINREGIONAL AQUIFER-SYSTEM ANALYSIS, NEW MEXICO,
COLORADO, ARIZONA, AND UTAH
By Gary W. Levings, John Michael Kernodle, and Conde' R. Thorn
U.S. GEOLOGICAL SURVEY
Water-Resources Investigations Report 95-4188
Albuquerque, New Mexico
1996

U.S. DEPARTMENT OF THE INTERIOR
BRUCE BABBITT, Secretary
U.S. GEOLOGICAL SURVEY
Gordon P. Eaton, Director
For additional information write to:
District ChiefU.S. Geological SurveyWater Resources Division4501 Indian School Road ME, Suite 200Albuquerque, New Mexico 87110-3929
Copies of this report can be purchased from:
U.S. Geological SurveyEarth Science Information CenterOpen-File Reports SectionBox 25286, MS 517Denver Federal CenterDenver, Colorado 80225
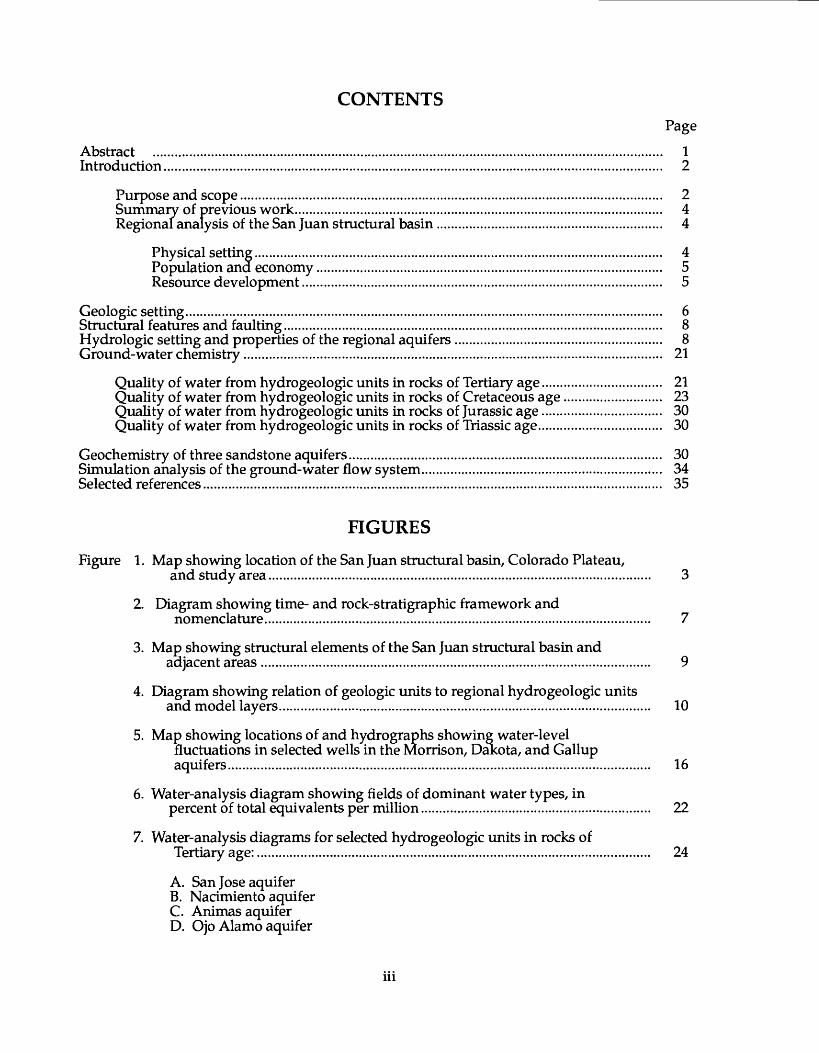
CONTENTSPage
Abstract ............................................................................................................................................ 1Introduction...........................................................^ 2
Purpose and scope.................................................................................................................... 2Summary of previous work..................................................................................................... 4Regional analysis of the San Juan structural basin.............................................................. 4
Physical setting................................................................................................................ 4Population and economy............................................................................................... 5Resource development................................................................................................... 5
Geologic setting................................................................................................................................... 6Structural features and faulting........................................................................................................ 8Hydrologic setting and properties of the regional aquifers ......................................................... 8Ground-water chemistry................................................................................................................... 21
Quality of water from hydrogeologic units in rocks of Tertiary age................................. 21Quality of water from hydrogeologic units in rocks of Cretaceous age........................... 23Quality of water from hydrogeologic units in rocks of Jurassic age................................. 30Quality of water from hydrogeologic units in rocks of Triassic age.................................. 30
Geochemistry of three sandstone aquifers...................................................................................... 30Simulation analysis of the ground-water flow system.................................................................. 34Selected references.............................................................................................................................. 35
FIGURES
Figure 1. Map showing location of the San Juan structural basin, Colorado Plateau,and study area......................................................................................................... 3
2. Diagram showing time- and rock-stratigraphic framework andnomenclature.......................................................................................................... 7
3. Map showing structural elements of the San Juan structural basin andadjacent areas........................................................................................................... 9
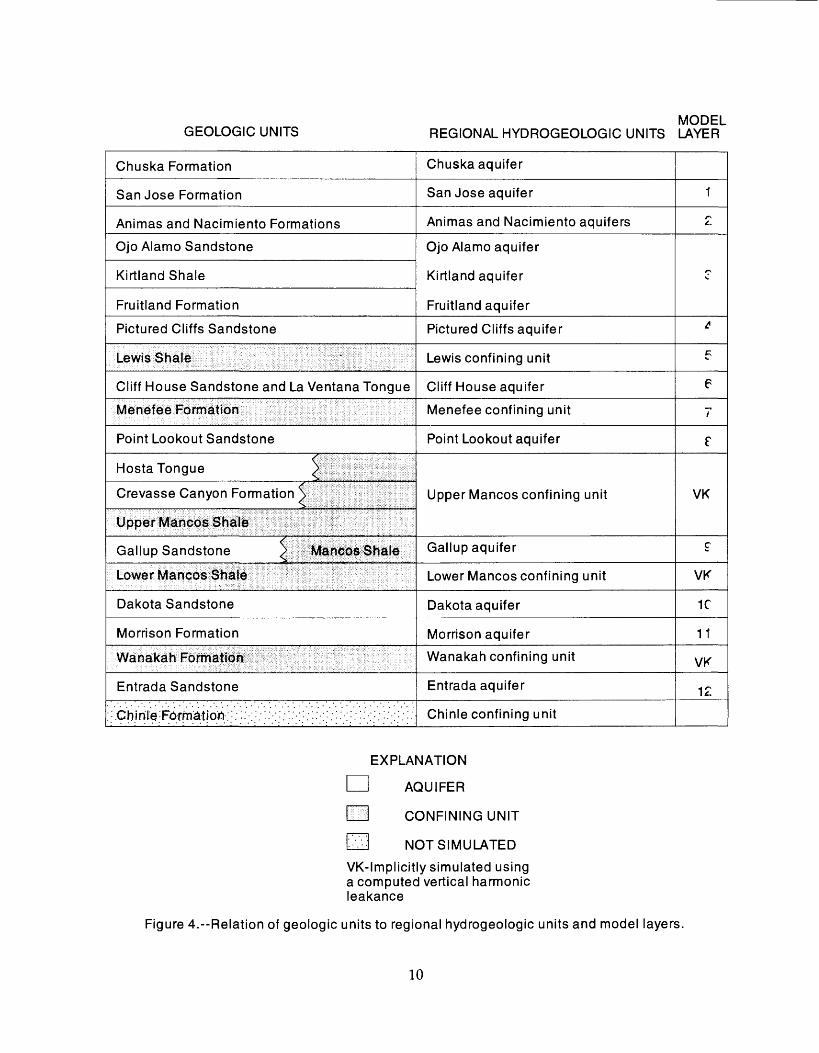
4. Diagram showing relation of geologic units to regional hydrogeologic unitsand model layers...................................................................................................... 10
5. Map showing locations of and hydrographs showing water-levelfluctuations in selected wells in the Morrison, Dakota, and Gallup aquifers.................................................................................................................... 16
6. Water-analysis diagram showing fields of dominant water types, inpercent of total equivalents per million............................................................... 22
7. Water-analysis diagrams for selected hydrogeologic units in rocks ofTertiary age:............................................................................................................ 24
A. San Jose aquifer B. Natimiento aquifer C. Animas aquifer D. Ojo Alamo aquifer
111

FIGURES-ConcludedPage
Figure 8. Water-analysis diagrams for selected hydrogeologic units in rocks ofCretaceous age: ...................................................................................................... 2^
A. Kirtland aquifer B. Fruitland aquifer C. Pictured Cliffs aquifer D. Cliff House aquifer E. Menefee confining unit F. Point Lookout aquifer G. Gallup aquifer H. Dakota aquifer
9. Water-analysis diagrams for selected hydrogeologic units in rocks ofJurassic age: ............................................................................................................ 21
A. Morrison aquiferB. Morrison aquifer (Westwater Canyon Member)C. Entrada aquifer
10. Water-analysis diagram for the Chinle confining unit........................................... 23
TABLES
Table 1. Summary of geologic nomenclature and lithologic characteristics ofregional units in the San Juan structural basin................................................... 29
2. Summary of hydrologic characteristics of hydrogeologic units in theSan Juan structural basin...................................................................................... 40
3. Selected maximum contaminant levels and secondary maximumcontaminant levels from the U.S. Environmental Protection Agency (1986a,b)................................................................................................................... 41
4. Selected properties of and constituents in water from hydrogeologic unitsin rocks of Tertiary age............................................................................................ 42
5. Selected properties of and constituents in water from hydrogeologic unitsin rocKS of Cretaceous age...................................................................................... 45
6. Selected properties of and constituents in water from Dwight'sENERGYDATA, Inc. BRIN data base for selected hydrogeologic units......... 48
7. Selected properties of and constituents in water from hydrogeologic unitsin rocks of Jurrasic age............................................................................................ 50
8. Selected properties of and constituents in water from hydrogeologic unitsin rocKS of Triassic age............................................................................................ 53
IV

CONVERSION FACTORS AND VERTICAL DATUMMultiply By To obtain
cubic foot per second (ft3/s) 0.02832 cubic meter per secondfoot (ft) 0.3048 meterfoot per day (ft/day) 0.3048 meter per dayfoot squared per day (fr/d) 0.09290 meter squared per daygallon per minute (gal/min) 0.00006309 cubic meter per secondgallon per minute per foot (gal/min)/ft 0.2070 liter per second per
meterinch (in.) 0.0254 metermile (mi) 1.609 kilometersquare mile (mi2) 2.590 square kilometer
Specific conductance is expressed in microsiemens per centimeter at 25 degrees Celsius.
Temperature in degrees Fahrenheit (°F) or degrees Celsius (°C) may be converted as follows:
°C = 5/9 (°F-32) °F = 9/5 (°C) + 32
Sea level: In this report, sea level refers to the National Geodetic Vertical Datum of 1929~a geodetic datum derived from a general adjustment of the first-order level nets of the United States and Canada, formerly called Sea Level Datum of 1929.

SUMMARY OF THE SAN JUAN STRUCTURAL BASINREGIONAL AQUIFER-SYSTEM ANALYSIS, NEW MEXICO,
COLORADO, ARIZONA, AND UTAHBy Gary W. Levings, John Michael Kernodle,
and Conde R. Thorn
ABSTRACT
Ground-water resources are the only source of water in most of the San Juan structural basin and are mainly used for municipal, industrial, domestic, and stock purposes. Industrial us^ increased dramatically during the late 1970's and early 1980's because of increased exploration and development of uranium and coal resources.
The San Juan structural basin is a northwest-trending, asymmetric structural depression at th9 eastern edge of the Colorado Plateau. The basin contains as much as 14,000 feet of sedimentary rocks overlying a Precambrian basement complex. The sedimentary rocks clip basinward from the basin margins toward the troughlike structural center, or deepest part of the oasin. Rocks of Triassic ag? were selected as the lower boundary for the study. The basin is well defined by structural boundaries in many places with structural relief of as much as 20,000 feet reported. Faulting i« prevalent in parts of the basin with displacement of several thousand feet along major faults.
The regional aquifers in the basin generally are coincident with the geologic units that have been mapped. Data on the hydrologic properties of the regional aquifers are minimal. Most data were collected on those aquifers associated with uranium and coal resource production. These data are summarized in table format in the report. The regional flow system throughout most of the basin has been affected by the production of oil or gas and subsequent disposal of produced brine. To date more than 26,000 oil- or gas-test holes have been drilled in the basin, the majority penetrating no deeper than the bottom of the Cretaceous rocks.
The general water chemistry of the regional aquifers is based on available data. The depositional environments are the major factor controlling the quality of water in the units. The dominant ions are generally sodium, bicarbonate, and sulfate. A detailed geochemical study of three sandstone aquif ers-Morrison, Dakota, and Gallup was undertaken in the northwestern part of the study area. Results of this study indicate that water chemistry changed in individual wells ove~ short periods of time, not expected in a regional flow system. Trie chemistry of the water is affected by mixing of recharge, ion filtrate, or very dilute ancient water, and by leakage of saline water.
The entire system of ground-water flow and its controlling factors has been defined as the conceptual model. A steady-state, three-dimensional ground-water flow model was constructed to simulate modern predevelopment flow in the post-Jurassic rocks of the regional flow system. In the ground-water flow model, 14 geologic units or combinations of geologic units were considered to be regional aquifers, and 5 geologic units or combinations of geologic units were considered to be regional confining units. The model simulated flow in 12 layers (hydrostratigraphic units) and used harmonic-mean vertical leakance to indirectly simulate aquifer connection across 3 othe~ hydrostratigraphic confining units in addition to coupling the 12 units.

INTRODUCTION
The San Juan structural basin in New Mexico, Colorado, Arizona, and Utah has an area of about 21,600 mi (fig. 1). The study area is that part of the structural basin that contains rocks of Triassic or younger age and, therefore, is less areally extensive than the structural basin, about 19,400 mi . Triassic through Tertiary sedimentary rocks are emphasized in this study becauf e the major aquifers in the basin are in these rocks.
Ground-water resources are the only source of water in most of the basin and are used rrainly for municipal, industrial, domestic, and stock purposes. Industrial use increased dramatically during the late 1970's and early 1980's because or increased exploration and development of uranium and coal resources. By the end of 1991, all major uranium mines had ceased production. The limited surface water of the basin has been fully appropriated.
During 1984-90, the U.S. Geological Survey conducted a regional assessment of the San Juan structural basin that involved review and analysis of previous studies, acquisition of new data in selected areas, geochemical analysis of three sandstone aquifers in the northwestern part of the basin, and development of a computer model to simulate ground-water flow. This investigation, which is summarized in this report, is one of several studies of the U.S. Geological Survey Regional Aquifer-System Analysis (RASA) program.
The general purpose of the RASA program is to better understand the Nation's ground-water resources. Previous studies of ground-water resources have been on a local scale, responsive to local, immediate needs. These studies usually have been restricted within political boundaries. However, hydrologic studies are needed on a regional scale for defining total ground-water resources and for planning the most effective development and use of these resources. Tlur, the concept of regional aquifer-system analyses was developed.
Purpose and Scope
The purpose of this report is to summarize the important aspects of the geology, hydrology, and geochemistry of the San Juan structural basin aquifer system. These descriptions are derivea from the results and published reports of the study. In addition, previously publisned reports en the hydrology and geology of the basin provided an extensive source of data to supplement the work done on this project. These previously published reports are cited in the references section of the following reports:
Craigg (in press) described the geologic framework of the San Juan structural basir and presents numerous maps showing the depth to top and thickness of the aquifers;
Kernodle (in press) described the hydrology and simulation of the ground-water flow system by use of a 12-layer digital model; and
Dam (1995) described the geochemistry of the Morrison, Dakota, and Gallup aquifers in the northwestern part of the basin.

105 1
COLORADO
BOUNDARY
OF THE SAN JUAN
STRUCTURAL
BASIN
BOUNDARY |
OF THE
COLORADO
PLATEAU
AREA OFTRIASSICOR
YOUNGERROCKS
100
200
200 300~T
400 KILOMETERS
400 MILES
Figure 1.-Location of the San Juan structural basin, Colorado Plateau, and study area.

Early in the project, the decision was made to use Geographic Information Systems (GIS) technology to develop the general automated data compilation, data analysis, and map-production capabilities needed for regional geologic and hydrologic resource studies. The development of new G1S program interfaces to high-accuracy automated cartographic drafting systems allowed for direct generation of publication-quality cartographic products. Hydrologic Investigations Atlases (HA's) were preparea for 10 aquifers using GIS technology. The aquifers generally are coincident with the geologic units. In descending stratigraphic order the geologic units (and HA references) are the: (1) San Jose, Nacimiento, and Animas Formations (Levings and others, 1990b); (2) Ojo Alamo Sandstone (Thorn and others, 1990b); (3) Kirtland Shale and Fruitland Formation (Kernodle and others, 1990); (4) Pictured Cliffs Sandstone (Dam and others, 1990b); (5) Cliff House Sandstone (Thorn and others, 1990a); (6) Menefee Formation (Levings and others, 1990a); (7) Point Lookout Sandstone, including the Hosta Tongue (Craigg and others, 1990); (8) Gallup Sandstone (Kernodle and others, 1989); (9) Dakota Sandstone (Craigg and others, 1989); and (10) Morrison Formation (Dam and others, 1990a). When data were sufficient for analysis, these HA's include such information as depth to the top, approximate altitude and configuration of the top, and thickness of the geologic unit; potentiometric surface of water in each geologic unit; hydrologic characteristics such as transmissivity, hydraulic conductivity, and storage coefficient; well characteristics such as discharge and specific capacity; hydrographs of selected wells; and water-quality data such as temperature, pH, dissolved solids, specific conductance, and major constituent concentrations.
Summary of Previous Work
Thousands of reports describing the hydrology, geology, or water chemistry of the San Juan structural basin have been publishea beginning with the nrst reports on its geology in the late 1800's. A bibliographic reference for reports on the geology and hydrology of the San Juan Basin was published in 1979 and includes more than 2,500 entries (Wright, 1979). These reports served as a source of supplemental data for the interpretations described in this report and the HA's prepared for this study. Although many of these reports provided a wealth of information, the investigations often terminated at political boundaries. The RASA investigation assembled, organized,, and assimilated this geohydrologic information on a regional basis.
Regional Analysis of the San Tuan Structural Basin
Physical SettingThe San Juan structural basin occupies the eastern third of the Navajo Section of the Colorado
Plateau physiographic province (Fenneman, 1931). Distinctive landscape features are mesas, rock terraces, retreating escarpments, canyons, dry washes, and mountains. In some parts volcanic necks and buttes are abundant. Altitudes in the study area range from 4,500 ft in San Juan County, Utah, to about 11,000 ft in Cibola County, New Mexico.
The San Juan structural basin is located in the arid Southwestern United States and therefore typically has mild winters with periodic cold-front storms; hot, dry, and windy springs and early summers; warm and monsoonal late summers; and cool, clear autumns. However, within the San Juan structural basin, a wide range of climatic conditions primarily are determined by topographic altitude and, to a lesser extent, by slope aspect. The low-altitude central and northwestern pa rts of the basin have an upper Sonoran climate, the warmest temperatures, and the least amount of precipitation. The mountainous regions around most of the northern and eastern perimeter of the basin are in the Canadian climate zone and have the coolest temperatures and the most precipitation.

Annual precipitation in the high mountainous areas along the northern and eastern margins of the basin is as much as 40 in., whereas annual precipitation in the lower altitude, central basin is generally less than 8 in. Mean annual precipitation in the study area is about 12 in. Most winter precipitation is snowfall, especially in the higher mountain areas where snowpack typically exceeds 100 in. Spring runoff from melting snowpack in the mountains accounts for the majority of surface water in the Dasin. Summer convective thunderstorms locally may drop considerable amounts of water in a very brief period of time, often causing severe and dangerous flash floods.
Potential mean annual evaporation ranges from a low of less than 40 in. in the northeastern part to more than 60 in. in the northwestern part of the study area. Throughout most of the area potential evaporation greatly exceeds precipitation. With additional losses to transpiration, the potential annual water deficit is large throughout most of the area. Because of the timing of rain and snowfall, however, water periodically is available for runoff and ground-water recharge regardless of the annual potential deficit.
Population and Economy
Data obtained from documents published by the U.S. Bureau of the Census (1980 and 1985) were used to calculate the population of the study area. The population in 1970 was calculated to b° about 134,000. The population increased to about 194,000 in 1980, 212,000 in 1982, 221,000 in 1984, and then decreased to about 210,000 in 1985. The economy of the basin is supported by exploration for and development of natural gas, petroleum, coal, and uranium resources; urban enterprise; farming and ranching; tourism; and recreation. The rise and fall in population were related to changes in the economic strength of the minerals, oil, and gas industries, and support services. Uranium-mining and -milling activities underwent rapid growth from the 1950's until the late 1970's and early 1980's when most uranium-mining activity came to an abrupt end. Likewise, the oil and gas industry prospered until about 1983 and then declined rapidly.
The population in the basin has since risen to 225,000 in 1990 (U.S. Bureau of the Census, 1990). The increase may, in part, be due to a surge in the development of coal-bed methane from iha Fruitland Formation and may also be due to the rapid growth of tourism in the Four Corners ares. Both of these areas of development promote growth in service-oriented commerce and industry.
Resource Development
The San Juan structural basin contains a number of geologic units that are different with respect to water-yielding properties, water chemistry, and flow. Ground-water development in the basin has not been uniformly distributed either areafly within individual geologic units or from unit to unit. Along the southern part of the basin, ground-water levels have declined significantly in response to pumping to dewater the Morrison Formation for underground uranium mining. In other areas, strip mininjg of shallow coal beds has led to the dewatering of the Fruitland Formation. The San Juan structural basin is a major gas and oil producing area, and as a result, ground wate~ has been produced as a by-product. Disposal of ground water has been by injection into selected subsurface units. The exploration and development of these activities peaked in the early 1980's. At that time, water pumpage was projected to tnple from 1980 to 2005 (Frenzel, 1983, p. 53 and 63). At the present time (1992J development of these resources has decreased significantly. All major uranium mines have ceased production of uranium ore; strip mining of coal continues but no new mines have been opened since the early 1980's; and oil and gas exploration has been declining since the mid- to late 1980's. The renewed interest in the production of coal-bed methane, from the Fruitland Formation, has resulted in a flurry of drilling activity, which began in the late 1980's and is expected to continue into the early 1990's.

GEOLOGIC SETTING
The San Juan structural basin is a northwest-trending, asymmetric structural depression at the eastern edge of the Colorado Plateau (fig. 1). The basin is primarily in northwestern New Mexico but includes areas in southwestern Colorado, northeastern Arizona, and extreme southeastern Utah. It is one of several large basins interspersed or embayed into the ranges and chains of the Focky Mountain area and is, in a sense, a structural embayment of the Colorado Plateau into the southwestern edge of the Rocky Mountains. The northern and eastern rims are structurally corrolex; however, the southern part of the basin merges with a volcanic plateau and on the west the margin is locally complex. Several subbasins, reentrants, or embayments extend from the basin prope"* into the adjoining uplifts and plateaus.
Underlying the San Juan structural basin are (1) a Precambrian basement complex composed of igneous and metamorphic rocks; (2) gently dipping and flat-lying Paleozoic, Mesozoic, and Cenozoic sedimentary rocks as thick as 14,000 ft CFassett and Hinds, 1971, p. 4); (3) a variety of Upper Cretaceous and Cenozoic igneous rocks; and (4) various unconsolidated deposits of Quaternary age. For the most part, these sedimentary rocks dip from the basin margins toward the troughlike structural center, the deepest part of the structural basin. Older sedimentary rocks, which crop out around the basin margins, are overlain by younger rocks toward the center of the structural basin. Volcanic rocks of Tertiary age and various deposits of Quaternary age also are present in the basin.
The present San Juan structural basin has been the site of marine and continental deposition, and its present configuration is largely a result of early to mid-Tertiary Laramide tectonic events. Although rocks of Cambrian, Devonian, Mississippian, rennsylvanian, and Permian age are present in the basin (see fig. 2), they were not included as part of this study. The rocks of Triassi" age (primarily the Chime Formation) were selected as the lower boundary for the study. The Cvtme Formation and its lateral equivalent, the Dolores Formation, were deposited in various contir^ntal and fluvial environments and consist of variegated claystone and shale, siltstone, sandstone, conglomerate, and limestone. After deposition of Triassic rocks, erosion over most of the basin resulted in a widespread unconformity between Triassic and Jurassic rocks.
The lowermost Jurassic rocks, the San Rafael Group (fig. 2), are sandstones from dune fields and limestones from marine waters. Uplift and volcanic activity to the southwest preceded deposition of the overlying Middle to Upper Jurassic Morrison Formation. The Morrison Forrration was deposited on a vast plain in a variety of fluvial and lacustrine environments. Much of the Morrison contains volcanic debris.
Again, erosion before deposition of the Cretaceous rocks resulted in an unconformity between the Dakota Sandstone and the Morrison Formation. The Cretaceous is characterized by numerous transgressions and regressions of the Late Cretaceous epicontinental sea, which deposited intertonguing sequences of shale and sandstone and lesser amounts of limestone and coal in marine, nearshore marine, beach, paludal, and fluvial environments. As the sea withdrew, the area was once again dominated by terrestrial sedimentation over a vast alluvial plain traversed by streams and dotted with swamps in which coal deposits subsequently formed.
During early Tertiary time, renewed tectonic activity accompanied by volcanism, referrec1 to as the Laramide Orogeny, shaped the structural basin. Deposition continued into late Miocene or early Pliocene time when broad, regional uplifting occurred and erosion removed large amounts of Tertiary and pre-Tertiary rocks. Erosion has continued, resulting in Quaternary depos; ts of unconsolidated alluvium, local eolian dunes, talus, and colluvium. A summary of geologic nomenclature and lithologic characteristics of regional units of this study is presented in table 1 (all tables are in the back of the report).

SOUTH NORTH
TERTIARY PALEO-CENE
EOCENE
UPPER
MESAVERDE GROUP MEN[FEE FomTION
_ _-5 HOSU roue ^ GIBSON COAL
C R E V A S S ECANYON ^ yiRATTO TONGUE
FORMATION
PERMIAN
PENNSYLVANIAN
MISSISSIPPIAN
DEVONIAN
SILURIANORDOVICIAN
CAMBRIAN
PRECAMBRIAN
SAN JOSE FORMATION
DAKOTA SANDSTONE (CNCINAl CANYON yEVBER, CUBfBO TONGUE, AND OAK CANTON
DE CHELLY SANDSTONEABO FORMATION CUTLER FORMATION
MADERA FORMATION HERMOSA FORMATION HERMOSA GROUP 'engird end yolheny. I95B
HONAKER TRAIL FORMATION
PARADOX FORMATIONPINKERTQN TRAIL FORMATION
GRANITIC AND HIGH RANK METAMORPHIC ROCKS
(Modified from Molenoor, 1977o,b, ond 1989)
Figure 2.--Time- and rock-stratigraphic framework and nomenclature, lines indicate a hiatus in the sequence of beds.
Ruled

STRUCTURAL FEATURES AND FAULTING
The structural evolution of the San Juan structural basin is complex. Tectonism began as early as late Paleozoic time. The present basin formed mainly during the Laramide Orogeny (Late Cretaceous-early Tertiary time), although some downwarping and local uplifting along basin margins probably recurred during middle Tertiary and possibly late Tertiary time (Kelley, 1951, p. 130).
Structural boundaries of the basin generally are well defined, but in some areas, the basin merges gradually into adjacent depressions or uplifts (Kelley, 1951, p. 124). Four major structural elements may be delineated in the structural basin: large, elongate, domal uplifts; low, marginal structural platforms; abrupt monoclines; and the central basin (fig. 3) as defined by Kelley (951, p. 126). Subsurface structural relief within the basin varies: about 2,500 ft along the Chaco Slope; 3,000 ft in the central basin; and 4,000 ft along the Hogback Monocline at the Four Corners Platform. With respect to the Nacimiento Uplift and San Juan uplift, the structural relief within the basin is 14,000 ft and 20,000 ft, respectively (Kelley, 1957).
Faulting, as mapped on the l:500,000-scale State geologic map, is shown in figure 3. The faulting is associated with some of the areas of major uplift San Juan Uplift, Nacimiento Uplift, and Zuni uplift and the Puerco Fault Zone at the western edge of the Rio Grande Rift.
In general, the faults are high-angle, northeast-trending faults of small displacement. An exception is the area of the Nacimiento Uplift, an area of complex faulting, resulting in thrust- faulted areas, tilted fault blocks, grabens, and high-angle faults trending west, northwest, and northeast (Woodward and others, 1972). In the Puerco Fault Zone displacement along mdivAdual faults is in the range of several tens to a few hundred feet; Cenozoic activity resulting in the Rio Grande Rift, however, has also resulted in northeast-trending normal faults having structural relief of as much as 3,000 ft, downdropped to the east. Faulting in the Chaco Slope seems to be assocated with several small, plunging anticlines and elliptical oomes that have created high-angle faults ranging in strike from north to east. Fault orientation and displacement in the Crownpoint-Grants, New Mexico, area (also known as the Grants Uranium Belt) are more disheveled than elsewhere, often leading to some localized structure as in the area just south of Crownpoint. Faulting in the Zuni Uplift is generally high angle with displacement from a few feet to as much as 1,000 ft.
HYDROLOGIC SETTING AND PROPERTIES OF THE REGIONALAQUIFERS
In the San Juan structural basin, the terms "aquifer" and "confining bed" have been associated, for the most part, with the formal name of a geologic unit (formation, member, or tongue) that forms a significant part of the aquifer or confining bed. It is recognized that the aquifers and confining beds are not necessarily restricted to one geologic unit but may include all or parts of several
Geologic units; however, data on relative permeabilities were inadequate for more precise elineation of aquifers and confining units. Figure 4 shows the relation of geologic units to regional
hydrogeologic units and model layers.
The distinction between aquifer and confining bed can also be one of perspective. In nany cases, units that are considered confining beds on a regional scale can, and do, yield small quantities of water to wells from localized lenticular sandstones. These wells often supply water for stock use and represent a significant percentage of the total number of water wells in the basin. From a regional perspective, however, these units are considered to be confining beds in the evaluation of ground-water resources and the development of a three-dimensional, steady-state ground-water flow model. For example, the Menefee aquifer is considered to be an aquifer on a local scale a nd a confining bed on a regional scale because water is found in localized, discontinuous lenticular sandstones.

109 108 107'
37
36
35
BOUNDARY OF STUDY AREA
Culture National Historical Park
EXPLANATION
MONOCLINE FAULT
(Structure modified from Kelley, 1951; faults modified from Dane and Bachman, 1965; and Tweto, 1979)
Figure 3.--Structural elements of the San Juan structural basin and adjacent areas.
GEOLOGIC UNITS REGIONAL HYDROGEOLOGIC UNITSMODEL LAYER
Chuska Formation
San Jose Formation
Animas and Nacimiento Formations
Ojo Alamo Sandstone
Kirtland Shale
Fruitland Formation
Pictured Cliffs Sandstone
;;Le;w]s|h^Cliff House Sandstone and La Ventana Tongue
Merief ̂ e J^r^^ltpfi t \ ^.llll ̂ M-^Sd^:^ li ̂ ' : l '? ; " ;:
Point Lookout Sandstone
Hosta Tongue Jili;I11flill;lll?;fiI
Crevasse Canyon Formation yKSSiM^iiS^lm^&imm:m>KmmimM:̂ ,
' fl^ry^r^^^^'^^ViA|J Jj>?f lyl'Ol:;l;VVW::;.O* l^TW. :i.::>.;, l-;:::.. l :'v'::v:\^:;;' l :;>:::: l r:'/-' l-i:i'i-:.: 1 : ^-'1^ '-;; , :.;,v: -^'i. >./:. v;i,,: ;:,- i: :'v
/5 '!i ; : ; i.r¥ : : :-:. : . KK* :i;::;' i-. >-, * * ;, : : : :;' ? : '! t - ; ;
Gallup Sandstone J||g|l||i|||PI||sil||i^|iii|;:'- . . . :.-:. . .. : , '::"- ;<: i '.^ ,....; ..; -,: ; :,;;:, sii, i::!:::.:*';!;.!;-..:.;:^;^.;!;':"..;:!*'^ 1 ;.;"..::..;;^..!:;:..;..?. :. ; l : : .. ; :".:i;: ; ; :. :-" :- ,-.- - : ..
, LO^r:^^||iS;;f||||;:::i:::: ,::; :i:::? ^
Dakota Sandstone
Morrison Formation; fa.' ..:;'-;'-: ''.:^- i.^.:^i':f:S:^'t?:^!f i3^X:Sf f ̂V^ ;.'; 'i: ! ;
' 'WafiaKa''n r?0^iryt^;t:i|3:l^; !:;?;::i; : 'i:i:;;;>;'ivi':';: :: ;: ' : :s :i; : -; : '.:::'.i;:': : ; :!vi;(:; i"; 5 );; 1 : i :*; ;:| v: ; : U '*'' ? : : ; ;: < v 1 :-."
Entrada Sandstone
::Chirtte:Fbrrnaliort:::::;::::-::;::.:::::.:::::-:::::.:::::- : ::::
Chuska aquifer
San Jose aquifer
Animas and Nacimiento aquifers
Ojo Alamo aquifer
Kirtland aquifer
Fruitland aquifer
Pictured Cliffs aquifer
Lewis confining unit
Cliff House aquifer
Menefee confining unit
Point Lookout aquifer
Upper Mancos confining unit
Gallup aquifer
Lower Mancos confining unit
Dakota aquifer
Morrison aquifer
Wanakah confining unit
Entrada aquifer
Chinle confining unit
1
2.
c
'£
6
7
f
VK
c
VK
1C
11
VK
12
EXPLANATION
CH AQUIFER
I_I CONFINING UNIT
E3 NOT SIMULATED
VK-lmplicitly simulated using a computed vertical harmonic leakance
Figure 4.-Relation of geologic units to regional hydrogeologic units and model layers.
10

In a simplified conceptual model of the ground-water flow system in the San Juan structural basin, water enters the ground-water flow system from precipitation on outcrops and from stream- channel loss as streams cross the outcrop. Recharge from direct precipitation occurs only after near- surface demands for moisture are met by the water that does not run off and a residual amount of water reaches the zone of saturation. These near-surface demands include evaporation, sublimation, and transpiration.
Once water is in the ground-water flow system it moves downgradient to areas of natural or human-induced discharge in accordance with Darcy's law (Darcy, 1856). Areas of natural discharge include springs and seeps in topographically low parts of the outcrop, discharge from the outcroj) to stream channels, and upward movement across less permeable beds to the surface along fault planes, fractures, and, less commonly, along dikes. Examples of spring discharge along fault planes and fractures are at the southern end of the Nacimiento Uplift in the southeastern part of the study area (fig. 3).
Another important method of natural discharge is water moving from one aquifer, across a less permeable unit, to another aquifer that has lower hydraulic head. Water also mignt move across a less permeable unit directly to land surface where it would contribute to soil moisture and hence to evaporation or transpiration.
Human-induced discharge occurs at flowing or pumped wells or in conjunction with open-pit or subsurface mining operations. Free-flowing wells are commonplace in the basin and most of them are completed in multiple aquifers; the percentage of water contributed by each aquifer is unknown. Pumped wells or controlled flowing wells also are common and supply water for municipal, small-community, private-domestic, and livestock needs. The majority or these wells are windmill powered and result in small yields, but some are capable of yielding large quantities ofwater. Mine-dewatering operations have been a major source of ground-water discharge in tlx south-central part of the basin. Some mines required the removal of as much as 3 ft3 /s of grourd water to keep the mine from flooding. All of the mines presently are closed, dewatering has ceasei, and ground-water levels are now recovering from reductions in head that commonly exceeded 1,000 ft.
Complexities in the flow system arise because of nonuniformity in the aquifers. The aquifers may thin or pinch out, or the composition and hydraulic properties may vary in space. Aquifers alf o may have preferred directions of ground-water flow that are controlled by trie orientation of fracture systems or by a persistent orientation of the aquifer's matrix of sedimentary materials. Other por^- folling liquids or gasses may be present, creating barriers to the movement of water, or water in parts of an aquifer may be saline enough to create a density barrier to movement of freshwater. All of these conditions are present to some degree in the San Juan structural basin.
Evaluation of the ground-water flow system in the basin is hampered by the inadequate areal distribution of water wells across the basin. In most of the aquifers, the wells are concentrated on or near the outcrop because sufficient water for most uses is obtained from the shallowest source available. Thus nydrologic data available for the aquifers in the interior of the basin are restricted to data for oil- or gas-test holes. Another problem in evaluating hydrologic data is that many wells are completed in more than one aquifer. Wells are drilled to a depth sufficient to provide the required amount of water with perforations in any interval that will produce water. Thus, a measured wat?r level or specific capacity and water-quality sample represent a composite from multiple aquifers and cannot be used in the analysis of flow systems in the basin. In analyzing data it was necessary to examine the well records to select only those wells that represented single-aquifer completions.
11

The ground-water flow system has been altered in parts of the basin because it has be^n a major source for energy fuels oil, gas, uranium, and coal. The exploration and production of these resources have had a significant effect on ground-water development since the 1950's. To date, more than 26,000 oil- or gas-test holes have been drilled in the basin, the majority penetrating no deeper than the bottom of Cretaceous rocks. This activity has resulted in production of significant amounts of water as a by-product. The water produced is disposed of in one of several ways: (1) reinjection into producing zones to repressure the zone; (2) reinjection into zones for disposal; and (3) evaporation in surface pits. In the late 1980's and early 1990's, the production of coal-bed methane from the Fruitland aquifer in the central basin was the major energy-related activity. Considerable volumes of ground water were produced in conjunction with natural gas, which has resulted in the need for additional disposal wells in the area.
Although the uranium era in the basin began in the late 1940's, its effect on ground-water resources peaked in the late 1970's when most production was from underground mines ir the Grants Uranium Belt. Production in the area was primarily from the Morrison aquifer and secondary production was from a localized aquifer within the Wanakah confining unit (the permeable Todilto Limestone Member of the Wanakah Formation), and from the Dakota aquifer. With ore being mined from depths as much as 3,000 to 4,000 ft below land surface, large quantities of ground water were pumped to dewater the producing units. Most of the water was frorr the Morrison aquifer ana overlying Dakota aquifer. By 1992 all active underground mines had ceased operation. Dewatering was not the only activity to affect ground-water resources. Exploratory drilling for uranium-resources evaluation in the northwestern part of the study area resulted in many of the test holes being completed as water wells. These wells tap the Morrison aquifer and in some instances underlying units. Most of these wells have sufficient head to flow at land surface. Many of these wells are allowed to flow constantly, resulting in a lowering of the pressure head in the Morrison aquifer in this area.
The mining of commercial coal resources in Upper Cretaceous rocks in the San Juan struc'ural basin has had a localized effect on ground-water resources. In the immediate area of the strip mines, ground-water flow in the host rocks has been interrupted where strip mines have intercepted the water table, causing ground water to enter the pits.
Data on hydrologic properties of the regional aquifers are minimal. Because most water for the majority of the aquifers is used for stock or domestic purposes, very little data have been collected to determine transmissivity, storage coefficient, or hydraulic conductivity of the aquifers. The distribution of transmissivity, storage-coefficient, and hydraulic-conductivity data is localized throughout the basin. Most or these data were collected to analyze the effects of uranium production on the Morrison, Dakota, and Gallup aquifers. As a result, data are concentrated in areas where mines in these aquifers were proposed. Transmissivity and storage-coefficient data are shown on maps for the Morrison aouifer (Dam and others, 1990a), Gallup aquifer (Kernodle and others, 1989), ana Ojo Alamo aquifer (Thorn and others, 1990b). The extent to which transmissivity or storage- coefficient data can be transferred to other parts of the basin is unknown, but the range in values indicates a lack of uniformity throughout the basin.
Transmissivity values for aquifers in the San Juan structural basin vary by several orders of magnitude as a result of the wide variation in hydrogeologic conditions. Conditions that most r ffect transmissivity are the percentage of sand and its degree of sorting within each aquifer and the aquifer thickness. The areal distribution of measurea or reported transmissivity values in each aquifer is generally restricted to the shallow areas of the aquifers near the outcrop where well 0 are located. Exceptions are wells in the Morrison, Dakota, and Gallup aquifers used for mine dewatering.
12

Transmissivity values for 108 drawdown and recovery tests (62 for the Morrison, Dakota, ard Gallup aquifers) are presented in table 2. The range in transmissivity for all aquifers is 0.001 to 2,000 fr/d, and median values for all aquifers range from 0.01 to 140 fr/d. An example of how transmissivity can change with depth is shown by data for the Ojo Alamo aquifer. Three tests we^-e conducted on two wells more than 4,000 ft deep near the center of the basin, resulting in calculated transmissivity values ranging from 0.05 to 0.59 fr/d. In contrast, transmissivities for nine tests conducted on water wells near the outcrop of the Ojo Alamo ranged from 57 to 245 fr/d. The range in transmissivity is probably representative of the changes that can be expected with depth in trie individual aquifers in the basin.
Minimal data for storage coefficients in the study area are primarily for wells in the Morrison, Dakota, and Gallup aquifers. Values of storage coefficient for 15 tests range from 0.00001 to 0.0002. Most of these values are at the low end of the range for confined aquifers (0.00001 to 0.001) given by Lohman (1972, p. 8).
The values of hydraulic conductivity shown in table 2 (except for the Morrison aquifer) represent average values calculated for an unknown number of oil and gas wells in the deeper parts of the basin (Reneau and Harris, 1957, p. 43). Data for the Morrison aquifer were obtained from tests on three wells. The values of hydraulic conductivity are near the lower end of the range for sandstone (0.000134 to 1.34 ft/day) given by Freeze and Cherry (1979, p. 29).
Table 2 also contains discharge data for 504 wells and specific-capacity data for 162 welJs. Most of these values are reported and represent discharges measured by bailing or pumping for short periods of time. For discharge data obtained for windmill-powered wells, the discharge value may be limited by the capacity of the piston pump and may not reflect a discharge that the aquifer is capable of yielding. The specific capacity or the well is probably a better indicator of the potential aquifer yield because drawdown is used! in the calculation. Thus the specific capacity determined for two windmill-powered wells that have approximately the same discharge will be different because of the difference in drawdown. Maps showing well locations and discharge and specifi"- capacity data for selected aquifers are presented in the HA-720 series reports.
The San Juan structural basin, as defined for this investigation, is a virtually self-contained ground-water flow system whose boundaries generally are clearly defined. A ground-water flow boundary is any physical feature or mechanism that alters the movement of water in the ground- water flow system or is a sink or source of water to the system. These boundaries may be internal or limiting geologic features, surface sources or sinks, or contrasts in the properties of the pore-fillip^ liquids.
Examples of geologic boundaries are faults, dikes, changes in hydraulic properties, and
geometry of the hydrostratigraphic units. The boundaries may define the limits of the flow system ut, more generally, are internal to the system and redirect ground-water movement. Faults (fig. 3)
may act as a flow barrier by partly or completely offsetting aquifers and confining units. Faultir g also can cause fractures in nearby friable rocks, which, in turn, usually lead to a local increase in permeability and porosity. At depth, these faults may be a barrier to horizontal ground-water flow but, because of their limited extent, probably are not significant on a regional scale. Hydraulic contrasts between aquifers and confining units and an aquifer system's internal geometry also influence ground-water flow.
Outcrop area boundaries include aquifer interaction with surface-water bodies or associated alluvial deposits, recharge infiltrating from precipitation, and evapotranspiration. Surface-water interaction at the outcrop may be eitner a source of water to the aquifer or a discharge from it, depending on the relative hydraulic-head difference. Streams, lakes, and reservoirs are surface- water bodies that directly influence an aquifer in its outcrop area. Surface-water bodies may either gain water from or lose water to the aquifer. Generally, in the higher altitude parts of the basin (more than 7,500 feet above sea level) streams lose water to aquifers and in the lower altitude par'is streams gain water. In either losing or gaining situations, the quantities of water relative to surface flow usually are too small to detect locally.
13

Recharge from precipitation is a boundary type that contributes water to the acjuifer system. This distributed recharge on the area of aquifer outcrop is the residual from total precipitation after losses to evapotranspiration and surface runoff. Evapotranspiration is a boundary in the grc\md- water system where water in the zone of saturation is affected by surface processes. Evapotranspiration generally occurs in areas of ground-water discharge, primarily in the valleys of the gaining streams described previously. Evapotranspiration of ground water is assumed to be zero in areas where depth to water is more than several tens of feet.
The presence of oil or gas in a part of the ground-water flow system indicates a stagnant area of ground water. There are two mechanisms of oil and gas entrapment and one additional mechanism of gas entrapment. Oil and gas may be concentrated by structural or stratigraphic traps. In both of these types of traps, the presence of oil precludes the flow of freshwater. However, structural traps usually are small in area and stratigraphic traps usually are in low-permeability units that are very resistant to any form of fluid flow. A structural trap may affect several aquifcrs in the stratigraphic section, whereas a stratigraphic trap is areally restricted to one unit or horizor.
Gas may be dissolved in water (the third mechanism). In additioivgas will adsorb and absorb on coal, particularly along cleats and microfractures (Fassett, 1989). The presence of gas of this nature is characteristic of coal beds in the Fruitland aquifer. In this instance, the presence of gas does not necessarily preclude the movement of water, but other evidence, primarily water-quality data (Dam and others, 1990b; Kernodle and others, 1990), suggests that water in the Fruitland acjuiftr and underlying Pictured Cliffs aquifer is dissimilar to water in overlying and underlying units (Thorn and others, 1990a,b) and may at least be partially hydraulically isolated from them.
Fluid density contrasts, if great enough, can be a barrier to ground-water flow. Density is a function of the quantity of dissolved chemicals in the water and, to a much lesser degree, cf the temperature of the water. The highest reported density of water from a post-Triassic aquifer in the basin is 1.20 grams per cubic centimeter at 20 °C (Dwight's ENERGYDATA, Inc.1 BREST data base, Oklahoma City, Oklahoma). This water is from a well completed in the Morrison aquifer ne« r the confluence of the La Plata River with the San Juan River, northwest of Farmington, New Mexico. The reported dissolved-solids concentration of the water was 286,900 milligrams per liter (me/L), or more than eight times that of sea water (Chow, 1964). All other nearby wells completea in the Morrison aquifer, the nearest of which is about 3 mi away, have a reported density of 1.06 grarrs per cubic centimeter or less, indicating that the anomaly is very localized within the Morrison aquifer.
If the local density gradient is high enough, water of this density will affect the movement of water within the ground-water flow system (Davies, 1989). It is doubtful that geochemical differences in host rock/water interactions over so short a distance as observed here created the sharp density gradients that exist today in the same general area for several different aquifers. Therefore, it is reasonable to assume that conditions of long-term flow stagnation led to the observed density anomalies.
In the simplest conceptual model based on the previously discussed boundaries, movement of water is from areas of recharge (outcrops) downdip to areas of discharge in response to differences in the altitude of the potentiometric surface. Recharge to the aquifers is from infiltration of precipitation and streamflow on outcrops. In the San Juan structural basin three discharge areas to stream or river reaches generally are recognized: (1) the lower reach of the San Juan River, (2) the Puerco River drainage in the southwestern part of the study area, and (3) parts of the Rio Puerco and Rio San Jose in the southeastern part of the study area. Subsurface discharge from the basin probably occurs in two areas; however, the magnitude is small. One area of discharge is the Four Corners area across the Four Corners Platform, and the other is along the southeastern part cf the study area into the Rio Grande Rift. In addition to the horizontal component of flow there is a vertical component between some aquifers. The magnitude of this vertical component is discussed in much greater detail by Kernodle (in press).
1 Use of trade names in this report is for identification purposes only and does not constitute endorsement by the U.S. Geological Survey.
14

As previously discussed, the regional ground-water flow system includes many aquifers that can be, in most cases, equated to the geologic units that have been mapped in the basin. There geologic units were previously discussed in the text and are listed in table 1.
The regional flow system for each aquifer has certain unique characteristics, but also follows a pattern similar for all aquifers throughout the basin. Ground water occurs under both water-table and artesian conditions: in most cases under water-table conditions in the outcrop areas and under confined conditions as the unit dips toward the center of the basin and is overlain oy younger rocks. Data are not sufficient to determine the transition zone from water-table to confined conditions for each of these aquifers; in fact, this zone is not distinct in some of the units. For example, the Menefee aquifer is, for the most part, composed of the Menefee Formation, a silty shale as much as 2,000 ft thick. Locally, it contains significant water-yielding sandstone lenses throughout its thickness These sandstone lenses are not hydraulically interconnected and, because they are encased in silty shale having a much lower hydraulic conductivity, are often confined. Pumping for extender periods of time, however, will dewater the sandstone lenses, converting them to unconfirmed aquifers. Although the Menefee aquifer has been extensively developed as a source of stock wells, it is considered both an aquifer and a confining layer in the model simulation (Kernodle, in press).
A potentiometric-surface map was prepared for each of the aquifers presented in the HA-720 series reports. The paucity and limited area! distribution of data placed severe constraints on the analysis of flow systems in the aquifers. The areal distribution of data for each aquifer is around the periphery of the basin near the outcrop area and is inadequate for construction of potentipmetrc surface maps. As the depth to each aquifer increased toward the center of the basin, wells were completed in the next shallower aquifer that provided sufficient water. Therefore, data often were not available for the deeper parts of the basin. To try to supplement water-well data for these area*, drill-stem test data for oil- or gas-test holes were used where available. However, the purpose of a drill-stem test is to determine the potential for oil or gas production, not to determine the potentiometric surface of water; therefore, the best water-producing zones commonly are bypassed and hydrologic data are for less permeable zones. These data generally are all that are available for aquifers in the deeper parts of the basin.
Another constraint is that data have been collected over a period of many years and do not represent any one time period. For several of the aquifers, water use has been minimal (stock and domestic use) and no declines have been detected. For the Morrison, Dakota, and Gallup aquifers, however, significant quantities of ground water have been withdrawn for uranium exploration and development. Some parts of the basin, particularly the south-central area, had declines of several hundred feet during the early to mid-1980's. Hydrographs for several wells in these units and the general trend in ground-water levels are shown in figure 5. As withdrawals decreased in the late 1980's because of mine closures, water levels in some wells began to recover.
During this RASA study, more than 600 wells were field inventoried and water levels measured when possible. These data were used to supplement existing data in the compilation of the potentiometric-surface maps for the HA-720 series reports.
15

109 ' 108 107'
37
36
35
UTAH
Black Mesa Basin
BOUNDARY OF STUDY AREA
MORRISON AQUIFER B DAKOTA AQUIFER A GALLUP AQUIFER
10 20 30 40 50 60 MILES
0 10 20 30 40 50 60
___________I
KILOMETERS
Figure 5.--Locations of and hydrographs showing water-level fluctuations in selected wells in the Morrison, Dakota, and Gallup aquifers.
16

LI
(QcCD Ol
w'o o =J U M
- O D^-0) 0) 7T =J O Q-
=J OQ.(Q
C 0)
JD O
?<Q
o~<-> CD
WATER LEVEL, IN FEET BELOW LAND SURFACE
£ 8 K g 8
WATER LEVEL, IN FEET BELOW LAND SURFACE
§-I^ l\3 O CD O) o o 5 o o
ro
o- 00 7t _i CO^Jli o _,.
05o _00
O Oi 00(35 -
WATER LEVEL, IN FEET ABOVE SEA LEVEL
WATER LEVEL, IN FEET BELOW LAND SURFACE
WATER LEVEL, IN FEET ABOVE SEA LEVEL
WATER LEVEL, IN FEET BELOW LAND SURFACE
I§CD Q. C
O
WATER LEVEL, IN FEET ABOVE SEA LEVELWATER LEVEL, IN FEET ABOVE SEA LEVEL

WATER LEVEL, IN FEET BELOW LAND SURFACE81
WATER LEVEL, IN FEET BELOW LAND SURFACE
Tl co'c<BOl
- co'oo ^3 CO- o
B 0)
Q) J - V<
0) ^
§SQ-CQ
CDS
C CO TD y>
C vJ CD ~~ Q. C
CDo
Q.;5
oTS rr
WATER LEVEL, IN FEET ABOVE SEA LEVEL
WATER LEVEL, IN FEET BELOW LAND SURFACE
WATER LEVEL, IN FEET ABOVE SEA LEVEL
WATER LEVEL, IN FEET BELOW LAND SURFACE
"ro "-" "o ooo3 88
££? _
COo> -
oo -uCOOl
X
00
"S S S o> o> o>
WATER LEVEL, IN FEET ABOVE SEA LEVEL
8 CD tO <O <O o o 5 o
WATER LEVEL, IN FEET ABOVE SEA LEVEL

UJ
340
350
360
370
UJ
380
390
1 I
I I
1 1
6N
.10
W.1
8.1
33
B
353700107563901
WE
LL
9 J_
__
_I_
__
_I_
__
_I_
__
_I_
__
_I_
__
_I_
__
_I
6,58
4
UJ
6,57
4 < LL
J
6,56
4
6,55
4
6,54
4
6,53
4
440
450
460
I I
\ I
I I
I I
16
N.1
0W
.18
.13
3D
3
53
65
91
07
56
41
01
W
EL
L 1
0J_
__
_I_
__
_I_
__
_i_
___|_
___|_
___|_
___1
6,50
4
6,49
4
6,48
4 UJ
6,47
4 UJ
6,46
4
1980
1985
1990
1980
1985
1990
VO
260
270
280
290
-
300
31
0
320
6,81
0
16
N.1
1W
.17
.43
22
353645108011501
WE
LL
11
i i
i i
i i
6,75
0
UJ
460
480
500
UJ
520
14
N.1
0W
.35
.22
1
352418107513401
WE
LL
12
7,55
0
7,53
0
7,51
0
7,49
0
7,47
0
1956
1966
19
76
1986
1956
1966
1976
1986
Fig
ure
5.-
-Lo
catio
ns
of a
nd h
ydro
gra
phs
sho
win
g w
ate
r-le
vel flu
ctu
atio
ns
in s
ele
cted w
ells
in t
he
M
nrr
iso
n,
Hakn
ta,
and
Gallu
p a
quifers
Continued.

WATER LEVEL, IN FEET BELOW LAND SURFACE
8 fe § 8 8 S fe
acCD CJ1
co'O
O ^ 3 w oo 03 03
03 "
§3Cl-CQ
03 -a= zr c c/>
T3 w 03 ZT
WATER LEVEL, IN FEET ABOVE SEA LEVEL
WATER LEVEL, IN FEET BELOW LAND SURFACE
Og g?£LCD
Q_CD_
CD _HP-E
o
o3C/)5"
w cp_CD
£CDa.
en -*J -
WATER LEVEL, IN FEET ABOVE SEA LEVEL

GROUND-WATER CHEMISTRY
The descriptions of water-quality data for water wells and springs are based on 1,135 analyses from the U.S. Geological Survey's computerized National Water Information System (NWIS) data base. Data for 128 oil- and gas-test holes, from Dwight's ENERGYDATA, Inc. BRIN data base, are also presented. Well records were checked to assure, to the extent possible, that a particular sample represents water from only one hydrogeologic unit and not a mixture of water from more than one hydrogeologic unit. Analyses that did not balance electrochemically within 5 percent were deleted from the data base. For wells that had multiple analyses, the most recent analysis was selected.
Most water-quality data were collected in the areas of outcrop. Few data are available for the deeper, more central parts of the basin. Data plotted on the water-analysis diagrams represent chemical signatures of water in the vicinity of outcrops, near areas of recharge. Data for oil- and gas- test holes represent the water chemistry of hydrogeologic units in the deeper parts of the basin. C'l and gas companies used different analytical procedures than those used by the U.S. Geological Survey to obtain concentrations of the various constituents. Therefore, data for the test holes are not plotted on the water-analysis diagrams but are presented in a table to illustrate water chemistry in the deeper parts of the basin. The oil- and gas-test hole data are not referenced to any drinking- water standards as are the data from the U.S. Geological Survey's NWIS data base.
Maximum contaminant levels (MCL's) and secondary maximum contaminant levels (SMCL's) are listed in table 3. Maximum contaminant level is the federally enforceable maximum level of a contaminant in public drinking water at which there are no known, anticipated, or adverse effects on the health of persons and that allows an adequate margin of safety (U.S. Environmental Protection Agency, 1986a, p. 528). Secondary maximum contaminant level is the maximum permissible level of a contaminant in water intended for public water-supply systems; the SMCL's are not federally enforceable but are intended as guidelines for the States (U.S. Environmental Protection Agency, 1986b, p. 590). The percentages of samples above the MCL's and SMCl/s for pertinent constituents are shown in tables 4-8.
The chemistry of water in water wells and springs from selected hydrogeologic units is displayed on water-analysis diagrams. In the following sections reference is made to naming a water type characteristic of a particular geologic unit. This was achieved by seeing how many analyses plot into a particular field shown in the two larger triangles in figure 6. For example, if most or the analyses plot in the calcium portion of the cation triangle and the bicarbonate portion of the anion triangle tnen the water would be a calcium, bicarbonate type.
Quality of Water from Hydrogeologic Units in Rocks of Tertiary Age
Tertiary geologic units in the San Juan structural basin represent a sequence of sedimentary rocks of nonmarine origin including fluvial, eolian, and lacustrine deposits. Lithology of the Tertiary geologic units and associated aquifers predominantly consists of sandstones, siltstones, shale, tuffaceous sandstones, and volcaniclastic deposits of varying proportions. On a regional scale the San Jose, Nacimiento, and Animas aquifers are hydraulically connected and serve as one of tl'e primary water-yielding units of the San Juan structural basin (Levings and others, 1990b). Another important water-yielding unit of Tertiary age is the Ojo Alamo aquifer. The HA of Levings ard others (1990b) contains maps displaying the distribution of temperature, sulfate, fluoride, dissolved solids, and chemical constituent diagrams of water from the combined San Jose, Nacimiento, ard Animas aquifers. A discussion of temperature, dissolved solids, and chemical constituent diagrams of water from the Ojo Alamo aquifer can be found in Thorn and others (1990b).
21

Magnesium type
No dominant
Nodominant
typeBicarbonate \ / Chloride
type \ / type
« ... / SodiumCalcium \ / type
type \ / or potassium type
Ca
CATIONS
CHEMICAL CONSTITUENTS
SO4 - SulfateCOa+HCOa' Carbonate + bicarbonateCl - ChlorideCa - CalciumMg - MagnesiumNa+K - Sodium + potassium
Figure 6.-Water-analysis diagram showing fields of dominant water types, in percent of total equivalents per million (from Back, 1966).
22

The primary water type of hydrogeologic units in rocks of Tertiary age is a sodium, bicarbonate, sulfate type (fig. 7; table 4). Some differences are evident among some of the individual units. The dominant anions for all units are sulfate and bicarbonate of almost equal proportiors. Only one sample from the Nacimiento aquifer (fig. 7B) indicates chloride as the dominant anion. Sodium is the dominant cation. The sodium, chloride type water might represent leakage of oil-fieM brine water from deeper geologic units that have oil and gas accumulations. Dissolution and solution of the more soluble mineral phases contained within the aquifer matrix could account for the resultant water chemistry. Uranium mineralization is present in the Ojo Alamo aquifer (Finch and McLemore, 1989) and could influence the water chemistry associated with some hydrogeologic units in rocks of Tertiary age.
Quality of Water from Hydrogeologic Units in Rocks of Cretaceous Age
Cretaceous geologic units in the San Juan structural basin represent repeated transgressive ard regressive marine shore-zone environments and, to a smaller extent, nonmarine environments. IT e dominant lithology consists of sandstones, siltstones, shales, and conglomerates. Many Cretaceous units are important producers of natural resources. For example, commercial coal deposits are concentrated in the lower part of the Fruitland and Menefee Formations and sections of the Crevasse Canyon Formation (Fassett, 1989). Large accumulations of coal-bed methane are concentrated in the Fruitland Formation. Oil and gas are concentrated in the Pictured Cliffs Sandstone, Menefee Formation, Point Lookout and Gallup Sandstones, Mancos Shale, and Dakota Sandstone (Matheny and Ulrich, 1983, p. 820-825). Uranium is concentrated in the Fruitland and Menefee Formations ard the Dakota Sandstone (Finch and McLemore, 1989, p. 29). For further discussion and maps displaying the distribution of selected water-quality constituents in water from aquifers in rocks of Cretaceous age the reader is referred to Kernodle and others (1990) for the Kirtland Shale ard Fruitland Formation, Dam and others (1990b) for the Pictured Cliffs Sandstone, Thorn and others (1990a) for the Cliff House Sandstone, Levings and others (1990a) for the Menefee Formation, Craigg and others (1990) for the Point Lookout Sandstone, Kernodle and others (1989) for the Gallup Sandstone, and Craigg and others (1989) for the Dakota Sandstone.
Water-quality constituents in water from hydrogeologic units in rocks of Cretaceous age are listed in tables 5 and 6, and water-analysis diagrams are displayed in figure 8. Changes in water type are evident from the uppermost to the lowermost unit. Sodium is the dominant cation in water from all aquifers in rocks or Cretaceous age displayed in figure 8. Calcium is present in water from the Pictured Cliffs and Cliff House aquifers, Menefee confining unit, and Gallup aquifer. Chloride is the dominant anion in water from the Kirtland aquifer; chloride and bicarbonate are the dominant anions in water from the Fruitland and Pictured Cliffs aquifers. Anions of bicarbonate and sulfate are dominant in water from the Cliff House aquifer, Menefee confining unit, and the Point Lookout, Gallup, and Dakota aquifers. The water types displayed in figure 8 are sodium, chloride type (Kirtland aquifer); sodium, chloride, bicarbonate type (Fruitland and Pictured Cliffs aquifers); sodium, sulfate, bicarbonate type (Cliff House aquifer, Menefee confining unit, and the Point Lookout and Gallup aquifers); and sodium, sulfate type (Dakota aquifer).
The largest contributor to the water chemistry of hydrogeologic units in rocks of Cretaceous age within the San Juan structural basin is brine waters associated with oil and gas accumulatior s. The high concentrations of sodium and chloride shown in table 6 for some of the units are characteristic of brine waters associated with oil and gas production. Vertical leakage between units would allow these brine waters to be introduced into units that have no significant oil and gas accumulation. Some high chloride concentrations in ground water could also result from dissolution of chloride minerals associated with marine deposits. Waters that indicate the presence of calcium, for example the Pictured Cliffs aquifer (fig. 8CJ, could be explained by exchange of calcium ions in shale units for sodium ions in ground water.
23

A. SAN JOSE AQUIFER
B. NACIMIENTO AQUIFERCHEMICAL CONSTITUENTS
SO4 - SulfateCO3+HCO, - Carbonate + bicarbonateCl - ChlorideCa - CalciumMg - MagnesiumNa+K - Sodium + potassium
Figure 7.-Water-analysis diagrams for selected hydrogeologic units in rocks of Tertiary age: A. San Jose aquifer, B. Nacimiento aquifer, C. Animas aquifer, and D. Ojo Alamo aquifer.
24

C. ANIMAS AQUIFER
D. OJO ALAMO AQUIFERCHEMICAL CONSTITUENTS
SO4 - SulfateCO3+HCO? - Carbonate + bicarbonateCl - ChlorideCa - CalciumMg - MagnesiumNa+K - Sodium + potassium
Figure /.--Water-analysis diagrams for selected hydrogeologic units in rocks of Tertiary age: A. San Jose aquifer, B. Nacimiento aquifer, C. Animas aquifer, and D. Ojo Alamo aquifer-Concluded.
25

A. KIRTLAND AQUIFER
Cl
ANIONS
B. FRUITLAND AQUIFERCHEMICAL CONSTITUENTS
SO4 - SulfateCO3+HCO3 - Carbonate + bicarbonateCl - ChlorideCa - CalciumMg - MagnesiumNa+K - Sodium + potassium
ci-
ANIONS
Figure 8.--Water-analysis diagrams for selected hydrogeologic units in rocks of Cretaceous age: A. Kirtland aquifer, B. Fruitland aquifer, C. Pictured Cliffs aquifer, D. Cliff House aquifer, E. Menefee confining unit, F. Point Lookout aquifer, G. Gallup aquifer, and H. Dakota aquifer.
26

C. PICTURED CLIFFS AQUIFER
D. CLIFF HOUSE AQUIFER
CHEMICAL CONSTITUENTS
SO 4 - SulfateCO3+HCO3 - Carbonate + bicarbonate Cl - Chloride
? Ca - Calcium % Mg - Magnesium
Na+K - Sodium + potassium
Figure 8.--Water-analysis diagrams for selected hydrogeologic units in rocks of Cretaceous age: A. Kirtland aquifer, B. Fruitland aquifer, C. Pictured Cliffs aquifer, D. Cliff House aquifer, E. Menefee confining unit, F. Point Lookout aquifer, G. Gallup aquifer, and H. Dakota aquifer-Continued.
27

E. MENEFEE CONFINING UNIT
Cl
ANIONS
F. POINT LOOKOUT AQUIFER
CHEMICAL CONSTITUENTS
SO4 - SulfateCO3 +HCO 3 - Carbonate + bicarbonateCl - ChlorideCa - CalciumMg - MagnesiumNa+K - Sodium + potassium
Figure 8. Water-analysis diagrams for selected hydrogeologic units in rocks of Cretaceous age: A. Kirtland aquifer, B. Fruitland aquifer, C. Pictured Cliffs aquifer, D. Cliff House aquifer, E. Menefee confining unit, F. Point Lookout aquifer, G. Galiup aquifer, and H. Dakota aquifer-Continued.
28

G. GALLUP AQUIFER
H. DAKOTA AQUIFER
CHEMICAL CONSTITUENTS
4 - Sulfate* t/ \* * bu< - Sulfate / ., / \ \ CO3+HCO3 - Carbonate + bicarbonate*/ X* o Cl - Chloride
7 x* Ca - CalciumMg - MagnesiumNa+K - Sodium + potassium
Ca
CATIONS
Figure 8.-Water-analysis diagrams for selected hydrogeologic units in rocks of Cretaceous age: A. Kirtland aquifer, B. Fruitland aquifer, C. Pictured Cliffs aquifer, D. Cliff House aquifer, E. Menefee confining unit, F. Point Lookout aquifer, G. Gallup aquifer, and H. Dakota aquifer-Concluded.
29

Quality of Water from Hydrogeologic Units in Rocks of Jurassic Age
Jurassic geologic units in the San Juan structural basin are of nonmarine origin and represent stream channels, flood plains, lakes, and eolian and sabkha environments. Dominant lithology is quartzose and arkosic sandstones, siltstones, claystones, limestones, and evaporites. Uranium mineralization is found in the Morrison Formation; Brushy Basin, Westwater Canyon, Recapture, and Salt Wash Members of the Morrison Formation; and the Todilto Limestone Member of the Wanakah Formation; the greatest production comes from the Westwater Canyon Member (Finch and McLemore, 1989, p. 29). The Entrada Sandstone is a host rock for small amounts of oil accumulation (Matheny and Ulrich, 1983, p. 820-825).
The chemistry of water from hydrogeologic units of the Jurassic geologic units is showr in tables 6 and 7, and selected units are displayed in figure 9. The dominant cation for all units shown in figure 9 is sodium and the dominant anions are bicarbonate and sulfate; the water type car be described as a sodium, bicarbonate, sulfate type. The presence of chloride in some Jurassic units may be due to dissolution of evaporite minerals common to some of the units. Uranium mineralization found in many of the units could also be a major contributor to the concentrations of trace elements.
Quality of Water from Hydrogeologic Units in Rocks of Triassic Age
Triassic geologic units of the San Juan structural basin were deposited in nonmarine environments such as stream channels, flood plains, and eolian and lacustrine settings. Dominant lithology consists of siltstones, shales, sandstones, and limestones. Small amounts of uranium mineralization are present in the Chinle Formation (Finch and McLemore, 1989).
The chemistry of water from the Chinle confining unit is displayed in table 8 and figure 10. Sodium is the dominant cation; some analyses indicate that calcium is also present (fig. TO). No anions are dominant in water from the Triassic units. The dissolution and solution of soluble minerals coupled with the effects of uranium mineralization are likely the leading contributors to the water chemistry within the Triassic units.
GEOCHEMISTRY OF THREE SANDSTONE AQUIFERSDuring the project, detailed geochemical analysis was undertaken to examine the source of
solutes and hydrologic controls that affect the concentration and distribution of solutes in three sandstone aquifers in the northwestern part of the basin (Dam, 1995). The Gallup, Dakota, end Morrison aquifers, which are stratigraphically equivalent to the Gallup Sandstone, Dakota Sandstone, and Morrison Formations, were chosen for detailed geochemical analysis. The focuf of Dam's report is on the Morrison aquifer; data for the Gallup and Dakota aquifers are provided for comparison and examination of vertical changes in flow ana quality. Hydrologic and water-quality data for the underlying Entrada aquifer also are evaluated for the effects that water from this unit may have had on the Morrison aquifer. These aquifers were selected because of available single- completion water wells with known completion data, ground-water modeling results, mineralogiral analyses, and minimal disturbances to the natural ground-water system as experienced in other parts of the basin. These aquifers are used extensively as a water supply for industry, communities, and livestock in this part or the basin.
Samples were obtained from 38 wells in the area and analyzed for major ions, trace elemerts, oxygen and deuterium isotopic ratios, and radioisotopes of H, r4C, and Cl. Conclusions based on the geochemical results are (1) the flow system in the Morrison aquifer involves several members, not just the Westwater Canyon Member of the Morrison Formation, (2) temporal changes in water- chemistry concentrations are a result of changes in hydraulic head in individual sandstone layers that contribute water to the well, (3) water chemistry changes over short periods of time in regional aquifers, and (4) the chemistry of the water is affected by mixing of recnarge, ion filtrate, or very dilute ancient water and by leakage of saline water.
30

A. MORRISON AQUIFER
B. MORRISON AQUIFER (WESTWATER CANYON MEMBER)
CHEMICAL CONSTITUENTS
SO4 - Sulfate CO3 +HCO3 - Carbonate +
bicarbonate Cl - Chloride Ca - Calcium Mg - Magnesium Na+K - Sodium + potassium
CATIONS ANIONS
Figure 9.--Water-analysis diagrams for selected hydrogeologic units in rocks of Jurassic age: A. Morrison aquifer, B. Morrison aquifer (Westwater Canyon Member), and C. Entrada aquifer.
31

C. ENTRADA AQUIFER
CATIONS ANIONS
CHEMICAL CONSTITUENTS
SO4 - Sulfate CO3+HCO3 - Carbonate +
bicarbonate Cl - Chloride Ca . Calcium Mg - Magnesium Na+K . Sodium + potassium
Figure 9.-Water-analysis diagrams for selected hydrogeologic units in rocks of Jurassic age: A. Morrison aquifer, B. Morrison aquifer (Westwater Canyon Member), and C. Entrada aquifer-Concluded.
32

CHINLE CONFINING UNIT
Ca Cl
CATIONS ANIONS
CHEMICAL CONSTITUENTS
SO4 - SulfateCO3+HCO3 - Carbonate +
bicarbonate Cl - Chloride Ca - Calcium Mg - Magnesium Na+K - Sodium + potassium
Figure 10.-Water-analysis diagram for the Chinie confining unit.33

SIMULATION ANALYSIS OF THE GROUND-WATER FLOW SYSTEM
A steady-state, three-dimensional ground-water flow model was constructed to simulate modern predevelopment flow in the post-Jurassic part of the aquifer system in the San Juan structural basin (Kernodle, in press). The model used the McDonala and Harbaugh (1988) modular finite-difference code to represent the aquifer system using 38,264 active cells located within a Hock of 100 rows, 100 columns, and 12 layers. The model explicitly simulated flow in 12 layers (derived from the 14 regional hydrogeologic units) and used vertical harmonic leakance to indirectly simulate aquifer connection across 3 other hydrogeologic units (derived from the 5 confining unitr) in addition to coupling the 12 layers.
The entire hydrologic system of the basin was simulated. All boundaries to the natural system were given analogous numerical equivalents, and no arbitrary boundaries, such as planes of symmetry within the flow system or expedient constant-head sinks or sources, were imposed on the numerical representation or the system. Streams were simulated as general-head boundaries and direct recharge from precipitation was simulated as a recharge velocity applied directly to the outcrop areas of the hydrogeologic units. With one exception, no other boundary types or conditions were simulated other than those imposed by the internal irregularities of the aquifer system. The one exception was a general-head boundary that was used to simulate recharge flow through the Chuska Sandstone, a massive eolian dune deposit, and into upturned components of the Cretaceous aquifer system.
The ground-water system was defined, described, and quantified in the HA-720 series of map atlases. The maps and illustrations printed in the series showing aquifer tops, bottoms, thicknesses, and other hydrogeologic properties were constructed directly from GIS data bases that later were used to construct the ground-water flow model.
Stream/aquifer interaction, direct recharge from precipitation, and downward leakage from the Chuska Sandstone were the external boundary conditions that were simulated. Streambed leakage contributed 135 ft3/s to the aquifer system, direct recharge contributed 56 ft3/s, and downward leakage from the Chuska Sandstone contributed 4 fr/s. A computed discharge of 195 fr/s to the lower reaches of the major streams and rivers in the basin balanced the steady-state water budget of the ground-water flow system.
Outcrop boundary conditions were found to most strongly control hydraulic heads and head distributions in the San Juan Basin. Less significant in the simulations were the simulated horizontal hydraulic-conductivity values, and least significant were the simulated horizontal anisotropy and vertical hydraulic-conductivity values.
34

SELECTED REFERENCES
Anderholm, S.K., 1979, Hydrogeology and water resources of the Cuba quadrangle, Sandoval and Rio Arriba Counties, New Mexico: Socorro, New Mexico Institute of Mining and Technology unpublished M.S. thesis, 162 p.
Back, William, 1966, Hydrochemical fades and ground-water flow patterns in northern part of Atlantic Coastal Plain: U.S. Geological Survey Professional Paper 498-A, 42 p.
Berry, F.A.F., 1959, Hydrodynamics and geochemistry of the Jurassic and Cretaceous systems in th« San Juan Basin, northwestern New Mexico and southwestern Colorado: Palo Alto, Stanford University, unpublished Ph.D. dissertation, 213 p.
Brimhall, R.M., 1973, Ground water hydrology of Tertiary rocks of the San Juan Basin, New Mexico, in Fassett, J., ed., Cretaceous and Tertiary rocks of the southern Colorado Plateau: Four Corners Geological Society Memoir, p. 197-207.
Brod
Brown
, R.C., 1979, Hydrogeology and water resources of the Ambrosia Lake-San Mateo area, McKinley and Valencia Counties, New Mexico: Socorro, New Mexico Institute of Mining ard Technology, unpublished M.S. thesis, 200 p.
i, D.R., 1976, Hydrogeology and water resources of the Aztec quadrangle, San Juan County, New Mexico: Socorro, New Mexico Institute of Mining and Technology, unpublished M.S. thesis, 174 p.
Chow, V.T., ed., 1964, Handbook of applied hydrology, a compendium of water-resources technology: New York, McGraw-Hill, 1418 p.
Craigg, S.D., 1980, Hydrogeology and water resources of the Chico Arroyo/Torreon Wash area,Sandoval and McKinley Counties, New Mexico: Socorro, New Mexico Institute of Mining ard Technology, unpublished M.S. thesis, 272 p.
___in press, Geologic framework of the San Juan structural basin of New Mexico, Colorado,Arizona, and Utah, with emphasis on Triassic through Tertiary rocks: U.S. Geological Survey Professional Paper 1420.
' S.D., Dam, W.L., Kernodle, J.M., and Levings, G.W., 1989, Hydrogeology of the Dakota "Sandstone in the San Juan structural basin, New Mexico, Colorado, Arizona, and Utah: U.S.
Geological Survey Hydrologic Investigations Atlas HA-720-1,2 sheets.
Craigg, S.D., Dam, W.L., Kernodle, J.M., Thorn, C.R., and Levings, G.W., 1990, Hydroeeology of ti ° Point Lookout Sandstone in the San Juan structural basin, New Mexico, Colorado, Arizona, and Utah: U.S. Geological Survey Hydrologic Investigations Atlas HA-720-G, 2 sheets.
Dam, W.L., 1995, Geochemistry of ground water in the Gallup, Dakota, and Morrison aquifers, San Juan Basin, New Mexico: U.S. Geological Survey Water-Resources Investigations Report 94- 4253, 76 p.
Dam, W.L., Kernodle, J.M., Levings, G.W., and Craigg, S.D., 1990a, Hydrogeology of the Morrisori Formation in the San Juan structural basin, New Mexico, Colorado, Arizona, and Utah: U.S. Geological Survey Hydrologic Investigations Atlas HA-720-J, 2 sheets.
Dam, W.L., Kernodle, J.M., Thorn, C.R., Levings, G.W., and Craigg, S.D., 1990b, Hydrogeology of the Pictured Cliffs Sandstone in the San Juan structural basin, New Mexico, Colorado, Arizona, and Utah: U.S. Geological Survey Hydrologic Investigations Atlas HA-720-D, 2 sheets.
35

SELECTED REFERENCES-Continued
Dane, C.H., and Bachman, G.O., 1965, Geologic map of New Mexico: U.S. Geological Survey, 2 sheets, scale 1:500,000.
Darcy, Henry, 1856, Les fontaines publiques de la ville de Dijon: V. Dalmont, Paris, 647 p.
Davies, P.B., 1989, Variable-density eround-water flow and paleohydrology in the Waste Isolation Pilot Plant (WIPP) region, southeastern New Mexico: U.S. Geological Survey Open-File Report 88-490,139 p.
Fassett, J.E., 1989, Coal-bed methane A contumacious, free-spirited bride; the geologic handmaiden of coal beds, in Lorenz, J.C., and Lucas, S.G., eds., Energy Frontiers in the Rockies: Albuquerque Geological Society, Albuquerque, N. Mex., October 1-4,1989, p. 131-146.
Fassett, J.E., and Hinds, J.S., 1971, Geology and fuel resources of the Fruitland Formation and Kirtland Shale of the San Juan Basin, New Mexico and Colorado: U.S. Geological Survey Professional Paper 676, 76 p.
Fenneman, N.M., 1931, Physiography of the western United States: New York, McGraw-Hill, 534 p.
Finch, W.I., and McLemore, V.T., 1989, Uranium geology and resources of the San Juan Basin, in Finch, W.I., Huffman, A.C., and Fassett, J.E., eds., Coal, uranium, and oil and gas in Mesozoic rocks of the San Juan Basin Anatomy of a giant energy-rich basin: 28th International Geological Congress, Washington, D.C., Guidebook for Field Trip T120, p. 27-32.
Freeze, R.A., and Cherry, J.A., 1979, Groundwater: Englewood Cliffs, N. J., Prentice-Hall, Inc., 6C4 p.
Frenzel, P.P., 1983, Simulated changes in ground-water levels related to proposed development of Federal coal leases, San Juan Basin, New Mexico: U.S. Geological Survey Open-File Report 83- 949, 63 p.
Hem, J.D., 1985, Study and interpretation of the chemical characteristics of natural water (3d ed., rev.): US. Geological Survey Water-Supply Paper 2254,263 p.
Hintze, L.F., 1981, Geologic map of Utah: Utah Geological and Mineral Survey, 1 sheet, scale 1:500,000.
Kelley, V.C., 1950, Precambrian rocks of the San Juan Basin, in Guidebook of the San Juan Basin, New Mexico and Colorado: New Mexico Geological Society, First Field Conference, p. 53-55.
___1951, Tectonics of the San Juan Basin, in Guidebook of the south and west sides of the San Juan Basin, New Mexico and Arizona: New Mexico Geological Society, Second Field Conference, p. 124-131.
___1957, Tectonics of the San Juan Basin and surrounding areas, in Little, C.J., and Gill, J.J., edf , Guidebook to geology of southwestern San Juan Basin: Four Corners Geological Society, Second Field Conference, p. 44-52.
___1963, Tectonic setting, in Kelley, V.C., compiler, Geology and technology of the Grantsuranium region: Socorro, New Mexico Bureau of Mines and Mineral Resources Memoir 15, p. 19-20.
Kelly, T.E., 1977, Geohydrology of the Westwater Canyon Member, Morrison Formation, of the southern San Juan Basin, New Mexico, in Fassett, J., ed., Guidebook of San Juan Basin in, northwestern New Mexico: New Mexico Geological Society, 28th Field Conference, p. 285- 290.
36

SELECTED REFERENCES-Continued
Kernodle, J.M., in press, Simulation analysis of the San Juan Basin ground-water flow system, New Mexico, Colorado, Arizona, and Utah: U.S. Geological Survey Water-Resources Investigations Report 95-4187.
Kernodle, J.M., Levings, G.W., Craigg, S.D., and Dam, W.L., 1989, Hydrogeology of the Gallup Sandstone in the San Juan structural basin, New Mexico, Colorado, Arizona, and Utah: U.S Geological Survey Hydrologic Investigations Atlas HA-720-H, 2 sheets.
Kernodle, J.M., and Phillip, R.D., 1988, Using a geographic information system to develop a grourd- water flow model, in Regional aquifer systems of the United States, aquifers of the western mountain area: American Water Resources Association Monograph 14, p. 191-202.
Kernodle, J.M., Thorn, C.R., Levines, G.W., Craigg, S.D., and Dam, W.L., 1990, Hydrogeology of the Kirtland Shale and Fruitlana Formation in me San Juan structural basin, New Mexico, Colorado, Arizona, and Utah: U.S. Geological Survey Hydrologic Investigations Atlas HA- 720-C, 2 sheets.
Knight, R.L., and Cooper, J.C., 1955, Suggested changes in Devonian terminology of the FourCorners area, in Geology of parts of Paradox, Black Mesa, and San Juan Basins: Four Corners Geological Society Guidebook, Fifth Field Conference, p. 56-58.
Levines, G.W., Craigg, S.D., Dam, W.L., Kernodle, J.M., and Thorn, C.R., 1990a, Hydrogeology of the Menefee Formation in the San Juan structural basin, New Mexico, Colorado, Arizona, and Utah: U.S. Geological Survey Hydrologic Investigations Atlas HA-720-F, 2 sheets.
___1990b, Hydrogeology of the San Jose, Nacimiento, and Animas Formations in the San Juan structural basin, New Mexico, Colorado, Arizona, and Utah: U.S. Geological Survey Hydrologic Investigations Atlas HA-720-A, 2 sheets.
Lohman, S.W., 1972, Ground-water hydraulics: U.S. Geological Survey Professional Paper 708, 70 p.
Matheny, M.L., and Ulrich, R.A., 1983, A history of the petroleum industry in the Four Corners area, in Fassett, J.E., ed., Oil and gas fields of the Four Corners area: Four Corners Geological Society, v. HI, p. 804-831.
McDonald, M.G., and Harbaugh, A.W., 1988, A modular three-dimensional finite-difference ound-water flow model: U.S. Geological Survey Techniques of Water-Resources ivestigations, book 6, chap. Al, 548 p.
Molenaar, C.M., 1977a, San Juan Basin time-stratigraphic nomenclature chart, in Guidebook of San Juan Basin HI: New Mexico Geological Society, 28th Field Conference, p. xii.
___1977b, Stratigraphy and depositional history of Upper Cretaceous rocks of the San Juan Basin area, New Mexico and Colorado, with a note on economic resources, in Guidebook of San Jurn Basin HI: New Mexico Geological Society, 28th Field Conference, p. 159-166.
___1989, San Juan Basin stratigraphic correlation chart, in Finch, W.I., Huffman, A.C., Jr., and Fassett, J., eds., Coal, uranium, and oil and gas in Mesozoic rocks of the San Juan Basin- Anatomy of a giant energy-rich basin: 28th International Geological Congress, Washington, D.C., Guidebook for Field Trip T-120, p. xi.
Reneau, W., Jr., and Harris, J.D., Jr., 1957, Reservoir characteristics of Cretaceous sands of the San Juan Basin, in Little, C.J., and Gill, J.J., eds., Guidebook to geology of southwestern San Juan Basin: Four Corners Geological Society, Second Field Conference, p. 40-43.
37

SELECTED REFERENCES-Concluded
Stone, W.J., Lyford, P.P., Frenzel, P.P., Mizell, N.H., and Padgett, E.T., 1983, Hydrogeology and water resources of San Juan Basin, New Mexico: Socorro, New Mexico Bureau of Mines and Mineral Resources Hydrologic Report 6,70 p.
Thorn, C.R., Levines, G.W., Craigg, S.D., Dam, W.L., and Kernodle, J.M., 1990a, Hydrogeology of the Cliff House Sandstone in the San Juan structural basin, New Mexico, Colorado, Arizona, and Utah: U.S. Geological Survey Hydrologic Investigations Atlas HA-720-E, 2 sheets.
___1990b, Hydrogeology of the Ojo Alamo Sandstone in the San Juan structural basin, NewMexico, Colorado, Arizona, and Utah: U.S. Geological Survey Hydrologic Investigations Atlas HA-720-B, 2 sheets.
Tweto, Ogden, 1979, Geologic map of Colorado: U.S. Geological Survey, 2 sheets, scale 1:500,000.
U.S. Bureau of the Census, 1980, Master area reference file for 1980 Census.
___1985, Technical documentation, population, and per capita income estimates: Governmental Units, Washington, D.C., 6 p.
___1990, Master area reference file for 1990 Census.
U.S. Environmental Protection Agency, 1986a, Maximum contaminant levels (subpart B of part 141, National interim primary drinking-water regulations): U.S. Code of Federal Regulations, Title 40, Parts 100 to 149, revised as of July 1,1986, p. 524-528.
___1986b, Secondary maximum contaminant levels (section 143.3 of part 143, National secondary drinking-water regulations): U.S. Code of Federal Regulations, Title 40, Parts 100 to 149, revised as of July 1,1986, p. 587-590.
Welder, G.E., 1986, Plan of study for the Regional Aquifer-Systems Analysis of the San Juanstructural basin, New Mexico, Colorado, Arizona, and Utah: U.S. Geological Survey Water- Resources Investigations Report 85-4294,23 p.
Wengerd, S.A., and Matheny, M.L., 1958, Pennsylvanian System of Four Corners Region: American Association of Petroleum Geologists Bulletin, v. 42, no. 9, p. 2048-2106.
Wilson, E.D., Moore, R.T., and Cooper, J.R., 1969, Geologic map of Arizona: Arizona Bureau of Mines and U.S. Geological Survey, 1 sheet, scale 1:500,000.
Woodward, L. A., 1974, Tectonics of central-northern New Mexico, in Siemers, C.T., ed., Guidebook of Ghost Ranch, central-northern New Mexico: New Mexico Geological Society, 25th Field Conference, p. 123-129.
___1987, Geology and mineral resources of Sierra Natimiento and vicinity, New Mexico: Socorro, New Mexico Bureau of Mines and Mineral Resources Memoir 42,84 p.
Woodward, L.A., Kaufrnan, W.H., and Anderson, J.B., 1972, Nacimiento fault and related structures, northern New Mexico: Geological Society of America Bulletin, v. 83, p. 2383-2396.
Woodward, L.A., and Ruetschilling, R.L., 1976, Geology of San Ysidro quadrangle,.New Mexico: Socorro, New Mexico Bureau of Mines and Mineral Resources Geologic Map 37.
Woodward, L.A., and Schumacher, O.L., 1973, Morrison Formation of southeastern San Juan Basin, New Mexico: Socorro, New Mexico Bureau of Mines and Mineral Resources Circular 129,7 p.
Wright, A.F., 1979, Bibliography of geology and hydrology, San Juan Basin, New Mexico, Colorado, Arizona, and Utah: U.S. Geological Survey Bulletin 1481,123 p.
38

Table 1.-Summary of geologic nomendature and lithologic characteristics of regional units in the San Juan structural basin
System
Tertiary
Cretaceous
Jurassic
Triassic
Formation
San Jose Formation
Nacimiento Formation
Animas Formation
Ojo Alamo Sandstone
Kirtland Shale
Fruitland Formation
Pictured Cliffs Sandstone
Lewis Shale
Cliff House Sandstone
Menefee Formation
Point Lookout Sandstone
Mancos Shale
Crevasse Canyon Formation
Gallup Sandstone
Dakota Sandstone
Morrison Formation
Entrada Sandstone
Chinle Formation
Approximate maximum thickness
(feet)
2,700
UOO
2,700
400
400
2,400
Depends on location and tongues present; maximum 1,000
2,000
350
2^00
700
600
500
1,100
330
1,600
General lithologic description
Interbedded, very fine to coarse-grained, locally conglomeratic, arkosic sandstone and variegated siltstone and shale.
Interbedded gray shale and discontinuous lenses of arkosic sandstone; locally constant carbonaceous lenses.
Interbedded, tuff aceous sandstone, conglomerate, and shale; McDermott Member distinctly purple in color.
Overlapping, sheetlike sequences of arkosic sandstone and conglomerate; locally contains interbedded lenses of shale.
Interbedded, repetitive sequences of lenticular sandstone, siltstone, and shale and daystone.
Interbedded, repetitive sequence of lenticular sandstone, siltstone, and shale with coal common.
Upward-coarsening, very fine to medium-grained sandstone, with thir interbeds of dark shale in lower part.
Dark shale and silty shale with thin interbeds of silty limestone, siltstone, and fine-grained sandstone in lower part.
Consists of several very fine to fine-grained sandstone tongues. Interbeds of dark shale are common.
Interbedded sequences of lenticular sandstone, siltstone, and dark shale and daystone. Carbonaceous shale and coal common in lower and upper parts.
Very fine to medium-grained sandstone with thin interbeds of dark shale in lower part.
Dark shale and silty shale with thin interbeds of silty limestone, siltstone, and fine-grained sandstone.
Interbedded sequence of lenticular sandstone, siltstone, and shale and daystone with carbonaceous shale and daystone with carbonaceous shale and coal common in lower and upper parts where deposited in fluvial environments and coal swamps.
Sandstone with some conglomerate, shale, carbonaceous shale, and coal.
Consists of several members and tongues of sandstone. Fine- to coarse grained sandstone, with dark shale, siltstone, and minor carbonaceous shale.
Fine- to coarse-grained locally conglomeratic sandstone, sandy siltstone, and shale and daystone; also contains thin limestone beds.
Crossbedded silty sandstone and very fine to medium-grained quartzose sandstone.
Consists of nonmarine deposits of daystone and shale, siltstone, and sandstone from various depositional (stream-channel, flood-plain, eolian, and lacustrine) environments.
39
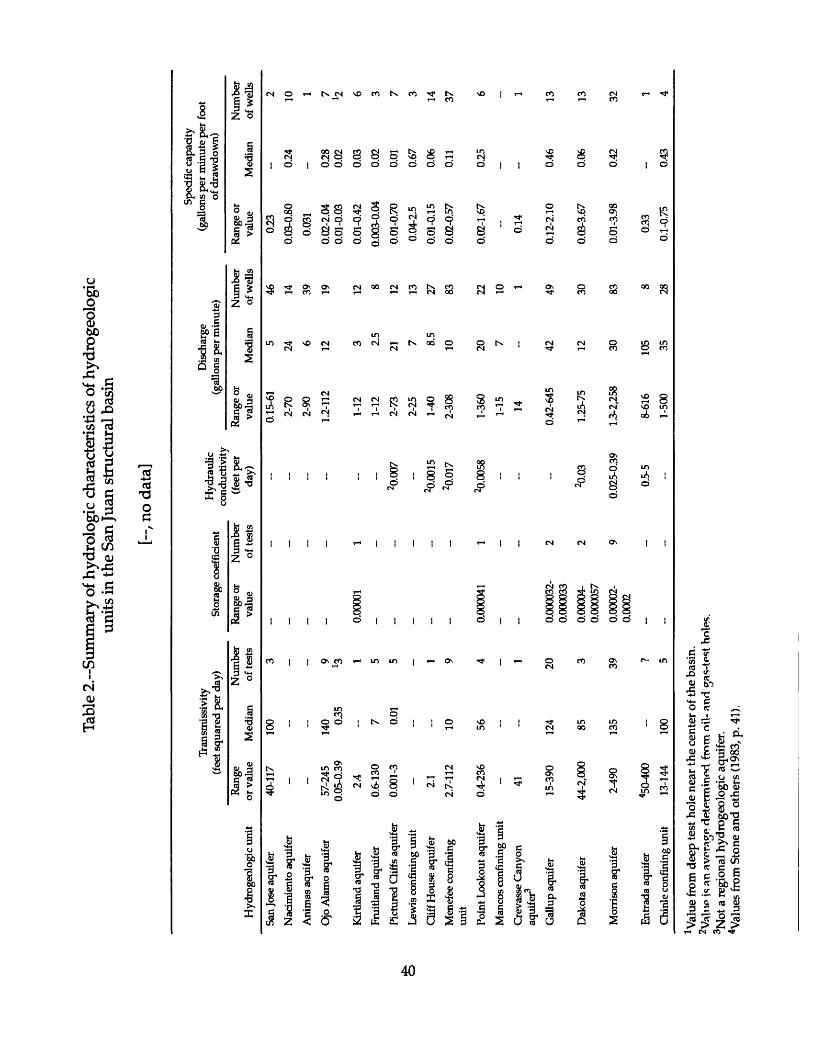
Tabl
e 2.
Sum
mar
y of
hyd
rolo
gic
char
acte
rist
ics
of h
ydro
geol
ogic
un
its in
the
San
Juan
str
uctu
ral b
asin
[ , n
o da
ta]
Tra
nsm
issi
vity
(f
eet s
quar
ed p
er d
ay)
Stor
age
coef
fici
ent
Hyd
roge
olog
ic u
nit
San
Jose
aqu
ifer
Nar
imie
nto
aqui
fer
Ani
mas
aqu
ifer
Ojo
Ala
mo
aqui
fer
Kir
tland
aqu
ifer
Frui
tland
aqu
ifer
Pict
ured
Qif
fs a
quif
er
Lew
is c
onfi
ning
uni
t
Clif
f Hou
se a
quif
er
Men
efee
con
fini
ng
unit
Poin
t Loo
kout
aqu
ifer
Man
cos
conf
inin
g un
it
Cre
vass
e C
anyo
n aq
uife
r3
Gal
lup
aqui
fer
Dak
ota
aqui
fer
Mor
riso
n aq
uife
r
Ent
rada
aqu
ifer
Chi
nle
conf
inin
g un
it
Ran
ge
or v
alue
40-1
17- -
57-2
45
0.05
-0.3
9
2.4
0.6-
130
0.00
1-3
- 2.1
2.7-
112
0.4-
236
- 41
15-3
90
44-2
,000
2-49
0
450-
400
13-1
44
Med
ian
100 - -
140 0.
35- 7 0.
01- - 10 56 -
124 85 135 -
100
Num
ber
Ran
ge o
r N
umbe
r of
test
s va
lue
of te
sts
3
-
-
-
-
9 -
J3 1 0.
0000
1 1
5 -
5 -
-
-
1
9 -
4 0.
0000
41
1
-
-
1 20
0.00
0032
- 2
0.00
0033
3 0.
0000
4-
2 0.
0000
57
39
0.00
002-
9
0.00
02
?
5
Hyd
raul
ic
cond
uctiv
ity
(fee
t per
da
y) - - - ~ - --
20.0
07
-
20.0
015
20.0
17
20.0
058
~
2Q.0
3
0.02
5-0.
39
0.5-
5-
Dis
char
ge
(gal
lons
per
min
ute)
Ran
ge o
r va
lue
0.15
-61
2-70
2-90
1.2-
112
1-12
1-12
2-73
2-25
1-40
2-30
8
1-36
0
1-15 14
0.42
-645
1.25
-75
1.3-
2,25
8
8-61
6
1-50
0
Med
ian
5 24 6 12 3 2.5
21 7 8.5
10 20 7 42 12 30 105 35
Num
ber
of w
ells
46 14 39 19 12 8 12 13 27 83 22 10 1 49 30 83 8 28
Spec
ific
cap
acity
(g
allo
ns p
er m
inut
e pe
r fo
ot
of d
raw
dow
n)
Ran
ge o
r va
lue
023
0.03
-0.8
0
0.03
1
0.02
-2.0
4 0.
01-0
.03
0.01
-0.4
2
0.00
3-0.
04
0.01
-0.7
0
0.04
-2.5
0.01
-0.1
5
0.02
-0.5
7
0.02
-1.6
7
~ 0.14
0.12
-2.1
0
0.03
-3.6
7
0.01
-3.9
8
033
0.1-
0.75
Med
ian
- 0.24
- 028
0.02
0.03
0.02
0.01
0.67
0.06
0.11
025
- 0.46
0.06
0.42
- 0.43
Num
ber
of w
ells 2 10 1 7 12 6 3 7 3 14 37 6 - 1 13 13 32 1 4
1Val
ue f
rom
dee
p te
st h
ole
near
the
cent
er o
f the
bas
in.
2Val
ne is
an
aver
age
dete
rmin
ed f
mm
nil-
and
gas
-tes
t hol
es.
3Not
a re
gion
al h
ydro
geol
ogic
aqu
ifer
. 4V
alue
s fr
om S
tone
and
oth
ers
(198
3, p
. 41)
.
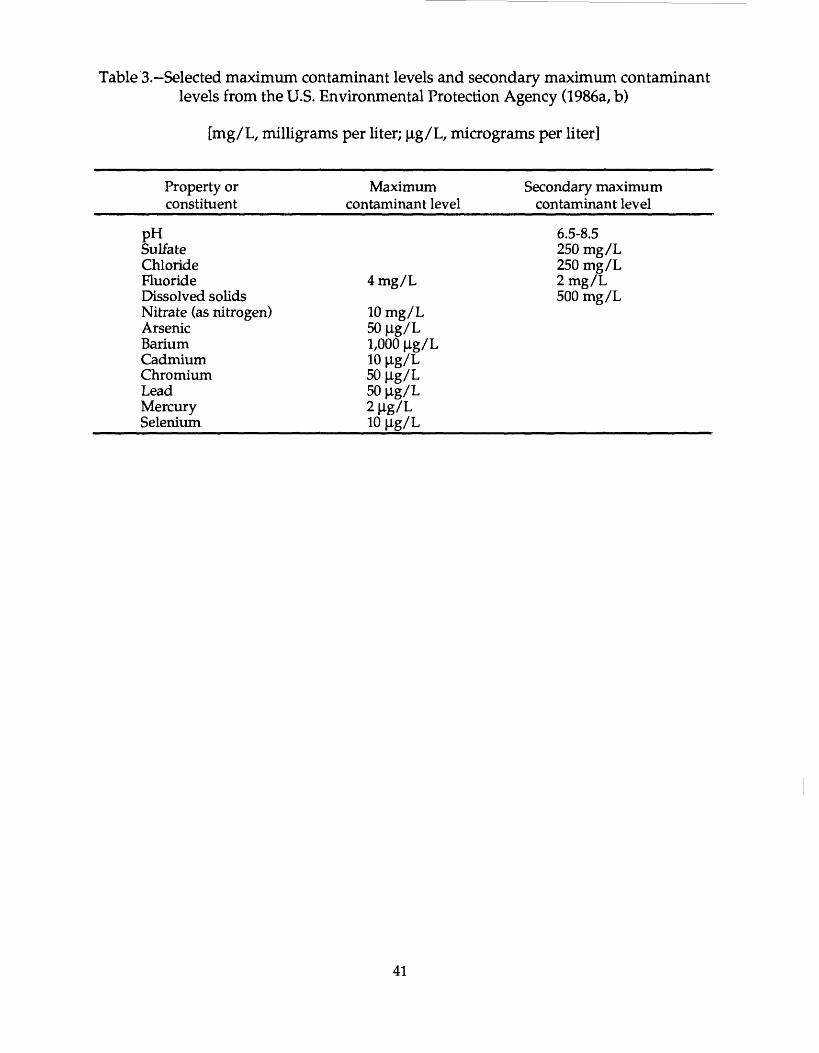
Table 3.-Selected maximum contaminant levels and secondary maximum contaminant levels from the U.S. Environmental Protection Agency (1986a/ b)
[mg/L, milligrams per liter; |ig/L, micrograms per liter]
Property or Maximum Secondary maximum constituent_________contaminant level______contaminant level
pH 6.5-8.5Sulfate 250 mg/LChloride 250 mg/LFluoride 4 mg/L 2 mg/LDissolved solids 500 mg/L Nitrate (as nitrogen) 10 mg/LArsenic 50 |ig/LBarium 1,000 |lg/LCadmium 10 |ig/LChromium 50 |lg/LLead 50 u.g/LMercury 2 |ig/LSelenium 10 |ig/L
41
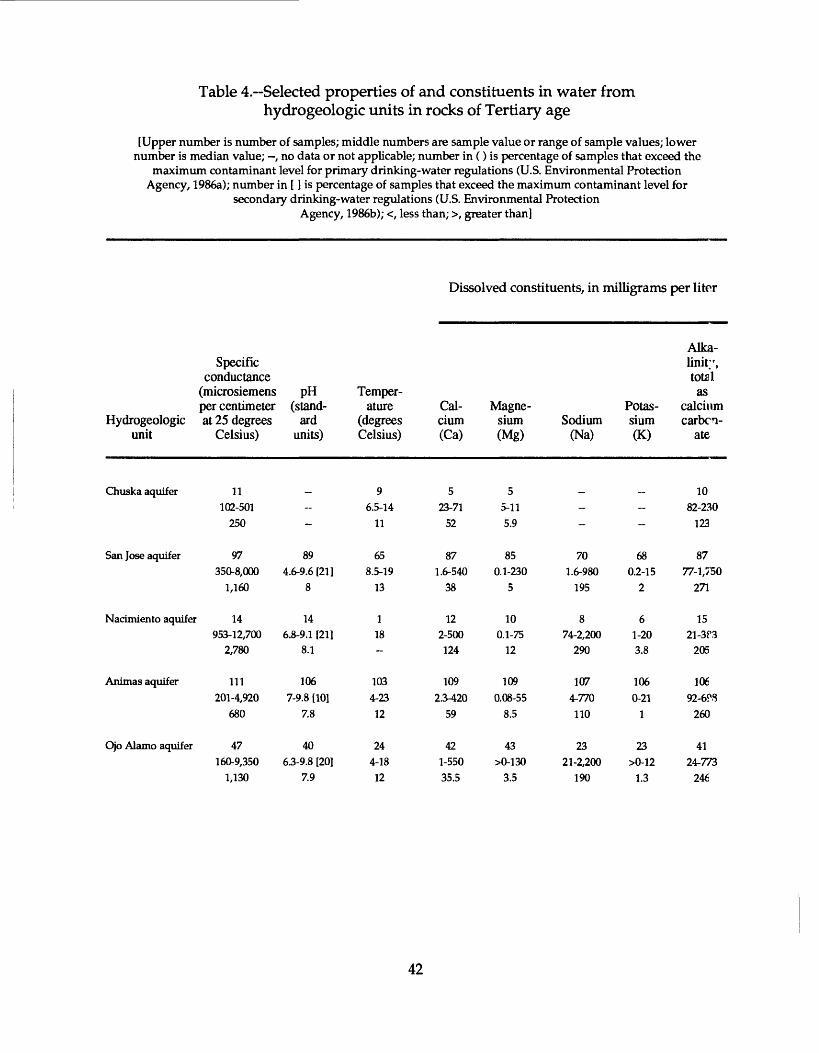
Table 4.~Selected properties of and constituents in water from hydrogeologic units in rocks of Tertiary age
[Upper number is number of samples; middle numbers are sample value or range of sample values; lowernumber is median value; , no data or not applicable; number in () is percentage of samples that exceed the
maximum contaminant level for primary drinking-water regulations (U.S. Environmental ProtectionAgency, 1986a); number in [ ] is percentage of samples that exceed the maximum contaminant level for
secondary drinking-water regulations (U.S. Environmental ProtectionAgency, 1986b); <, less than; >, greater than]
Dissolved constituents, in milligrams per liter
Hydrogeologic unit
Chuska aquifer
San Jose aquifer
Nadmiento aquifer
Animas aquifer
Ojo Alamo aquifer
Specific conductance
(microsiemens per centimeter at 25 degrees
Celsius)
11102-501
250
97350-8,000
1,160
14953-12,700
2,780
111201-4,920
680
47160-9,350
1,130
PH (stand
ard units)
--
894.6-9.6 [21]
8
146.8-9.1 [21]
8.1
1067-9.8 [10]
7.8
4063-9.8 [20]
7.9
Temper ature
(degrees Celsius)
96.5-14
11
658.5-19
13
118-
1034-23
12
244-18
12
Cal cium (Ca)
523-71
52
871.6-540
38
122-500124
1092.3-420
59
421-55035.5
Magne sium (Mg)
55-11
5.9
850.1-230
5
100.1-75
12
1090.08-55
8.5
43>0-130
3.5
Sodium(Na)
--
701.6-980
195
874-2,200
290
1074-770
110
2321-2,200
190
Potas sium (K)
--
680.2-15
2
61-20
3.8
1060-21
1
23>0-12
1.3
Alkalinity, totalas
calcium carbca-
ate
1082-230
123
8777-1,750
271
1521-3f3
205
10692-6<\8
260
4124-773
246
42

Table 4. Selected properties of and constituents in water from hydrogeologic units in rocks of Tertiary age Continued
Dissolved constituents, in micrograms per liter
Hydrogeologicunit
Chuska aquifer
San Jose aquifer
Narimiento aquifer
Animas aquifer
Ojo Alamo aquifer
Sul fate(S04)
72.7-24
6.4
9211-2,800 [36]
200
1321-UOO [77]
1,400
10923-770 [15]
49
446.2-6,300 [48]
245
Chloride(Cl)
103-12
4
912.4-1,700 [5]
18
157-4,100
17
1081.3-1,400 [4]
14
460.7-490 [4]
8.6
Fluoride(F)
80.1-0.4
0.2
89(9)0.1-8 [22]
1.0
8(12)0.4-5.3 [38]
2
109(6)0-8.8 [17]
0.6
42(7)0.1-6.8 [2]
0.5
Dis solved solids,sum ofconstituents
4138-219
209
67193-4,300 [72]
750
12660-6,800 [100]
2,800
80115-3,490 [34]
400
3956-7,300 [72]
640
Nitrate,as
nitrogen
100.02-2.5
0.1
300-5.60.09
70-0.180.06
4023-4.10
0.42
30(7)0-16
0.06
Arsenic(As)
--
221-8
1
~-
390-10
1
6<0.01-1
1
Barium Boron(Ba) (B)
_ _-
5612-1,100
50
2>0-190
95
876-400
40
5 1211-19 0-860
15 70
43

Table 4. Selected properties of and constituents in water from hydrogeologic units in rocks of Tertiary age Concluded
Dissolved constituents, in micrograms per liter
Hydrogeologic unit
Cadmium (Ca)
Chromium (Cr)
Lead (Pb)
Mercury (Hg)
Selenium (Se)
Chuska aquifer
San Jose aquifer 5 1-9
5
50.1-0.2
0.1
22(64)1-6,200
53
Narimiento aquifer
Animas aquifer 31-3
1
32-37
3
3 0.1
39(23)0-60
2
Ojo Alamo aquifer 6
<0.01-10 1
44

Table 5. Selected properties of and constituents in water from hydrogeologic units in rocks of Cretaceous age
[Upper number is number of samples; middle numbers are sample value or range of sample values; lower number is median value; , no data or not applicable; number in () is percentage of samples that exceed the maximum contaminant level for primary drinking- water regulations (U.S. Environmental Protection Agency, 1986a); number in [ ] is percentage of samples that exceed the maximum
contaminant level for secondary drinking-water regulations (U.S. Environmental Protection Agency, 1986b); <, less than;>, greater than]
Dissolved constituents, in milligrams per liter
Hydrogeologicunit
Kirtland aquifer
Fruitland aquifer
Pictured Cliffsaquifer
Lewis confiningunit
Cliff Houseaquifer
Menefeeconfining unit
Point Lookoutaquifer
Upper Mancosconfining unit
Gallup aquifer
Lower Mancosconfining unit
Dakota aquifer
Burro Canyonaquifer1
Specific conductance
(microsiemensper centimeterat 25 degrees
Celsius)
15710-31,500
3,920
23535-25,600
4,150
31345-59,200
8,000
19490-5,870
1,875
66239-13,500
2,580
131179-7,000
1,600
78211-5,500
1,310
32398-4,950
1,270
78351-10,200
1,220
30460-13,600
2,278
69297-12,100
1,490
11,300
pH(stand
ardunits)
146.9-8.6 [7]
7.7
236.6-12 [26]
7.8
306.8-123 [23]
8.1
195.9-8.7 [5]
7.4
544.3-9.2 [22]
7.7
855.3-10 [52]
8.6
567-9.2 [55]
8.6
216.8-8.9 [30]
8.3
577.1-92 [17]
8
236.5-9.1 [13]
7.9
596.5-9.7 [32]
8.4
17.7
Temperature
(degreesCelsius)
98.5-59
11
2410-45
14
208-52
19
139-17
12
373-33
13
716-5015
426-35.5
15
1711-22
15
726.5-72
19
2110-58.3
17
7310-92
24
117
Calcium(Ca)
155.9-510
36
241.8-520
64
361.6-1300
40
183.5-500
120
591.3-400
33
1140.6-600
4.1
721-680
7
251.1-630
64
751^60
26
292.4-600
68
660-330
26
127
Magnesium(Mg)
150.6-670
11
260-330
6.3
320.1-340
11
181.6-470
59
590.1-250
12
1160.1-780
1.4
620.4-270
2.6
230.2-240
23
740-270
10
290-580
24
66>0-108
8
114
Sodium(Na)
1244-8,600
1,015
2414-6,400
915
3222-16,000
2,000
1743.7-810
140
484.2-1,100
395
6710-1,300
290
5010-1,400
225
1638-990
210
3236-720
220
218.9-2,400
730
493.9-1300
250
1260
Potassium(K)
12>0-17
3.1
241.9-31
8.2
291.2-350
11
170.9-9.8
2.7
4602-11
3
640.8-7.4
2
420.1-15
3
130.7-13
4
310.8-8
3
210.6-370
5
48>0-140
2
14.4
Alka linity, total
ascalciumcarbon
ate
1557-4,170
280
17306-3,550
735
3440-2,740
570
16150-982
406
55115-1,980
420
12035-9,080
473
7789-1,640
341
3098-1,100
266
7670-567
243
28144-1,100
470
7266-1,340
266
1344
45

Table 5. Selected properties of and constituents in water from hydrogeologic units in rocks of Cretaceous age Continued
Dissolved constituents, in milligrams per liter
Hydrogeologic unit
Kirtland aquifer
Fruitland aquifer
Pictured Cliffs aquifer
Lewis confining unit
Cliff House aquifer
Menefee confining unit
Point Lookout aquifer
Upper Mancos confining unit
Gallup aquifer
Lower Mancos confining unit
Dakota aquifer
Burro Canyon aquifer1
Sulfate (S04)
15 1.9-14,000 [33]
91
23 3-8,100 [26]
130
34 2.4-8,200 [41]
120
20 0.8-3,700 [60]
426
59 0.5-4,200 [68]
490
117 1.8-1,100 [40]
170
72 3.8-3,400 [49]
235
27 16-3,000 [60]
490
77 9.7-2,800 [62]
350
30 34-5,100 [53]
560
74 62-4,700 [57]
290
1 256 [100]
Chloride (Cl)
15 7.6-6,300 [33]
55
23 1.3-6,000 [35]
31
35 3.6-28,000 [74]
2,400
20 2.9-274 [5]
24
65 1.2-4,700 [14]
32
134 0.1-1,600 [7]
23
78 2.2-840 [1]
14
32 0.8-340 [6]
16
77 2-3,000 [1]
20
31 0.7-3,100 [19]
83
77 1.3-1,400 [12]
25
1 57
Fluoride (F)
15(27) 0.4-11 [33]
1
23(4) 0.2-4.4 [22]
0.8
29(7) 0.3-6.1 [41]
1
19 0.13-1.8
0.31
59 (19) 0.1-8.1 [34]
1
123 (29) 0.1-14 [45]
2
72(3) 0.1-7.4 [21]
0.9
25(8) 02-6 [12]
0.6
72(3) 0.1-5.3 [14]
0.7
29(17) 0.2-6.4 [41]
1
60(12) 0.1-10 [22]
0.7
1 03
Dissolvedsolids, sum of constit uents
14 449-30,100 [93]
2,925
23 310-20,000 [78]
2390
31 34046,000 [97]
6,600
3 1,300-5,700 [100]
3,460
48 130-6,800 [90]
1,750
104 1304,400 [86]
995
71 150-5,100 [93]
900
25 2424,470 [92]
1,070
75 210-6,000 [75]
830
25 207-1 1,400 [92]
1,570
52 171-9380 [71]
979
1 834 [100]
Nitrate, as
nitrogen
11 0.02-1.1
0.06
14 0-20.7 0.04
18 0.01-3.8
0.02
3 0.1-2.4
0.1
23 0.01-0.61
0.3
99 0.02-32
0.1
64 0.02-32
0.1
3 0.05-0.7
0.6
65 0.01-2.9
0.07
24 (8.3) 0-370
0.1
54(2) 0-20 0.1
-
46

Table 5. Selected properties of and constituents in water from hydrogeologic units in rocks of Cretaceous age Concluded
Dissolved constituents, in micrograms per liter
Hydrogeologic unit
Kirtland aquifer
Fruitland aquifer
Pictured Cliffs aquifer
Lewis confining unit
Cliff House aquifer
Menefee confining unit
Point Lookout aquifer
Upper Mancos confining unit
Gallup aquifer
Lower Mancos confining unit
Dakota aquifer
Burro Canyon aquifer1
Arsenic (As)
2 1
23 0-7
1
12 0-2
1
16
22
1
16
1
6
1
1
12
15 (13) 0-93
1
13 0-3
1
Barium (Ba)
-
2(50) <100-3,400
1,750
1 100
4 17-100
100
1 57
2(50) 90-10,000
5,045
1 81
12 14-380
68
2 <25-28
26
6 10-61
37
Boron (B)
10 0.85-2,000
410
16 30-1,900
590
21 20-4,200
470
14 0-420
50
33 0-1,300
130
56 0-920 130
35 >20-950
140
13 60-1,300
180
35 >0-2,400
130
12 90-4,300
950
25 0-2,100
90
-
Cadmium (Cd)
-
22(4) 0-18
1
9 0-9 2
4(50) 5-11 10
10 (10) <1-20
2
10
1
4
1
11
3(67) <l-42
11
5
Chromium (Cr)
14 0-30 10
8 0-10
0
-
1
2
10
1 1
1
11
2 <2-<20
11
5 0-10
1
-
Lead (Pb)
-
22(9) 0-120
4.5
10 (10) 2-390
20
4(75) 46-87
64
10(37) 1-120
6
9(11)
7
5 3-7
5
1 4
12
3.5
4(50)
11
5 0-5
-
Mercury (Hg)
23 0-1.1 0.1
11 0-0.5 0.1
4 <0. 1-0.2
11 <0.1-0.5
0.1
10 (10) 0.1-2.1
0.1
5 <0.1-0.2
1
11 <0.1-0.2
4
0.4
5 0-0.2
-
Selenium (Se)
2
1
23 0-3
1
12
16 (19) <l-88
22
1
16 1-3
6
1
12
14 (14) 040
1
13 0-10
1
1Not a regional hydrogeologic aquifer.
47

Table 6. Selected properties of and constituents in water from Dwight's ENERGYDATA, Inc. BRIN data base for selected hydrogeologic units
[Upper number is number of samples; middle numbers are sample value or range of sample values; lower number is median value; constituents are reported in milligrams per liter; , no data or not applicable]
Dissolved constituents
Hydrogeologic unit
Fruitland aquifer
Pictured Cliffs aquifer
Lewis confining unit
Point Lookout aquifer
Gallup aquifer
Dakota aquifer
Morrison aquifer
PH (standard
units)
197.6-8.6
7.9
156.6-10.4
7.5
18.1
27.6-7.8
7.7
2262-8.5
7.5
466-10.0
8
66.7-9.3
8.2
Calcium (Ca)
235-81
23
1719-742
184
121
218-167
92
235-1,182
179
543-1,026
120
610-500
258
Magnesium (Mg)
235-54
12
174-269
47
149
25-20
13
22I486
91
531488
28
63-%
36
Sodium (Na)
231,200-6,758
2,010
171,234-20,515
5,750
111,145
21,954-5,582
3,768
23942-22,658
9,185
56308-24,533
2,312
61,090-15,062
4,339
Potassium (K)
447-230
139
316-140
44
:_-
78-53
20
323-810
98
---
48
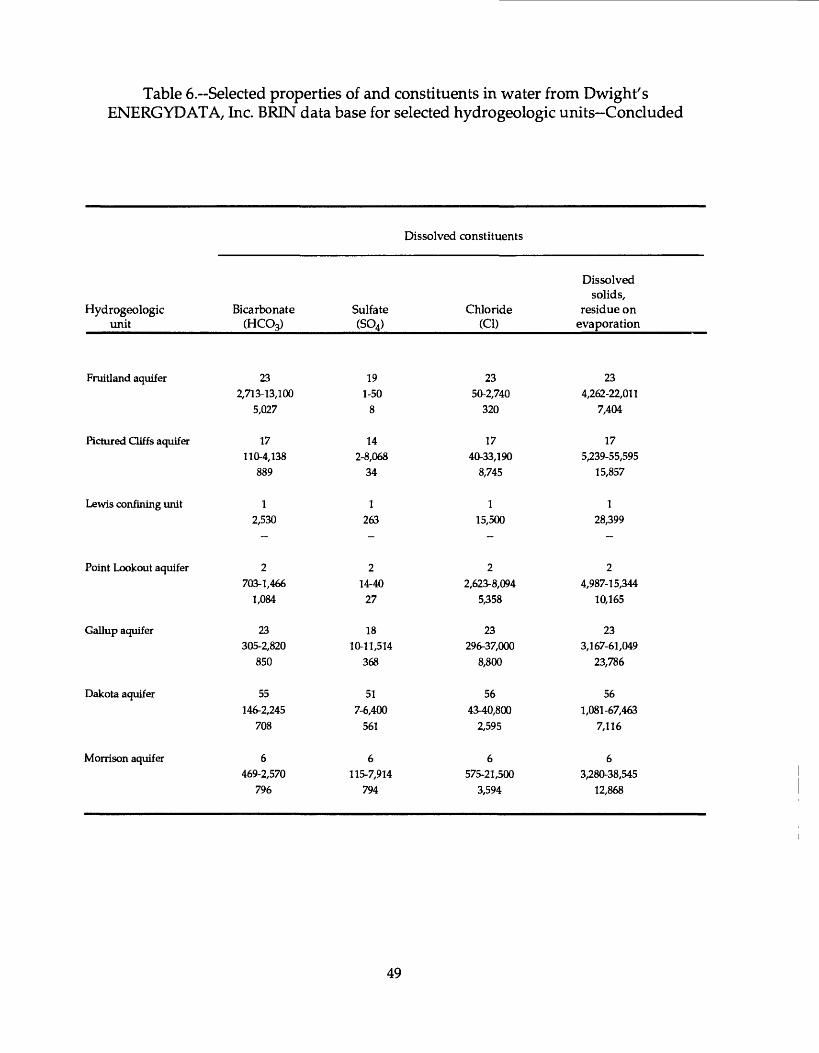
Table 6.~Selected properties of and constituents in water from Dwight's ENERGYDATA, Inc. BRIN data base for selected hydrogeologic units Concluded
Dissolved constituents
Hydrogeologic unit
Fruitland aquifer
Pictured Cliffs aquifer
Lewis confining unit
Point Lookout aquifer
Gallup aquifer
Dakota aquifer
Morrison aquifer
Bicarbonate (HCOs)
232,713-13,100
5,027
17110-4,138
889
12,530
2703-1,466
1,084
23305-2,820
850
55146-2,245
708
6469-2,570
796
Sulfate (S04)
191-50
8
142-8,068
34
1263
214-40
27
1810-11,514
368
517-6,400
561
6115-7,914
794
Chloride (Cl)
2350-2,740
320
1740-33,190
8,745
115,500
22,623-8,094
5,358
23296-37,000
8,800
5643-40,800
2,595
6575-21,500
3,594
Dissolved solids,
residue on evaporation
234,262-22,011
7,404
175,239-55,595
15,857
128,399
24,987-15^44
10,165
233,167-61,049
23,786
561,081-67,463
7,116
63,280-38,545
12,868
49

Table 7.~Selected properties of and constituents in water from hydrogeologic units in rocks of Jurassic age
[Upper number is number of samples; middle number is sample value or range of sample values; lower numberis median value; , no data or not applicable; number in () is percentage of samples that exceed the maximum
contaminant level for primary drinking-water regulations (U.S. Environmental Protection Agency,1986a); number in [ ] is percentage of samples that exceed the maximum contaminant level
for secondary drinking-water regulations (U.S. Environmental ProtectionAgency, 1986b); <, less than; >, greater than]
Dissolved constituents, in milligrams per liter
Specific conductance
(microsiemens pH per centimeter (stand-
Hydrogeologic at 25 degreesunit
Morrison aquifer
Morrison aquifer(Brushy Basin
Member)
Morrison aquifer(Westwater Canyon
Member)
Monison aquifer(Recapture
Member)
Morrison aquifer(Saltwash
Member)
Junction Creekaquifer1
Cow Springsaquifer1
Wanakah confiningunit
Todilto Limestoneaquifer1
Entrada aquifer
Celsius)
66 290-12,700
845
11,747
57370-2,870
904
2600-2,830
1,715
3430-630
490
8927-30,100
1355
4420-941
640
2274-442
358
423404,030
3,070
17540-31,500
2,810
ardunits)
56 6.6-9.6 [48]
8.4
17.5~
576.4-9.6 [19]
8
27.4-83
7.8
28.0-92 [50]
8.6
77.9-8.7 [29]
8.3
472-82
7.7
17.7-
47.5-7.7
7.6
137.4-9.4 [23]
7.9
Temper ature
(degreesCelsius)
51 10.5-42.2
233
118
3011-61
17
215-20
17
114.5-
416.5-24
19
310-24
24
14.5-
1216.5-88
65
1911-83
68
Calcium(Ca)
58 0.66-550
7
121
500.8-460
29
226-79
52
32-68
11
712-270
75
426-63
48
240-45
42
4240-270
260
1512-180
50
Magnesium(Mg)
58 0-5612
112-
50<0.01-110
7
23.9-11
7.4
23.1-18
10
71.2-130
47
42.4-18
7.3
223-14
8.1
49.7-109
54
150-698.4
Sodium(Na)
49 42-3,200
160
1370
4520485
120
232-700
366
198-
2560-7,400
3,980
269-140
104
138-
2320-602
461
1062-3,600
1,535
Potassium(K)
47 0.4-18
1
13
430.1-8
3
22.2-4
3
10.4
212-440
226
21.6-53.3
14~
23-11
7
100-227.9
Alka- lini^y, total ar
calciumcarbon
ate
5? 10-671
197
139")
4?136-435
20?
113?-
3138-18918")
8190-1,460
245
4164-303
197
2139-197
16S
4156-182
180
IE189-1300
29?
50

Table 7. Selected properties of and constituents in water from hydrogeologic units in rocks of Jurassic age Continued
Dissolved constituents, in milligrams per liter
Hydrogeologicunit
Morrison aquifer
Morrison aquifer (Brushy Basin
Member)
Morrison aquifer (Wesrwater Canyon
Member)
Morrison aquifer (Recapture
Member)
Morrison aquifer (Saltwash
Member)
Junction Creek aquifer1
Cow Springs aquifer1
Wanakah confining unit
Sulfate(S04)
613-3,800 [36]
130
1 470 [100]
58 9.8-1,400 [40]
188
2 98-1,400 [50]
749
2 35-52
43
7220-5,100 [86]
540
417-160
93
2 5.6-31
18
Chloride(Cl)
671.6-2,100 [9]
12
1 16
59 0.8-67
8.4
2 10-60
35
3 15-33
21
812-7,700 [25]
26
49-17 30
2 3-5.3
4
Fluoride(F)
59 (10)0.2-8.2 [19]
0.8
1 1.3
50(2) 0.2-4.6 [2]
0.4
2 0.5-2.4 [50]
1
3 0.6-10.7
70.8-2.4 [14]
1.4
40.5-1 0.5
2 0.4
Dis solved solids,sum ofconstituents
56166-6,000 [52]
511
1 1,140 [100]
52 221-2,310 [50]
502
2 381-2,300 [50]
1,340
2 293-297
295
7602-22,000 [100]
1,020
3361-602 [67]
528
2 170-262
216
Nitrate,as
nitrogen
180.01-1.5
0.1
-
30 0-12 0.15
1 0.25
3 0.11-0.56
0.27
20.04-1.1
0.6
40.1-1.5
0.2
-
Arsenic(As)
20
2
9
2
1 4
-
-
_
_
-
Barium(Ba)
219-120
42
-
9 12-100
46
1 54
-
_
-
_
-
-
-
Boron(B)
2310-2,300
110
16 20-1,700
185
1 830
1 120
2690-17,000
8,845
1150
-
4 4Todilto Limestone 1,050-1,640 [100] 22-384 [50]
aquifer1 1,300 183
Entrada aquifer 15 1729-6,400 [47] 7.0-9,500 [35]
120 80
3 40.7-1.2 1,790-3,270 [100]
1 2,455
15 (13) 1403-5.3 [33] 250-21,000 [57]
2 680
120-2.9 0.13
21-3 2
1 <100
1490
10>0-1,900
1,300
51

Table 7.~Selected properties of and constituents in water from hydrogeologic units in rocks of Jurassic age Concluded
Dissolved constituents, in micrograms per liter
Hydrogeologic Cadmium Chromium unit (Cd) (Cr)
19 19 Morrison aquifer <1 <l-8
Morrison aquifer (Brushy Basin
Member)
Morrison aquifer 9 7 (Westwater Canyon <l-2 <1-10
Member) <1 10
Morrison aquifer 1 1 (Recapture <1 <10
Member)
Morrison aquifer (Saltwash - -
Member)
Junction Creek aquifer1
Cow Springs aquifer1
Wanakah confining unit
Todilto Limestone aquifer1
Entrada aquifer 1 <20
Lead (Pb)
19
<5
8
4
11
-
-
-
-
__
1 50
Mercury Selenium (Hg) (Se)
19 20 (25) <0.1-0.3 <l-27
-
8 9 (89) <0.1 0.01-250 <0.1 2
1 2 (100) <0.1 21-40
30
-
_
__ _
; :2 2
<0.3
1Not a regional hydrogeologic aquifer.
52
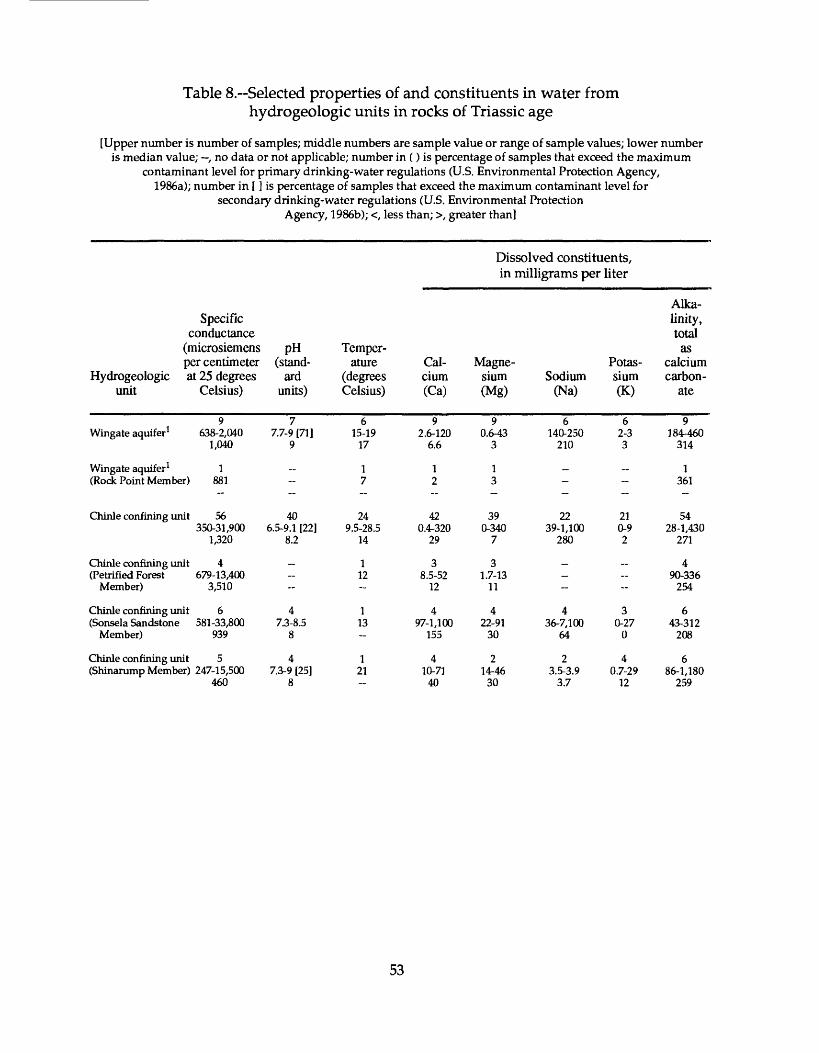
Table 8. Selected properties of and constituents in water from hydrogeologic units in rocks of Triassic age
[Upper number is number of samples; middle numbers are sample value or range of sample values; lower numberis median value; , no data or not applicable; number in () is percentage of samples that exceed the maximum
contaminant level for primary drinking-water regulations (U.S. Environmental Protection Agency,I986a); number in [ ] is percentage of samples that exceed the maximum contaminant level for
secondary drinking-water regulations (U.S. Environmental ProtectionAgency, 1986b); <, less than; >, greater than]
Dissolved constituents, in milligrams per liter
Specific conductance
(microsiemens per centimeter
Hydrogeologic at 25 degrees unit Celsius)
9 Wingate aquifer1 638-2,040
1,040
Wingate aquifer1 1 (Rock Point Member) 881
Chinle confining unit 56 350-31,900
1,320
Chinle confining unit 4 (Petrified Forest 679-13,400
Member) 3,510
Chinle confining unit 6 (Sonsela Sandstone 581-33,800
Member) 939
Chinle confining unit 5 (Shinarump Member) 247-15,500
460
PH (stand
ard units)
7 7.7-9 [71]
9
-
40 6.5-9.1 [22]
8.2
4 7.3-8.5
8
4 7.3-9 [25]
8
Temper ature
(degrees Celsius)
6 15-19
17
1 7
24 9.5-28.5
14
1 12
1 13
1 21
Cal cium(Ca)
9 2.6-120
6.6
1 2
42 0.4-320
29
3 8.5-52
12
4 97-1,100
155
4 10-71
40
Magne sium (Mg)
9 0.6-43
3
1 3
39 0-340
7
3 1.7-13
11
4 22-91
30
2 14-46
30
Sodium(Na)
6 140-250
210
-
22 39-1,100
280
-
4 36-7,100
64
2 3.5-3.9
3.7
Potas sium (K)
62-3 3
~
21 0-9 2
3 0-27
0
4 0.7-29
12
Alkalinity, totalas
calcium carbon
ate
9 184-460
314
1 361
54 28-1,430
271
4 90-336
254
6 43-312
208
6 86-1,180
259
53

Table 8. Selected properties of and constituents in water from hydrogeologic units in rocks of Triassic age Continued
Dissolved constituents, in micrograms per liter
Hydrogeologic Sulfate unit (SO4)
9 Wingate aquifer1 47-580 [22]
120
Wingate aquifer1 1 (Rock Point Member) 77
Chinle confining unit 46 14-2,600 [39]
200
Chinle confining unit 3 (Petrified Forest 64-580 [67]
Member) 510
Chinle confining unit 4 (Sonsela Sandstone 21-1,000 [25]
Member) 150
Chinle confining unit 4 (Shinarump Member) 1 0-1 40
29
Chloride (Cl)
9 11-310 [11]
34
1 33
57 4-12,000 [19]
53
4 34-4,600 [75]
575
5- 6.4-35
16
5 3.6-66
12
Fluoride (F)
9(22) 0.3-7 [22]
1
1 1.2
36(5) 0-6.2 [19]
0.5
3 02-23 [33]
0.7
4 02-0.4
0.3
5 0.1-1.4
0.5
Dis solvedsolids, sum ofconstit uents
9 390-1,220 [78]
689
1 559 [100]
32 218-3,070 [66]
725
3 398-2,460 [67]
1,790
4 429-22,300 [75]
580
4 187-623 [25]
247
Nitrate (N03)
9 0.2-4.5
0.5
1 1.9
36 0-43
14
3 0.11-2.1
0.25
3(33) 0-17 0.14
-
Arsenic Barium (As) (Ba)
-
_
3(67) 1 0-520 <100 190
1 1 15 660
-
Bonn (B)
-
-
1 820C
1 2,60C
2 80-490
285
54

Table 8.~Selected properties of and constituents in water from hydrogeologic units in rocks of Triassic age Concluded
Dissolved constituents, in micrograms per liter
Hydrogeologic unit
Cadmium (Cd)
Chromium (Cr)
Lead (Pb)
Mercury (Hg)
Selenium (Se)
Wingate aquifer1
Wingate aquifer1 (Rode Point Member)
Chinle confining unit 1 2
Chinle confining unit (Petrified Forest
Member)
Chinle confining unit 1(Sonsela Sandstone >0
Member) -
Chinle confining unit (Shinarump Member)
1>0
1>0
1>0
2(50) 1-41 21
1(100) 11
J Not a regional hydrogeologic aquifer.
55
to U.S. GOVERNMENT PRINTING OFFICE: 1996 - 776-243 / 25007 REGION NO. 8
Top Related