


Languages
Pages
Legal


Int. J. Electrochem. Sci., 7 (2012) 3750 - 3764
International Journal of
ELECTROCHEMICAL SCIENCE
www.electrochemsci.org
Study on Hydrogen Evolution Reaction at a Graphite Electrode
in the All-Vanadium Redox Flow Battery
Fuyu Chen, Jianguo Liu, Hui Chen, Chuanwei Yan*
State Key Laboratory for Corrosion and Protection, Institute of Metal Research, Chinese Academy of
Sciences, 62 Wencui Road, Shenyang 110016, China *E-mail: [email protected]
Received: 15 September 2011 / Accepted: 3 December 2011 / Published: 1 April 2012
The hydrogen evolution reaction in the negative half-cell of a vanadium redox battery is studied at a
graphite electrode. Hydrogen evolution behavior is included by potentiostatic method. It is found that
volume of hydrogen evolution goes up linearly at the first stage and then increases slowly at different
polarization potential, concentration of sulfuric acid and V3+
. The reason is adsorption hydrogen on
graphite surface, with a trend toward an increase in electrical resistance and a decrease in the active
surface area. The surface morphology and structural properties of graphite are investigated by scanning
electron microscope (SEM) and X-ray photoelectron spectroscopy (XPS). The electrochemical
performance of graphite is observed using cyclic voltammetry and impedance spectroscopy (EIS). It is
shown that hydrogen evolution reaction changes surface morphology and introduces some defect sites
on the surface of graphite. The electrochemical activity of graphite towards V3+
/V2+
couple becomes
less easily after hydrogen evolution treatment.
Keywords: hydrogen evolution; graphite; electrochemical activity; vanadium battery
1. INTRODUCTION
Redox flow batteries (RFBs) are electrochemical energy storage devices that utilize the
oxidation and reduction of soluble redox couples for charging and discharging. RFBs have several
advantages [1-4] over some of the established conventional secondary batteries: long cycle life and
relatively easily maintained; high battery efficiency; environmental friendly; deeply discharged
without harm to the battery. So the RFB is thought to be ranked as the most promising one for the
application of large scale energy storage among the electrochemical storage systems [5-6]. They are
appropriate for load leveling, uninterruptible power supply and distributed renewable power plants
such as solar power plants and wind power plants.

Int. J. Electrochem. Sci., Vol. 7, 2012
3751
Since the RFB concept was first proposed by Thaller [7] in 1974, several types of redox flow
batteries have been developed [8-9]. For example, all-vanadium redox flow battery (VRB) system,
which received considerable attention during the last years [10-13], employed two redox couples of
VO2+/VO
2+ and V
3+/V
2+ as the positive and the negative electrode active materials, respectively. The
positive and the negative electrolyte which containing VO2+/VO
2+ and V
3+/V
2+ active materials are
stored in each electrolyte tanks and flowed through the electrode compartment by pumps. The capacity
of the system is determined by the volume of the electrolyte tanks, while the system power is
determined by the size of the stacks and the active electrode surface area. In contrast to usual
secondary batteries which using solid active materials, VRB has a long cycle life and relatively large
capacitance.
Despite these advantages, the vanadium redox flow battery has not been widely exploited to
date. One disadvantage of the system developed to date is the imbalance in capacity losses of the
positive and negative half-cell caused by oxygen and hydrogen evolution in electrode compartments.
Gas evolving reactions are consuming a portion of the current applied to the cell, reducing active
surface area for reaction [3], which speeds up charge and discharge imbalances and finally leads to
declining of coulombic efficiency, energy efficiency and the capacity after repetitious systemic
circulation of the battery. Therefore, it is important to understand the factors affecting the performance
of gas evolution reaction for acceptable performance and longevity of the cell.
In this paper, behavior of hydrogen evolution at a graphite electrode was studied at the first
section. Secondly, general surveys for the surfaces microstructure characterizations, structural
properties and electrochemical performance of before and after hydrogen evolution treatment samples
were reviewed. These experiments aimed to provide a preliminary indication of the relative
performance of hydrogen evolution reaction.
2. EXPERIMENTAL
2.1. Electrolytes
Electrolytic solutions were prepared by fully discharging of VO2+
solution to V3+
in the
negative half-cell of a vanadium redox cell. The electrolytic for cyclic voltammetry and
electrochemical impedance spectroscopy were 0.1M V3+
+ 1M H2SO4. All chemicals were analytical
reagent grade.
2.2. Hydrogen evolution measurements
The graphite electrodes with a surface area of 1.33 cm2 (spectroscopically pure) were polished
with 2000 CCR/R silicon carbide polishing paper and polishing cloth, followed successively by 10 min
ultrasonic cleaning and then rinsed thoroughly with distilled water. The onset of hydrogen evolution on
graphite fiber electrode occurs at −0.7 V (vs. SCE) in 1 M sulfuric acid [14]. Therefore, the hydrogen
collection experiments were studied at different negative polarization potentials (started from −0.7 V),

Int. J. Electrochem. Sci., Vol. 7, 2012
3752
concentration of sulfuric acid and V3+
electrolytic. Hydrogen evolution was gathered by the drainage
method. Three-electrode electrochemical cell and gas collection device were shown in Fig. 1.
Figure 1. Electrolytic cell and gas collection device
Electric quantity consumed by reaction of V3+
→V2+
was achieved by definite integral of
current-time curve subtracted electric quantity consumed by hydrogen evolution under given potential.
The coulombic efficiency of V3+
→V2+
reaction was obtained by electric quantity consumed by the
reaction divided electric quantity of definite integral of current-time curve under given potential as
shown in Eq. (1, 2, 3).
Q = I×t = t
Idt0
(1)
QH2 = 22.4
V 2H ×nF (2)
ηV3+→V2+= Q
Q-Q 2H ×100% (3)
2.3. Characterization of graphite electrode
The surface morphology of the graphites was examined using a XL30FEG scanning electron
microscope (SEM) (FEI Company Inspect F, Japan). X-ray photoelectron spectroscopy (XPS)
measurements were performed in an ultra-high vacuum set-up equipped with Al K X-ray source

Int. J. Electrochem. Sci., Vol. 7, 2012
3753
generated at 15 kV and 10mA employing ESCA-LAB250 surface analysis system. The base pressure
in the measurement chamber was about 6.0×10⁻⁸
mbar.
2.4. Electrochemical measurements
The electrochemical measurements were performed using a Princeton Applied Research (PAR)
EG&G potentiostat model 273 and EG&G5210 lock-in amplifier with M398 testing software. All
electrochemical measurements were conducted using a conventional three-electrode electrochemical
cell with graphite as working electrode, a platinum plate as auxiliary electrode and a saturated calomel
(SCE) as reference electrode. The scan rate of cyclic voltammetry was 50 mV·s−1
. The signal
amplitude of EIS was 5 mV and the frequency ranged between 1.0E-2 Hz and 1.0E-5 Hz. All the
electrochemical measurements were conducted at room temperature.
3. RESULTS AND DISCUSSION
3.1. Hydrogen evolution behavior
The variation in hydrogen evolution volume with time and the coulombic efficiency of
V3+
→V2+
reaction on graphite electrodes at different negative polarization potentials are shown in Fig.
2. The hydrogen evolution rate becomes more significant with increasing of polarization potential (Fig.
2(a)). At a given polarization potential, the rate of hydrogen evolution goes up linearly at the first stage
and then changes slowly as time up to 10h at each polarization potential. The reason may be caused by
adsorption hydrogen on graphite surface which reduces active area and increases the electrical
resistance of electrode [15-16]. The adsorption hydrogen atoms combine with each other and form gas
of hydrogen. Characteristic of gas evolving cells is the formation of gas bubbles. The presence of the
bubbles reduces active surface area of electrode [3], thus restrains reaction of hydrogen evolution. The
behavior of hydrogen evolution at potential of −1.0 V is quite different, the reason may be caused by
adsorption atomic hydrogen reacts with carbon and forms hydrocarbon leaving the surface of graphite
which decreases adsorption hydrogen on the surface of graphite [17]. The coulombic efficiency
reduces gradually corresponding to different negative potentials is presented in Fig. 2(b), which
suggests that the decrease of coulombic efficiency is consistent with hydrogen evolution volume.
Hydrogen evolution behavior and coulombic efficiency at polarization potential of −0.9 V in
different concentration of sulfuric acid (0.1M V3+
) is shown in Fig. 3. The performance is similar with
that of different negative potential. The volume of hydrogen evolution has the maximal values in 1M
sulfuric acid and the condition corresponds to the minimal coulombic efficiency for V3+
→V2+
reaction.
As the concentration of sulfuric acid increased (less than 1M), the contents of H+ on the surface of
electrode is increased, the reaction rate of H+ speeds up accordingly. Therefore, the volume of
hydrogen evolution increases. At the same time, the viscosity of electrolyte goes up with increasing
concentration of sulfuric acid. When the concentration of sulfuric acid exceeds 1M, the diffusion rate
of H+ reduces which results in slow rate of hydrogen evolution. The variation of hydrogen evolution

Int. J. Electrochem. Sci., Vol. 7, 2012
3754
volume is consistent with coulombic efficiency for V3+
→V2+
reaction. Fig.4 shows hydrogen evolution
behavior and coulombic efficiency at potential of −0.9V in different concentration of V3+
(1M H2SO4).
The hydrogen evolution volume decreases gradually and the coulombic efficiency of V3+
→V2+
reaction increases as the concentration of V3+
added. The reason is that increasing of concentration of
V3+
accelerates the reaction rate of V3+
→V2+
while restrains the reaction of hydrogen evolution at the
fixed graphite electrode.
0 100 200 300 400 500 600
0
20
40
60
80
100
(a)
0 100 200 300 400 500 600 700
0
2
4
6
8
10
12
14
- 0.7 V
- 0.8 V
- 0.9 V
- 1.0 VVH
2/m
L
Time/min
-0.70 -0.75 -0.80 -0.85 -0.90 -0.95 -1.00
20
30
40
50
60
70
80
Co
ulo
mb
eff
icie
ncy
/%
Potential/V
(b)
Figure 2. Hydrogen evolution behavior(a) and coulombic efficiency(b) at different negative potentials
in 0.1M V3+
+2M H2SO4

Int. J. Electrochem. Sci., Vol. 7, 2012
3755
0 100 200 300 400 500 600 700
0
5
10
15
20
25
30
0.5M H2SO4
1M H2SO4
2M H2SO4
3M H2SO4
VH
2/m
L
Time/min
(a)
0.5 1.0 1.5 2.0 2.5 3.0
60
65
70
75
80
85
Co
ulo
mb
eff
icie
ncy
/%
Concentration of H2SO4/M
(b)
Figure 3. Hydrogen evolution behavior(a) and coulombic efficiency(b) at potential of −0.9 V in
different concentration of sulfuric acid(0.1M V3+
)

Int. J. Electrochem. Sci., Vol. 7, 2012
3756
0 100 200 300 400 500 600 700
0
5
10
15
20
25
30
blank
0.1M V3+
0.2M V3+
0.5M V3+
VH
2/m
L
Time/min
(a)
0.0 0.1 0.2 0.3 0.4 0.5
0
20
40
60
80
100
Co
ulo
mb
eff
icie
ncy
/%
Concentration of V3+
/M
(b)
Figure 4. Hydrogen evolution behavior(a) and coulombic efficiency(b) at potential of −0.9 V in
different concentration of V3+
(1M H2SO4)

Int. J. Electrochem. Sci., Vol. 7, 2012
3757
3.2. Microstructure characterizations and structural properties
The surface morphology of the graphites electrode both before and after potentiostatic cathodic
polarization is illustrated in the Fig. 5.
Figure 5. Scanning electron micrograph for graphites electrode before and after potentiostatic cathodic
polarization: (a), (b) pristine; (c), (d)−0.9 V-10h; (e); (f)−1.0 V-10h.
b
d
e f
a
c
Int. J. Electrochem. Sci., Vol. 7, 2012
3758
It is clear that there is little difference in the surface condition of the pristine and treatment
samples shown in Fig. 5(a), (c), (e). The result reveals that hydrogen evolution does not lead to
corrosion of graphite obviously.
From the high magnification images shown in Fig. 5(b), (d), (f), the physical state of the
surface for the graphite after hydrogen evolution treatment becomes rough, and the rough degree
increases with the increase of the negative potential on the electrodes. This indicates that hydrogen
evolution changes the surface microstructure of graphite and introduces some defect sites on the
graphite surface by the potentiostatic cathodic polarization.
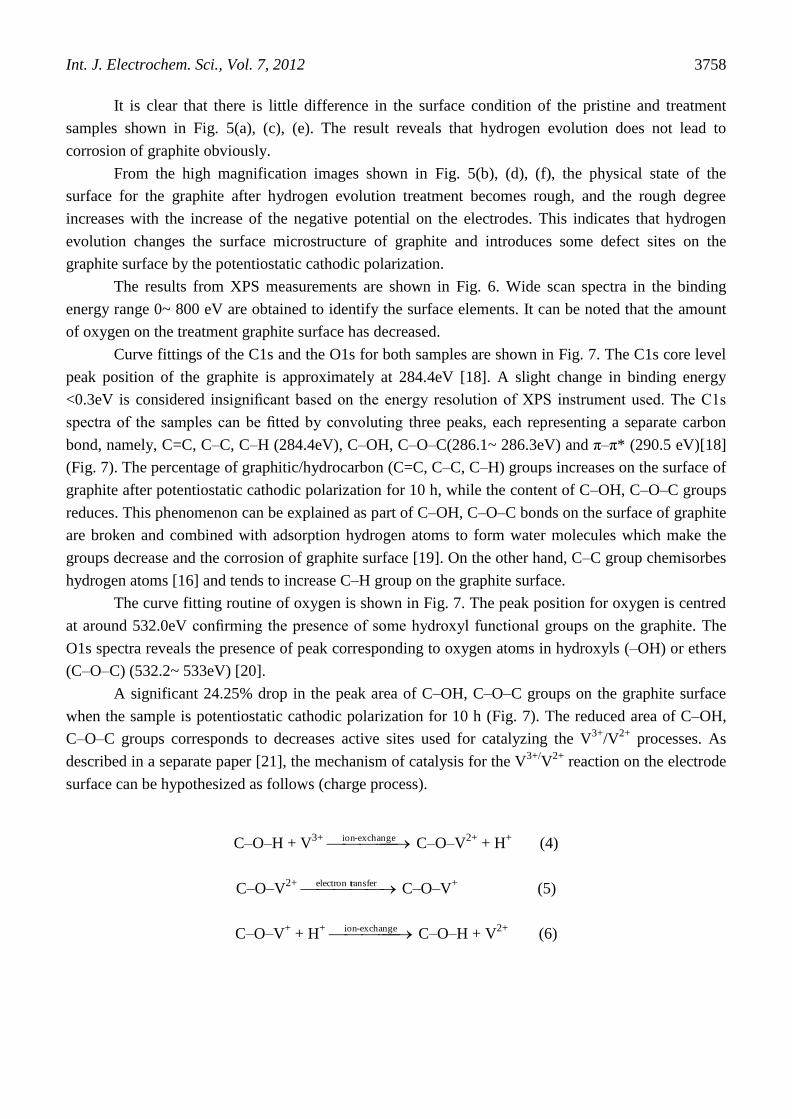
The results from XPS measurements are shown in Fig. 6. Wide scan spectra in the binding
energy range 0~ 800 eV are obtained to identify the surface elements. It can be noted that the amount
of oxygen on the treatment graphite surface has decreased.
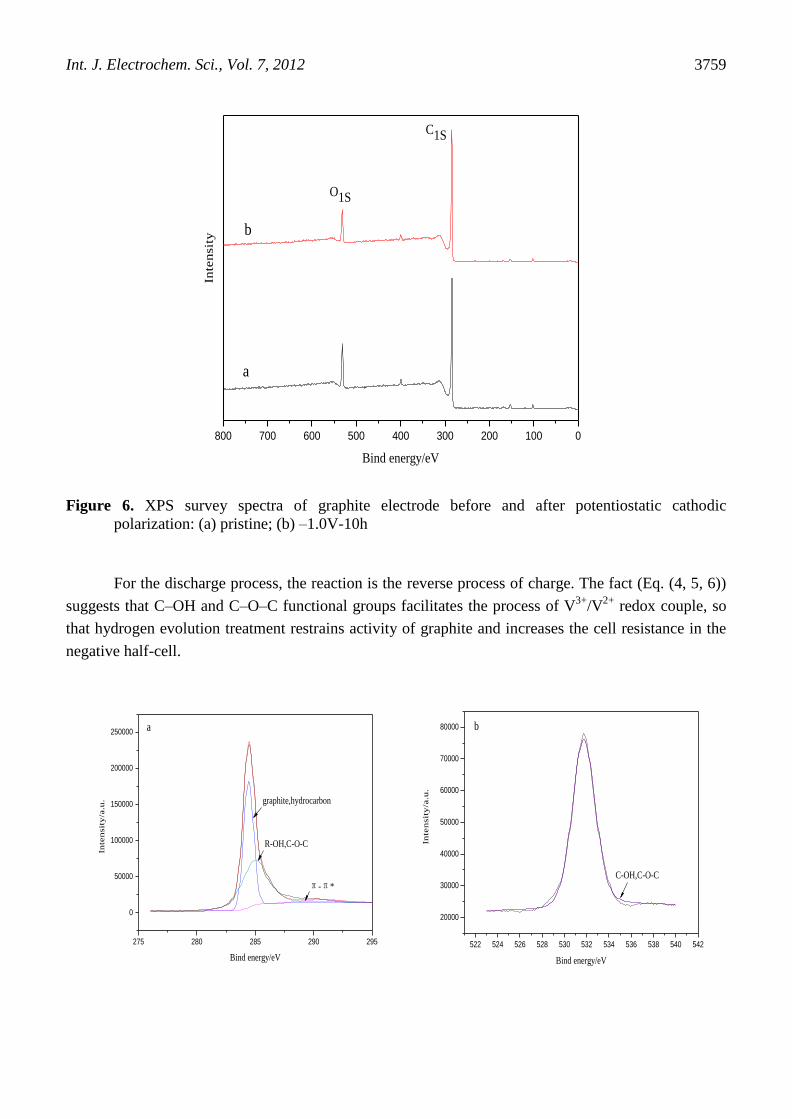
Curve fittings of the C1s and the O1s for both samples are shown in Fig. 7. The C1s core level
peak position of the graphite is approximately at 284.4eV [18]. A slight change in binding energy
<0.3eV is considered insignificant based on the energy resolution of XPS instrument used. The C1s
spectra of the samples can be fitted by convoluting three peaks, each representing a separate carbon
bond, namely, C=C, C–C, C–H (284.4eV), C–OH, C–O–C(286.1~ 286.3eV) and π–π* (290.5 eV)[18]
(Fig. 7). The percentage of graphitic/hydrocarbon (C=C, C–C, C–H) groups increases on the surface of
graphite after potentiostatic cathodic polarization for 10 h, while the content of C–OH, C–O–C groups
reduces. This phenomenon can be explained as part of C–OH, C–O–C bonds on the surface of graphite
are broken and combined with adsorption hydrogen atoms to form water molecules which make the
groups decrease and the corrosion of graphite surface [19]. On the other hand, C–C group chemisorbes
hydrogen atoms [16] and tends to increase C–H group on the graphite surface.
The curve fitting routine of oxygen is shown in Fig. 7. The peak position for oxygen is centred
at around 532.0eV confirming the presence of some hydroxyl functional groups on the graphite. The
O1s spectra reveals the presence of peak corresponding to oxygen atoms in hydroxyls (–OH) or ethers
(C–O–C) (532.2~ 533eV) [20].
A significant 24.25% drop in the peak area of C–OH, C–O–C groups on the graphite surface
when the sample is potentiostatic cathodic polarization for 10 h (Fig. 7). The reduced area of C–OH,
C–O–C groups corresponds to decreases active sites used for catalyzing the V3+
/V2+
processes. As
described in a separate paper [21], the mechanism of catalysis for the V3+/
V2+
reaction on the electrode
surface can be hypothesized as follows (charge process).
C–O–H + V3+
exchange-ion C–O–V
2+ + H
+ (4)
C–O–V2+
ransfer electron t
C–O–V+ (5)
C–O–V+ + H
+
exchange-ion C–O–H + V2+
(6)
Int. J. Electrochem. Sci., Vol. 7, 2012
3759
800 700 600 500 400 300 200 100 0
O1S
C1S
Inte
nsit
y
Bind energy/eV
a
b
Figure 6. XPS survey spectra of graphite electrode before and after potentiostatic cathodic
polarization: (a) pristine; (b) –1.0V-10h
For the discharge process, the reaction is the reverse process of charge. The fact (Eq. (4, 5, 6))
suggests that C–OH and C–O–C functional groups facilitates the process of V3+
/V2+
redox couple, so
that hydrogen evolution treatment restrains activity of graphite and increases the cell resistance in the
negative half-cell.
275 280 285 290 295
0
50000
100000
150000
200000
250000
π-π*
R-OH,C-O-C
graphite,hydrocarbon
Inte
nsit
y/a
.u.
Bind energy/eV
a
522 524 526 528 530 532 534 536 538 540 542
20000
30000
40000
50000
60000
70000
80000
Inte
nsit
y/a
.u.
Bind energy/eV
b
C-OH,C-O-C
Int. J. Electrochem. Sci., Vol. 7, 2012
3760
275 280 285 290 295
0
50000
100000
150000
200000
250000
Inte
nsit
y/a
.u.
Bind energy/eV
c
525 528 531 534 537 540
20000
30000
40000
50000
60000
70000
80000
Inte
nsit
y/a
.u.
Bind energy/eV
d
Figure 7. XPS general spectra and curve-fit of C1s and O1s spectra from the as-received graphite
before and after potentiostatic cathodic polarization: (a), (b) pristine; (c), (d) –1.0V-10h.
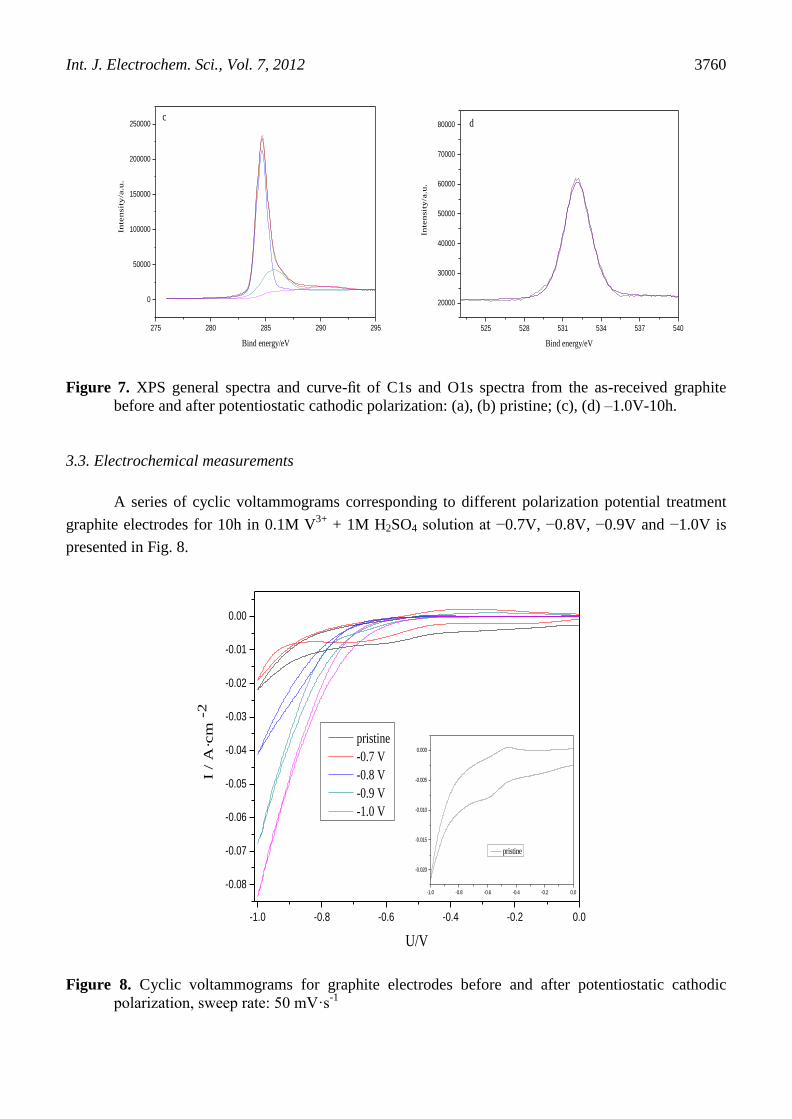
3.3. Electrochemical measurements
A series of cyclic voltammograms corresponding to different polarization potential treatment
graphite electrodes for 10h in 0.1M V3+
+ 1M H2SO4 solution at −0.7V, −0.8V, −0.9V and −1.0V is
presented in Fig. 8.
-1.0 -0.8 -0.6 -0.4 -0.2 0.0
-0.08
-0.07
-0.06
-0.05
-0.04
-0.03
-0.02
-0.01
0.00
-1.0 -0.8 -0.6 -0.4 -0.2 0.0
-0.020
-0.015
-0.010
-0.005
0.000
pristine
I /
A·c
m -
2
U/V
pristine
-0.7 V
-0.8 V
-0.9 V
-1.0 V
Figure 8. Cyclic voltammograms for graphite electrodes before and after potentiostatic cathodic
polarization, sweep rate: 50 mV·s-1

Int. J. Electrochem. Sci., Vol. 7, 2012
3761
The oxidation and reduction peak of V3+
/V2+
couple can be detected at pristine graphite
electrode between the sweeping voltage ranges of −1.0~ 0V. As the separation of two peaks is more
than 60mV, the reaction of V3+
/V2+
couple is irreversible at the pristine graphite electrode. After the
graphites are treated with 10h of cathodic polarization treatment, the electrochemical activity towards
V3+
/V2+
couple becomes less easily while the reaction of hydrogen evolution takes place more
favorable gradually. It can be ascribed to the decrease of ethers (C−O−C) and hydroxyl (−OH)
functional groups on the graphite surface. The two functional groups behave as active sites that are
supposed to catalyze the V3+
/V2+
processes [21-22]. This is in agreement with the result from the XPS.
Therefore, hydrogen evolution not only consumes a portion of the current applied to the cell but also
restrains reaction activity of V3+
/V2+
couple.
0 20 40 60 80 100 120 140 160
0
-20
-40
-60
-80
-100
-120
-140
-160
0 20 40 60 80 100 120 140 160
0
-20
-40
-60
-80
-100
-120
-140
-160
0 2 4 6 8 10
0
-2
-4
-6
-8
-10
0 2 4 6 8 10
0
-2
-4
-6
-8
-10
pristine
-0.7 V
-0.8 V
-0.9 V
-1.0 V
Fit Result
z''/Ω
·cm
2
z'/Ω·cm2
(a)
1 0-2
1 0-1
1 00
1 01
1 02
1 03
1 04
1 05
0
-1 0
-2 0
-3 0
-4 0
-5 0
-6 0
-7 0
-8 0
1 0-2
1 0-1
1 00
1 01
1 02
1 03
1 04
1 05
0
-1 0
-2 0
-3 0
-4 0
-5 0
-6 0
-7 0
-8 0
Ph
as
e/d
eg
F r e q u e n c e /H z
1 0-2
1 0-1
1 00
1 01
1 02
1 03
1 04
1 05
1 00
1 01
1 02
1 0-2
1 0-1
1 00
1 01
1 02
1 03
1 04
1 05
1 00
1 01
1 02
p r i s t in e
- 0 .7 V
- 0 .8 V
- 0 .9 V
- 1 .0 V
F i t R e s u l t|z
|/Ω·
cm
2
F r e q u e n c e /H z
(b)
Figure 9. EIS plots for graphite electrodes before and after potentiostatic cathodic polarization at
polarization potential of −0.5 V vs. SCE: (a)Nyquist plots; (b)Bode plots
Figure 10. Equivalent circuits proposed for fitting of EIS plots in Fig. 9, Rs is the electrolyte
resistance, Rt is the charge transfer resistance, corresponding to resistance of electrode reaction,
CPE1 is the constant-phase element used to replace Cp, the double layer capacitance, Rad is the
adsorption resistance, corresponding to resistance of adsorption hydrogen, CPE2 is the
constant-phase element used to replace Cad, the adsorption capacitance.

Int. J. Electrochem. Sci., Vol. 7, 2012
3762
pristine -0.7 V -0.8 V -0.9 V -1.0 V
0
2
4
6
8
10
12
14
Lo
g R
ad
/Ω·
cm
2
Rt
Rad
Lo
g R
t/Ω·
cm
2
Potential/V
Figure 11. Fitting parameters of Rt and Rad before and after potentiostatic cathodic polarization
EIS diagrams for graphite electrodes before and after treatment at polarization potential of
−0.5V are presented in Fig. 9. In 0.1M V3+
+ 1M H2SO4 solution, the impedance spectra exhibits two
capacitive features. According to cyclic voltammograms in Fig. 8, both V3+
/V2+
and H+/H2 couples
react on the electrode at the potential of −0.5V. The reaction of V3+
/V2+
couple is the major reaction on
the pristine graphite electrode, while H+/H2 reaction becomes more important on treatment graphite
electrodes. So, the high frequency capacitive feature could be attributed to the charge transfer for
V3+
/V2+
and H+/H2 couples, and the low frequency corresponds to adsorption of intermediates [23].
Plots in Fig. 9 can be described using the equivalent circuit shown in Fig. 10.
As shown in Fig. 9(a), it is remarkable that the diameters of semicircles in high frequency
increase with the polarization potential from pristine to −1.0V, which suggests the increase in the
charge transfer resistance (Fig. 11) caused by adsorption of hydrogen atoms. The result validates that
electrical resistance of graphites are increased after the potentiostatic cathodic polarization and the
values are proportional to the adsorption hydrogen content. The phase angles in high frequency in the
Bode plots (Fig. 9(b)) are related to the electrical double layer, and gradually increase from
approximately -25º to -77º from pristine to −1.0V treatment. The value from -25º to -45º corresponds
to a porous and highly inhomogeneous surface. For the −1.0V treatment electrode a phase angle of -
77º can be calculated, this value may be indicating that adsorption of hydrogen atoms on the electrode
surface which blocks the electroactive pores and cavities, so that the electrode behaves like a flat
homogeneous surface [24] which indicates a decrease in the reaction rate on the electrode surface.
The capacitive loops in the low frequency correspond to adsorption of hydrogen atoms [23].
The diameters of semicircles increase with the treatment potential from pristine to −1.0V, which
suggests the decrease of the adsorption atoms of hydrogen on the electrode surface. The reason is that

Int. J. Electrochem. Sci., Vol. 7, 2012
3763
active surface area tends to reduce after potentiostatic cathodic polarization. The Bode plots (Fig. 9(b))
in the low frequency presents adsorption capacitive semicircles. The phase angles move to low
frequency from pristine to −1.0V treatment, which indicates that resistance of adsorption intermediates
increase gradually (Fig. 11). This could be validated by the value of |Z| in the low frequency, which
increases from 22 to 158Ω•cm2 from pristine to −1.0V negative potentials treatment electrodes.
4. CONCLUSIONS
The volume of hydrogen evolution on graphite electrode is notably dependent on the
polarization potential, concentration of sulfuric acid and the concentration of V3+
. At a given
concentration of sulfuric acid and V3+
, the volume of hydrogen evolution increases with higher
cathodic polarization potential and at a given polarization potential and concentration of sulfuric acid,
the volume of hydrogen evolution decreases with the concentration of V3+
increased. At a given
polarization potential and the concentration of V3+, the volume of hydrogen evolution has the
maximal values in 1M sulfuric acid. The variation of coulombic efficiency is consistent with the
volume of hydrogen evolution.
Hydrogen evolution reaction occurs on the graphite electrode can lead to adsorption of
hydrogen atoms on the surface of graphite which increases the electrical resistance of graphite and the
values are proportional to the adsorption hydrogen content. The functional groups of C–OH and C–O–
C on the surface of graphite combine with adsorption hydrogen atoms and then form water molecules
which make the decrease of the amount of C–OH and C–O–C and the corrosion of graphite surface.
The decrease of the amount of functional groups restrains the electrochemical activity towards V3+
/V2+
couple.
ACKNOWLEDGEMENT
Funding for this research was provided by the Key Basic Research Program (973) of China
(2010CB227203).
References
1. H. Al-Fetlawi, A. A. Shah and F. C. Walsh, Electrochim. Acta 55 (2009) 78
2. H. Al-Fetlawi, A. A. Shah and F. C. Walsh, Electrochim. Acta 55 (2010) 3192
3. A.A. Shah, H. Al-Fetlawi and F. C. Walsh, Electrochim. Acta 55 (2010) 1125
4. A.Hazza, D. Pletcher and R. Wills, J. Powe Sources 149 (2005) 103
5. C. Ponce de León, A. Frías-Ferrer, J. González-García, D. A. Szánto and F. C. Walsh, J. Power
Sources 160 (2006) 716
6. Ch. Fabjan, J. Garche, B. Harrer, L. Jo¨rissen, C. Kolbeck, F. Philippi, G. Tomazic and F. Wagner,
Electrochim. Acta 47 (2001) 825
7. L. H. Thaller, US Patent 3,996,064, US, 1976
8. Y. H. Wen, J. Cheng, H. M. Zhang and Y. S. Yang, Batttery Bimonthly 38 (2008) 247
9. M. H. Chakrabarti, R. A. W. Dryfe and E. P. L. Roberts, Electrochim. Acta 52 (2007) 2189
10. M. Rychcik and M. Skyllas-Kazacos, J. Power Sources 22 (1988) 59

Int. J. Electrochem. Sci., Vol. 7, 2012
3764
11. E. Sum, M. Rychcik and M. Skyllas-Kazacos, J. Power Sources 16 (1985) 85
12. S. Zhong and M. Skyllas-Kazacos, J. Power Sources 39 (1992) 1
13. G. Oriji, Y. Katayama and T. Miura, Electrochim. Acta 49 (2004) 3091
14. L. Nacamulli and E. Gileadi, J. Appl. Electrochem. 12 (1982) 73
15. M. L. Studebaker, Rubber Chem. Technol. 30 (1957) 1401
16. D. M. Chen, T. Ichikawa, H. Fujii, N. Ogita, M. Udagawa, Y. Kitano and E. Tanabe, J. Alloys
Compd. 354 (2003) L5
17. B. Mccarroll and D. W. Mckee, Carbon 9 (1971) 301
18. R. I. R. Blyth, H. Buqa, F. P. Netzer, M. G. Ramsey, J. O. Besenhard, P. Golob and M. Winter,
Appl. Surf. Sci. 167 (2000) 99
19. A.Jelea, F. Marinelli, Y. Ferro, A. Allouche and C. Brosset, Carbon 42 (2004) 3189
20. K. Laszlo, E. Tombacz and K. Josepovits, Carbon 39 (2001) 1217
21. B. Sun, M and Skyllas-Kazacos, Electrochim. Acta 37 (1992) 2459
22. L. Yue, W. Li, F. Sun, L. Zhao and L. Xing, Carbon 48 (2010) 3079
23. X. Jiang, Acta physico-chimica sinica 9 (1993) 129
24. E. B. Castro, M. J. de Giz, E. R. Gonzalez and J. R. Vilche, Electrochim. Acta 42 (1997) 951
© 2012 by ESG (www.electrochemsci.org)
Top Related