


Languages
Pages
Legal


Portfolio Investment
Optimisation
Stuart Cassie
Defence Estate And Base Services Summit
21 September 2016
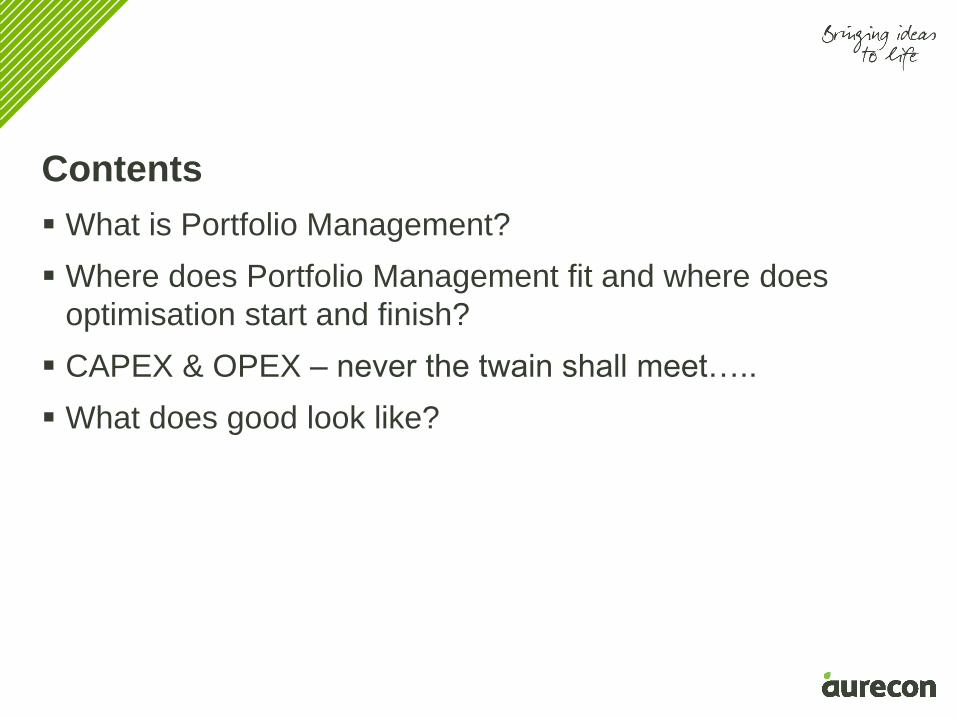
What is Portfolio Management?
Where does Portfolio Management fit and where does
optimisation start and finish?
CAPEX & OPEX – never the twain shall meet…..
What does good look like?
Contents

What is Portfolio
Management?
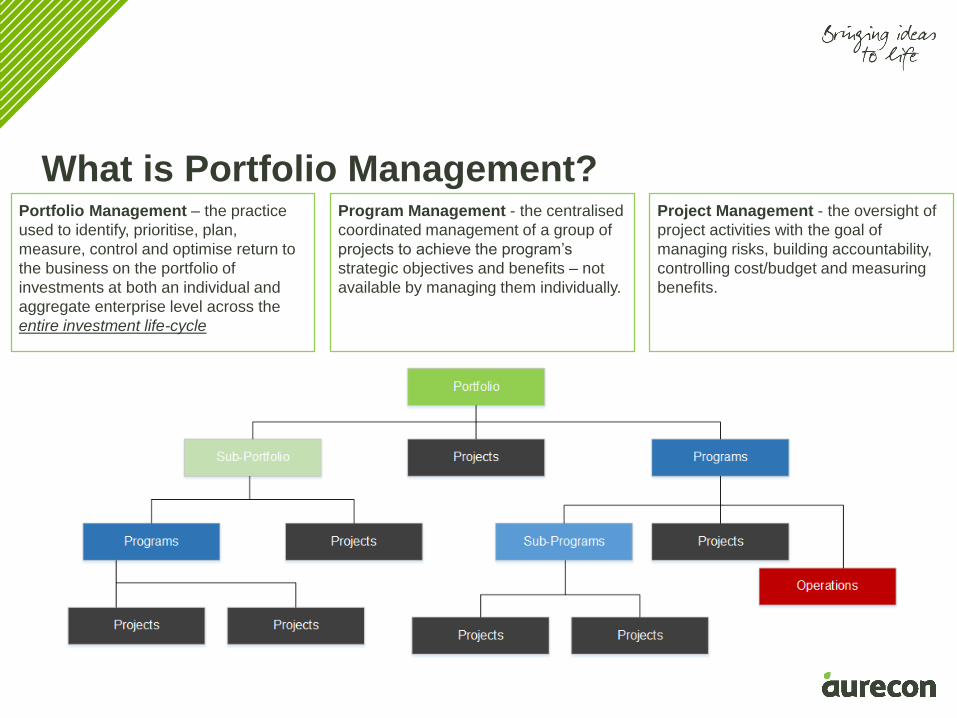
What is Portfolio Management?Portfolio Management – the practice
used to identify, prioritise, plan,
measure, control and optimise return to
the business on the portfolio of
investments at both an individual and
aggregate enterprise level across the
entire investment life-cycle
Program Management - the centralised
coordinated management of a group of
projects to achieve the program’s
strategic objectives and benefits – not
available by managing them individually.
Project Management - the oversight of
project activities with the goal of
managing risks, building accountability,
controlling cost/budget and measuring
benefits.
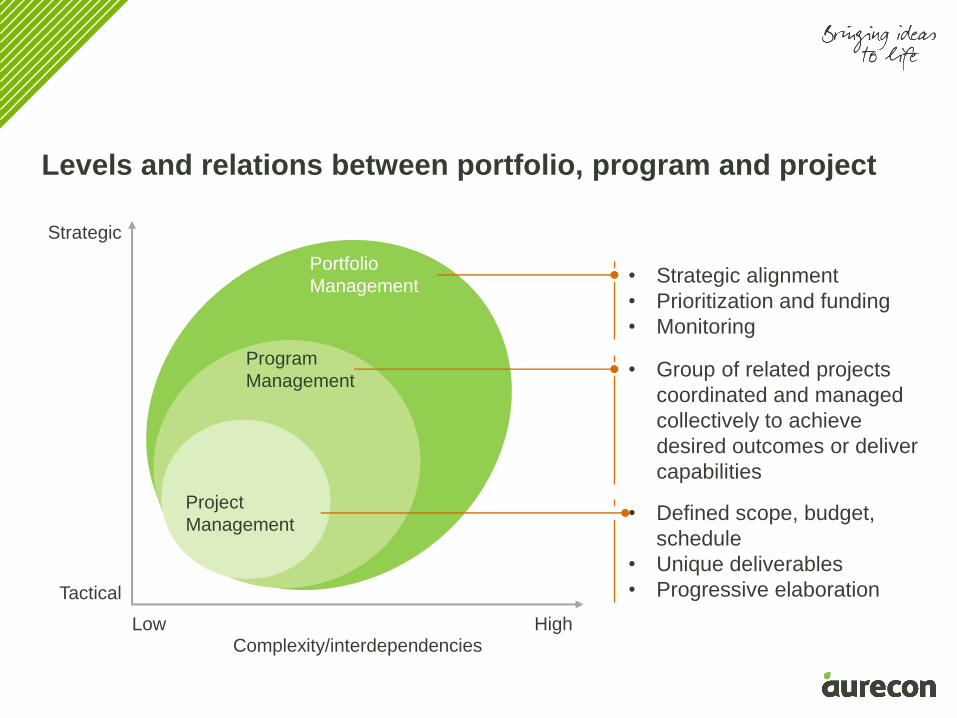
Levels and relations between portfolio, program and project
Tactical
Strategic
HighComplexity/interdependencies
Low
Portfolio
Management
Program
Management
Project
Management
• Strategic alignment
• Prioritization and funding
• Monitoring
• Group of related projects
coordinated and managed
collectively to achieve
desired outcomes or deliver
capabilities
• Defined scope, budget,
schedule
• Unique deliverables
• Progressive elaboration
Where does Portfolio
Management fit and
where does
optimisation start and
finish?
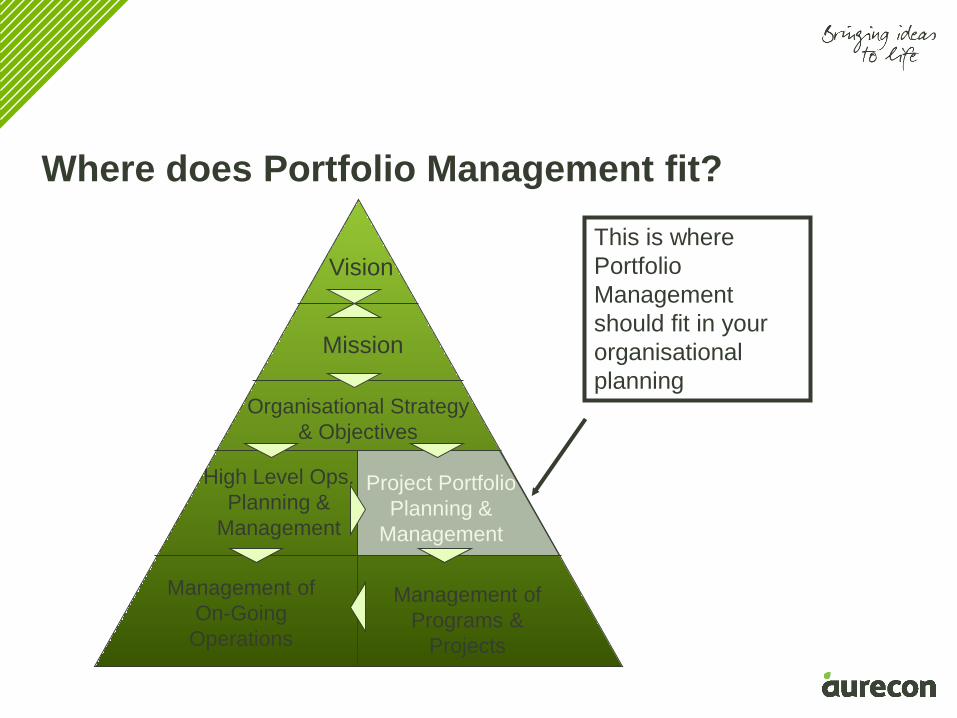
Where does Portfolio Management fit?
Vision
Mission
Organisational Strategy
& Objectives
Project Portfolio
Planning &
Management
High Level Ops.
Planning &
Management
Management of
On-Going
Operations
Management of
Programs &
Projects
This is where
Portfolio
Management
should fit in your
organisational
planning
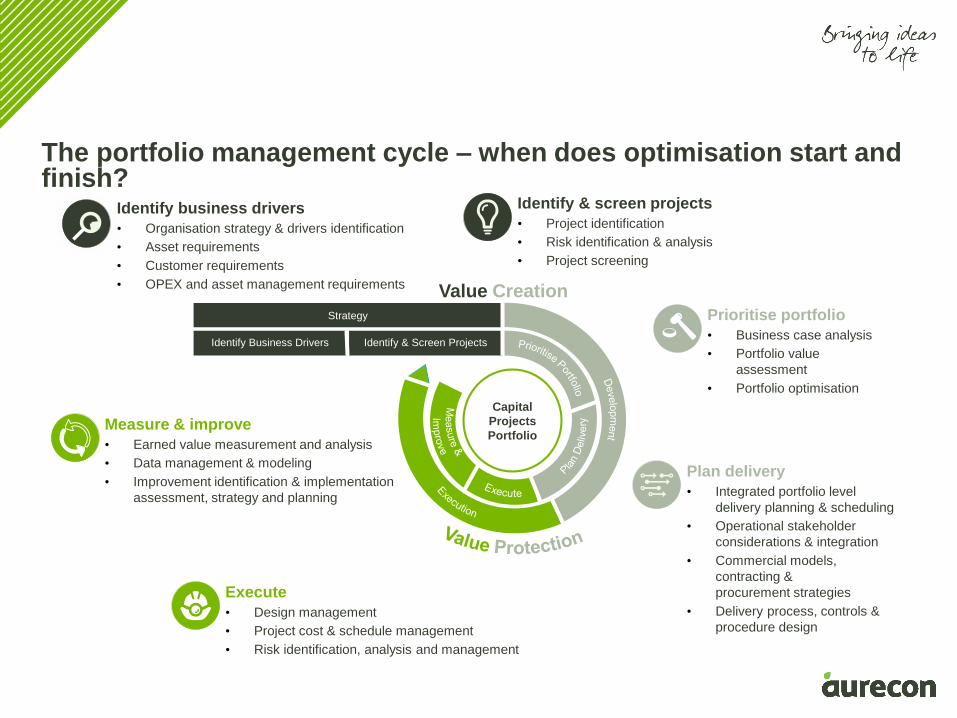
The portfolio management cycle – when does optimisation start and finish?
Identify business drivers
• Organisation strategy & drivers identification
• Asset requirements
• Customer requirements
• OPEX and asset management requirements
Identify & screen projects
• Project identification
• Risk identification & analysis
• Project screening
Prioritise portfolio
• Business case analysis
• Portfolio value
assessment
• Portfolio optimisation
Plan delivery
• Integrated portfolio level
delivery planning & scheduling
• Operational stakeholder
considerations & integration
• Commercial models,
contracting &
procurement strategies
• Delivery process, controls &
procedure design
Execute
• Design management
• Project cost & schedule management
• Risk identification, analysis and management
Measure & improve
• Earned value measurement and analysis
• Data management & modeling
• Improvement identification & implementation
assessment, strategy and planning
Strategy
Identify Business Drivers Identify & Screen Projects
Capital
Projects
Portfolio
Value Creation

CAPEX & OPEX –
Never the twain shall
meet…..
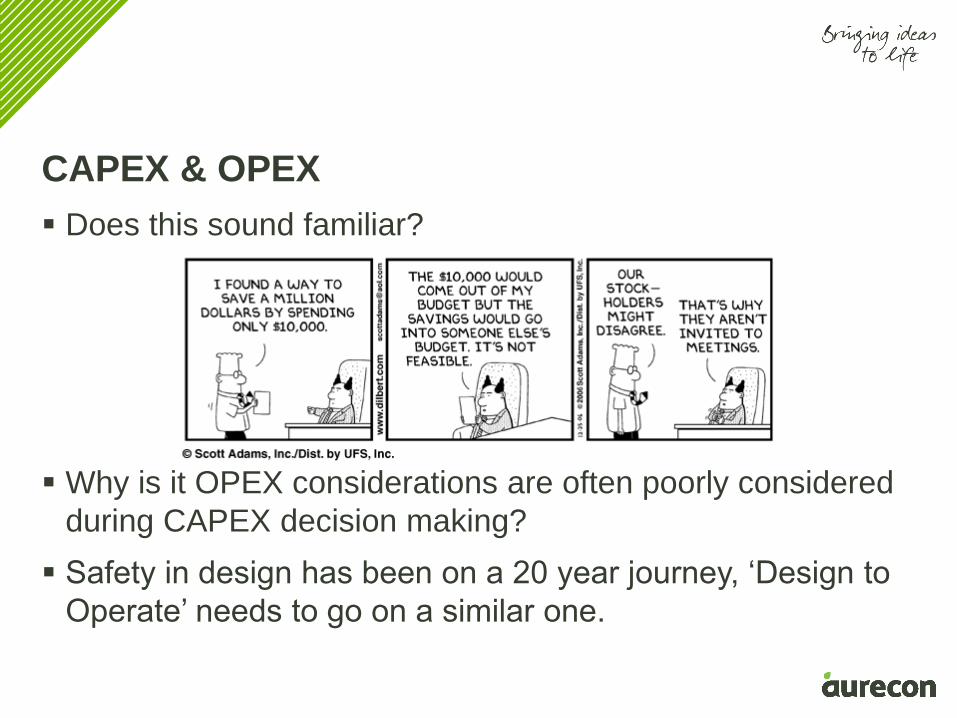
Does this sound familiar?
Why is it OPEX considerations are often poorly considered
during CAPEX decision making?
Safety in design has been on a 20 year journey, ‘Design to
Operate’ needs to go on a similar one.
CAPEX & OPEX
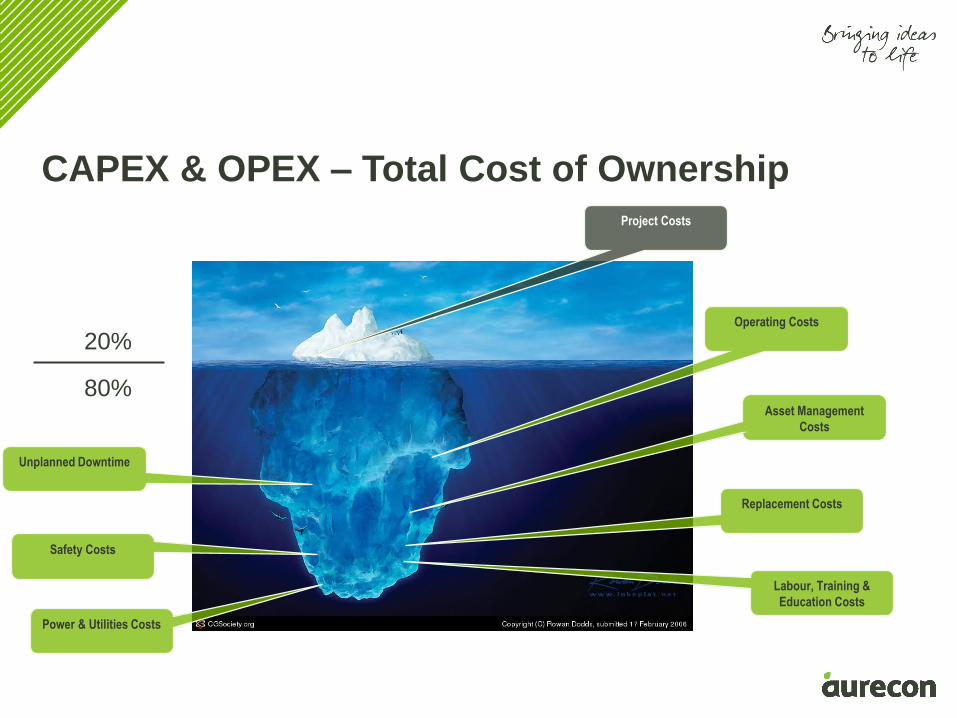
CAPEX & OPEX – Total Cost of Ownership
Operating Costs
Asset Management
Costs
Power & Utilities Costs
Safety Costs
Unplanned Downtime
Replacement Costs
Labour, Training &
Education Costs
Project Costs
20%
80%

What does good look
like? – A real life tale
of two divisions…..
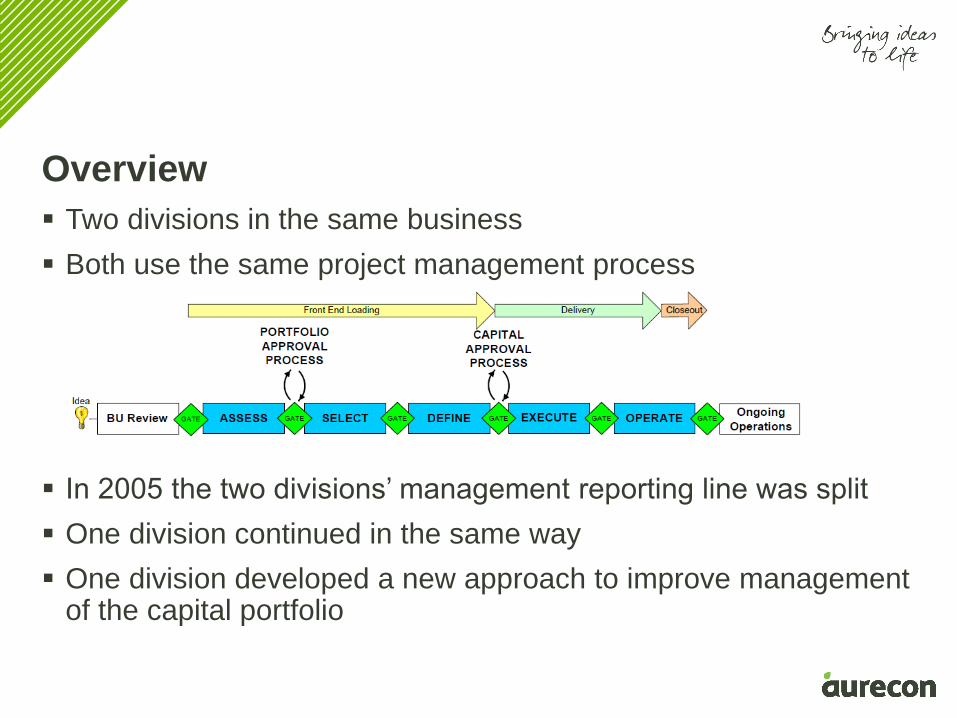
Two divisions in the same business
Both use the same project management process
In 2005 the two divisions’ management reporting line was split
One division continued in the same way
One division developed a new approach to improve management of the capital portfolio
Overview
In January the Commercial Manager calls the Engineering
Manager
The engineering manager starts a list by looking at the
previous year’s list
Management is polled for new ideas, a screening study is
done of the new ideas for costs and benefits
The lead team reviews the list, and select projects via a
semi –political/rational process ‘decibel management’ -
capital is allocated to the individual budget units
The list is put away until January of the following year
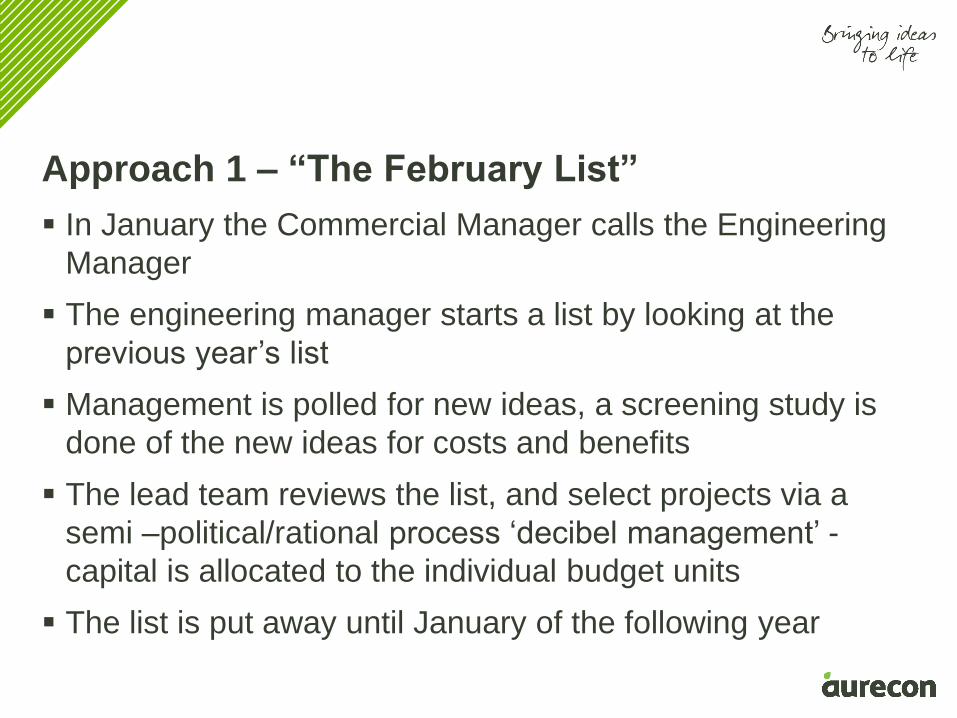
Approach 1 – “The February List”
‘Supporting’ Systems:
‒ Microsoft Excel list of projects
‒ ERP for actual capital expenditure
Approach 1 – “The February List”
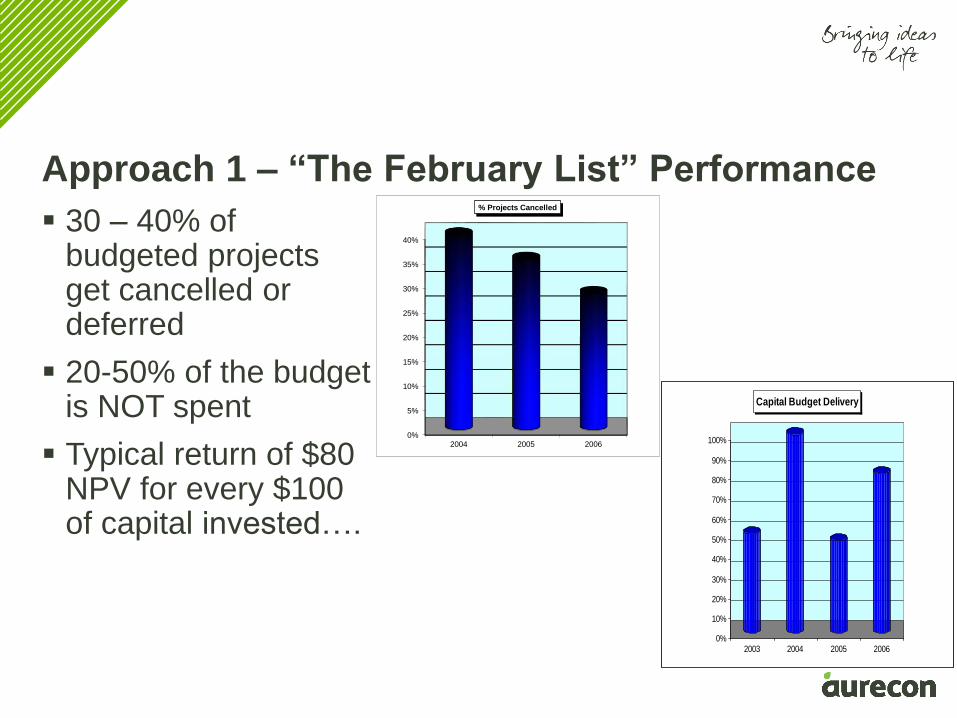
Approach 1 – “The February List” Performance
30 – 40% of budgeted projects get cancelled or deferred
20-50% of the budget is NOT spent
Typical return of $80 NPV for every $100 of capital invested….
2003 2004 2005 20060%
10%
20%
30%
40%
50%
60%
70%
80%
90%
100%
Capital Budget Delivery
0%
5%
10%
15%
20%
25%
30%
35%
40%
2004 2005 2006
% Projects Cancelled
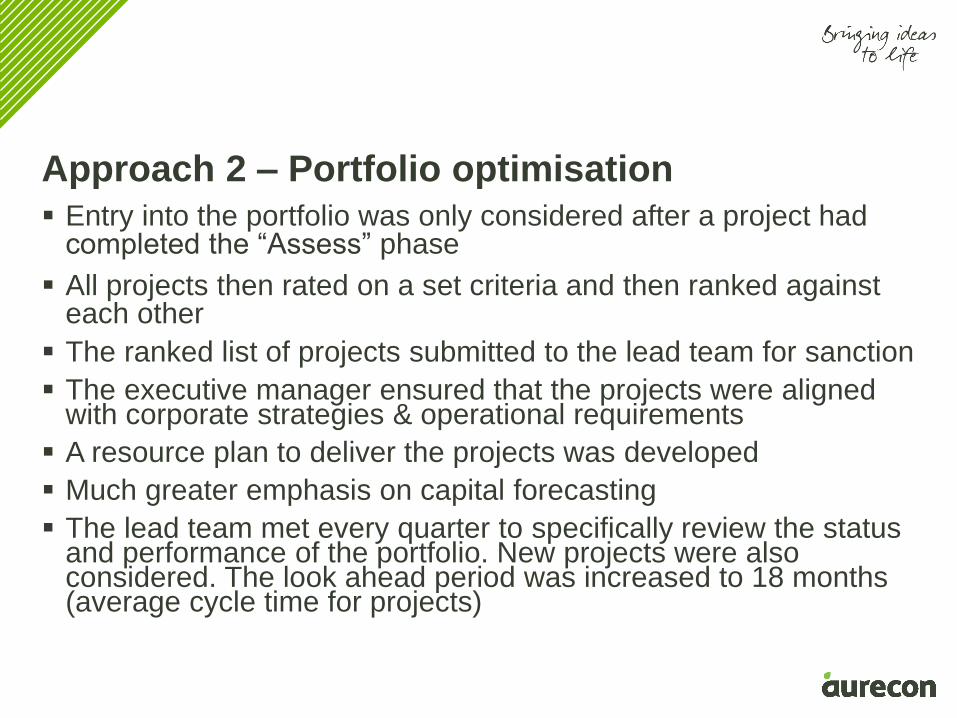
Entry into the portfolio was only considered after a project had completed the “Assess” phase
All projects then rated on a set criteria and then ranked against each other
The ranked list of projects submitted to the lead team for sanction
The executive manager ensured that the projects were aligned with corporate strategies & operational requirements
A resource plan to deliver the projects was developed
Much greater emphasis on capital forecasting
The lead team met every quarter to specifically review the status and performance of the portfolio. New projects were also considered. The look ahead period was increased to 18 months (average cycle time for projects)
Approach 2 – Portfolio optimisation
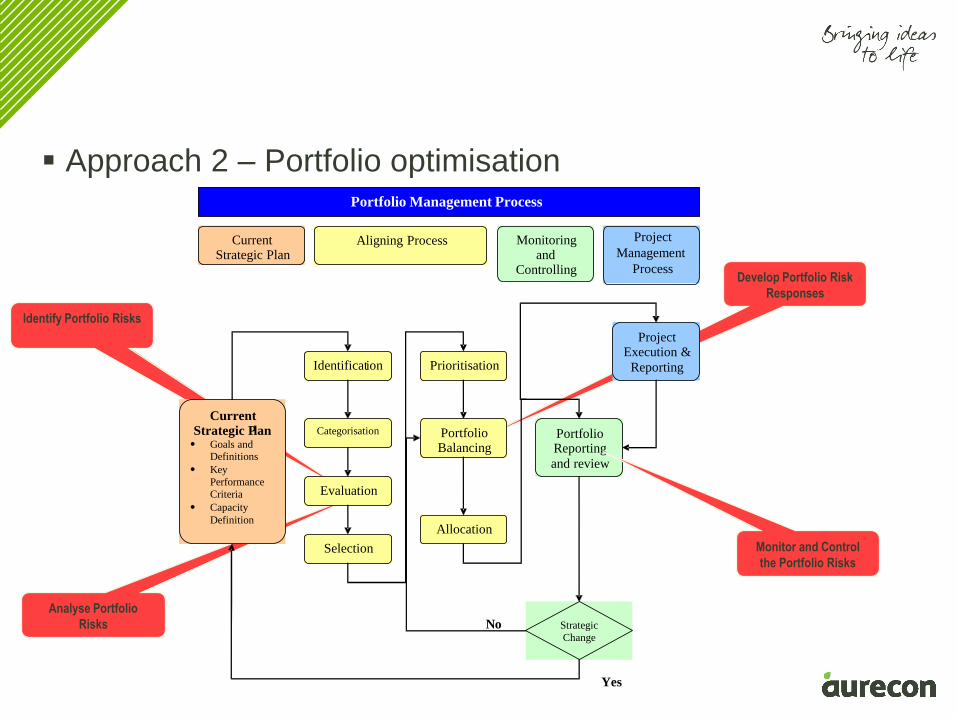
Identify Portfolio Risks
Analyse Portfolio
Risks
Develop Portfolio Risk
Responses
Portfolio Management Process
Current Strategic Plan
Aligning Process Monitoring and
Controlling
Project
Management
Process
Current Strategic Plan Goals and
Definitions
Key
Performance
Criteria
Capacity
Definition
Prioritisation
Portfolio Balancing
Allocation
Categorisation
Selection
Evaluation
Identification
Portfolio Reporting
and review
Strategic
Change
Project Execution &
Reporting
No
Yes
Approach 2 – Portfolio optimisation
Monitor and Control
the Portfolio Risks
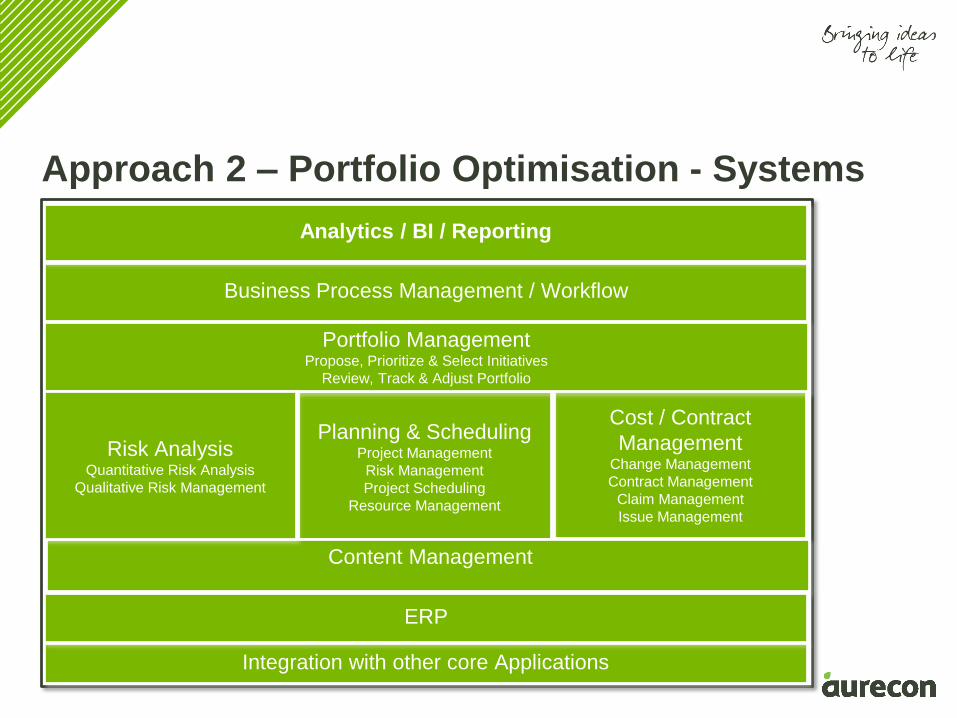
Approach 2 – Portfolio Optimisation - Systems
Cost / Contract
ManagementChange Management
Contract Management
Claim Management
Issue Management
Planning & SchedulingProject Management
Risk Management
Project Scheduling
Resource Management
Content Management
Business Process Management / Workflow
Portfolio ManagementPropose, Prioritize & Select Initiatives
Review, Track & Adjust Portfolio
Integration with other core Applications
Risk AnalysisQuantitative Risk Analysis
Qualitative Risk Management
Analytics / BI / Reporting
ERP
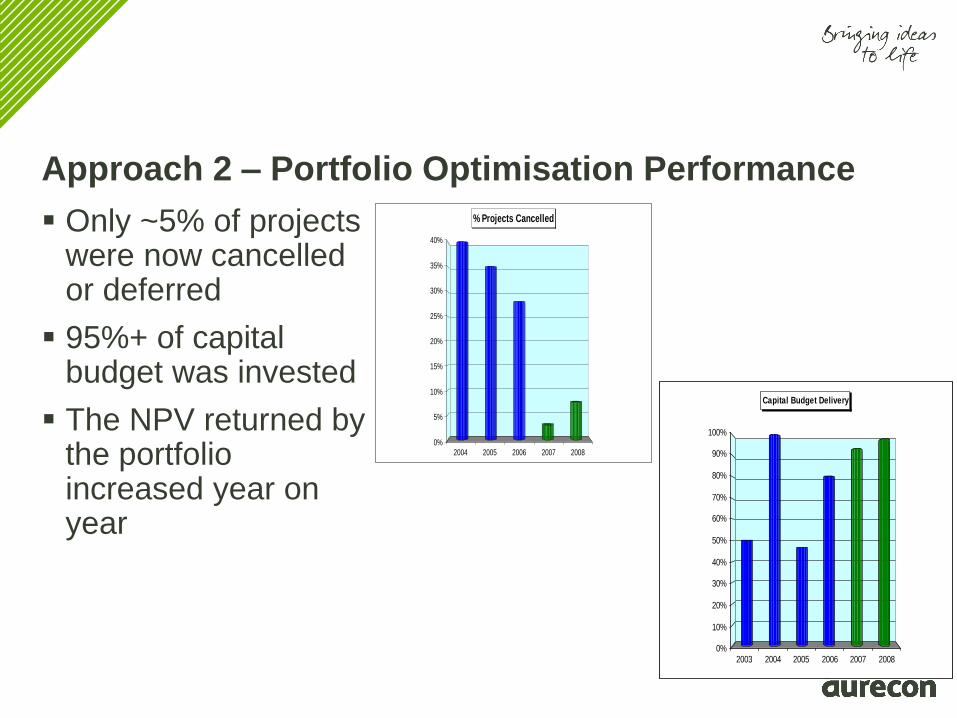
Approach 2 – Portfolio Optimisation Performance
Only ~5% of projects were now cancelled or deferred
95%+ of capital budget was invested
The NPV returned by the portfolio increased year on year
2003 2004 2005 2006 2007 20080%
10%
20%
30%
40%
50%
60%
70%
80%
90%
100%
Capital Budget Delivery
2004 2005 2006 2007 20080%
5%
10%
15%
20%
25%
30%
35%
40%
% Projects Cancelled
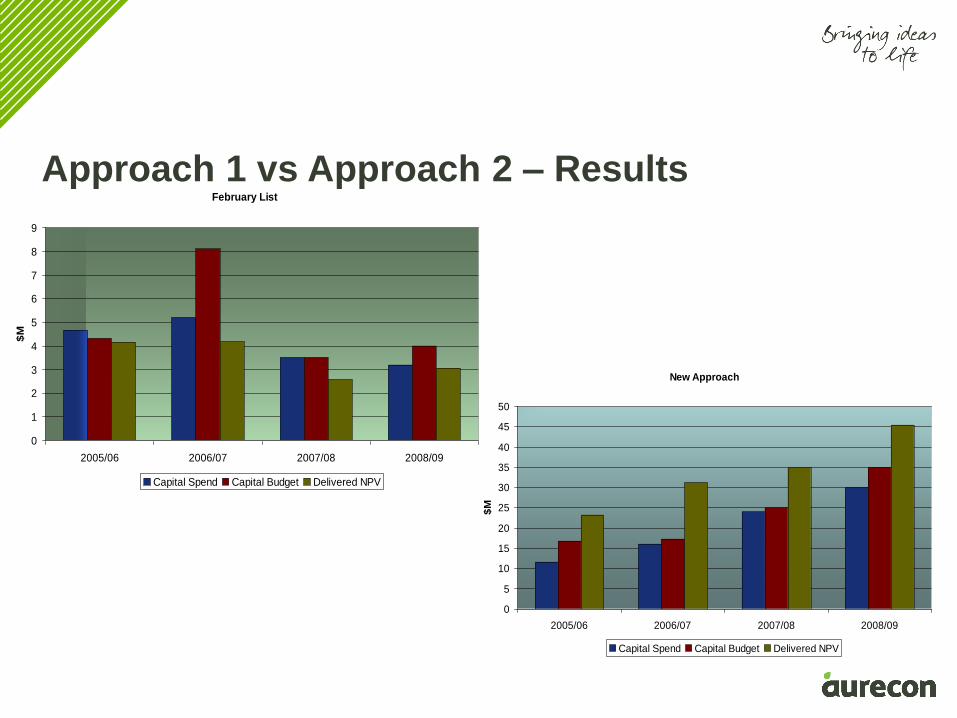
Approach 1 vs Approach 2 – ResultsFebruary List
0
1
2
3
4
5
6
7
8
9
2005/06 2006/07 2007/08 2008/09
$M
Capital Spend Capital Budget Delivered NPV
New Approach
0
5
10
15
20
25
30
35
40
45
50
2005/06 2006/07 2007/08 2008/09
$M
Capital Spend Capital Budget Delivered NPV

Follow us on
www.twitter.com/Aurecon
Join us on
www.facebook.com/Aurecon
Watch us on
www.youtube.com/user/AureconGroup
Follow us on
www.instagram.com/Aurecon
Follow us on
www.linkedin.com/company/Aurecon
Follow us on
www.slideshare.net/Aurecon
Top Related