


Languages
Pages
Legal

at SciVerse ScienceDirect
Neurobiology of Aging 34 (2013) 1728e1739
Contents lists available
Neurobiology of Aging
journal homepage: www.elsevier .com/locate/neuaging
Striatal morphology in early-onset and late-onset Alzheimer’s disease:a preliminary study
Michela Pievani a, Martina Bocchetta a, Marina Boccardi a, Enrica Cavedo a, Matteo Bonetti b,Paul M. Thompson c, Giovanni B. Frisoni a,*a Laboratory of Epidemiology, Neuroimaging and Telemedicine-LENITEM, IRCCS Istituto Centro San Giovanni di Dio, Fatebenefratelli, Brescia, Italyb Service of Neuroradiology, Istituto Clinico Citta’ di Brescia, Brescia, Italyc Imaging Genetics Center, Laboratory of Neuro Imaging, Department of Neurology and Psychiatry, University of California Los Angeles School of Medicine, Los Angeles, CA, USA
a r t i c l e i n f o
Article history:Received 26 September 2012Received in revised form 10 January 2013Accepted 22 January 2013Available online 19 February 2013
Keywords:ADAge at onsetMorphologyStriatumApolipoprotein E
* Corresponding author at: Laboratory of EpidemTelemedicine, IRCCS Istituto Centro San GiovanniPilastroni 4, 25125 Brescia, Italy. Tel.: þ39 030 350136
E-mail address: [email protected] (G.B. Fr
0197-4580/$ e see front matter � 2013 Elsevier Inc. Ahttp://dx.doi.org/10.1016/j.neurobiolaging.2013.01.016
a b s t r a c t
We investigated volume and shape changes in the striatum (caudate, putamen, and nucleus accumbens)of 18 early-onset (EOAD) and 18 late-onset (LOAD) Alzheimer’s Disease patients compared with 2 controlgroups age- and sex-matched to each patient group, and explored the relationship between striatalatrophy and apolipoprotein E (APOE) genotype. EOAD patients showed significant shape changes in theleft and right ventral putamen (p < 0.05, corrected for multiple comparison with permutation tests).LOAD patients showed significant reductions in the left and right nucleus accumbens volumes (p < 0.05;ManneWhitney test) and shape (p < 0.05; permutation test). Caudate abnormalities were detected inEOAD and LOAD patients in terms of local enlargements and reductions (p < 0.05 for the left and right,permutation test). When APOE was considered, significant differences were detected between LOAD ε4carriers and noncarriers in the left and right caudate (p < 0.05, permutation test). These results suggestdistinct patterns of striatal pathology in EOAD and LOAD patients, the dorsal striatum being involved inEOAD and the ventral striatum in LOAD.
� 2013 Elsevier Inc. All rights reserved.
1. Introduction
An increasing amount of evidence indicates that early-onset andlate-onset Alzheimer’s Disease (AD) represent distinct clinical andpathological disease subtypes. AD patients developing symptomsafter the age of 65 (LOAD) typically show memory impairment andprominent medial temporal lobe (MTL) atrophy (Filippi et al., 2012;Frisoni et al., 2005, 2007). Patients developing symptoms beforeage 65 (EOAD) show a greater occurrence of atypical symptoms(visuospatial, executive, and attentional function deficits) andgreater neocortical atrophy (Balasa et al., 2011; Frisoni et al., 2005,2007; Ishii et al., 2005; Karas et al., 2007; Shiino et al., 2006, 2008;Smits et al., 2012). The LOAD atrophy profile is consistent with theprototypical pattern of AD progression, originating from the MTLand limbic cortex and spreading to the neocortex (Braak and Braak,1990). Even so, the typical profile of atrophy in EOAD followsa distinct pattern: earlier and more pronounced neocorticalatrophy and later and less pronounced MTL atrophy; this patternis also supported by recent neuropathological investigations
iology, Neuroimaging anddi Dio, Fatebenefratelli, via1; fax: þ39 030 3501592.isoni).
ll rights reserved.
(Murray et al., 2011). These observations have made it possible toidentify specific clinical pathological correlates of early-onset andlate-onset forms of AD and have important implications whenusing imaging biomarkers as surrogate outcomes in clinical trials.
Recent observations in familial EOAD have opened newperspectives on the pathological correlates of atypical AD. Studiesin subjects carrying genetic mutations causative for AD show thatthe first site of pathological changes is the striatum (Klunk et al.,2007; Koivunen et al., 2008; Remes et al., 2008; Villemagne et al.,2009) leading to the hypothesis that striatal pathology might bea prominent phenotype in familial EOAD. In sporadic AD, post-mortem studies show that the striatum is affected by amyloid andtau pathology (Braak and Braak, 1990; Mann, 1991; Thal et al.,2002), and in vivo assessment of striatal atrophy demonstratedreduced putamen and caudate volumes (Barber et al., 2002; de Jonget al., 2008; Madsen et al., 2010) affecting primarily their anteriorportions (de Jong et al., 2011; Karas et al., 2007; Looi et al., 2010;Madsen et al., 2010; Rombouts et al., 2000). No study, however, hasinvestigated striatal atrophy in EOAD and LOAD. This distinctionmight be relevant for at least 2 reasons. First, sporadic EOAD sharesseveral clinical features with familial EOAD (an earlier disease onsetand greater occurrence of atypical symptoms than in LOAD) andtherefore might share the same pathological phenotype. Second,the structural and functional organization of the striatum suggests
M. Pievani et al. / Neurobiology of Aging 34 (2013) 1728e1739 1729
a possible differential involvement of this structure in EOAD andLOAD. The striatum modulates ‘atypical’ and ‘typical’ AD functions(Albin et al., 1989; Alexander et al., 1986). The dorsal striatum,including the putamen and caudate, is part of the motor circuit andis primarily associated with sensorimotor disturbances (Alexanderet al., 1986); the ventral striatum, including the nucleus accum-bens, is part of the limbic circuit and is involved in behavior andmemory functions (Alexander et al., 1986) and has been shown tobe specifically vulnerable in typical AD (Suenaga et al., 1990).Considering the distinct clinical profiles of EOAD and LOAD, it canbe hypothesized that striatal pathology might involve distinctnuclei in the 2 AD subtypes.
Based on this background, the present study aimed to assess thetopography of striatal abnormalities in EOAD and LOAD. Usinga shape-based approach, we outlined the nucleus accumbens,putamen, and caudate nucleus, and compared the volume andshape changes between each AD subtype and age- and sex-matched control subjects. Furthermore, we conducted a prelimi-nary analysis to investigate whether the Apolipoprotein E (APOE)genotype influenced the pattern of striatal abnormalities. BecauseAPOE genotype influences the pattern of cortical and MTL atrophyin AD (Pievani et al., 2009; Wolk et al., 2010) and might interactwith age at onset in modulating the clinical phenotype (Van derFlier et al., 2011), we explored possible differences between ε4carriers and noncarriers in AD subgroups.
2. Methods
2.1. Participants and assessment
AD cases were recruited from the outpatients of the IRCCS Isti-tuto Centro San Giovanni di Dio Fatebenefratelli, in Brescia, Italy.Each subject underwent history-taking, laboratory exams, a phys-ical and neurological exam, a neuropsychological assessment, andmagnetic resonance image (MRI) scanning, as described previously(Frisoni et al., 2007). In addition, cerebrospinal fluid sampling wasperformed in a subsample of participants, as detailed elsewhere(Frisoni et al., 2009). Briefly, history was taken with a structuredinterview from patients’ relatives (usually spouses) and age at onsetwas estimated from the caregiver’s report of memory disturbancesexceeding the episodic forgetfulness that might be regarded asusual for the patient or report of other progressive cognitivedisturbances (language, praxis, orientation, visuospatial skills)(Frisoni et al., 1996). Laboratory exams included complete bloodcount, chemistry profile, thyroid function, B12 and folic acid, andelectrocardiogram. The neuropsychological assessment includedthe Mini Mental State Examination (MMSE; Folstein et al., 1975),Rey’s word list (immediate and delayed recall; Carlesimo et al.,1996), Rey figure copy and delayed recall (Caffarra et al., 2002),letter and category fluency (Novelli et al., 1986), token test (DeRenzi and Vignolo, 1962; Spinnler and Tognoni, 1987), and TrailMaking Test Parts A and B (Amodio et al., 2002; Reitan,1958). Motorsymptoms were assessed with the Extrapyramidal Symptoms Scale(Richards et al., 1991).
Subjects were eligible if they had a diagnosis of AD according tocore clinical criteria for probable AD (McKhann et al., 2011).Exclusion criteriawere: (1) evidence of depression or disthymia; (2)abnormal laboratory test results; (3) other major systemic,psychiatric, or neurological illnesses; and (4) other causes of focal ordiffuse brain damage on MRI scan (e.g., lacunae and extensivecerebrovascular disorders). According to these criteria, 18 ADpatients with disease onset before the age of 65 (EOAD) wereeligible for the study, and 18 AD patients with disease onset afterthe age of 65 (LOAD) were then matched 1:1 to EOAD patients bydementia severity as measured by the Clinical Dementia Rating
(Hughes et al., 1982). When more than 1 matching LOAD patientwas available, the onewith the closest matchingMMSEwas chosen.None had a family history suggestive of autosomal dominant AD. Allpatients with cerebrospinal fluid data available (25%; n¼ 9) showedabnormal amyloid beta(1e42) levels according to the establishedcutoff (normal levels >500 pg/mL; Sjögren et al., 2001).
Healthy control subjects were selected from subjects enrolledin an ongoing study, described in detail elsewhere (Galluzzi et al.,2009). Exclusion criteria were the presence of any clinical, neuro-logical, or neuropsychological impairment, and of cerebrovasculardisease. Because EOAD and LOAD differ for age, we selected2 control groups, matched for age and sample size to each patientgroup, as follows. Controls were matched 1:1 to AD patients basedon age and sex, thus obtaining a control group for EOAD (n ¼ 18;YC) and a control group for LOAD (n ¼ 18; EC). When more than1 matching control was available, the one with the closestmatching educational level was chosen. Written informed consentwas obtained from patients and control subjects. No compensationwas provided for participating in the study. The study wasapproved by the local ethics committee.
2.2. Genetic analysis
Genomic DNA was extracted from whole-blood samples ofsubjects according to standard procedures. APOE genotypingwas carried out by polymerase chain reaction amplification andHhaI restriction enzyme digestion. The genotype was resolved on4% Metaphor Gel (BioSpa) and visualized by ethidium bromidestaining (Hixson and Vernier, 1990).
2.3. MRI
MRI scans were acquired on a 1.0 T scanner (Philips Gyroscan,Philips, Eindhoven, The Netherlands) at the Neuroradiology Unit ofthe Hospital “Citta’ di Brescia,” in Brescia, Italy. The followingsequences were acquired: (1) high-resolution T1-weighted sagittalgradient echo (repetition time ¼ 20 ms, echo time ¼ 5 ms, flipangle¼ 30�,field of view¼ 220mm, acquisitionmatrix¼ 256� 256,and slice thickness ¼ 1.3 mm); and (2) axial fluid attenuatedinversion recovery (repetition time¼ 5000ms, echo time¼ 100ms,flip angle¼ 90�, field of view¼ 230mm, acquisitionmatrix¼ 256�256, slice thickness ¼ 5 mm). White matter (WM) hyperintensities,if any, were identified on the fluid attenuated inversion recoveryscans according to the age-relatedWMchange scale (Wahlund et al.,2001).
2.4. Striatal volumetry
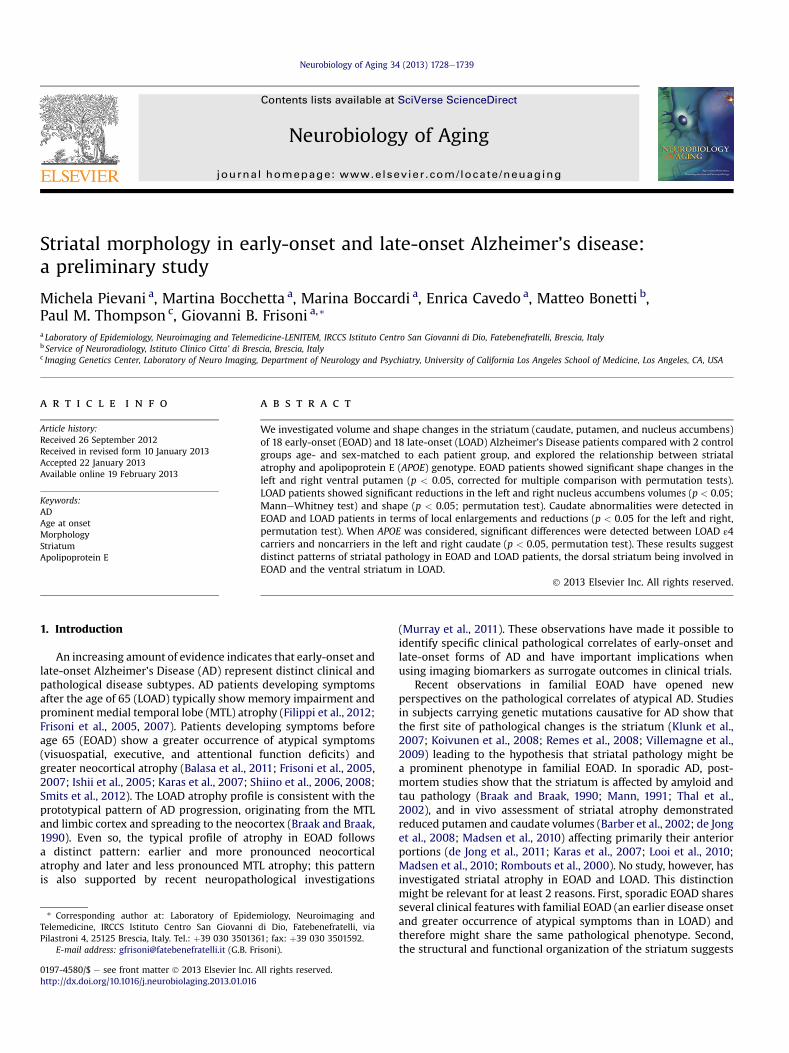
The nucleus accumbens, caudate nucleus, and putamen weremanually traced by a single tracer, blind to clinical, neuro-psychological, and MRI findings, following an optimized protocolbased on landmarks and criteria defined in established protocols(Gunning-Dixon et al., 1998; Hokama et al., 1995; Makris et al.,1999). A detailed description of the criteria used can be foundelsewhere (Boccardi et al., in press). The 3-D images were pre-processed according to procedures previously described (Frisoniet al., 2007). Briefly, the images were reoriented along the ante-rior-posterior commissure (AC-PC) line, normalized to a customizedtemplate with a 12-parameter affine transformation, and resam-pled to 1-mm isotropic voxels. Tracings were carried out withthe MultiTracer software (http://www.loni.ucla.edu/Software/MultiTracer) on the reoriented, normalized, 1-mm thick coronalbrain sections, from posterior to anterior, while simultaneouslychecking the sagittal and axial planes (Fig. 1 shows the striatalnuclei outlined on scans of representative EOAD and LOAD
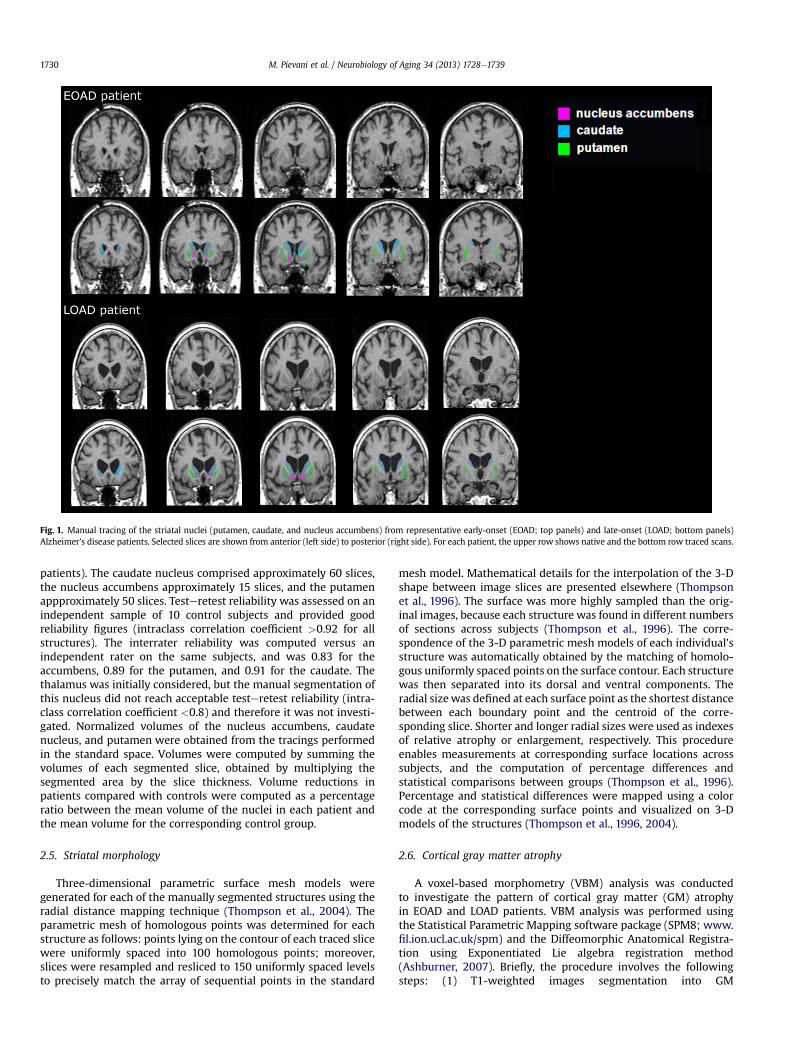
Fig. 1. Manual tracing of the striatal nuclei (putamen, caudate, and nucleus accumbens) from representative early-onset (EOAD; top panels) and late-onset (LOAD; bottom panels)Alzheimer’s disease patients. Selected slices are shown from anterior (left side) to posterior (right side). For each patient, the upper row shows native and the bottom row traced scans.
M. Pievani et al. / Neurobiology of Aging 34 (2013) 1728e17391730
patients). The caudate nucleus comprised approximately 60 slices,the nucleus accumbens approximately 15 slices, and the putamenappproximately 50 slices. Testeretest reliability was assessed on anindependent sample of 10 control subjects and provided goodreliability figures (intraclass correlation coefficient >0.92 for allstructures). The interrater reliability was computed versus anindependent rater on the same subjects, and was 0.83 for theaccumbens, 0.89 for the putamen, and 0.91 for the caudate. Thethalamus was initially considered, but the manual segmentation ofthis nucleus did not reach acceptable testeretest reliability (intra-class correlation coefficient <0.8) and therefore it was not investi-gated. Normalized volumes of the nucleus accumbens, caudatenucleus, and putamen were obtained from the tracings performedin the standard space. Volumes were computed by summing thevolumes of each segmented slice, obtained by multiplying thesegmented area by the slice thickness. Volume reductions inpatients compared with controls were computed as a percentageratio between the mean volume of the nuclei in each patient andthe mean volume for the corresponding control group.
2.5. Striatal morphology
Three-dimensional parametric surface mesh models weregenerated for each of the manually segmented structures using theradial distance mapping technique (Thompson et al., 2004). Theparametric mesh of homologous points was determined for eachstructure as follows: points lying on the contour of each traced slicewere uniformly spaced into 100 homologous points; moreover,slices were resampled and resliced to 150 uniformly spaced levelsto precisely match the array of sequential points in the standard
mesh model. Mathematical details for the interpolation of the 3-Dshape between image slices are presented elsewhere (Thompsonet al., 1996). The surface was more highly sampled than the orig-inal images, because each structure was found in different numbersof sections across subjects (Thompson et al., 1996). The corre-spondence of the 3-D parametric mesh models of each individual’sstructure was automatically obtained by the matching of homolo-gous uniformly spaced points on the surface contour. Each structurewas then separated into its dorsal and ventral components. Theradial size was defined at each surface point as the shortest distancebetween each boundary point and the centroid of the corre-sponding slice. Shorter and longer radial sizes were used as indexesof relative atrophy or enlargement, respectively. This procedureenables measurements at corresponding surface locations acrosssubjects, and the computation of percentage differences andstatistical comparisons between groups (Thompson et al., 1996).Percentage and statistical differences were mapped using a colorcode at the corresponding surface points and visualized on 3-Dmodels of the structures (Thompson et al., 1996, 2004).
2.6. Cortical gray matter atrophy
A voxel-based morphometry (VBM) analysis was conductedto investigate the pattern of cortical gray matter (GM) atrophyin EOAD and LOAD patients. VBM analysis was performed usingthe Statistical Parametric Mapping software package (SPM8; www.fil.ion.ucl.ac.uk/spm) and the Diffeomorphic Anatomical Registra-tion using Exponentiated Lie algebra registration method(Ashburner, 2007). Briefly, the procedure involves the followingsteps: (1) T1-weighted images segmentation into GM
M. Pievani et al. / Neurobiology of Aging 34 (2013) 1728e1739 1731
compartments using the New Segment toolbox; (2) nonlinearwarping of individual GM segments to the population GM templategenerated from the Diffeomorphic Anatomical Registration usingExponentiated Lie algebra registration method; this step incorpo-rates an affine normalization to the Montreal Neurological Institutetemplate; (3) modulation of the spatially normalized images usingJacobian determinants; and (4) smoothing with an 8-mm full widthhalf maximum Gaussian filter.
2.7. Statistical analysis
Sociodemographic, clinical, neuropsychological, and global vol-ume data were analyzed using the ManneWhitney U test for con-tinuous variables and c2 test for dichotomous variables. The effectsof diagnosis (AD vs. controls), age at onset (�65 vs. >65 years), andtheir interaction was assessed with analysis of variance.
Student t tests were used to evaluate local significant differencesat each point in the radial distance mapping procedure, in thecomparison between patients and age- and sex-matched controlgroups (EOADvs. YC, LOADvs. EC).Moreover, the control groupswerecompared (EC vs. YC) to examine the age-related pattern of striatalchanges. p values were computed for the dorsal and ventral mapsusing a threshold of p < 0.05, uncorrected. Permutation tests werethen used to correct the statistical maps for multiple comparisons(Thompson et al., 2003). Permutation tests measure the probabilitythat the observed distribution of a given feature (e.g., the number ofverticeswith statistics below p< 0.01 in the entiremap)would occurby chance if the subjects were randomly assigned to groups. Theeffect observed in the random assignments was then comparedwiththat observed in the true experiment. This calculation was made bycomputing thenumberof times that aneffectwitha similarorgreatermagnitude occurred in the random assignments compared with thetrue assignments, over the total number of “random” experimentsrun. This ratio represents the empirical probability that the observedpatternoccurredbyaccident, and it provides anoverallpvalue for theuncorrected statistical maps, corrected for multiple comparisons(Thompson et al., 2003). More specifically, 10,000 permutations ofthe assignments for subjects to groups were computed, whilekeeping the total number of subjects in each group the same. In eachof these experiments, insteadof assigning1 to cases and0 to controls,as in the true experiment, the assignments of 1 and 0 to cases andcontrols was randomly scrambled (permuted). For each of these10,000 permutations, the pmap of the differences for the “cases” (allindividuals randomly assigned to group 0) versus “controls” (allindividuals randomly assigned to group 1) was generated, and thenumber of supra-threshold (i.e., significant) voxels was computed. Inthe whole set of the 10,000 experiments, the total number of timesthat the supra-threshold count was equal or greater than that
Table 1Sociodemographic and clinical features of 18 EOAD and 18 LOAD patients matched by ag
EOAD YC p
n 18 18Age, y 62.5 (4.4) 62.8 (4.8) 0.79Sex, female 13 (72%) 13 (72%) 1.00Education, y 7.7 (5.3) 8.2 (4.0) 0.28Clinical dementia rating, 0.5/1/2 4/13/1 d d
Age at onset, y 59.4 (4.0) d d
Disease duration, y 3.2 (1.4) d d
EPS 3.63 (3.86) d d
Mini Mental State Exam 20.1 (3.8) 28.6 (0.7) <0.001White matter lesions 1.4 (1.4) 1.6 (2.1) 0.99APOE ε4 carriers 9 (50%) 2 (11%) 0.05
Values denote mean (SD) or n (%). p Values denote significance on ManneWhitney U tesKey: APOE, apolipoprotein E genotype; EC, elderly control; EOAD, early-onset Alzheimer’sLOAD, late-onset Alzheimer’s disease; YC, young control.
observed in the true experiment was divided by 10,000. This finalratio estimated the probability to obtain the same (or higher)amount of statistically significant points on the 3-D surface bychance. The final corrected p values are reported in the text and thosep values surviving statistical correction are reported in the figures.
Finally, we conducted a preliminary analysis to assess the effectof APOE genotype on striatal atrophy in patients only. Student t testswere used to compare striatal shape between patient subgroups(EOAD ε4 carriers vs. EOAD ε4 noncarriers, LOAD ε4 carriers versusLOAD ε4 noncarriers).
Between group comparisons on VBM analysis were performedat a threshold of p < 0.005, corrected using the false discovery rate(FDR). The correction method and threshold were chosen to ensureappropriate adjustment for multiple comparisons (i.e., to avoidcorrections too strict for small samples, e.g., family-wise; or toopermissive, e.g., p ¼ 0.05 FDR; see Whitwell, 2009 for discussionson the topic).
3. Results
3.1. Sociodemographic, clinical, and cognitive findings
Sociodemographic and clinical features of patients and controlsubjects are shown in Table 1. As expected, MMSE scores weresignificantly lower in the AD groups compared with their age- andsex-matched control subject groups (p < 0.001; Table 1), whileAPOE ε4 frequency was higher in patients than in control subjects(p � 0.05; Table 1). Education was comparable between EOAD andYC subjects (p ¼ 0.28) and lower in LOAD compared with EC sub-jects (p ¼ 0.006). EOAD and LOAD patients were clinically com-parable: no difference was detected in terms of Clinical DementiaRating scores, disease duration, MMSE scores, motor symptoms,and APOE ε4 frequency (p > 0.05, ManneWhitney U test).
EOAD and LOAD patients showed poorer scores than age-matched control subjects in all cognitive domains (Table 2).Frontal executive and visuospatial memory deficits were morepronounced in EOAD than LOAD patients (p < 0.05, analysis ofvariance interaction; Table 2). When patients were stratifiedaccording to APOE genotype, EOAD ε4 noncarriers and LOAD ε4noncarriers had a higher educational level than EOAD ε4 carriersand LOAD ε4 carriers, respectively (p � 0.05). In addition, EOAD ε4noncarriers showed a higher prevalence of men (p ¼ 0.05), andmore severe motor symptoms than EOAD ε4 carriers (p ¼ 0.02;Supplementary Table 1). Cognitive deficits were overall comparablebetween EOAD subgroups, except for slightly more pronouncedletter fluency deficits in EOAD ε4 carriers (Supplementary Table 1).In LOAD, ε4 carriers performed worse than ε4 noncarriers in severalcognitive domains (Supplementary Table 1).
e and sex to 18 YC and 18 EC subjects
LOAD EC p p EOAD vs. LOAD
18 1877.3 (4.6) 76.0 (3.9) 0.54 d
15 (83%) 15 (83%) 1.00 d
5.1 (2.5) 8.3 (4.5) 0.006 d
4/13/1 d d 1.0073.6 (5.6) d d <0.0013.7 (1.8) d d 0.25
3.56 (3.29) d d 0.7821.2 (3.9) 28.5 (1.4) <0.001 0.415.1 (3.2) 2.9 (2.6) 0.07 <0.0017 (39%) 1 (5.6%) 0.009 0.58
t for continuous variables and c2 test for dichotomous variables.disease; EPS, extrapyramidal symptoms on the Richards scale (Richards et al., 1991);
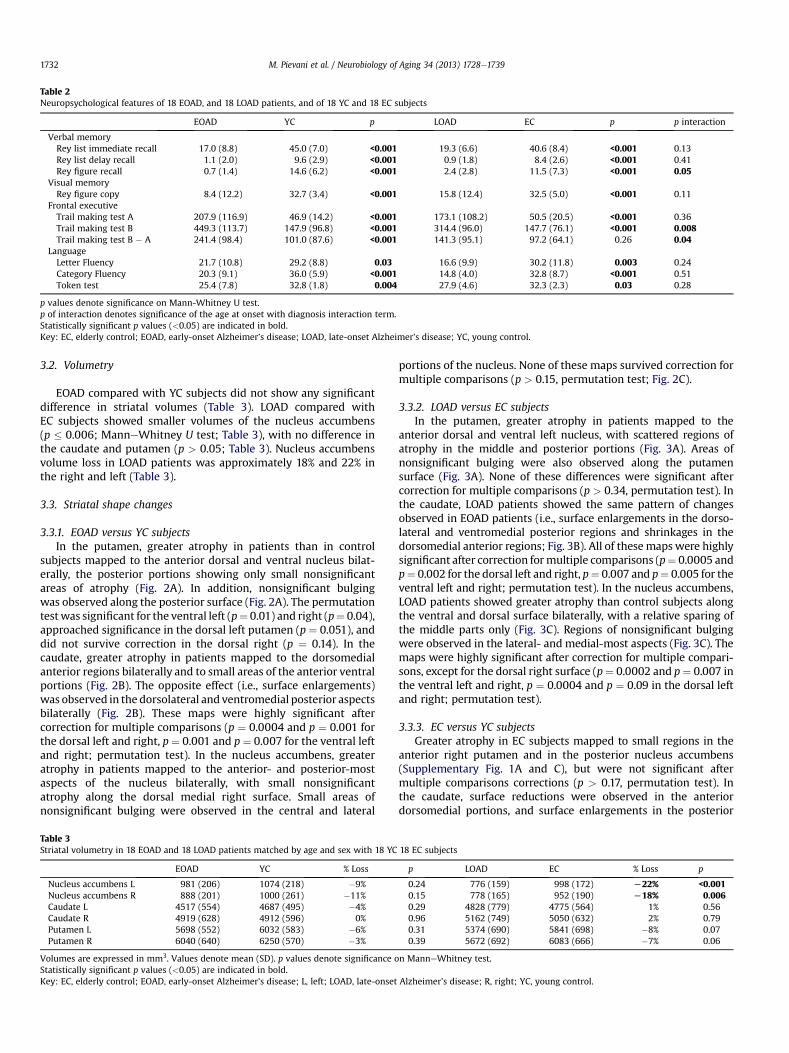
Table 2Neuropsychological features of 18 EOAD, and 18 LOAD patients, and of 18 YC and 18 EC subjects
EOAD YC p LOAD EC p p interaction
Verbal memoryRey list immediate recall 17.0 (8.8) 45.0 (7.0) <0.001 19.3 (6.6) 40.6 (8.4) <0.001 0.13Rey list delay recall 1.1 (2.0) 9.6 (2.9) <0.001 0.9 (1.8) 8.4 (2.6) <0.001 0.41Rey figure recall 0.7 (1.4) 14.6 (6.2) <0.001 2.4 (2.8) 11.5 (7.3) <0.001 0.05
Visual memoryRey figure copy 8.4 (12.2) 32.7 (3.4) <0.001 15.8 (12.4) 32.5 (5.0) <0.001 0.11
Frontal executiveTrail making test A 207.9 (116.9) 46.9 (14.2) <0.001 173.1 (108.2) 50.5 (20.5) <0.001 0.36Trail making test B 449.3 (113.7) 147.9 (96.8) <0.001 314.4 (96.0) 147.7 (76.1) <0.001 0.008Trail making test B � A 241.4 (98.4) 101.0 (87.6) <0.001 141.3 (95.1) 97.2 (64.1) 0.26 0.04
LanguageLetter Fluency 21.7 (10.8) 29.2 (8.8) 0.03 16.6 (9.9) 30.2 (11.8) 0.003 0.24Category Fluency 20.3 (9.1) 36.0 (5.9) <0.001 14.8 (4.0) 32.8 (8.7) <0.001 0.51Token test 25.4 (7.8) 32.8 (1.8) 0.004 27.9 (4.6) 32.3 (2.3) 0.03 0.28
p values denote significance on Mann-Whitney U test.p of interaction denotes significance of the age at onset with diagnosis interaction term.Statistically significant p values (<0.05) are indicated in bold.Key: EC, elderly control; EOAD, early-onset Alzheimer’s disease; LOAD, late-onset Alzheimer’s disease; YC, young control.
M. Pievani et al. / Neurobiology of Aging 34 (2013) 1728e17391732
3.2. Volumetry
EOAD compared with YC subjects did not show any significantdifference in striatal volumes (Table 3). LOAD compared withEC subjects showed smaller volumes of the nucleus accumbens(p � 0.006; ManneWhitney U test; Table 3), with no difference inthe caudate and putamen (p > 0.05; Table 3). Nucleus accumbensvolume loss in LOAD patients was approximately 18% and 22% inthe right and left (Table 3).
3.3. Striatal shape changes
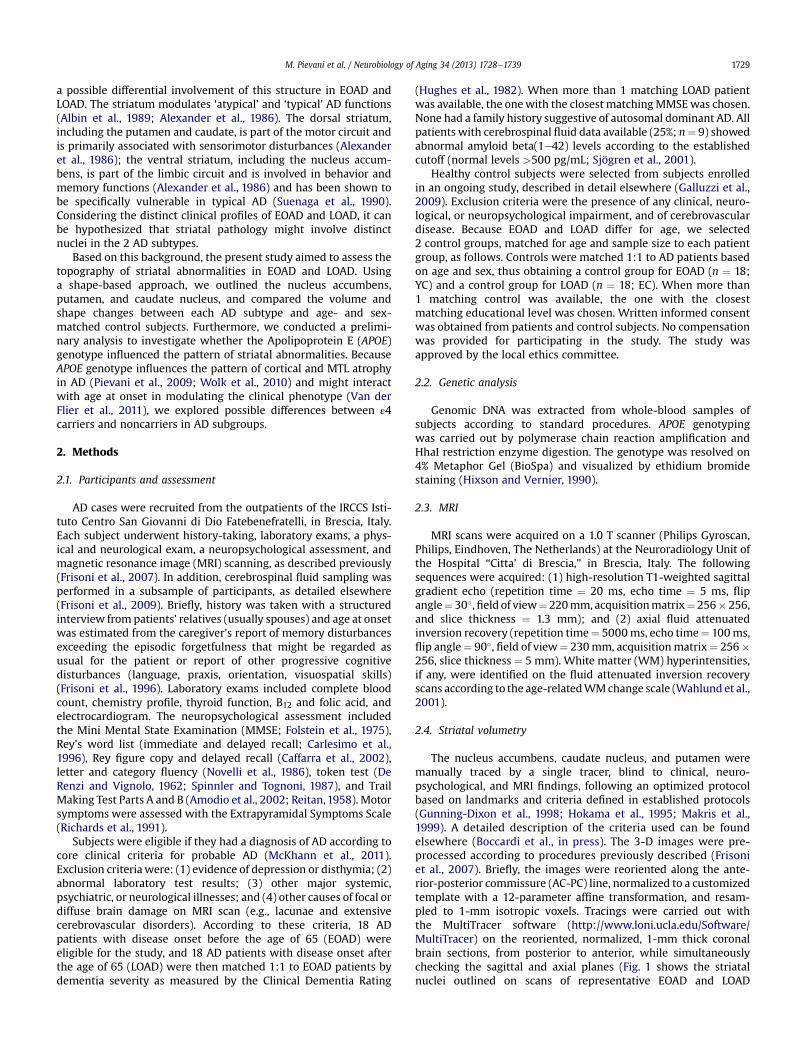
3.3.1. EOAD versus YC subjectsIn the putamen, greater atrophy in patients than in control
subjects mapped to the anterior dorsal and ventral nucleus bilat-erally, the posterior portions showing only small nonsignificantareas of atrophy (Fig. 2A). In addition, nonsignificant bulgingwas observed along the posterior surface (Fig. 2A). The permutationtestwas significant for the ventral left (p¼ 0.01) and right (p¼ 0.04),approached significance in the dorsal left putamen (p ¼ 0.051), anddid not survive correction in the dorsal right (p ¼ 0.14). In thecaudate, greater atrophy in patients mapped to the dorsomedialanterior regions bilaterally and to small areas of the anterior ventralportions (Fig. 2B). The opposite effect (i.e., surface enlargements)was observed in the dorsolateral and ventromedial posterior aspectsbilaterally (Fig. 2B). These maps were highly significant aftercorrection for multiple comparisons (p ¼ 0.0004 and p ¼ 0.001 forthe dorsal left and right, p ¼ 0.001 and p ¼ 0.007 for the ventral leftand right; permutation test). In the nucleus accumbens, greateratrophy in patients mapped to the anterior- and posterior-mostaspects of the nucleus bilaterally, with small nonsignificantatrophy along the dorsal medial right surface. Small areas ofnonsignificant bulging were observed in the central and lateral
Table 3Striatal volumetry in 18 EOAD and 18 LOAD patients matched by age and sex with 18 YC
EOAD YC % Loss
Nucleus accumbens L 981 (206) 1074 (218) �9%Nucleus accumbens R 888 (201) 1000 (261) �11%Caudate L 4517 (554) 4687 (495) �4%Caudate R 4919 (628) 4912 (596) 0%Putamen L 5698 (552) 6032 (583) �6%Putamen R 6040 (640) 6250 (570) �3%
Volumes are expressed in mm3. Values denote mean (SD). p values denote significance oStatistically significant p values (<0.05) are indicated in bold.Key: EC, elderly control; EOAD, early-onset Alzheimer’s disease; L, left; LOAD, late-onset
portions of the nucleus. None of these maps survived correction formultiple comparisons (p > 0.15, permutation test; Fig. 2C).
3.3.2. LOAD versus EC subjectsIn the putamen, greater atrophy in patients mapped to the
anterior dorsal and ventral left nucleus, with scattered regions ofatrophy in the middle and posterior portions (Fig. 3A). Areas ofnonsignificant bulging were also observed along the putamensurface (Fig. 3A). None of these differences were significant aftercorrection for multiple comparisons (p > 0.34, permutation test). Inthe caudate, LOAD patients showed the same pattern of changesobserved in EOAD patients (i.e., surface enlargements in the dorso-lateral and ventromedial posterior regions and shrinkages in thedorsomedial anterior regions; Fig. 3B). All of these mapswere highlysignificant after correction formultiple comparisons (p¼ 0.0005 andp¼ 0.002 for the dorsal left and right, p¼ 0.007 and p¼ 0.005 for theventral left and right; permutation test). In the nucleus accumbens,LOAD patients showed greater atrophy than control subjects alongthe ventral and dorsal surface bilaterally, with a relative sparing ofthe middle parts only (Fig. 3C). Regions of nonsignificant bulgingwere observed in the lateral- and medial-most aspects (Fig. 3C). Themaps were highly significant after correction for multiple compari-sons, except for the dorsal right surface (p¼ 0.0002 and p¼ 0.007 inthe ventral left and right, p ¼ 0.0004 and p ¼ 0.09 in the dorsal leftand right; permutation test).
3.3.3. EC versus YC subjectsGreater atrophy in EC subjects mapped to small regions in the
anterior right putamen and in the posterior nucleus accumbens(Supplementary Fig. 1A and C), but were not significant aftermultiple comparisons corrections (p > 0.17, permutation test). Inthe caudate, surface reductions were observed in the anteriordorsomedial portions, and surface enlargements in the posterior
18 EC subjects
p LOAD EC % Loss p
0.24 776 (159) 998 (172) L22% <0.0010.15 778 (165) 952 (190) L18% 0.0060.29 4828 (779) 4775 (564) 1% 0.560.96 5162 (749) 5050 (632) 2% 0.790.31 5374 (690) 5841 (698) �8% 0.070.39 5672 (692) 6083 (666) �7% 0.06
n ManneWhitney test.
Alzheimer’s disease; R, right; YC, young control.
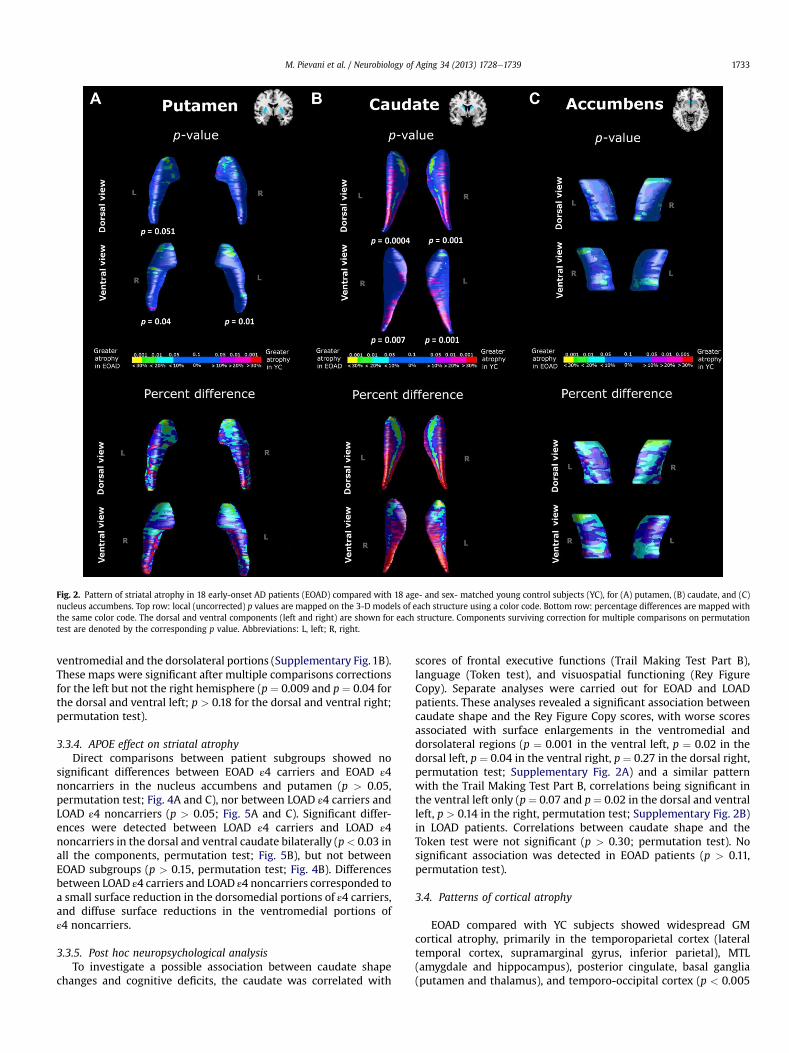
Fig. 2. Pattern of striatal atrophy in 18 early-onset AD patients (EOAD) compared with 18 age- and sex- matched young control subjects (YC), for (A) putamen, (B) caudate, and (C)nucleus accumbens. Top row: local (uncorrected) p values are mapped on the 3-D models of each structure using a color code. Bottom row: percentage differences are mapped withthe same color code. The dorsal and ventral components (left and right) are shown for each structure. Components surviving correction for multiple comparisons on permutationtest are denoted by the corresponding p value. Abbreviations: L, left; R, right.
M. Pievani et al. / Neurobiology of Aging 34 (2013) 1728e1739 1733
ventromedial and the dorsolateral portions (Supplementary Fig.1B).These maps were significant after multiple comparisons correctionsfor the left but not the right hemisphere (p ¼ 0.009 and p ¼ 0.04 forthe dorsal and ventral left; p > 0.18 for the dorsal and ventral right;permutation test).
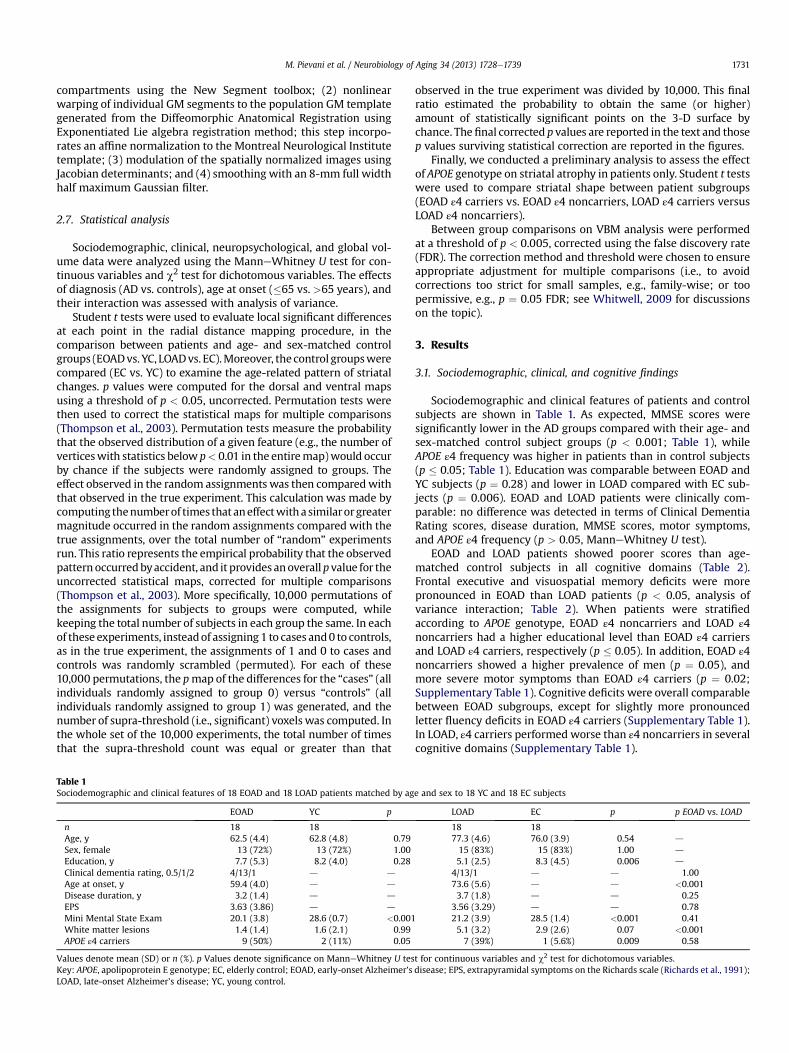
3.3.4. APOE effect on striatal atrophyDirect comparisons between patient subgroups showed no
significant differences between EOAD ε4 carriers and EOAD ε4noncarriers in the nucleus accumbens and putamen (p > 0.05,permutation test; Fig. 4A and C), nor between LOAD ε4 carriers andLOAD ε4 noncarriers (p > 0.05; Fig. 5A and C). Significant differ-ences were detected between LOAD ε4 carriers and LOAD ε4noncarriers in the dorsal and ventral caudate bilaterally (p< 0.03 inall the components, permutation test; Fig. 5B), but not betweenEOAD subgroups (p > 0.15, permutation test; Fig. 4B). Differencesbetween LOAD ε4 carriers and LOAD ε4 noncarriers corresponded toa small surface reduction in the dorsomedial portions of ε4 carriers,and diffuse surface reductions in the ventromedial portions ofε4 noncarriers.
3.3.5. Post hoc neuropsychological analysisTo investigate a possible association between caudate shape
changes and cognitive deficits, the caudate was correlated with
scores of frontal executive functions (Trail Making Test Part B),language (Token test), and visuospatial functioning (Rey FigureCopy). Separate analyses were carried out for EOAD and LOADpatients. These analyses revealed a significant association betweencaudate shape and the Rey Figure Copy scores, with worse scoresassociated with surface enlargements in the ventromedial anddorsolateral regions (p ¼ 0.001 in the ventral left, p ¼ 0.02 in thedorsal left, p ¼ 0.04 in the ventral right, p ¼ 0.27 in the dorsal right,permutation test; Supplementary Fig. 2A) and a similar patternwith the Trail Making Test Part B, correlations being significant inthe ventral left only (p ¼ 0.07 and p¼ 0.02 in the dorsal and ventralleft, p > 0.14 in the right, permutation test; Supplementary Fig. 2B)in LOAD patients. Correlations between caudate shape and theToken test were not significant (p > 0.30; permutation test). Nosignificant association was detected in EOAD patients (p > 0.11,permutation test).
3.4. Patterns of cortical atrophy
EOAD compared with YC subjects showed widespread GMcortical atrophy, primarily in the temporoparietal cortex (lateraltemporal cortex, supramarginal gyrus, inferior parietal), MTL(amygdale and hippocampus), posterior cingulate, basal ganglia(putamen and thalamus), and temporo-occipital cortex (p < 0.005
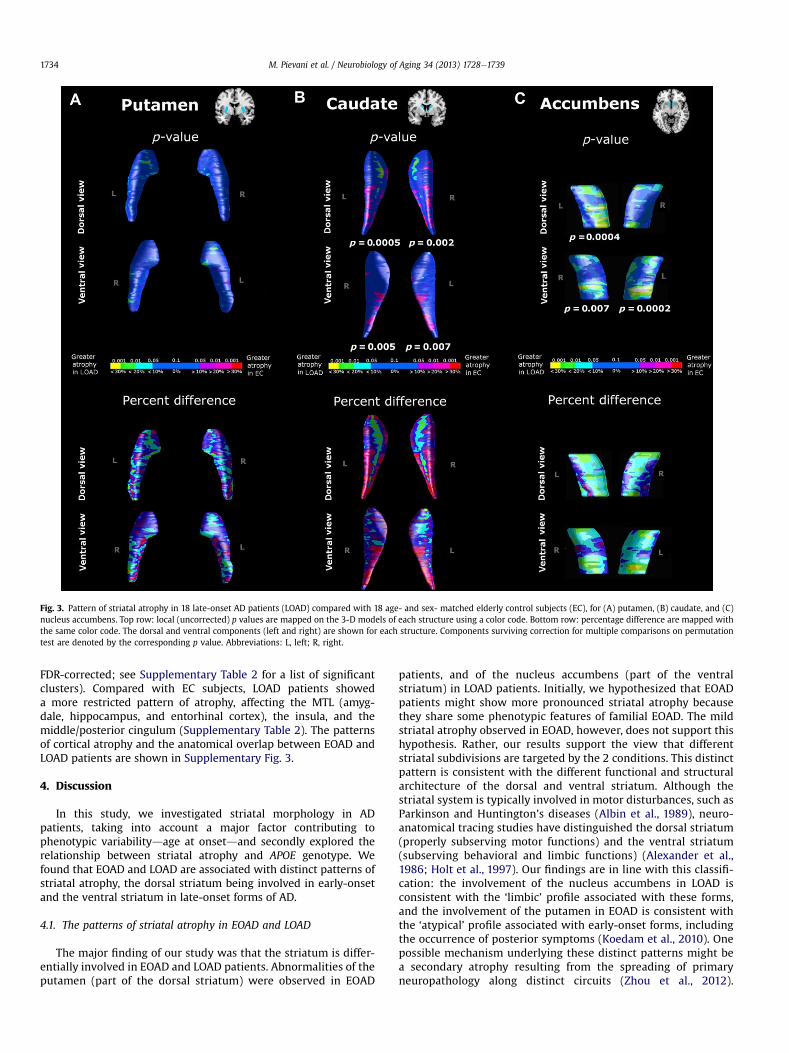
Fig. 3. Pattern of striatal atrophy in 18 late-onset AD patients (LOAD) compared with 18 age- and sex- matched elderly control subjects (EC), for (A) putamen, (B) caudate, and (C)nucleus accumbens. Top row: local (uncorrected) p values are mapped on the 3-D models of each structure using a color code. Bottom row: percentage difference are mapped withthe same color code. The dorsal and ventral components (left and right) are shown for each structure. Components surviving correction for multiple comparisons on permutationtest are denoted by the corresponding p value. Abbreviations: L, left; R, right.
M. Pievani et al. / Neurobiology of Aging 34 (2013) 1728e17391734
FDR-corrected; see Supplementary Table 2 for a list of significantclusters). Compared with EC subjects, LOAD patients showeda more restricted pattern of atrophy, affecting the MTL (amyg-dale, hippocampus, and entorhinal cortex), the insula, and themiddle/posterior cingulum (Supplementary Table 2). The patternsof cortical atrophy and the anatomical overlap between EOAD andLOAD patients are shown in Supplementary Fig. 3.
4. Discussion
In this study, we investigated striatal morphology in ADpatients, taking into account a major factor contributing tophenotypic variabilitydage at onsetdand secondly explored therelationship between striatal atrophy and APOE genotype. Wefound that EOAD and LOAD are associated with distinct patterns ofstriatal atrophy, the dorsal striatum being involved in early-onsetand the ventral striatum in late-onset forms of AD.
4.1. The patterns of striatal atrophy in EOAD and LOAD
The major finding of our study was that the striatum is differ-entially involved in EOAD and LOAD patients. Abnormalities of theputamen (part of the dorsal striatum) were observed in EOAD
patients, and of the nucleus accumbens (part of the ventralstriatum) in LOAD patients. Initially, we hypothesized that EOADpatients might show more pronounced striatal atrophy becausethey share some phenotypic features of familial EOAD. The mildstriatal atrophy observed in EOAD, however, does not support thishypothesis. Rather, our results support the view that differentstriatal subdivisions are targeted by the 2 conditions. This distinctpattern is consistent with the different functional and structuralarchitecture of the dorsal and ventral striatum. Although thestriatal system is typically involved in motor disturbances, such asParkinson and Huntington’s diseases (Albin et al., 1989), neuro-anatomical tracing studies have distinguished the dorsal striatum(properly subserving motor functions) and the ventral striatum(subserving behavioral and limbic functions) (Alexander et al.,1986; Holt et al., 1997). Our findings are in line with this classifi-cation: the involvement of the nucleus accumbens in LOAD isconsistent with the ‘limbic’ profile associated with these forms,and the involvement of the putamen in EOAD is consistent withthe ‘atypical’ profile associated with early-onset forms, includingthe occurrence of posterior symptoms (Koedam et al., 2010). Onepossible mechanism underlying these distinct patterns might bea secondary atrophy resulting from the spreading of primaryneuropathology along distinct circuits (Zhou et al., 2012).
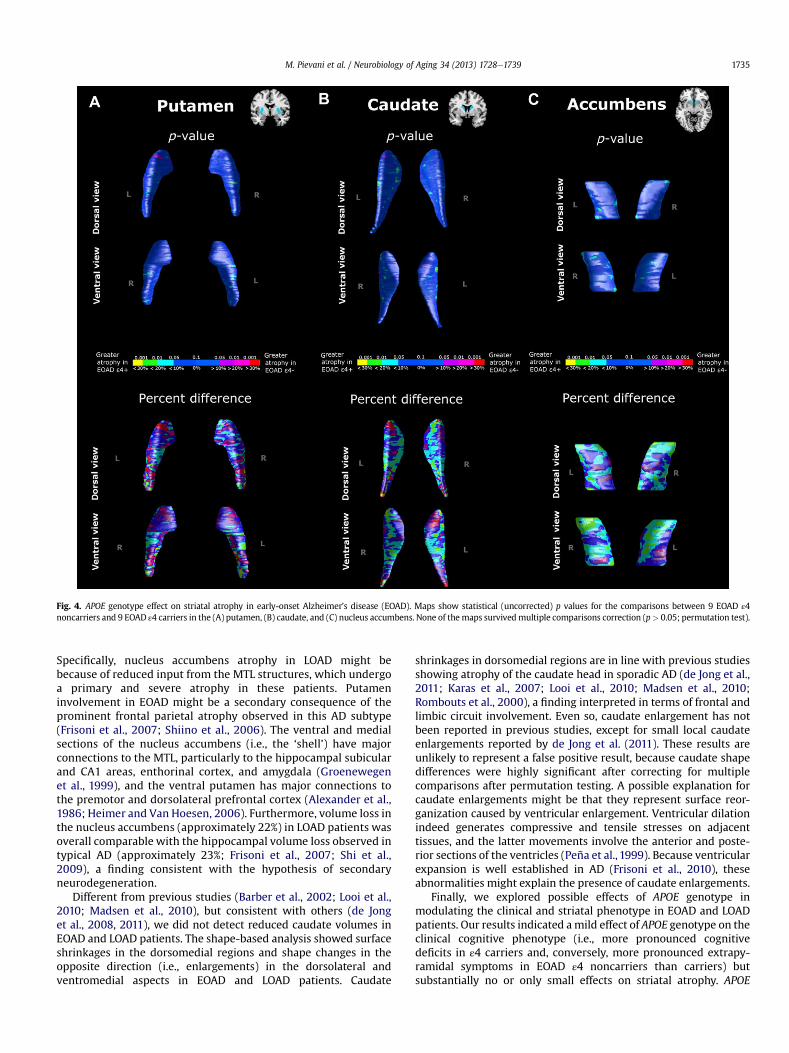
Fig. 4. APOE genotype effect on striatal atrophy in early-onset Alzheimer’s disease (EOAD). Maps show statistical (uncorrected) p values for the comparisons between 9 EOAD ε4noncarriers and 9 EOAD ε4 carriers in the (A) putamen, (B) caudate, and (C) nucleus accumbens. None of the maps survivedmultiple comparisons correction (p> 0.05; permutation test).
M. Pievani et al. / Neurobiology of Aging 34 (2013) 1728e1739 1735
Specifically, nucleus accumbens atrophy in LOAD might bebecause of reduced input from the MTL structures, which undergoa primary and severe atrophy in these patients. Putameninvolvement in EOAD might be a secondary consequence of theprominent frontal parietal atrophy observed in this AD subtype(Frisoni et al., 2007; Shiino et al., 2006). The ventral and medialsections of the nucleus accumbens (i.e., the ‘shell’) have majorconnections to the MTL, particularly to the hippocampal subicularand CA1 areas, enthorinal cortex, and amygdala (Groenewegenet al., 1999), and the ventral putamen has major connections tothe premotor and dorsolateral prefrontal cortex (Alexander et al.,1986; Heimer and Van Hoesen, 2006). Furthermore, volume loss inthe nucleus accumbens (approximately 22%) in LOAD patients wasoverall comparable with the hippocampal volume loss observed intypical AD (approximately 23%; Frisoni et al., 2007; Shi et al.,2009), a finding consistent with the hypothesis of secondaryneurodegeneration.
Different from previous studies (Barber et al., 2002; Looi et al.,2010; Madsen et al., 2010), but consistent with others (de Jonget al., 2008, 2011), we did not detect reduced caudate volumes inEOAD and LOAD patients. The shape-based analysis showed surfaceshrinkages in the dorsomedial regions and shape changes in theopposite direction (i.e., enlargements) in the dorsolateral andventromedial aspects in EOAD and LOAD patients. Caudate
shrinkages in dorsomedial regions are in line with previous studiesshowing atrophy of the caudate head in sporadic AD (de Jong et al.,2011; Karas et al., 2007; Looi et al., 2010; Madsen et al., 2010;Rombouts et al., 2000), a finding interpreted in terms of frontal andlimbic circuit involvement. Even so, caudate enlargement has notbeen reported in previous studies, except for small local caudateenlargements reported by de Jong et al. (2011). These results areunlikely to represent a false positive result, because caudate shapedifferences were highly significant after correcting for multiplecomparisons after permutation testing. A possible explanation forcaudate enlargements might be that they represent surface reor-ganization caused by ventricular enlargement. Ventricular dilationindeed generates compressive and tensile stresses on adjacenttissues, and the latter movements involve the anterior and poste-rior sections of the ventricles (Peña et al., 1999). Because ventricularexpansion is well established in AD (Frisoni et al., 2010), theseabnormalities might explain the presence of caudate enlargements.
Finally, we explored possible effects of APOE genotype inmodulating the clinical and striatal phenotype in EOAD and LOADpatients. Our results indicated amild effect of APOE genotype on theclinical cognitive phenotype (i.e., more pronounced cognitivedeficits in ε4 carriers and, conversely, more pronounced extrapy-ramidal symptoms in EOAD ε4 noncarriers than carriers) butsubstantially no or only small effects on striatal atrophy. APOE
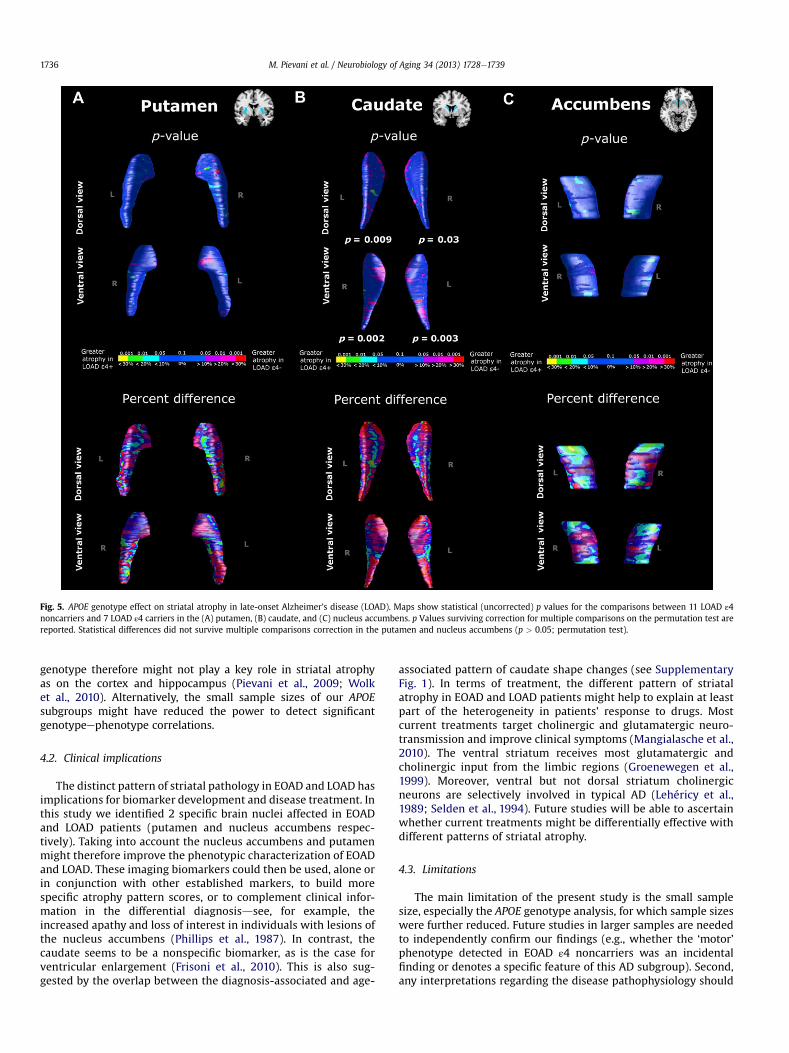
Fig. 5. APOE genotype effect on striatal atrophy in late-onset Alzheimer’s disease (LOAD). Maps show statistical (uncorrected) p values for the comparisons between 11 LOAD ε4noncarriers and 7 LOAD ε4 carriers in the (A) putamen, (B) caudate, and (C) nucleus accumbens. p Values surviving correction for multiple comparisons on the permutation test arereported. Statistical differences did not survive multiple comparisons correction in the putamen and nucleus accumbens (p > 0.05; permutation test).
M. Pievani et al. / Neurobiology of Aging 34 (2013) 1728e17391736
genotype therefore might not play a key role in striatal atrophyas on the cortex and hippocampus (Pievani et al., 2009; Wolket al., 2010). Alternatively, the small sample sizes of our APOEsubgroups might have reduced the power to detect significantgenotypeephenotype correlations.
4.2. Clinical implications
The distinct pattern of striatal pathology in EOAD and LOAD hasimplications for biomarker development and disease treatment. Inthis study we identified 2 specific brain nuclei affected in EOADand LOAD patients (putamen and nucleus accumbens respec-tively). Taking into account the nucleus accumbens and putamenmight therefore improve the phenotypic characterization of EOADand LOAD. These imaging biomarkers could then be used, alone orin conjunction with other established markers, to build morespecific atrophy pattern scores, or to complement clinical infor-mation in the differential diagnosisdsee, for example, theincreased apathy and loss of interest in individuals with lesions ofthe nucleus accumbens (Phillips et al., 1987). In contrast, thecaudate seems to be a nonspecific biomarker, as is the case forventricular enlargement (Frisoni et al., 2010). This is also sug-gested by the overlap between the diagnosis-associated and age-
associated pattern of caudate shape changes (see SupplementaryFig. 1). In terms of treatment, the different pattern of striatalatrophy in EOAD and LOAD patients might help to explain at leastpart of the heterogeneity in patients’ response to drugs. Mostcurrent treatments target cholinergic and glutamatergic neuro-transmission and improve clinical symptoms (Mangialasche et al.,2010). The ventral striatum receives most glutamatergic andcholinergic input from the limbic regions (Groenewegen et al.,1999). Moreover, ventral but not dorsal striatum cholinergicneurons are selectively involved in typical AD (Lehéricy et al.,1989; Selden et al., 1994). Future studies will be able to ascertainwhether current treatments might be differentially effective withdifferent patterns of striatal atrophy.
4.3. Limitations
The main limitation of the present study is the small samplesize, especially the APOE genotype analysis, for which sample sizeswere further reduced. Future studies in larger samples are neededto independently confirm our findings (e.g., whether the ‘motor’phenotype detected in EOAD ε4 noncarriers was an incidentalfinding or denotes a specific feature of this AD subgroup). Second,any interpretations regarding the disease pathophysiology should
M. Pievani et al. / Neurobiology of Aging 34 (2013) 1728e1739 1737
be made with caution because of the cross-sectional design of thestudy. Longitudinal studies are required to ascertain the pattern ofpathology in AD subtypes. Third, in our study we used a manualtechnique to outline the striatal nuclei, which might lead to lessreproducible findings compared with fully automated approaches.However, manual tracing techniques still represent the gold stan-dard for brain structures measurement, and automated techniquesmight be less accurate in segmenting nuclei with subtle boundariesbetween gray-white (e.g., the putamen) and gray-gray (e.g.,between the nucleus accumbens and caudate) tissues, and inregions where WM periventricular hyperintensities can be mis-classified as graymatter. A further possible source of error might beintroduced in other studies, in which nonlinear registration algo-rithms are used to align scans characterized by gross cerebralatrophy and ventricular enlargement, as is common in elderlysubjects and in AD patients. The manual delineation of thesubcortical nuclei overcomes all these limitations. Finally, we useda 1.0 T scanner, which is slightly lower than field strength used inmost clinical settings (1.5 T). Although 1.0 T might offer a lowercontrast-to-noise ratio for tissue differentiation compared withhigher fields, our scans had sufficient contrast to differentiate grayand white matter. Moreover, lower field scanners might suffer lessfrom artifacts that are generally more pronounced at higher fields,such as susceptibility variations, chemical shift, or fieldinhomogeneity.
4.4. Conclusion
Overall, these findings support the view that age at onsetmodulates the pattern of striatal pathology in AD. LOAD wasassociated with nucleus accumbens atrophy, and EOAD withputamen atrophy. Moreover, our preliminary findings suggest thatAPOE genotype might interact with age at onset to influence thedisease phenotype and therefore to account for both of these factorsin studies of sporadic AD.
Disclosure statement
Dr M. Pievani, M. Bocchetta, M. Boccardi, E. Cavedo, andM. Bonetti have nothing to disclose. Dr P. Thompson serves oneditorial advisory boards for IEEE Transactions on Medical Imaging,Human Brain Mapping, Medical Image Analysis, Cerebral Cortex,Current Medical Imaging Reviews, Inverse Problems and Imaging, andTranslational Neuroscience; and receives research support from theNational Institutes of Health. Dr G.B. Frisoni serves on the editorialboards of Lancet Neurology, Aging Clinical and Experimental Research,Alzheimer’s Disease and Associated Disorders, and Neurodegener-ative Diseases, and is a Section Editor for Neurobiology of Aging. Heserves/has served on the advisory boards for Lilly, BMS, Bayer,Lundbeck, Elan, Astra Zeneca, Pfizer, Taurx, and Wyeth; hasreceived grants from Wyeth International, Lilly International,Lundbeck Italia, and the Alzheimer’s Association.
The project was approved by the local Ethics Committee.Written informed consent was obtained from all the participants.
Acknowledgements
This work was supported by grants Ex Art 56533F/B 1 andPS-Neuro Ex 56/05/11. Part of the costs of patient assessment andimage and marker collection were funded by an ad hoc grant fromthe “Millennium Fitness e Solidarietà” fund raising campaign, andby grants from the Italian Ministry of Health, Ricerca Finalizzata“Sviluppo di indicatori di danno cerebrovascolare clinicamentesignificativo alla risonanza magnetica strutturale” (grant 196/2002),and “Archivio normativo italiano di morfometria cerebrale con
risonanza magnetica (40þ)” (grant ICS 030.13/RF00.343). Algorithmdevelopment for this studywas supported in part by research grantsfrom the National Center for Research Resources (grant P41RR13642), the National Institute of Mental Health (grant RO1MH60374), the National Institutes of Health Roadmap Initiative(grant P20 RR020750), the National Library of Medicine (grantR01 LM05639), and by grants R21 EB01651, R21 RR019771, andAG016570 (to P. Thompson).
The patients of this study have been assessed in the context ofthe Translational Outpatient Memory Clinic (TOMC) of the IRCCSFatebenefratelli, Brescia. The TOMC Working Group is comprisedof the Translational Unit (Head: G.B. Frisoni), Alzheimer’sUnit (Head: O. Zanetti), LENITEMdLaboratory of Neuroimaging(Head: G.B. Frisoni), Laboratory of Neurobiology (Head: G. Binetti),Laboratory of Proteomics (Head: R. Ghidoni), Laboratory ofGenetics (Head: M. Gennarelli), Laboratory of Neuropsycho-pharmacology (Head: L. Bocchio-Chiavetto), Laboratory of Neuro-psychology (Head: M. Cotelli), Laboratory of Neurophysiology(Head: C. Miniussi), and Bioethics Unit (C. Porteri).
Appendix A. Supplementary data
Supplementary data associated with this article can be found, inthe online version, at http://dx.doi.org/10.1016/j.neurobiolaging.2013.01.016.
References
Albin, R.L., Young, A.B., Penney, J.B., 1989. The functional anatomy of basal gangliadisorders. Trends Neurosci. 12, 366e375.
Alexander, G.E., DeLong, M.R., Strick, P.L., 1986. Parallel organization of functionallysegregated circuits linking basal ganglia and cortex. Annu. Rev. Neurosci. 9,357e381.
Amodio, P., Wenin, H., Del Piccolo, F., Mapelli, D., Montagnese, S., Pellegrini, A.,Musto, C., Gatta, A., Umiltà, C., 2002. Variability of trail making test, symboldigit test and line trait test in normal people. A normative study taking intoaccount age-dependent decline and sociobiological variables. Aging Clin. Exp.Res. 14, 117e131.
Ashburner, J., 2007. A fast diffeomorphic image registration algorithm. Neuroimage38, 95e113.
Balasa, M., Gelpi, E., Antonell, A., Rey, M.J., Sánchez-Valle, R., Molinuevo, J.L.,Lladó, A., Neurological Tissue Bank/University of Barcelona/Hospital Clínic NTB/UB/HC Collaborative Group, 2011. Clinical features and APOE genotype ofpathologically proven early-onset Alzheimer disease. Neurology 76,1720e1725.
Barber, R., McKeith, I., Ballard, C., O’Brien, J., 2002. Volumetric MRI study of thecaudate nucleus in patients with dementia with Lewy bodies, Alzheimer’sdisease, and vascular dementia. J. Neurol. Neurosurg. Psychiatry 72, 406e407.
Boccardi, M., Bocchetta, M., Aronen, H.J., Repo-Tiihonen, E., Vaurio, O., Thompson,P.M., Tiihonen, J., Frisoni, G.B., in press. Atypical nucleus accumbens morphologyin psychopathy: another limbic piece in the puzzle. Int. J. Law Psychiatry. http://dx.doi.org/10.1016/j.ijlp.2013.01.008.
Braak, H., Braak, E., 1990. Alzheimer’s disease: striatal amyloid deposits andneurofibrillary changes. J. Neuropathol. Exp. Neurol. 49, 215e224.
Caffarra, P., Vezzadini, G., Dieci, F., Zonato, F., Venneri, A., 2002. Rey-Osterriethcomplex figure: normative values in an Italian population sample. Neurol. Sci.22, 443e447.
Carlesimo, G.A., Caltagirone, C., Gainotti, G., 1996. The Mental Deterioration Battery:normative data, diagnostic reliability and qualitative analyses of cognitiveimpairment. The Group for the Standardization of the Mental DeteriorationBattery. Eur. Neurol. 36, 378e384.
de Jong, L.W., Ferrarini, L., van der Grond, J., Milles, J.R., Reiber, J.H., Westendorp, R.G.,Bollen, E.L., Middelkoop, H.A., van Buchem, M.A., 2011. Shape abnormalities ofthe striatum in Alzheimer’s disease. J. Alzheimers Dis. 23, 49e59.
de Jong, L.W., van der Hiele, K., Veer, I.M., Houwing, J.J., Westendorp, R.G.,Bollen, E.L., de Bruin, P.W., Middelkoop, H.A., van Buchem, M.A., van derGrond, J., 2008. Strongly reduced volumes of putamen and thalamus in Alz-heimer’s disease: an MRI study. Brain 131, 3277e3285.
De Renzi, E., Vignolo, L.A., 1962. The token test: a sensitive test to detect receptivedisturbances in aphasia. Brain 85, 665e678.
Filippi, M., Agosta, F., Barkhof, F., Dubois, B., Fox, N.C., Frisoni, G.B., Jack, C.R.,Johannsen, P., Miller, B.L., Nestor, P.J., Scheltens, P., Sorbi, S., Teipel, S.,Thompson, P.M., Wahlund, L.O., 2012. EFNS task force: the use of neuroimagingin the diagnosis of dementia. Eur. J. Neurol. 19, e131ee140. 1487e1501.
M. Pievani et al. / Neurobiology of Aging 34 (2013) 1728e17391738
Folstein, M.F., Folstein, S.E., McHugh, P.R., 1975. “Mini-Mental State”. A practicalmethod for grading the cognitive state of patients for the clinician. J. Psychiatr.Res. 12, 189e198.
Frisoni, G.B., Beltramello, A., Weiss, C., Geroldi, C., Bianchetti, A., Trabucchi, M., 1996.Linear measures of atrophy in mild Alzheimer disease. AJNR Am. J. Neuroradiol.17, 913e923.
Frisoni, G.B., Fox, N.C., Jack Jr., C.R., Scheltens, P., Thompson, P.M., 2010. The clinicaluse of structural MRI in Alzheimer disease. Nat. Rev. Neurol. 6, 67e77.
Frisoni, G.B., Pievani, M., Testa, C., Sabattoli, F., Bresciani, L., Bonetti, M.,Beltramello, A., Hayashi, K.M., Toga, A.W., Thompson, P.M., 2007. The topog-raphy of grey matter involvement in early and late onset Alzheimer’s disease.Brain 130, 720e730.
Frisoni, G.B., Testa, C., Sabattoli, F., Beltramello, A., Soininen, H., Laakso, M.P., 2005.Structural correlates of early and late onset Alzheimer’s disease: voxel basedmorphometric study. J. Neurol. Neurosurg. Psychiatry 76, 112e114.
Frisoni, G.B., Prestia, A., Zanetti, O., Galluzzi, S., Romano, M., Cotelli, M.,Gennarelli, M., Binetti, G., Bocchio, L., Paghera, B., Amicucci, G., Bonetti, M.,Benussi, L., Ghidoni, R., Geroldi, C., 2009. Markers of Alzheimer’s disease ina population attending a memory clinic. Alzheimers Dement. 5, 307e317.
Galluzzi, S., Testa, C., Boccardi, M., Bresciani, L., Benussi, L., Ghidoni, R.,Beltramello, A., Bonetti, M., Bono, G., Falini, A., Magnani, G., Minonzio, G.,Piovan, E., Binetti, G., Frisoni, G.B., 2009. The Italian Brain Normative Archive ofstructural MR scans: norms for medial temporal atrophy and white matterlesions. Aging Clin. Exp. Res. 21, 266e276.
Groenewegen, H.J., Wright, C.I., Beijer, A.V., Voorn, P., 1999. Convergence and segre-gation of ventral striatal inputs and outputs. Ann. N. Y. Acad. Sci. 877, 49e63.
Gunning-Dixon, F.M., Head, D., McQuain, J., Acker, J.D., Raz, N., 1998. Differentialaging of the human striatum: a prospective MR imaging study. AJNR Am. J.Neuroradiol. 19, 1501e1507.
Heimer, L., Van Hoesen, G.W., 2006. The limbic lobe and its output channels:implications for emotional functions and adaptive behavior. Neurosci. Biobehav.Rev. 30, 126e147.
Hixson, J.E., Vernier, D.T., 1990. Restriction isotyping of human apolipoprotein E bygene amplification and cleavage with HhaI. J. Lipid Res. 31, 545e548.
Hokama, H., Shenton, M.E., Nestor, P.G., Kikinis, R., Levitt, J.J., Metcalf, D.,Wible, C.G., O’Donnell, B.F., Jolesz, F.A., McCarley, R.W., 1995. Caudate, putamen,and globus pallidus volume in schizophrenia: a quantitative MRI study.Psychiatry Res. 61, 209e229.
Holt, D.J., Graybiel, A.M., Saper, C.B., 1997. Neurochemical architecture of the humanstriatum. J. Comp. Neurol. 384, 1e25.
Hughes, C.P., Berg, L., Danziger, W.L., Coben, L.A., Martin, R.L., 1982. A new clinicalscale for the staging of dementia. Br. J. Psychiatry 140, 566e572.
Ishii, K., Kawachi, T., Sasaki, H., Kono, A.K., Fukuda, T., Kojima, Y., Mori, E., 2005.Voxel-based morphometric comparison between early- and late-onset mildAlzheimer’s disease and assessment of diagnostic performance of z scoreimages. AJNR Am. J. Neuroradiol. 26, 333e340.
Karas, G., Scheltens, P., Rombouts, S., van Schijndel, R., Klein, M., Jones, B., van derFlier, W., Vrenken, H., Barkhof, F., 2007. Precuneus atrophy in early-onset Alz-heimer’s disease: a morphometric structural MRI study. Neuroradiology 49,967e976.
Klunk, W.E., Price, J.C., Mathis, C.A., Tsopelas, N.D., Lopresti, B.J., Ziolko, S.K., Bi, W.,Hoge, J.A., Cohen, A.D., Ikonomovic, M.D., Saxton, J.A., Snitz, B.E., Pollen, D.A.,Moonis, M., Lippa, C.F., Swearer, J.M., Johnson, K.A., Rentz, D.M., Fischman, A.J.,Aizenstein, H.J., DeKosky, S.T., 2007. Amyloid deposition begins in the striatumof presenilin-1 mutation carriers from two unrelated pedigrees. J. Neurosci. 27,6174e6184.
Koedam, E.L., Lauffer, V., van der Vlies, A.E., van der Flier, W.M., Scheltens, P.,Pijnenburg, Y.A., 2010. Early-versus late-onset Alzheimer’s disease: more thanage alone. J. Alzheimers Dis. 19, 1401e1408.
Koivunen, J., Verkkoniemi, A., Aalto, S., Paetau, A., Ahonen, J.P., Viitanen, M.,Någren, K., Rokka, J., Haaparanta, M., Kalimo, H., Rinne, J.O., 2008. PET amyloidligand [11C]PIB uptake shows predominantly striatal increase in variant Alz-heimer’s disease. Brain 131, 1845e1853.
Lehéricy, S., Hirsch, E.C., Cervera, P., Hersh, L.B., Hauw, J.J., Ruberg, M., Agid, Y., 1989.Selective loss of cholinergic neurons in the ventral striatum of patients withAlzheimer disease. Proc. Natl. Acad. Sci. U. S. A. 86, 8580e8584.
Looi, J.C., Walterfang, M., Styner, M., Svensson, L., Lindberg, O., Ostberg, P., Botes, L.,Orndahl, E., Chua, P., Kumar, R., Velakoulis, D., Wahlund, L.O., 2010. Shapeanalysis of the neostriatum in frontotemporal lobar degeneration, Alzheimer’sdisease, and controls. Neuroimage 51, 970e986.
Madsen, S.K., Ho, A.J., Hua, X., Saharan, P.S., Toga, A.W., Jack Jr., C.R.,Weiner, M.W., Thompson, P.M., Alzheimer’s Disease Neuroimaging Initiative,2010. 3D maps localize caudate nucleus atrophy in 400 Alzheimer’s disease,mild cognitive impairment, and healthy elderly subjects. Neurobiol. Aging 31,1312e1325.
Makris, N., Meyer, J.W., Bates, J.F., Yeterian, E.H., Kennedy, D.N., Caviness, V.S., 1999.MRI-based topographic parcellation of human cerebral white matter and nucleiII. Rationale and applications with systematics of cerebral connectivity. Neu-roimage 9, 18e45.
Mangialasche, F., Solomon,A.,Winblad, B.,Mecocci, P., Kivipelto,M., 2010.Alzheimer’sdisease: clinical trials and drug development. Lancet Neurol. 9, 702e716.
Mann, D.M., 1991. The topographic distribution of brain atrophy in Alzheimer’sdisease. Acta Neuropathol. 83, 81e86.
McKhann, G.M., Knopman, D.S., Chertkow, H., Bradley, T., Hyman, B.T., Jack, C.R.,Kawas, C.H., Klunk, W.E., Koroshetz, W.J., Manly, J.J., Mayeux, R., Mohs, R.C.,
Morris, J.C., Rossor, M.N., Scheltens, P., Carrillo, M.C., Thies, B., Weintraub, S.,Phelps, C.H., 2011. The diagnosis of dementia due to Alzheimer’s disease:recommendations from the National Institute on Aging and the Alzheimer’sAssociation workgroup. Alzheimers Dement. 7, 263e269.
Murray, M.E., Graff-Radford, N.R., Ross, O.A., Petersen, R.C., Duara, R.,Dickson, D.W., 2011. Neuropathologically defined subtypes of Alzheimer’sdisease with distinct clinical characteristics: a retrospective study. LancetNeurol. 10, 785e796.
Novelli, G., Papagno, C., Capitani, E., Laiacona, M., Vallar, G., Cappa, S.F., 1986. Tre testclinici di ricerca e produzione lessicale. Taratura su soggetti normali [Threeclinical tests to research and rate the lexical performance of normal subjects].Arch. Psicol. Neurol. Psichiatr. 47, 477e506 [in Italian].
Peña, A., Bolton, M.D., Whitehouse, H., Pickard, J.D., 1999. Effects of brain ventricularshape on periventricular biomechanics: a finite-element analysis. Neurosurgery45, 107e116.
Phillips, S., Sangalang, V., Sterns, G., 1987. Basal forebrain infarction. A clinico-pathologic correlation. Arch. Neurol. 44, 1134e1138.
Pievani, M., Rasser, P.E., Galluzzi, S., Benussi, L., Ghidoni, R., Sabattoli, F., Bonetti, M.,Binetti, G., Thompson, P.M., Frisoni, G.B., 2009. Mapping the effect of APOEepsilon4 on gray matter loss in Alzheimer’s disease in vivo. Neuroimage 45,1090e1098.
Reitan, R.M., 1958. Validity of the trailmaking test as an indication of organic braindamage. Percept. Mot. Skills 8, 271e276.
Remes, A.M., Laru, L., Tuominen, H., Aalto, S., Kemppainen, N., Mononen, H.,Någren, K., Parkkola, R., Rinne, J.O., 2008. Carbon 11-labeled Pittsburghcompound B positron emission tomographic amyloid imaging in patients withAPP locus duplication. Arch. Neurol. 65, 540e544.
Richards, M., Marder, K., Bell, K., Dooneief, G., Mayeux, R., Stern, Y., 1991. Interraterreliability of extrapyramidal signs in a group assessed for dementia. Arch.Neurol. 48, 1147e1149.
Rombouts, S.A., Barkhof, F., Witter, M.P., Scheltens, P., 2000. Unbiased whole-brainanalysis of gray matter loss in Alzheimer’s disease. Neurosci. Lett. 285,231e233.
Selden, N., Geula, C., Hersh, L., Mesulam, M.M., 1994. Human striatum: chemo-architecture of the caudate nucleus, putamen and ventral striatum in health andAlzheimer’s disease. Neuroscience 60, 621e636.
Shi, F., Liu, B., Zhou, Y., Yu, C., Jiang, T., 2009. Hippocampal volume and asymmetry inmild cognitive impairment and Alzheimer’s disease: Meta-analyses of MRIstudies. Hippocampus 19, 1055e1064.
Shiino, A., Watanabe, T., Kitagawa, T., Kotani, E., Takahashi, J., Morikawa, S.,Akiguchi, I., 2008. Different atrophic patterns in early- and late-onset Alz-heimer’s disease and evaluation of clinical utility of a method of regionalz-score analysis using voxel-based morphometry. Dement. Geriatr. Cogn.Disord. 26, 175e186.
Shiino, A., Watanabe, T., Maeda, K., Kotani, E., Akiguchi, I., Matsuda, M., 2006. Foursubgroups of Alzheimer’s disease based on patterns of atrophy using VBM anda unique pattern for early onset disease. Neuroimage 33, 17e26.
Sjögren, M., Vanderstichele, H., Agren, H., Zachrisson, O., Edsbagge, M., Wikkelsø, C.,Skoog, I., Wallin, A., Wahlund, L.O., Marcusson, J., Nägga, K., Andreasen, N.,Davidsson, P., Vanmechelen, E., Blennow, K., 2001. Tau and Abeta42 in cere-brospinal fluid from healthy adults 21-93 years of age: establishment of refer-ence values. Clin. Chem. 47, 1776e1781.
Smits, L.L., Pijnenburg, Y.A., Koedam, E.L., van der Vlies, A.E., Reuling, I.E., Koene, T.,Teunissen, C.E., Scheltens, P., van der Flier, W.M., 2012. Early onset Alzheimer’sdisease is associated with a distinct neuropsychological profile. J. AlzheimersDis. 30, 101e108.
Spinnler, H., Tognoni, G., 1987. Standardizzazione e taratura italiana di test neuro-psicologici [Standardization and Italian norms of neuropsychological tests]. Ital.J. Neurol. Sci. 6 (Suppl 8) [in Italian].
Suenaga, T., Hirano, A., Llena, J.F., Yen, S.H., Dickson, D.W., 1990. Modified Biel-schowsky stain and immunohistochemical studies on striatal plaques in Alz-heimer’s disease. Acta Neuropathol. 80, 280e286.
Thal, D.R., Rüb, U., Orantes, M., Braak, H., 2002. Phases of A beta-deposition in thehuman brain and its relevance for the development of AD. Neurology 58,1791e1800.
Thompson, P.M., Hayashi, K.M., de Zubicaray, G., Janke, A.L., Rose, S.E., Semple, J.,Herman, D., Hong, M.S., Dittmer, S.S., Doddrell, D.M., Toga, A.W., 2003.Dynamics of gray matter loss in Alzheimer’s disease. J. Neurosci. 23,994e1005.
Thompson, P.M., Hayashi, K.M., Sowell, E.R., Gogtay, N., Giedd, J.N., Rapoport, J.L., deZubicaray, G.I., Janke, A.L., Rose, S.E., Semple, J., Doddrell, D.M., Wang, Y., vanErp, T.G., Cannon, T.D., Toga, A.W., 2004. Mapping cortical change in Alzheimer’sdisease, brain development, and schizophrenia. Neuroimage 23 (suppl. 1),S2eS18.
Thompson, P.M., Schwartz, C., Toga, A.W., 1996. High-resolution random meshalgorithms for creating a probabilistic 3D surface atlas of the human brain.Neuroimage 3, 19e34.
van der Flier, W.M., Pijnenburg, Y.A., Fox, N.C., Scheltens, P., 2011. Early-onset versuslate-onset Alzheimer’s disease: the case of the missing APOE 34 allele. LancetNeurol. 10, 280e288.
Villemagne, V.L., Ataka, S., Mizuno, T., Brooks, W.S., Wada, Y., Kondo, M., Jones, G.,Watanabe, Y., Mulligan, R., Nakagawa, M., Miki, T., Shimada, H., O’Keefe, G.J.,Masters, C.L., Mori, H., Rowe, C.C., 2009. High striatal amyloid beta-peptidedeposition across different autosomal Alzheimer disease mutation types.Arch. Neurol. 66, 1537e1544.

M. Pievani et al. / Neurobiology of Aging 34 (2013) 1728e1739 1739
Wahlund, L.O., Barkhof, F., Fazekas, F., Bronge, L., Augustin, M., Sjögren, M.,Wallin, A., Ader, H., Leys, D., Pantoni, L., Pasquier, F., Erkinjuntti, T., Scheltens, P.,European Task Force on Age-Related White Matter Changes, 2001. A new ratingscale for age-related white matter changes applicable to MRI and CT. Stroke 32,1318e1322.
Whitwell, J.L., 2009. Voxel-based morphometry: an automated technique forassessing structural changes in the brain. J. Neurosci. 29, 9661e9664.
Wolk, D.A., Dickerson, B.C., Alzheimer’s Disease Neuroimaging Initiative, 2010.Apolipoprotein E (APOE) genotype has dissociable effects on memory andattentional-executive network function in Alzheimer’s disease. Proc. Natl. Acad.Sci. U. S. A. 107, 10256e10261.
Zhou, J., Gennatas, E.D., Kramer, J.H., Miller, B.L., Seeley, W.W., 2012. Predictingregional neurodegeneration from the healthy brain functional connectome.Neuron 73, 1216e1227.
Top Related