


Languages
Pages
Legal


Strategy and OutlookSeptember 2019

Line 1
2019 Strategy and Outlook
Base for all bar charts
axis labels base
Line 1 Text under charts
Line 2 Text under charts
Line 2
Total, sustainable and profitable growth
2
Sustainability means
Coping with volatile and changing
energy markets
Focusing on breakeven and
financial strength
Building on our strengths for profitable
integrated oil & gas growth
Investing in growing energy markets
(LNG & power) for medium and long term
Committing to long term shareholder return

Line 1
2019 Strategy and Outlook
Base for all bar charts
axis labels base
Line 1 Text under charts
Line 2 Text under charts
Line 2
1
2
2014 1H19
But 3 fatalities in 2019
Safety, Total’s core valueCornerstone of operational efficiency and sustainability
Total Recordable Injury Rate for Total and peers*Per million man-hours
3
Contractors
GroupStaff
0.8
* Group TRIR excl. Specialty Chemicals
Peers: BP, Chevron, ExxonMobil, Shell

Line 1
2019 Strategy and Outlook
Base for all bar charts
axis labels base
Line 1 Text under charts
Line 2 Text under charts
Line 2
2015 2018 2025• Each site to display CO2 emissions to
promote staff awareness
• “CO2 fighter squad” to leverage all Total
competences and reduce CO2 emissions
Reducing CO2 emissions while growing the company
Scope 1 & 2 emissions from operated oil & gas facilitiesMt/y - CO2 eq
< 40
46
42
4
New
Flaring reduction Methane reduction
Process electrificationEnergy efficiency
CH4

Market trends: coping with volatile and
changing energy markets

Line 1
2019 Strategy and Outlook
Base for all bar charts
axis labels base
Line 1 Text under charts
Line 2 Text under charts
Line 2
Energy markets in transition
Global energy demandMboe/d
300
2017 2040 2040 2040
Renewables
Nuclear
Coal
Oil
Natural gas
Momentum* Rupture* IEA < 2°C**
* Scenarios Total Energy Outlook (Feb. 2019)
** IEA 2018 Sustainable Development Scenario (SDS)
Growing in all scenarios, abundant and affordable,
essential complement to intermittent renewables
Gas
~25% of energy demand in IEA 2°C in 2040
No more growth by 2040
Oil
Energy of the 21st Century
Demand growing by > 50% from 2015-40
Power
Cost base increasingly competitive
Accounts for > 60% of the electricity demand growth
Renewables
6

Line 1
2019 Strategy and Outlook
Base for all bar charts
axis labels base
Line 1 Text under charts
Line 2 Text under charts
Line 2
85
100
Focus on low breakeven oil assets and projects
Oil market fundamentally volatile
Supply-demand and OECD inventoriesMb/d, days of demand cover
Demand
• Sensitive to price and global economic
growth
• Slower demand growth anticipated
for 2019-20
Supply
• Effective discipline from OPEC+
• US production expected to grow at a
slower pace
• Production cuts in Iran, Venezuela and Libya
• Underinvestment in the industry
DemandSupply
2010 2019
* Source: IEA September 2019
+1.1 Mb/ddemand
in 2019*
July 2019:
60.4 days
7

Line 1
2019 Strategy and Outlook
Base for all bar charts
axis labels base
Line 1 Text under charts
Line 2 Text under charts
Line 2
2,500
4,000
2010 2011 2012 2013 2014 2015 2016 2017 2018
Growing gas markets
Supply
• Increasing role of LNG in international gas trade: 9%/y growth over 2015-18
• Fast growing US LNG production
Demand
• Stimulated by low prices
• Switch from coal to gas supported by
• Europe: increasing CO2 prices
• Asia: air quality policies
• Seasonal market impacted by weather
Gas demandBcm/y
Source: Enerdata, Total analysis
1.5%/yover
2010-15
3.8%/yover
2015-18
Priority to integration along the gas value chain
8

Line 1
2019 Strategy and Outlook
Base for all bar charts
axis labels base
Line 1 Text under charts
Line 2 Text under charts
Line 2
2030 2040
350
700
2015
200
450
2015 2018 2020 2022 2024
Market tightening 2021+ Opportunity for low breakeven projects
Strong momentum in LNG marketsAsia driving LNG growth
2015-40 LNG demandMt/y
Medium-term LNG supply & demandMt/y
To besanctioned
Under construction
Existingsupply
9%/y
Demand
5-6%/y Markettightening
9%/y2015-2018
JapanKoreaTaiwan
China
Rest of Asia
Europe
Middle East
Other
India
Reference: Total Energy Outlook - Momentum
9
5%CAGR

Line 1
2019 Strategy and Outlook
Base for all bar charts
axis labels base
Line 1 Text under charts
Line 2 Text under charts
Line 2
Liberalization of markets: opportunity
for newcomers
Natural gas supported by ETS* against coal
Strong European government policies
in favor of renewables
1,500
3,000
2015 2018 2025
Opportunity to build a low carbon electricity player in Europe
Europe: committed to energy transition
EU 28 power generation mixTwh/y
Natural gas
Coal
Nuclear
Oil
10
Renewables
Reference: Total Energy Outlook – Momentum
* Emissions Trading System

Line 1
2019 Strategy and Outlook
Base for all bar charts
axis labels base
Line 1 Text under charts
Line 2 Text under charts
Line 2
Renewables capturing most of world power growth
Demand
• Dynamic power growth driven by non-OECD
countries, in particular China and India
Supply
• Renewables capturing > 90% of 2018-30
power growth in Rupture scenario
25,000
50,000
World power generation mixTwh/y
Natural gas
Othersources
Renewables
2018 2030 2040
Mom* Rup*
* Mom: Momentum scenario Rup: Rupture scenario
Reference: Total Energy Outlook
11
Mom* Rup*
Develop profitable renewable generation business
Line 1
2019 Strategy and Outlook
Base for all bar charts
axis labels base
Line 1 Text under charts
Line 2 Text under charts
Line 2
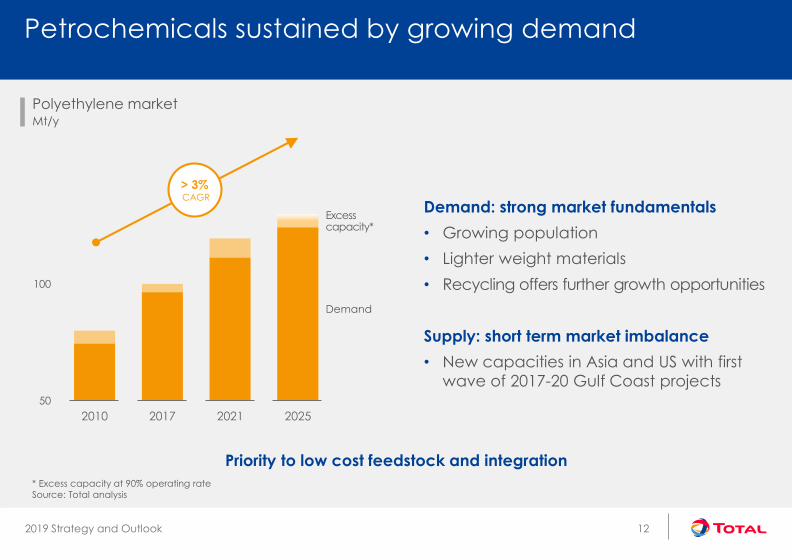
Petrochemicals sustained by growing demand
Polyethylene marketMt/y
50
100
2010 2017 2021 2025
Excess capacity*
Demand
> 3%CAGR
Demand: strong market fundamentals
• Growing population
• Lighter weight materials
• Recycling offers further growth opportunities
Supply: short term market imbalance
• New capacities in Asia and US with first
wave of 2017-20 Gulf Coast projects
Priority to low cost feedstock and integration
12
* Excess capacity at 90% operating rate
Source: Total analysis

Sustainability: focusing on breakeven
and financial strength
Line 1
2019 Strategy and Outlook
Base for all bar charts
axis labels base
Line 1 Text under charts
Line 2 Text under charts
Line 2
30
60
90
120
2014 2015 2016 2017 2018 2019
Brent price
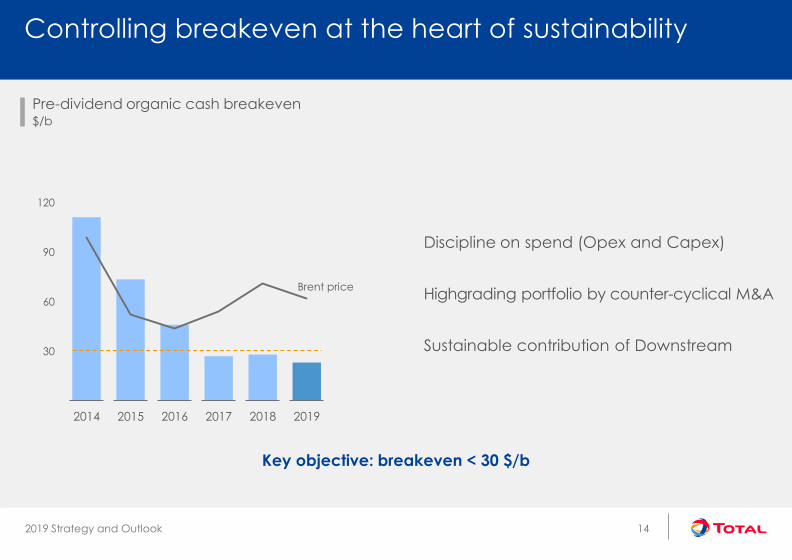
Controlling breakeven at the heart of sustainability
Pre-dividend organic cash breakeven$/b
14
Discipline on spend (Opex and Capex)
Highgrading portfolio by counter-cyclical M&A
Sustainable contribution of Downstream
Key objective: breakeven < 30 $/b
Line 1
2019 Strategy and Outlook
Base for all bar charts
axis labels base
Line 1 Text under charts
Line 2 Text under charts
Line 2
0
10
20
2015 2016 2017 2018 2019
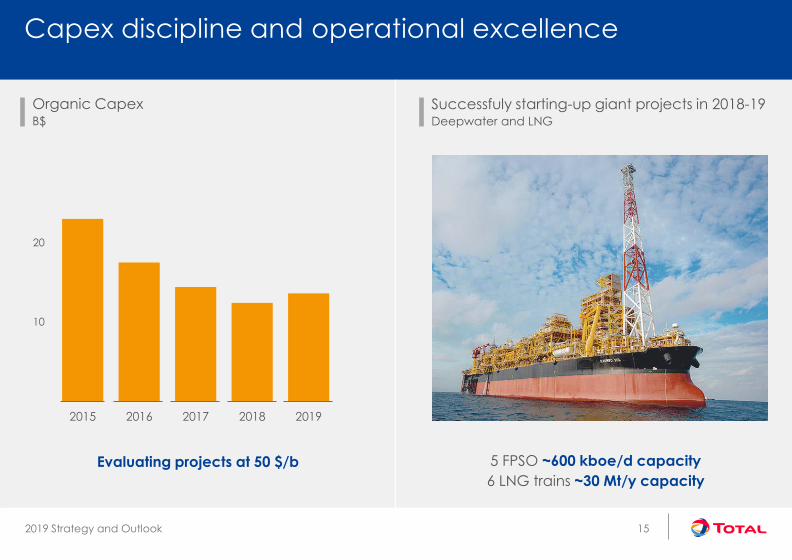
5 FPSO ~600 kboe/d capacity
6 LNG trains ~30 Mt/y capacity
Capex discipline and operational excellence
Successfuly starting-up giant projects in 2018-19Deepwater and LNG
Organic CapexB$
15
Evaluating projects at 50 $/b

Line 1
2019 Strategy and Outlook
Base for all bar charts
axis labels base
Line 1 Text under charts
Line 2 Text under charts
Line 2
2015 2016 2017 2018 2019 2020
Keeping constant pressure on Opex
Leveraging synergies to reduce costsOpex savings vs. 2014 baseB$
Downstream & Corporate
Upstream
4.7 B$
4.2
3.7
2.8
1.5
16
2019+ cost synergies: 300 M$/y
• Headcount reduced by 30% in the UK
• Strong synergies on corporate headquarters
in Denmark
• Leveraging Total purchasing power
Maersk Oil synergies delivered quicker than expected
450 M$ savings in 2018, targeting 1 B$ by 2020
Centralized procurement: from 15% in 2015, 30% in 2018,
to 40% by 2020
On track to deliver Total Global Services ambitious targets
> 5 B$

Line 1
2019 Strategy and Outlook
Base for all bar charts
axis labels base
Line 1 Text under charts
Line 2 Text under charts
Line 2
2020 2023
+ 1 B$ in 2023 vs. 2020
50% Upstream, 50% Downstream & Corporate
Targeting 5 $/boe
Extending cost saving program
Production costs*$/boe
New Group cost reduction programB$ - Savings vs. 2014
5
10
2014 20202018
> 6 B$
> 5 B$< 5.5
* ASC 932
17

Line 1
2019 Strategy and Outlook
Base for all bar charts
axis labels base
Line 1 Text under charts
Line 2 Text under charts
Line 2
Digital: stepping up value creation
Creation of a Digital Factory in 2020
200-300
dedicated engineers
Google partner
on A.I. in Geoscience
Refinery 4.0
Impact on Upstream~1 B$/y*
Impact on Midstream and Downstream
~500 M$/y*
18
* By 2025
Levers: revenues, availability, costs
Line 1
2019 Strategy and Outlook
Base for all bar charts
axis labels base
Line 1 Text under charts
Line 2 Text under charts
Line 2
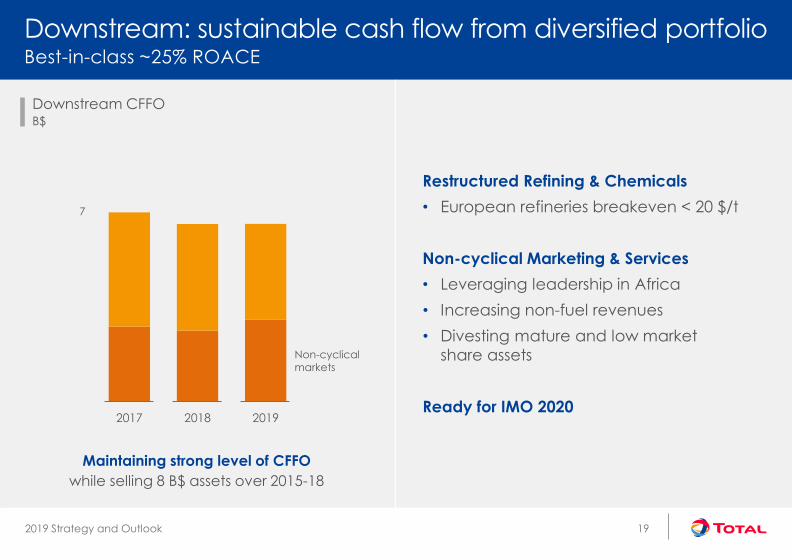
7
2017 2018 2019
Maintaining strong level of CFFO
while selling 8 B$ assets over 2015-18
Downstream: sustainable cash flow from diversified portfolioBest-in-class ~25% ROACE
Downstream CFFOB$
Restructured Refining & Chemicals
• European refineries breakeven < 20 $/t
Non-cyclical Marketing & Services
• Leveraging leadership in Africa
• Increasing non-fuel revenues
• Divesting mature and low market
share assets
Ready for IMO 2020
19
Non-cyclical markets

Line 1
2019 Strategy and Outlook
Base for all bar charts
axis labels base
Line 1 Text under charts
Line 2 Text under charts
Line 2
20%
2015 2016 2017 2018 1H19
Grade A credit rating
Strong balance sheet further ensures sustainabilityGearing < 20%
Net-debt-to-capital for Total and peers*%, end-2Q19 – excluding leases impact
Net-debt-to-capital%
21% 20.6%
12%
22%
Leases
impact15.5%
* Peers: BP, Chevron, ExxonMobil, Shell – based on available public data
20

Line 1
2019 Strategy and Outlook
Base for all bar charts
axis labels base
Line 1 Text under charts
Line 2 Text under charts
Line 2
-0
5%
10%
30%
5%
10%
CFFO (exc. wc) growth – 1H19 vs. 1H18%
Outperforming peers in 1H 2019
Downstream ROACE – rolling 12 months%
Group ROACE – rolling 12 months%
Production growth 1H19 vs. 1H18%
* Peers: BP, Chevron, ExxonMobil, Shell – based on public data
21

Oil & Gas: building on our strengths for
sustainable and profitable integrated growth

Line 1
2019 Strategy and Outlook
Base for all bar charts
axis labels base
Line 1 Text under charts
Line 2 Text under charts
Line 2
Oil & Gas: Building on our strengthsLeveraging expertise in 7 core areas in an integrated strategy
23
Deepwater1 LNG2 Retail & Lubricants4Petrochemicals3
Africa
Market leader5
Middle East & North Africa
Partner of choice6
North Sea
#2 operator7
Line 1
2019 Strategy and Outlook
Base for all bar charts
axis labels base
Line 1 Text under charts
Line 2 Text under charts
Line 2
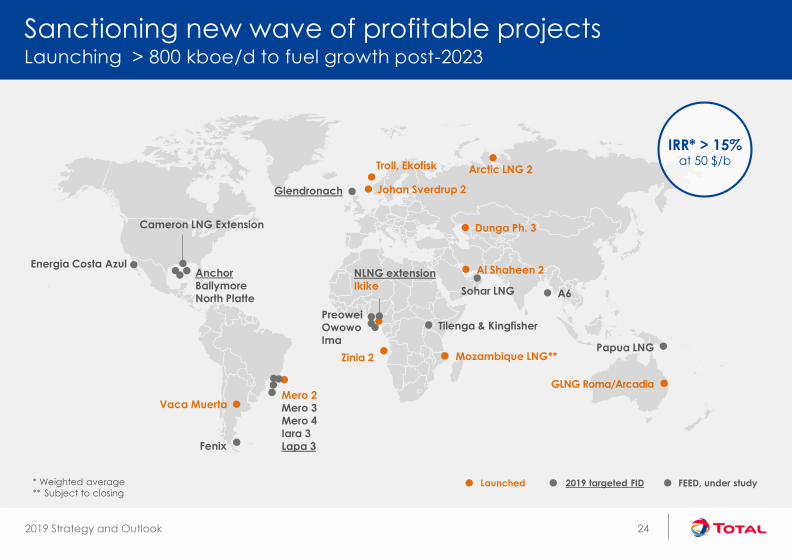
Sanctioning new wave of profitable projectsLaunching > 800 kboe/d to fuel growth post-2023
24
Fenix
Mero 2Mero 3Mero 4Iara 3Lapa 3
Zinia 2
Tilenga & Kingfisher
Johan Sverdrup 2
Al Shaheen 2
Arctic LNG 2
Papua LNG
AnchorBallymoreNorth Platte
GLNG Roma/Arcadia
NLNG extensionIkike
Cameron LNG Extension
Vaca Muerta
Glendronach
A6
Troll, Ekofisk
Energia Costa Azul
PreoweiOwowoIma
FEED, under studyLaunched 2019 targeted FID
Mozambique LNG**
Dunga Ph. 3
Sohar LNG
IRR* > 15%at 50 $/b
* Weighted average
** Subject to closing

Line 1
2019 Strategy and Outlook
Base for all bar charts
axis labels base
Line 1 Text under charts
Line 2 Text under charts
Line 2
2
4
>1 Bboe resources
40% sanctioned by end-2019
Short cycle projects with flexible Capex
Tie-backs to existing units in AngolaShort cycle projects delivering cashB$ - 60 $/b
Capex
2019-21
CFFO
2019-23
Block 14
Block 0
Angola
IRR > 20%at 50 $/b
> 30 $/boe
CFFO at 50 $/b
Angola
Dalia infills > 10 wells
Zinia 29 wells
CLOV Ph27 wells
Block 17Girassol infills8 wells
Unit costs cut by half since 2014
FPSO
Infills> 10 wells
Infills> 10 wells
25
150 kboe/dWI ~30%

Line 1
2019 Strategy and Outlook
Base for all bar charts
axis labels base
Line 1 Text under charts
Line 2 Text under charts
Line 2
50%
100%
Leveraging favorable supply chain to launch projects
Upstream Capital Cost Index Base 100 in 2014 – IHS Markit – 2Q19
International E&P costs stabilized at low level
• US E&P focus on shale reducing
international competition
• Significant spare capacity within the
supply chain
• Chinese contractors offering competitive
alternative for LNG and offshore projects2014 1H192015 2016 2017 2018
26
Deep offshore
Offshore
-30%vs. 2014
Simplifying designs

Line 1
2019 Strategy and Outlook
Base for all bar charts
axis labels base
Line 1 Text under charts
Line 2 Text under charts
Line 2
Exploration: seizing high quality acreage delivering results
GOM
Guyana
Santos basin
North Sea
Yamal Gydan
East Mediterranean
Myanmar
West Africa
Oman UAE
Ballymore
GlendronachGlengorm
North-ObskoyeSalmanov JurassicNyakhartinskoye
JethroJoe
Brulpadda
Shwe Yee Htun
Sururu
PNG
~1.2 B$per year
Key basins with acreage capture since 2015Key 2018-19 discoveries Key upcoming wells
San Roque/ Aguada Pichana
27
~25 wells per year

Line 1
2019 Strategy and Outlook
Base for all bar charts
axis labels base
Line 1 Text under charts
Line 2 Text under charts
Line 2
Successful first wells
• Jethro: oil bearing high quality sandstone
reservoirs, 55 m net oil pay
• Joe: play opener in Pliocene
Multiple wells and prospects already identified:
• Carapa well in 2019
• Follow up Tertiary prospects in Orinduik
and Kanuku derisked by Jethro and Joe
• One firm well on Canje block in 2020
Promising start in Guyana basin exploration
Guyana
KANUKU(25%*)
ORINDUIK(25%*)
CANJE(35%)
Other discoveries
Joe
Carapa
Jethro
Prospects
Total discoveries
28
*QP minority shareholder subject to closing
Explo wells
Line 1
2019 Strategy and Outlook
Base for all bar charts
axis labels base
Line 1 Text under charts
Line 2 Text under charts
Line 2
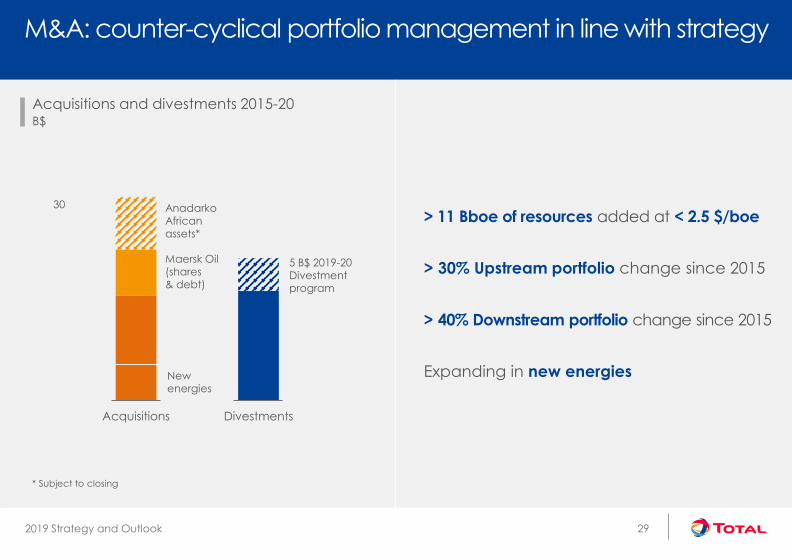
M&A: counter-cyclical portfolio management in line with strategy
> 11 Bboe of resources added at < 2.5 $/boe
> 30% Upstream portfolio change since 2015
> 40% Downstream portfolio change since 2015
Expanding in new energies
30
Acquisitions Divestments
Acquisitions and divestments 2015-20B$
Maersk Oil(shares& debt)
AnadarkoAfrican
assets*
5 B$ 2019-20 Divestmentprogram
29
New energies
* Subject to closing
Line 1
2019 Strategy and Outlook
Base for all bar charts
axis labels base
Line 1 Text under charts
Line 2 Text under charts
Line 2
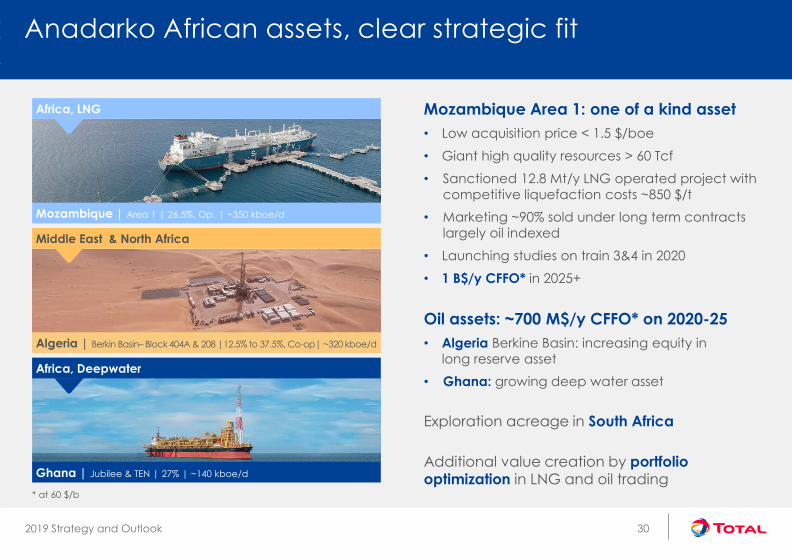
Anadarko African assets, clear strategic fit
Mozambique Area 1: one of a kind asset
• Low acquisition price < 1.5 $/boe
• Giant high quality resources > 60 Tcf
• Sanctioned 12.8 Mt/y LNG operated project with
competitive liquefaction costs ~850 $/t
• Marketing ~90% sold under long term contracts
largely oil indexed
• Launching studies on train 3&4 in 2020
• 1 B$/y CFFO* in 2025+
Oil assets: ~700 M$/y CFFO* on 2020-25
• Algeria Berkine Basin: increasing equity in
long reserve asset
• Ghana: growing deep water asset
Exploration acreage in South Africa
Additional value creation by portfolio optimization in LNG and oil trading
Africa, Deepwater
Ghana | Jubilee & TEN | 27% | ~140 kboe/d
Africa, LNG
Mozambique | Area 1 | 26.5%, Op. | ~350 kboe/d
Middle East & North Africa
Algeria | Berkin Basin– Block 404A & 208 |12.5% to 37.5%, Co-op| ~320 kboe/d
30
* at 60 $/b

Line 1
2019 Strategy and Outlook
Base for all bar charts
axis labels base
Line 1 Text under charts
Line 2 Text under charts
Line 2
Refining & Chemicals: a focused strategyConsistently delivering > 20% ROACE
Priority to integrated platforms Growing Petrochemicals
Biofuels: La Mede start-up
Bioplastics: #2 in PLA (Thailand)
30% recycled polymers by 2030
Founding member of Alliance
to End Plastic Waste
Investing in low carbon solutions
CFFO growing by ~1.5 B$ over 2019-25
> 70% capital employed
in 2025
Improving energy efficiency by
1% per year
Building on low cost feedstocks
Leveraging growth in
emerging markets
Integrating monomer and
polymer capacities
31

Line 1
2019 Strategy and Outlook
Base for all bar charts
axis labels base
Line 1 Text under charts
Line 2 Text under charts
Line 2
Port ArthurSatorp Daesan
Normandy
Antwerp
Qatar
Expanding high return Petrochemicals
0.4 Mt/y propane cracker capacity
0.4 Mt/y PE - 0.4 Mt/y PP capacities
1.3 B$ Capex, > 15% IRR
Start up 2019-21
Evaluating new gas cracker
South Korea: JV Hanwha-Total
(50%-50%)
New 1 Mt/y ethane cracker
New 0.6 Mt/y PE capacity
3 B$ Capex, > 15% IRR
Start up 2021
cracker > 70% completed
US: JV Total-Borealis Nova
(50%-50%)
New 1.5 Mt/y mixed feed cracker
New 1 Mt/y PE capacity
~5.5 B$ Capex, > 15% IRR
FEED ongoing, target FID 2021
Saudi Arabia: JV Saudi Aramco-Total
(62.5%- 37.5%)
New 0.6 Mt/y PDH/PP capacity
Integration on Arzew platform
~1.4 B$ Capex, > 15% IRR
FEED ongoing, target FID 2021
Algeria: JV Sonatrach-Total
(51%-49%)
Building on world class
integrated platform
Investing in low cost feedstock
> 60% by 2025
Integrating monomer and
polymer capacities
32

Line 1
2019 Strategy and Outlook
Base for all bar charts
axis labels base
Line 1 Text under charts
Line 2 Text under charts
Line 2
M&S: growing selectively and delivering non-cyclical cash flow
Expanding in large fast growing markets
Developing non-fuel revenues
EV charging: 150,000 charge
points operated
Natural gas for trucks: 500 sales
points in Europe, 500 in US
LNG for bunkering
Early supporter of hydrogen
in Germany and France
Growing in low carbon fuels
Delivering +100 M$/y CFFO growth over 2019-25
> 4,000 stations targeted in new
markets (China, India, Brazil,
Mexico, Saudi Arabia, Angola)
Increasing Shop Food &
Services revenues in Europe
> 40% retail CFFO
Leveraging leadership in Africa:
> 18% market share
33

Line 1
2019 Strategy and Outlook
Base for all bar charts
axis labels base
Line 1 Text under charts
Line 2 Text under charts
Line 2
* Dealer Owned Dealer Operated
M&S: expanding in large fast growing marketsBuilding on worldwide network of > 20,000 service stations by 2025
34
Targeting > 4,000 stations in new markets
Building network growth on partnerships (DODO*) and brand agreement: ~70% of new retail stations
Light Capex model: investing ~1 B$ per year in retail
1,000 stations
China
1,000 stations
India
500 stations
Saudi Arabia
500 stations
Mexico
1,000 stations
Brazil
New territories Existing retail

Investing in growing energy markets
for sustainable long term

Line 1
2019 Strategy and Outlook
Base for all bar charts
axis labels base
Line 1 Text under charts
Line 2 Text under charts
Line 2
300
2017 2040 2040 2040
Integrating climate into strategyTaking into account anticipated market trends
Global energy demandMboe/d
Renewables
Nuclear
Coal
Oil
Natural gas
36
Momentum* Rupture* IEA < 2°C
Focusing on
oil projects
with low
breakeven
Expanding
along the
gas value
chain
Developing
profitable &
sizeable
low carbon
electricity
Investing in
carbon
neutrality businesses
* Scenarios Total Energy Outlook (Feb. 2019)
** IEA 2018 Sustainable Development Scenario (SDS)

Line 1
2019 Strategy and Outlook
Base for all bar charts
axis labels base
Line 1 Text under charts
Line 2 Text under charts
Line 2
iGRP: investing in growing marketsBuilding strong positions along the integrated gas and electricity chains
Selectively investing in wind and solar electricity
generation
CFFO growing by 3.5 B$ over 2019-25 mainly from LNG
Investing 1.5-2 B$/y in low carbon electricity
Expanding global LNG portfolio
50 Mt/y by 2025
Integrating along the electricity value chain from
supply to end customer
37
Global LNG Electricity in Europe Renewables worldwide

Line 1
2019 Strategy and Outlook
Base for all bar charts
axis labels base
Line 1 Text under charts
Line 2 Text under charts
Line 2
25
50
2018 2020 2025
3
6
2018 2020 2025
Growing LNG position to fully capture economies of scale
Integrated gas CFFOB$ - 60 $/b
LNG salesMt/y
38
2.5 x
Spot
Supply from 3rd party
Supply from equity JVs
Equity JV sales to 3rd party

Line 1
2019 Strategy and Outlook
Base for all bar charts
axis labels base
Line 1 Text under charts
Line 2 Text under charts
Line 2
0.5
1.0
2018 2019-25
5
10
Russia LNG: Long term partnership delivering growing cash flow
Russia delivering growing CFFOB$/y at 60 $/b
NovatekB$
Dividend receivedsince 2011
Value of shareson 13/09/2019
Yamal LNG
Shares
acquisition
since 2011
Value as of
today
Novatek dividends
World-class LNG production and development hub, ~9 Mt/y by 2025
Successfully starting Yamal LNG, launching Arctic LNG 2
39
Line 1
2019 Strategy and Outlook
Base for all bar charts
axis labels base
Line 1 Text under charts
Line 2 Text under charts
Line 2
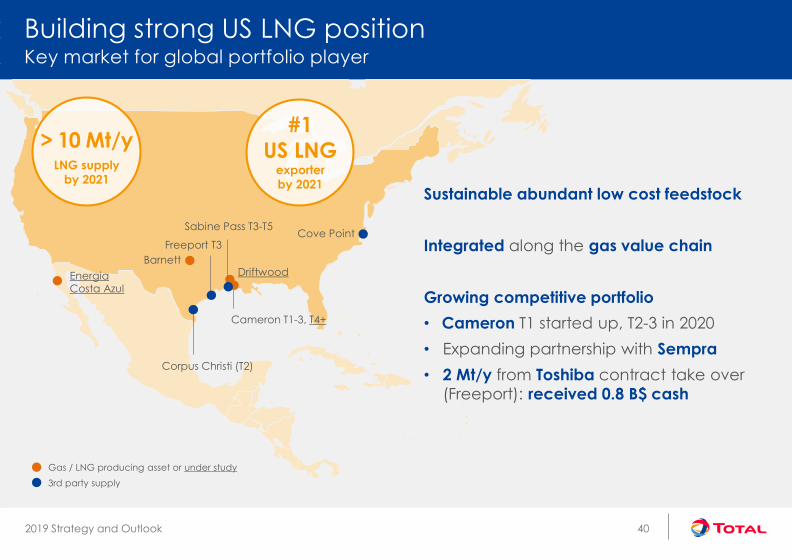
Building strong US LNG positionKey market for global portfolio player
Driftwood
Cameron T1-3, T4+
Cove PointSabine Pass T3-T5
Freeport T3
Corpus Christi (T2)
Barnett
> 10 Mt/yLNG supply
by 2021
#1
US LNG exporter
by 2021
Gas / LNG producing asset or under study
3rd party supply
EnergiaCosta Azul
40
Sustainable abundant low cost feedstock
Integrated along the gas value chain
Growing competitive portfolio
• Cameron T1 started up, T2-3 in 2020
• Expanding partnership with Sempra
• 2 Mt/y from Toshiba contract take over
(Freeport): received 0.8 B$ cash

Line 1
2019 Strategy and Outlook
Base for all bar charts
axis labels base
Line 1 Text under charts
Line 2 Text under charts
Line 2
10 Mt/y out of 20 Mt/y
Regasification capacities
Europe: developing a customer portfolio to pull LNG value chain
CCGT (~3 GW)
~2 Mt consumed
Marketing (3 M gas customers)
~8 Mt sold
10 Mt/y out of 50 Mt/y
LNG Portfolio
Supply
2025 Customers
41
Midstream

Line 1
2019 Strategy and Outlook
Base for all bar charts
axis labels base
Line 1 Text under charts
Line 2 Text under charts
Line 2
Generation Trading Customers
Renewables
~7* GW by 2025
Gas (CCGT)
~3 GW
Trading
~175 TWh in 2018
Mobility services
No utility model:
not investing in power
infrastructure
+ Aggregation
platform
> 15x more volume
traded than produced
Development of
energy storage
(Saft batteries, H2)
#1 customer
satisfaction in 2018
Infrastructure
150,000
charge points by 2025
42
Developing integrated strategy along the Power chain in Europe
Marketing B2B/B2C
~8 M power customers
by 2025
* 100% view

Line 1
2019 Strategy and Outlook
Base for all bar charts
axis labels base
Line 1 Text under charts
Line 2 Text under charts
Line 2
10
20
Capital light model
Selectively investing in worldwide renewables marketTargeting free cash flow positive by 2025
Renewables business modelRenewables capacity installedGW*
AsiaAmericas Africa, ME
Europe
> 25 GW
2019 2025
43
0%
10%
0%
10%
TOTAL Equity
IRR
Development
Farm Down
(~50%)
Leverage
(70/30)
O&M
1
2
3
4
5-7%
Typical
project IRR**
> 15%
Gross* investment ~4 B$/y
* 100% view ** Source: Wood Mackenzie

Line 1
2019 Strategy and Outlook
Base for all bar charts
axis labels base
Line 1 Text under charts
Line 2 Text under charts
Line 2
• GreenFlex: 400 people, 2018 turnover ~500 M$
Investing in carbon neutrality businessesAnticipating on carbon pricing
• Dedicated business unit in place
• Investing 100 M$/y from 2020 in sustainable and regenerative forestry & agri-operations
• 5 Mt CO2/y of sustainable annual carbon sink capacity by 2030
• Communities-inclusive approach
• 10% of R&D program
• Successful pilot in Lacq
• Projects in Norway (Northern Lights) and UK (Clean Gas Project, Acorn)
• CO2 injection plan in Papua LNG project
Energy efficiency Nature based solutions CCUS
44
Total Carbon NeutralityVenture: 400 M$ fund by 2023
Venture Capital

Line 1
2019 Strategy and Outlook
Base for all bar charts
axis labels base
Line 1 Text under charts
Line 2 Text under charts
Line 2
2030 2040
Our ambition: reducing the carbon intensity of energyproducts used by our customers
Carbon intensity of the energy products sold to our customersBase 100 in 2015 (75 gCO2e/kbtu)
Possible sales mix in 2040
depending on consumer behavior
• Natural gas: 45-55%
• Oil (incl. biofuels): 30-40%
• Low carbon electricity: 15-20%
50
100
2015 2018
Ambition
-15%2015-30
Realized
95
85
45
75
60

Outlook 2025 & Shareholder return

Line 1
2019 Strategy and Outlook
Base for all bar charts
axis labels base
Line 1 Text under charts
Line 2 Text under charts
Line 2
2.8
3.5
Sustainably growing profitable production
ProductionMboe/d
Numerousproject start-ups
202520212019 2023
Production stabilization
Project start-ups
> 3%/y> 5%/y
47
Leveraging portfolio of high-value projects
LNG projects driving profitable growth
Low 3%/y decline thanks to ~50% of long
plateau with no decline (LNG, Middle East…)
Line 1
2019 Strategy and Outlook
Base for all bar charts
axis labels base
Line 1 Text under charts
Line 2 Text under charts
Line 2
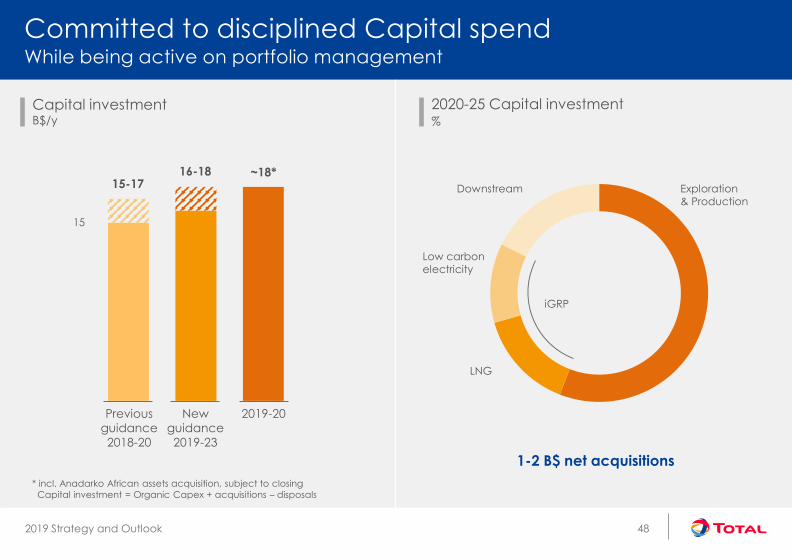
15
1-2 B$ net acquisitions
Committed to disciplined Capital spendWhile being active on portfolio management
2020-25 Capital investment%
Capital investmentB$/y
2019-20
~18*16-18
48
Previous
guidance
2018-20
Exploration & Production
LNG
Low carbon
electricity
Downstream
New
guidance
2019-23
15-17
iGRP
* incl. Anadarko African assets acquisition, subject to closing
Capital investment = Organic Capex + acquisitions – disposals

Line 1
2019 Strategy and Outlook
Base for all bar charts
axis labels base
Line 1 Text under charts
Line 2 Text under charts
Line 2
15
35
2018 2019 2020 2023 2025
Strong cash flow growth
Debt adjusted cash flow (DACF)B$
iGRP and Downstream driving growth
• iGRP: ~+3.5 B$ in 2025 vs 2019 mainlydriven by LNG
• Downstream: +2 B$ in 2025 vs 2019
Targeting 12% ROE at Brent 60 $/b
49
71$/b
62$/b
60 $/b*
26.1
+1 B$/y
60$/b*
60 $/b*
Sensitivity 2019-20:
+/- 3.2 B$ CFFO for +/-10 $/b Brent - NBP 5.5 $/Mbtu - HH 2.5 $/Mbtu
Line 1
2019 Strategy and Outlook
Base for all bar charts
axis labels base
Line 1 Text under charts
Line 2 Text under charts
Line 2
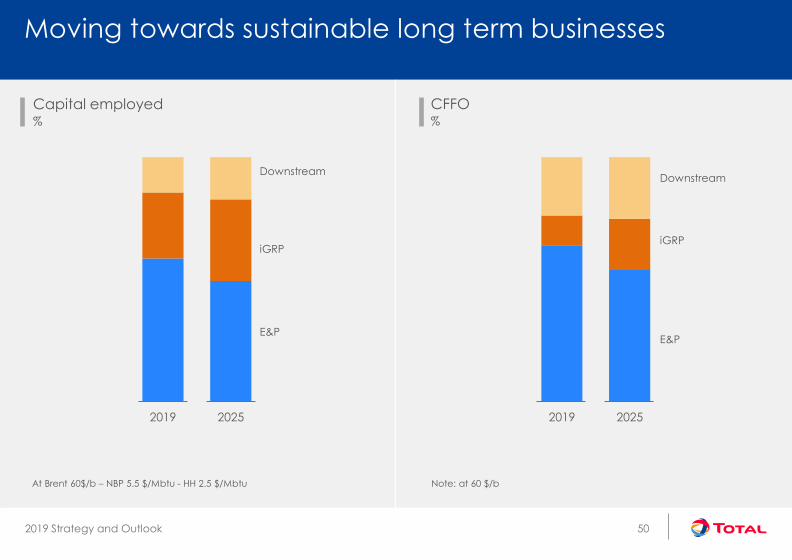
2019 2025 2019 2025
Moving towards sustainable long term businesses
Capital employed%
CFFO%
E&P
iGRP
Downstream
E&P
iGRP
Downstream
50
At Brent 60$/b – NBP 5.5 $/Mbtu - HH 2.5 $/Mbtu Note: at 60 $/b

Line 1
2019 Strategy and Outlook
Base for all bar charts
axis labels base
Line 1 Text under charts
Line 2 Text under charts
Line 2
Confirming priorities for cash flow allocation
Discipline
Capital investment
1
Dividend
2
Maintain gearing < 20%
grade A credit rating
Balance sheet
3
Sharebuyback
4
51
New guidance5 B$ over 2018-20Sharing extra cash
> 60 $/b

Line 1
2019 Strategy and Outlook
Base for all bar charts
axis labels base
Line 1 Text under charts
Line 2 Text under charts
Line 2
Sustainable dividend growth
50
100
150
1.5
3.0
Dividend vs. Brent€/share
Dividend per share
1982
52
Brent ($/b)
2018
CAGR
2000-18
+6%/y+8%/y in $
Board Guidance:
dividend growth of 5 - 6 % per year
Increasing dividend
Clear visibility on 2019-25 strong cash flow growth
+1 B$ per year at 60 $/b
Next 2019 interim dividend (3Q):
0.68 €/share vs. 0.64 €/share (3Q18)
+6% vs. +3% as announced previously
Immediate effect

Line 1
2019 Strategy and Outlook
Base for all bar charts
axis labels base
Line 1 Text under charts
Line 2 Text under charts
Line 2
Sustainable ESG commitment
Sustainable relationship with local stakeholdersTotal’s commitment to ESG recognized by rating agencies
In Nigeria, on Egina
FPSO project,
77% of hours worked
by local people
In Angola, 2 new high schools to be built
(4 existing - 570 students)
In PNG, recruiting
Community Liaison Officers from
local villages
Startupper Challenge: supporting entrepreneurs
in 55 countries (+13,000 projects)
53
• A grade
• B- grade
• Only Major with Prime Status
• A- grade
• Best score for an O&G MajorClimate Change
and Water Security
• 57th
• Only Major ranked in 2019

Line 1
2019 Strategy and Outlook
Base for all bar charts
axis labels base
Line 1 Text under charts
Line 2 Text under charts
Line 2
Total, sustainable and profitable growth
Priority to growing markets: LNG and low
carbon power
Focusing on organic breakeven < 30 $/b
and balance sheet strength (gearing < 20%)
Maintaining discipline on spend
• 16-18 B$/y Capex over 2019-23
• 5 $/boe Opex, extending cost saving program
Strong visibility on cash flow growth until 2025,
+1 B$ per year over 2019-25
Increasing shareholder return
• Board guidance: dividend growth of 5 - 6 %/y
• Immediate effect : +6 % on Q3 interim dividend
54

Appendix
Line 1
2019 Strategy and Outlook
Base for all bar charts
axis labels base
Line 1 Text under charts
Line 2 Text under charts
Line 2
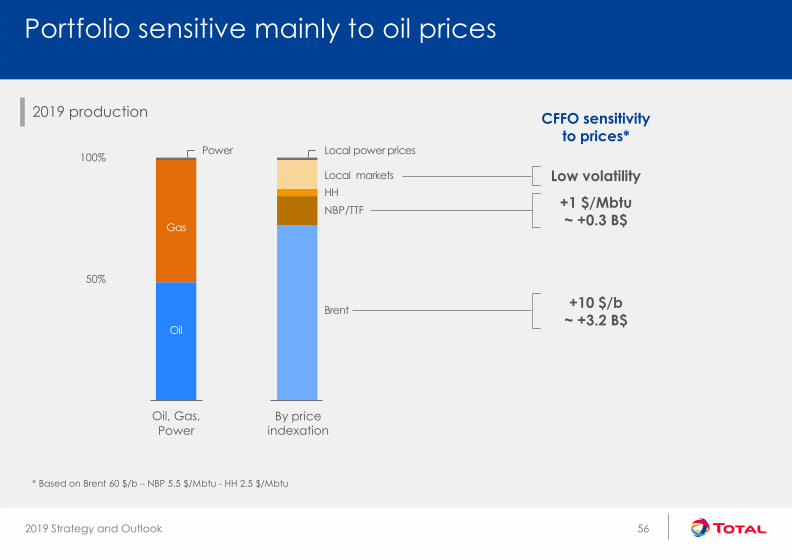
50%
100%
Oil, Gas,
Power
By price indexation
Portfolio sensitive mainly to oil prices
2019 production
Brent
NBP/TTF
HH
Local markets
CFFO sensitivityto prices*
Local power prices
Oil
Gas
Power
+1 $/Mbtu~ +0.3 B$
+10 $/b ~ +3.2 B$
Low volatility
By price
indexation
56
* Based on Brent 60 $/b – NBP 5.5 $/Mbtu - HH 2.5 $/Mbtu

Line 1
2019 Strategy and Outlook
Base for all bar charts
axis labels base
Line 1 Text under charts
Line 2 Text under charts
Line 2
-3.5
-3
-2.5
-2
-1.5
-1
-0.5
0
0.5
1
1.5
2
2.5
3
3.5
4
4.5
5
5.5
1Q19 2Q19 3Q19 4Q19
Benefiting from
900 kb/d low sulfur production
IMO starting to impact crude differentials
IMO 2020: positive impact on crude differentials
Differentials vs. Brent$/b
Crude oilLow sulfur crude value increasing
Total:60%
low sulfur
World: ~42%
low sulfur
Low sulfurNigerian
Low sulfurAngolan
High sulfurUral
57

Line 1
2019 Strategy and Outlook
Base for all bar charts
axis labels base
Line 1 Text under charts
Line 2 Text under charts
Line 2
7
2017 2020
Low fuel oil yield (< 5%) High distillate output (50%)
Refining ready for IMO 2020
Distillate yield%
High Sulfur Fuel Oil productionMt/y
2
IMO: International Maritime Organization
Antwerp modernization
Port Arthur coker
Logistic segregation
LS/HS crude
flexibility
Total:50%
Worldwide: ~40%
58

Line 1
2019 Strategy and Outlook
Base for all bar charts
axis labels base
Line 1 Text under charts
Line 2 Text under charts
Line 2
Priority to low breakeven projects
Breakeven - Integrated LNG projects $/Mbtu – DES Asia – pre-FID and under construction
5
10
15
59
Source: WoodMackenzie LNG tool, 2019 Q2, Breakeven @10% IRR

Line 1
2019 Strategy and Outlook
Base for all bar charts
axis labels base
Line 1 Text under charts
Line 2 Text under charts
Line 2
Integrated and diversified along the value chain
ECA LNG
Freeport LNG Sabine Pass LNGCameron LNG
Cove Point LNG
Driftwood LNG
Snøhvit LNGYamal LNG
Artic LNG 2
BethiouaSkikda LNGEgyptian LNG T1
Nigeria LNG
Angola LNGMozambique LNG Ichthys LNG
Sohar LNG
Adnoc LNG
Qatargas
Singapore
Papua LNG
Gladstone LNG
Regasification Terminalsin operation or planned
Long-term sales
Equity production
Long-term supply
Bunkering Hub
Rotterdam
Equity production
30 Mt/y in 2025
Trading and shipping
Portfolio of 50 Mt/y in 2025 > 20 ships incl. 2 FSRU
Regasification and supply of gas
Capacity of 20 Mt/y≈ 1.5 million customers in Europe
Development of new markets
FSRUs in emerging market placesLNG bunkering
60
Yemen LNG
Oman
Qalhat LNG & Oman LNG

This document may contain forward-looking information on the Group (including objectives and trends), as well as forward-looking statements within the meaning of the Private Securities Litigation Reform Act of 1995, notably with respect to the financial condition, results of operations, business, strategy and plans of TOTAL. These data do not represent forecasts within the meaning of European Regulation No. 809/2004.
Such forward-looking information and statements included in this document are based on a number of economic data and assumptions made in a given economic, competitive and regulatory environment. They may prove to be inaccurate in the future, and are subject to a number of risk factors that could lead to a significant difference between actual results and those anticipated, including the price of petroleum products, the ability to realize cost reductions and operating efficiencies without unduly disrupting business operations, changes in regulations including environmental and climate, currency fluctuations, as well as economic and political developments and changes in business conditions. Certain financial information is based on estimates particularly in the assessment of the recoverable value of assets and potential impairments of assets relating thereto.
Neither TOTAL nor any of its subsidiaries assumes any obligation to update publicly any forward-looking information or statement, objectives or trends contained in this document whether as a result of new information, future events or otherwise. Further information on factors, risks and uncertainties that could affect the Group’s business, financial condition, including its operating income and cash flow, reputation or outlook is provided in the most recent Registration Document filed by the Company with the French Autorité des Marchés Financiers and annual report on Form 20-F filed with the United States Securities and Exchange Commission (“SEC”).
Financial information by business segment is reported in accordance with the internal reporting system and shows internal segment information that is used to manage and measure the performance of TOTAL. In addition to IFRS measures, certain alternative performance indicators are presented, such as performance indicators excluding the adjustment items described below (adjusted operating income, adjusted net operating income, adjusted net income), return on equity (ROE), return on average capital employed (ROACE) and gearing ratio. These indicators are meant to facilitate the analysis of the financial performance of TOTAL and the comparison of income between periods. They allow investors to track the measures used internally to manage and measure the performance of the Group. These adjustment items include:
(i) Special itemsDue to their unusual nature or particular significance, certain transactions qualified as "special items" are excluded from the business segment figures. In general, special items relate to transactions that are significant, infrequent or unusual. However, in certain instances, transactions such as restructuring costs or asset disposals, which are not considered to be representative of the normal course of business, may be qualified as special items although they may have occurred within prior years or are likely to occur again within the coming years.
(ii) Inventory valuation effectThe adjusted results of the Refining & Chemicals and Marketing & Services segments are presented according to the replacement cost method. This method is used to assess the segments’ performance and facilitate the comparability of the segments’ performance with those of its competitors.
In the replacement cost method, which approximates the LIFO (Last-In, First-Out) method, the variation of inventory values in the statement of income is, depending on the nature of the inventory, determined using either the month-end price differentials between one period and another or the average prices of the period rather than the historical value. The inventory valuation effect is the difference between the results according to the FIFO (First-In, First-Out) and the replacement cost.
(iii) Effect of changes in fair value The effect of changes in fair value presented as an adjustment item reflects for some transactions differences between internal measures of performance used by TOTAL’s management and the accounting for these transactions under IFRS.
IFRS requires that trading inventories be recorded at their fair value using period-end spot prices. In order to best reflect the management of economic exposure through derivative transactions, internal indicators used to measure performance include valuations of trading inventories based on forward prices.
Furthermore, TOTAL, in its trading activities, enters into storage contracts, which future effects are recorded at fair value in Group’s internal economic performance. IFRS precludes recognition of this fair value effect.
The adjusted results (adjusted operating income, adjusted net operating income, adjusted net income) are defined as replacement cost results, adjusted for special items, excluding the effect of changes in fair value.
Euro amounts presented herein represent dollar amounts converted at the average euro-dollar (€-$) exchange rate for the applicable period and are not the result of financial statements prepared in euros.
This document also contains extra-financial performance indicators, including a carbon intensity indicator for energy products used by Total customers, that measures the average greenhouse gas emissions of those products, from their production to their end use, per unit of energy. This indicator covers the direct GHG emissions of production and processing facilities (scope 1) and their indirect emissions associated with energy purchase (Scope 2), as well as the emissions associated with the use of products by the customers of the Group (Scope 3) which Total does not control (for the definitions of scopes 1, 2 and 3, refer to Total’s Registration Document).
Cautionary Note to U.S. Investors – The SEC permits oil and gas companies, in their filings with the SEC, to separately disclose proved, probable and possible reserves that a company has determined in accordance with SEC rules. We may use certain terms in this presentation, such as resources, that the SEC’s guidelines strictly prohibit us from including in filings with the SEC. U.S. investors are urged to consider closely the disclosure in our Form 20-F, File N° 1-10888, available from us at 2, Place Jean Millier – Arche Nord Coupole/Regnault –92078 Paris-La Défense Cedex, France, or at our website: total.com. You can also obtain this form from the SEC by calling 1-800-SEC-0330 or on the SEC’s website: sec.gov.
Disclaimer
Top Related