


Languages
Pages
Legal


Strategies to Impact Complex Health Conditions
Shaping the Future of Mental HealthTM
Genesee County
Community Mental Health Tisha Deeghan, MHSA, LMSW, ACSW, LMFT
Behavioral Health/Primary Care Conference East Lansing, MI
16 November 2011 2 June 2011

Learning Objectives
1. Identify disease burden and risk factors for complex health conditions and premature mortality for people with serious mental illness.
2. List several strategies incorporating primary care and health status monitoring that could positively impact premature mortality.
3. Describe Genesee County’s InSHAPE® program, its inclusion in a behavioral/primary health home, and its replicability in other settings.
4. Discuss preliminary outcomes and results in Genesee County and expansion plans for FY 12.
2

People with serious mental illness (SMI) die an average of 25-30 years earlier than individuals in the general population
Oregon found average years per life lost for people with co-occurring MH & SUD to be between 32.8 & 37.4 (OR Dept. of Human Service, 2008).
People with SMI are at risk of weight gain, obesity and associated adverse outcomes due to sedentary lifestyles, poor diet, metabolic alterations related to psychiatric medications, and tobacco use
People with SMI have nearly twice the normal risk of dying from cardiovascular disease (CVD)
3
Reason for Action

Social Determinants: Poverty Genesee County median household income in 2007 was $43,112, less than the state median ($47,950), which is less than US ($50,740); City of Flint was nearly $22,000 less than the county. This doesn’t reflect the depression in 2008-2010
The 2009 per capita income was $14,996 for the Flint and $22,258 for Genesee County. Both have lower per capita incomes than the state average per person, $23,728 Source: 2009 American Community Survey.
Over 40% of children in Genesee receive free/reduced price lunch
At any given time, more than 25% of county residents are Medicaid-eligible
2009 pop below FPL: 36.2% (Flint), 19.3% (County) Source: 2009 American Community Survey.
Unemployment (2010 BLS): Flint jobless rate was 23.2%; for the county, it was 13.7%
Abandoned property: 1/3 of properties in Flint are vacant
4

Preventable chronic diseases account for 3/4 of health spending in the US (CDC)
CVD Obesity STDs (gonorrhea & chlamydia) Tobacco use
Genesee ranks 82/82 counties in health behaviors (RWJ 2011)
The chronic disease burden in Genesee related to obesity, asthma, tobacco use, and diabetes is higher than the state
Individuals with SMI are dying primarily because of preventable medical conditions
5
Disease Burden

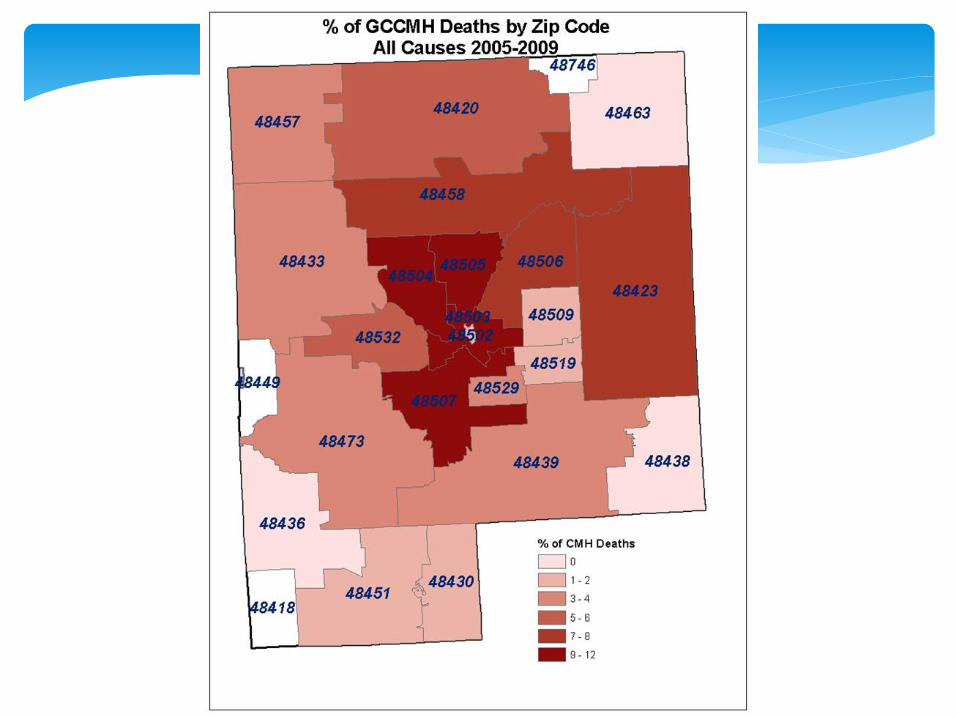
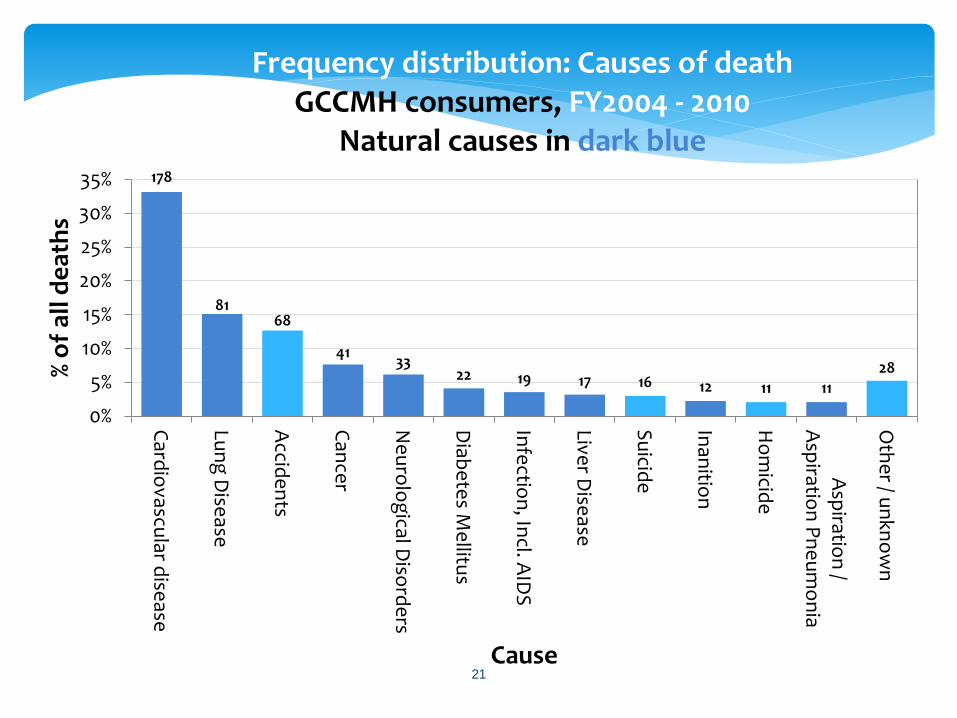
Between 10/1/04 - 9/30/11, 178 GCCMH consumers died of CVD.
This is 33% of all deaths, and is the most common cause every year.
6
Target Population
Profile

Flint
2007 GCCMH Genesee County
Total percent of Flint
residents 57% 24%
Percent of Flint
resident deaths 50% 40%


Cumulative distribution: Age at death
Among CMH consumers, over 70% die before age 55
Among Genesee County residents, 20% die before age 55
2009

% of deaths by age group, comparing county to CMH
14
0
5
10
15
20
25
30
35
40
45
< 1 1 to 4 5 to 14 15 to 24 25 to 34 35 to 44 45 to 54 55 to 64 65 to 74 75 to 84 85+
2009
County %
CMH %
County N=4020 CMH N=65 (exclusive)
Age at death

Cumulative distribution: Age at death by race County (Males), Cardiovascular disease
5 year average: 2005-2009
Among black males who die of cardiovascular disease, 60% die before age 70
Among white males who die of cardiovascular disease, 40% die before age 70

Cumulative distribution: Age at death by race County (Females), Cardiovascular disease
5 year average: 2005-2009
Among black females who die of cardiovascular disease, 50% die before age 70
Among white females who die of cardiovascular disease, 20% die before age 70

17
Age at death by gender (SMI only)
0%
5%
10%
15%
20%
25%
30%
35%
0-9 10-19 20-29 30-39 40-49 50-59 60-69 70-79 80-89 90-99 100-109
% o
f d
eat
hs
Age at death
Female (N=297)
Male (N=329)

18
Age at death by race: white / minorities (SMI only)
0%
5%
10%
15%
20%
25%
30%
35%
40%
0-9 10-19 20-29 30-39 40-49 50-59 60-69 70-79 80-89 90-99 100-109
% o
f d
eat
hs
Age at death
Minority (N=150)
White (N=476)

19
Age at death by gender x race (SMI only)
0%
5%
10%
15%
20%
25%
30%
35%
40%
45%
0-9 10-19 20-29 30-39 40-49 50-59 60-69 70-79 80-89 90-99 100-109
% o
f d
eat
hs
Age at death
White female (N=240)
White male (N=236)
Minority female (N=59)
Minority male (N=96)

20
Mean and 90% C.I. for age at death by gender and minority status for SMI consumers
40
45
50
55
60
65
70
All White Minority All White Minority All White Minority
Both Female Male
21
178
81 68
41 33
22 19 17 16 12 11 11
28
0
20
40
60
80
100
120
140
160
180
200
0%
5%
10%
15%
20%
25%
30%
35%
Card
iovascu
lar dise
ase
Lun
g D
isease
Accid
en
ts
Can
cer
Ne
uro
log
ical Diso
rde
rs
Diab
ete
s Me
llitus
Infe
ction
, Incl. A
IDS
Liver D
isease
Su
icide
Inan
ition
Ho
micid
e
Asp
iration
/A
spiratio
n P
ne
um
on
ia
Oth
er / u
nkn
ow
n%
of
all d
eat
hs
Cause
Frequency distribution: Causes of death GCCMH consumers, FY2004 - 2010
Natural causes in dark blue

22
Frequency distribution: Causes of death (in process) GCCMH consumers, FY 2011 Natural causes in dark blue
16
12
6 6 4
3 2 2 2
1 1 1 1
30
0.00%
5.00%
10.00%
15.00%
20.00%
25.00%
30.00%
35.00%
40.00%
N = 87

Cumulative distribution: Age at death Cardiovascular disease
5 year average: 2005-2009
Among CMH consumers who die of cardiovascular disease, 50% die before age 55
Among Genesee County residents who die of cardiovascular disease, 15% die before age 55

CMH Mean

0%
10%
20%
30%
40%
50%
60%
70%
80%
90%
100%
0 10 20 30 40 50 60 70 80 90 100 110
% o
f d
eat
hs
by
this
ag
e
Age at death
DD andSMI / DD(N=166)
SMI(N=306)
MI or DD +SUD(N=157)
DD/SMI + SUD: 47
Cumulative distribution: Age at death for consumers with DD only, MI only, and MI/DD + comorbid SUD Deaths FY2004 – FY2010, from CMH datasets
(with median age at death)
SMI no SUD: 59
DD no SUD: 56
DD: 88% + SUD: 100% by age 70 SMI: 75% die before 75 y.o.
In 2009, 48% of all individuals who died in Genesee County were
younger than 75 (MDCH Bur. Vital Stats)
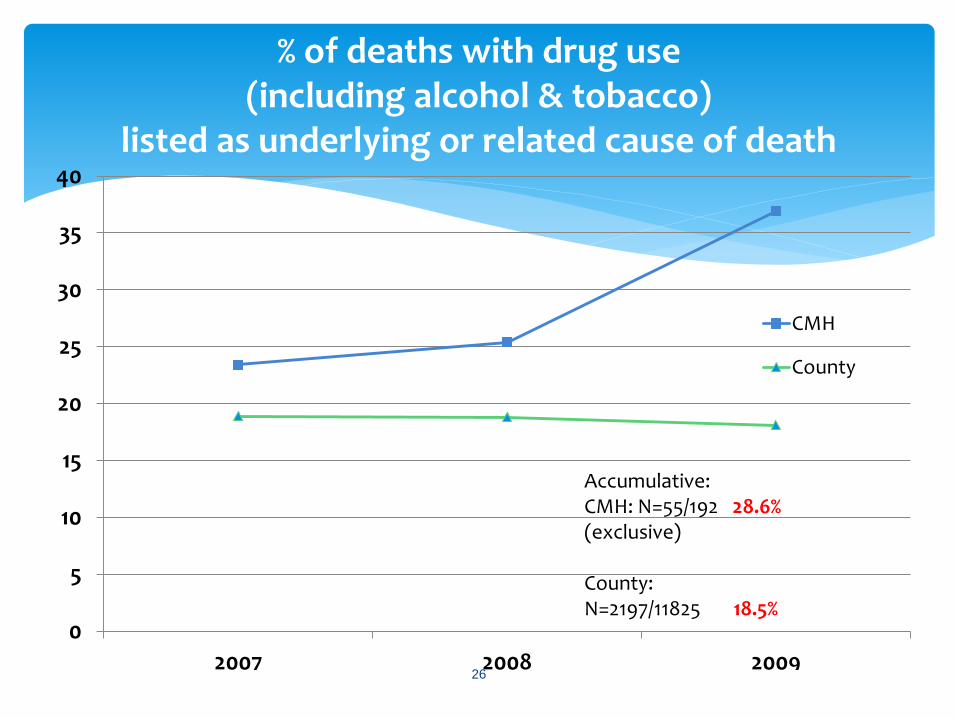
% of deaths with drug use (including alcohol & tobacco)
listed as underlying or related cause of death
26
0
5
10
15
20
25
30
35
40
2007 2008 2009
CMH
County
Accumulative: CMH: N=55/192 28.6% (exclusive) County: N=2197/11825 18.5%

Mean Ages at Death due to Opiate Use (2005-2009)
CMH (3 year average)
CMH
average mean

Mean Ages at Death due to Suicide (2005-2009)
CMH (3 year avg)
CMH average mean

Health Promotion Strategies

Five-year strategic plan (FY09-13) centers on promoting wellness and reducing morbidity and mortality InSHAPE® launched August 2009; at that time, the only wellness promotion program of its type in Michigan; Started with 1 staff, now 5 Collaboration with UM School of Public Health Wellness Stations throughout our facilities across the county to provide health/wellness resources and educational materials, e.g., DVDs, BP/BMI machines, etc. GCCMH Community Garden Project built in 2009 via extensive community partnerships
30
Health & Wellness Initiatives

The GCCMH Garden

Socializing/Team Work
Education Exercise
Objectives of the GCCMH
Garden Project

What happens to the produce?
o Divided among workgroups
o Given to consumers
and community members
o Sold at the Farmer’s Market
o Sold to a local Dollar Store
Owner

Primary care & lab services within our Medication Clinic (docs, nurses, peers)
Coordination and sharing with MHPs
Federally Qualified Health Center 330 Funding & Planning applications
Commit-2-Fit !
34
Focus on Physical Health Status
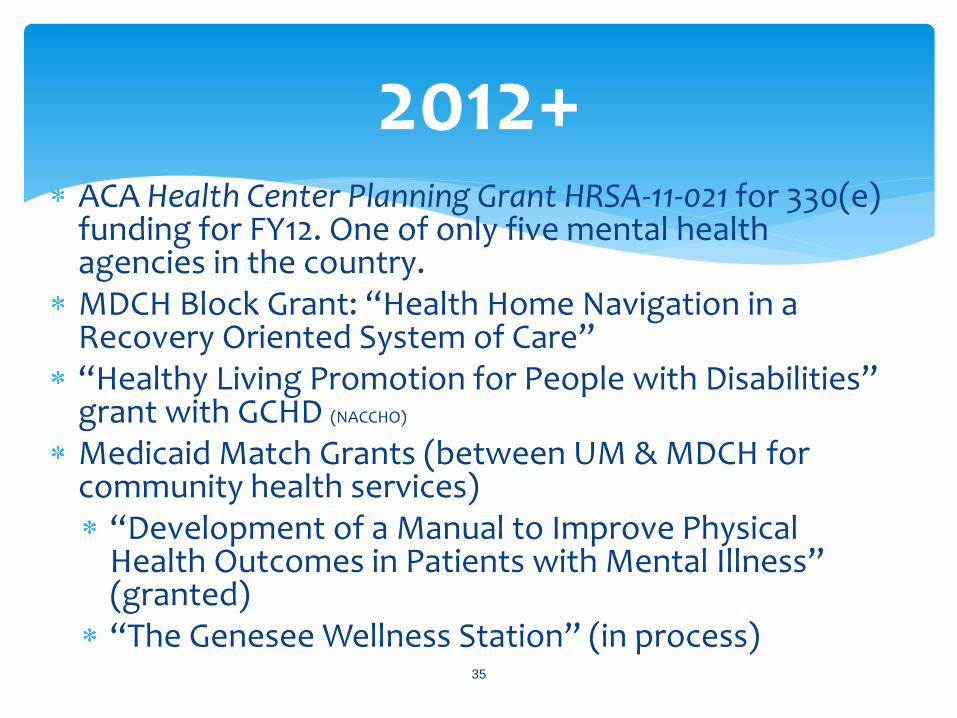
ACA Health Center Planning Grant HRSA-11-021 for 330(e) funding for FY12. One of only five mental health agencies in the country. MDCH Block Grant: “Health Home Navigation in a Recovery Oriented System of Care” “Healthy Living Promotion for People with Disabilities” grant with GCHD (NACCHO)
Medicaid Match Grants (between UM & MDCH for community health services)
“Development of a Manual to Improve Physical Health Outcomes in Patients with Mental Illness” (granted) “The Genesee Wellness Station” (in process)
35
2012+

GCCMH Health Home:
Recovery Navigator Pilot
BH care
Housing
Primary care/BH
home
Inpatient, SH, Detox discharge
Entitle- ments
Family supports
Peer support
HIV InSHAPE
37
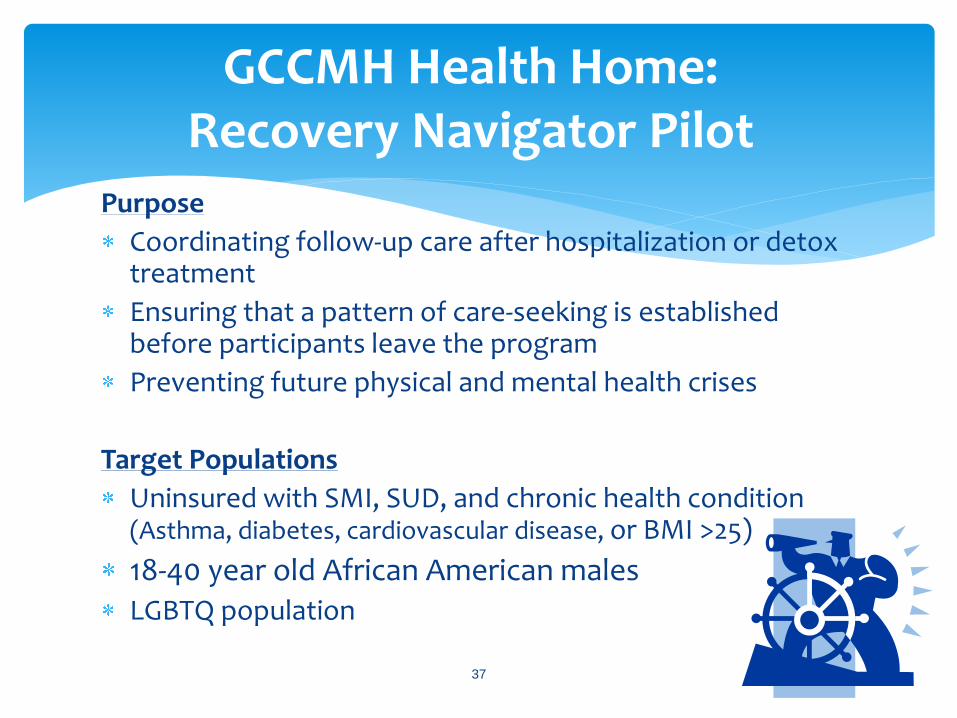
GCCMH Health Home:
Recovery Navigator Pilot Purpose
Coordinating follow-up care after hospitalization or detox treatment
Ensuring that a pattern of care-seeking is established before participants leave the program
Preventing future physical and mental health crises
Target Populations
Uninsured with SMI, SUD, and chronic health condition (Asthma, diabetes, cardiovascular disease, or BMI >25)
18-40 year old African American males LGBTQ population

InSHAPE®
Shaping the Future of Mental HealthTM
Goal: To lengthen life expectancy and improve the quality of life for persons with SMI through a one-year program of exercise, diet, and coaching by a Health Mentor (certified personal trainer) and peer support specialist. Associated Outcomes
Improved community’s health
Personal pathways of inclusion and recovery
Stigma reduction
Breaking down barriers
Enhanced Public Good
39

Activities for InSHAPE Participants
Splash Bash A water exercise
program designed to
tone the body,
strengthen the
muscles & condition
the heart and lungs.
Wellness Center
CMH Garden Project
Rainbow Connection
Walking Group Designed to improve
cardiovascular fitness,
while enhancing social
skills.

Timeline of InSHAPE Duration of program = 1 year
First Quarter: Develop Shape Plan Assessments Goal Setting Plan Meet Twice a week with Mentor Nutritional Guidance Homework Classes/Workshops Celebrations
Second Quarter:
Assessments Goal Setting Plan Meet once a week with Mentor Nutritional Guidance Homework Classes/Workshops Celebrations
Third Quarter: Assessments Goal Setting Plan Meet every other week with Mentor Nutritional Guidance Homework Classes/Workshops Celebrations
Fourth Quarter:
Assessments Goal Setting Plan Meet Once a Month with Mentor Nutritional Guidance Homework Classes/Workshops Celebrations Graduate Program

18 years or older
Have a serious mental illness: bipolar (most common), schizophrenia, major depression
Currently seeing a CMH Case Manager*
Identified one or more health risk (high blood pressure, high cholesterol, overweight/ obese, diabetes, CVD) and associated high risk health behavior(s)
Physician clearance to participate
Acceptance without regard to ability to pay a nominal fee
Willing to participate *GCCMH criterion not a part of the NH model
42
InSHAPE criteria for participation

• The Dartmouth Psychiatric Research Center conducted an 18-month pilot study of InSHAPE’s effects on the health of 98 participants served in original implementation site (NH).
• Findings:
• InSHAPE is effective in reducing disease risk factors, as well as improving the physical health and quality of life of persons with SMI.
• Participants had significantly increased their exercise level and reduced their average waist circumference (a marker for high risk).
• Participants also reported significant improvements in mental and emotional functioning and a decrease in the severity of symptoms of schizophrenia.
43
Pilot results – New Hampshire

According to RWJ, to ensure replication of the results and impact of the In SHAPE program, ideal participant organizations should have:
Strong entrepreneurial leadership
A demonstrated ability to develop strong community partnerships with a variety of organizations
A board that supports the need to go beyond the status quo in the field of mental health
44
Replication

Preliminary Results – Genesee County
45
To date served: 129 (as of 10/25/11)
44/53/3% African American/white/other
64/36% female/male (19 AA males)
Current status:
69 active within their one year program
13 inactive (usually illness &/or hospitalization)
39 withdrew before completion of one year program (often shortly after intake)
6 graduated
2 died (heart/crack cocaine; bowel obstruction)

Median length of enrollment: 226 days
Median # sessions attended: 19.5
Median percentage of scheduled sessions attended: 61%
46
Participation summary

GCCMH Participants’ Chronic Health Conditions Many participants have multiple (complex) health conditions
47
Overweight/obese 107 Smokers 72 Hypertension 59 Asthma 38 Diabetes 43 High Cholesterol 45 Depression 66 Anxiety 56 Arthritis 32 Edema 20 Substance Abuse 19 Angina 27 Allergies 38
Heart Palpitations 15 Osteoporosis 8 Heart Attack Hx 6 Hepatitis 7 COPD 5 Cerebral Palsy 3 Hyperthyroidism 4 Stroke hx 2 Cancer hx 3 Fibromyalgia 2 Rheumatic Fever 1 Rheumatoid Arthritis 2 Eating Disorder 6

Sample statistics from web-based reports
in GCCMH data warehouse

Data output: Case A
49

Data output: Case A
50

Data output: Case A
51

Data output: Case A
52

53
Data output Case A: Summary
Assessment Date
Weight lbs
Systolic BP
mmHg
Diastolic BP
mmHg
Body Fat %
Total Cholesterol
mg/dL
HDL Chol. mg/dL
LDL Chol.
mg/dL
HbA1c % Waist Circ. cm
Hip Circ. cm
BMI Sit & Reach Ave. in
Triglyce-rides
mg/dL
Begin 4/18/2011 291.2 110 79 32.76 130.8 118.3 41.8 4.75
End 8/12/2011 274 107 69 32.77 126.5 114.5 39.3 3
-17.20 -3.00 -10.00 +0.01 +0.00 +0.00 +0.00 +0.00 -4.30 -3.80 -2.46 -1.75 +0.00

Data output: Case B
54

Data output: Case B
55

Data output: Case B
56

Data output: Case B
57

Assessment Date
Weight lbs
Systolic BP
mmHg
Diastolic BP
mmHg
Body Fat %
Total Cholesterol
mg/dL
HDL Chol.
mg/dL
LDL Chol. mg/dL
HbA1c %
Waist Circ. cm
Hip Circ. cm
BMI Sit & Reach Ave. in
Triglyce-rides
mg/dL
Begin 11/25/2009 230 141 87 50.3 143 42 71 5.5 128 118 38.3 8 152
End 5/10/2011 214 119 60 28.17 143 42 71 5.5 119 113.25 35.6 0 152
-16.00 -22.00 -27.00 -22.13 +0.00 +0.00 +0.00 +0.00 -9.00 -4.75 -2.66 -8.00 +0.00
58
Data output Case B: Summary
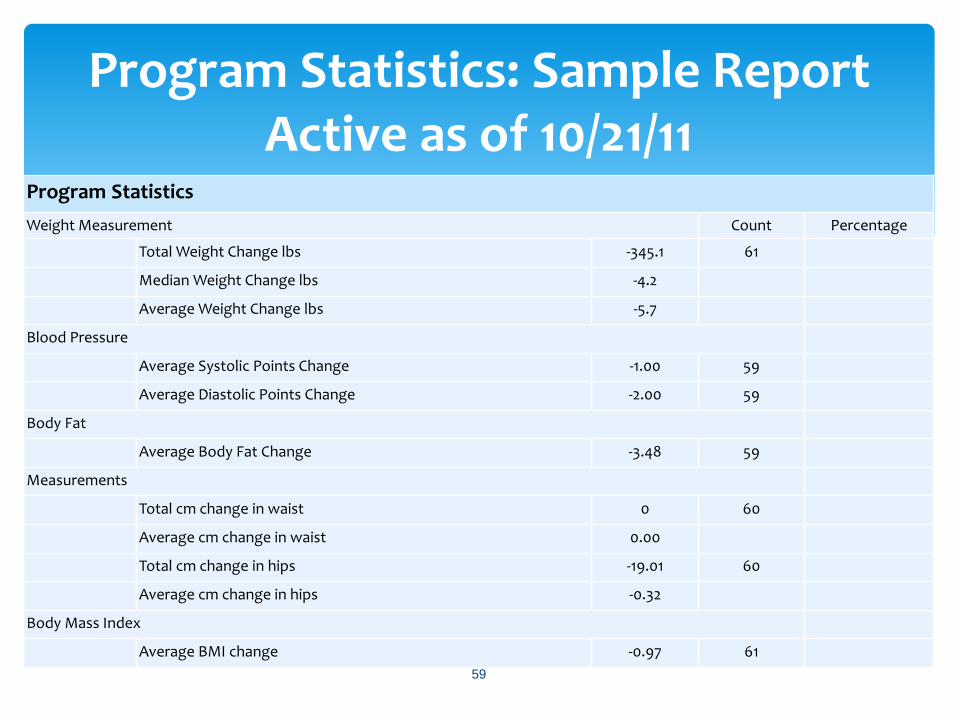
Program Statistics
Weight Measurement Count Percentage
Total Weight Change lbs -345.1 61
Median Weight Change lbs -4.2
Average Weight Change lbs -5.7
Blood Pressure
Average Systolic Points Change -1.00 59
Average Diastolic Points Change -2.00 59
Body Fat
Average Body Fat Change -3.48 59
Measurements
Total cm change in waist 0 60
Average cm change in waist 0.00
Total cm change in hips -19.01 60
Average cm change in hips -0.32
Body Mass Index
Average BMI change -0.97 61
59
Program Statistics: Sample Report Active as of 10/21/11

60
Decrease in diastolic BP (N = 110)
3.2 3.5
6
19
0
2
4
6
8
10
12
14
16
18
20
Mean Median 60th percentile 80th perecentile

61
Decrease in systolic BP (N = 110)
2.8 2
7.6
19.8
0
5
10
15
20
25
Mean Median 60th pct 80th pct

62
Decrease in body fat percentage (N = 102)
3.5
1.2
3.4
7.8
0
1
2
3
4
5
6
7
8
9
Mean Median 60th percentile 80th perecentile

63
Decrease in BMI points (N = 112)
0.49 0.35
1.08
2.3
0
0.5
1
1.5
2
2.5
Mean Median 60th percentile 80th perecentile

Diabetes
Never Present 35 57%
History of condition, but not treated for the condition within the past 12 months
3 5%
Treated for the condition within the past 12 months 17 28%
Information unavailable 3 5%
Information missing 3 5%
Hypertension
Never present 30 49%
History of condition, but not treated for the condition within the past 12 months
1 2%
Treated for condition within the past 12 months and blood pressure is stable
21 34%
Treated for condition within the past 12 months, but blood pressure remains high or unstable
2 3%
Information is unavailable 4 7%
Information missing 3 5%
Obesity
Not present 22 36%
Medical diagnosis of obesity present or Body Mass Index (BMI) > 30 37 61%
Information missing 2 3%
Health Status Measures
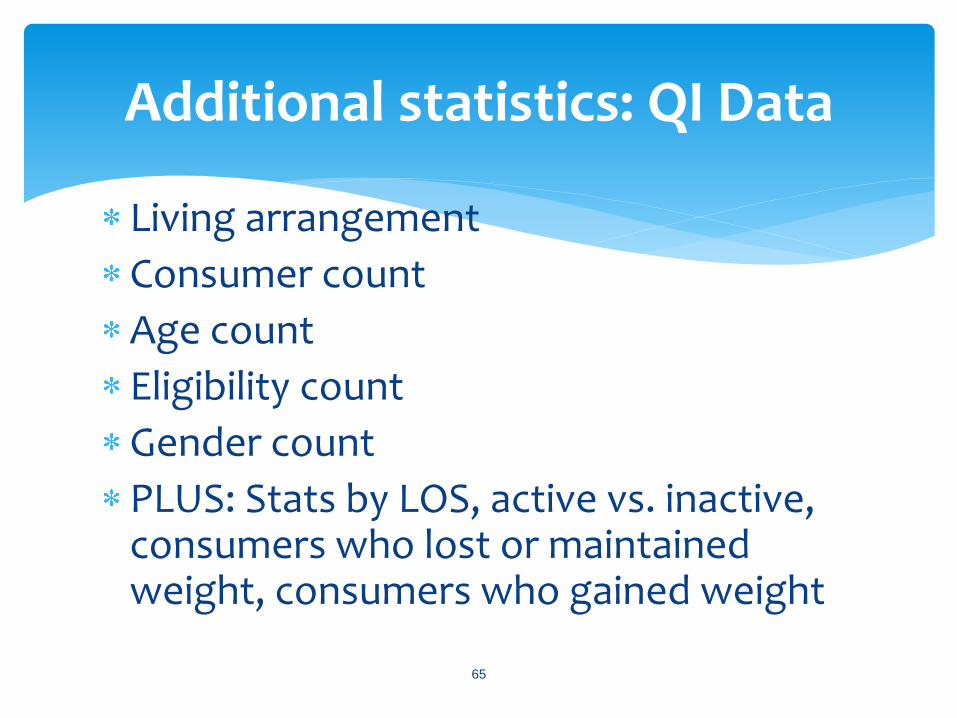
Living arrangement
Consumer count
Age count
Eligibility count
Gender count
PLUS: Stats by LOS, active vs. inactive, consumers who lost or maintained weight, consumers who gained weight
65
Additional statistics: QI Data

Collaboration with the UM’s Department of Psychiatry, School of Public Health, and the Prevention Research Center of Michigan to conduct a comparative effectiveness study of InSHAPE in Genesee County
Study is intended to build upon the Dartmouth Psychiatric Research Center’s NH findings
When the RO1 grant is funded, we will hire 6-7 more Mentors to serve an additional 200+ participants
Health indicators that are/will be documented (in EMR) include:
Weight BMI
Waist Circumference Hip Circumference
Blood Pressure Cholesterol (q 3 mos)
HbA1c (q 3 mos)
Changes in use of Medication/Substance Use
Self-reported changes in mood and sleep patterns
66
Future developments for InSHAPE

InSHAPE financial sustainability
67
Some of the Health Mentors’
activities are eligible for billing as Community Living Supports (CLS, a Medicaid covered service, code H2015) Medicaid can cover about 56% of Health
Mentor costs
Also rely on targeted grants, GF, and foundations
Plus, considerable support from our research partner, the University of Michigan

Van Citters, A.D., Pratt, S I., Jue, K., Williams, G., Miller, P.T., Xie, H., Bartels, S.J. A Pilot Evaluation of the InSHAPE Individualized Health Promotion Intervention for Adults with Mental Illness. Community Mental Health Journal, published online 10 December 2009. Available at: http://www.springerlink.com/content/t4852u6525gr3u62/.
Agency for Healthcare Research and Quality, US Department of Health and Human Services. Exercise and Nutrition Program Helps Individuals with Serious Mental Illness Develop Healthier Lifestyles, Improve Fitness and Mental Well-Being. Published 8 June 2009; updated 8 Aug 2010. Available at: http://www.innovations.ahrq.gov/content.aspx?id=2444.
https://www.mfs.org/services/inshape/inshape
http://tdi.dartmouth.edu/centers/population-health/prcd/inshape/
http://www.rwjf.org/reports/grr/063029.htm
http://www.nytimes.com/2005/12/08/fashion/thursdaystyles/08Fitness.html
http://rwjf.org/files/newsroom/profiles/inshape/
68
Suggested readings on InSHAPE

Tisha Deeghan, Sr. VP/Chief Operating Officer
Genesee County Community Mental Health
420 W. Fifth Ave
Flint, MI 48503
(810) 424-6046 or (810) 223-6028 (cell) [email protected]
For InSHAPE®
Ken Jue, founder of InSHAPE and Senior Executive
Monadnock Family Services
23 Ridgewood Ave
Keene, NH 03431
(603) 352-3891 or (603) 313-5722 (cell) [email protected]
69
Contact info

BONUS!
Additional Mortality Analysis: A comparison of Genesee County
residents to CMH consumers
Many thanks to Fannie Rackover, SPH Summer 2011 Intern, and Fatema Mamou, MPH, Genesee County Health Department
Epidemiologist (now with MDCH Region 6)
70


*
* Ratio to United States deaths, 2007

*
* Ratio to United States deaths, 2007

*
* Ratio to United States deaths, 2007
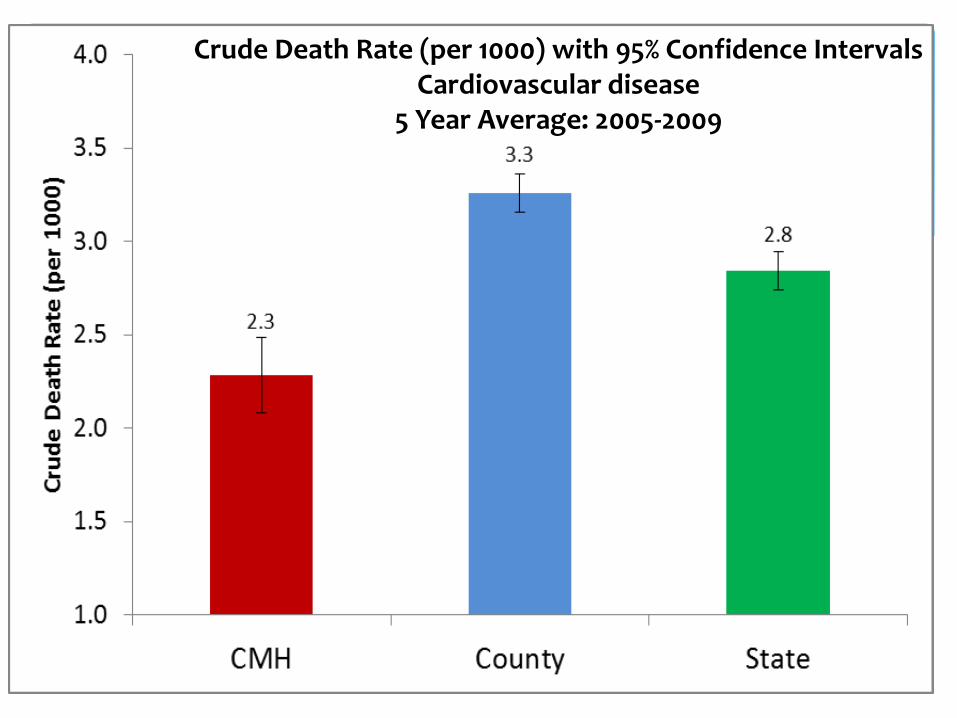
Crude Death Rate (per 1000) with 95% Confidence Intervals Cardiovascular disease
5 Year Average: 2005-2009

Crude Death Rate (per 1000) with 95% Confidence Intervals
Cardiovascular disease by Gender 5 Year Average: 2005-2009

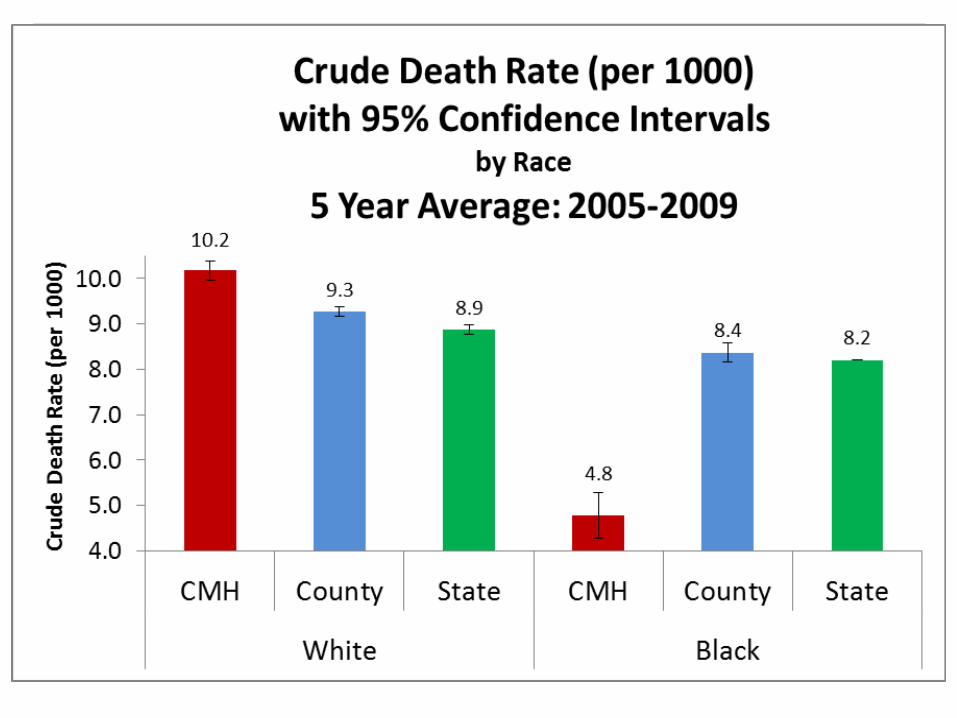
Crude Death Rate (per 1000) with 95% Confidence Intervals
Cardiovascular disease by Race 5 Year Average: 2005-2009

*
* Ratio to United States cardiovascular deaths, 2007

*
* Ratio to United States cardiovascular deaths, 2007

*
* Ratio to United States cardiovascular deaths, 2007
Crude death rate is a simple measure of number of deaths per total population, given per 1000 people Relatively similar death rates for CMH, Genesee County, & Michigan, but they don’t tell the whole story; need to use SMR to account for age Death rates are better presented when adjusted for age, for example: the county has a larger older population than CMH because CMH consumers tend to die at much younger ages We see a change in the pattern: CMH whites have a slightly higher crude death rate than county or state You might expect to observe more deaths in African American CMH consumers, but this may be evidence of a protective factor within CMH; for instance, they are on Medicaid and they are not in jail This is an area that needs further study.
83
Notes from Mortality Bonus Slides

We see a larger difference using SMR than crude rates. SMR interpretation: SMR = 1.88 This ratio indicates that more deaths (about 80%) were observed in CMH consumers than expected from the age-specific rates of deaths in the United States SMR = 1.06 is comparable to the United States, or there were as many deaths as expected for Michigan when compared to the rest of the US
The standardized mortality ratios for African Americans are essentially equivalent Same rates of death as other CMH consumers, but not a greater number of deaths than expected when compared to United States death rates for African Americans Further evidence of possible protective factor for African Americans within CMH It appears that a greater proportion of county & state residents are dying from cardiovascular disease than CMH consumers, but again, remember that CMH consumers are dying at younger ages than the other two populations. SMRs are better able to compare the three populations. When we account for the distribution of the population, compared to the United States, there are about 80% more deaths due to cardiovascular disease than expected in the CMH population
84
Notes from Mortality Bonus Slides
Top Related