


Languages
Pages
Legal


Storing vital products with care
Vopak Half Year 2019 financial resultsAnalyst presentation – 31 July 2019

Forward-looking statement
This presentation contains ‘forward-looking statements’, based on currently available plans and forecasts. By
their nature, forward-looking statements involve risks and uncertainties because they relate to events and
depend on circumstances that may or may not occur in the future, and Vopak cannot guarantee the accuracy
and completeness of forward-looking statements.
These risks and uncertainties include, but are not limited to, factors affecting the realization of ambitions and
financial expectations, developments regarding the potential capital raising, exceptional income and expense
items, operational developments and trading conditions, economic, political and foreign exchange
developments and changes to IFRS reporting rules.
Vopak’s outlook does not represent a forecast or any expectation of future results or financial performance.
Statements of a forward-looking nature issued by the company must always be assessed in the context of the
events, risks and uncertainties of the markets and environments in which Vopak operates. These factors could
lead to actual results being materially different from those expected, and Vopak does not undertake to publicly
update or revise any of these forward-looking statements.
2Vopak HY1 2019 - Analyst presentation

Storing vital products with care
EelcoHoekstra
Chairman of the Executive Board and
CEO of Royal Vopak

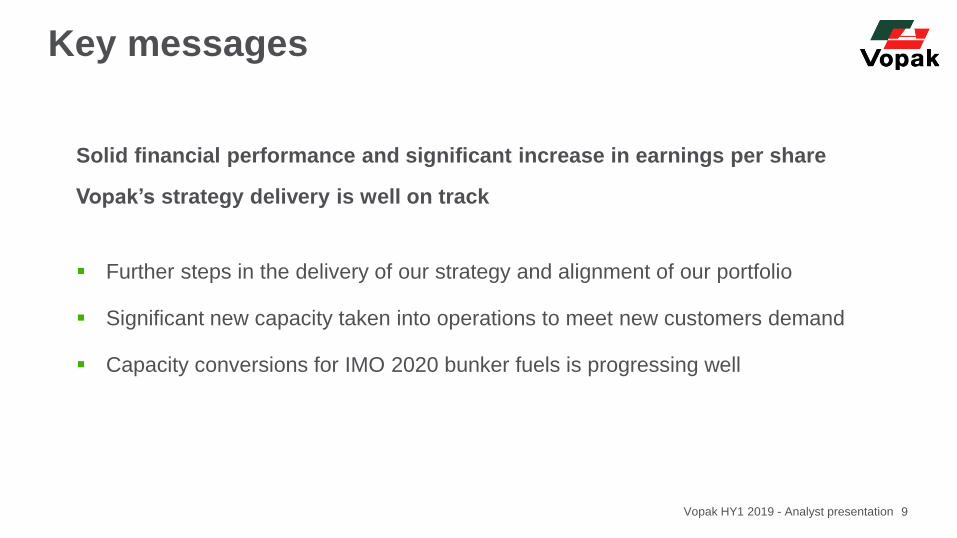
Solid financial performance and significant increase in earnings per share
Vopak’s strategy delivery is well on track
Further steps in the delivery of our strategy and alignment of our portfolio
Significant new capacity taken into operations to meet new customers demand
Capacity conversions for IMO 2020 bunker fuels is progressing well
Key messages
4Vopak HY1 2019 - Analyst presentation

CFFO (gross)In EUR million
1.0
352
Terminal networkIn million cbm
EBITDA*In EUR million
423
85
Occupancy rate**In percent
36.9
Growth
HY1 2019
HY1
2019:
Key figures HY1 2019
Vopak HY1 2019 - Analyst presentation 5
* Including net result from joint ventures and associates and excluding exceptional items
** Occupancy rate include subsidiaries only
RIPET - Prince Rupert, British Columbia, Canada
EPS*In EUR
1.35
12.6
ROCE*In percent

Business environment updateDiversified portfolio, well positioned for future opportunities
6Vopak HY1 2019 - Analyst presentation
Oil products On track for IMO 2020 transition
Oil hubs: solid long-term demand
drivers despite short-term weakness
Fuel oil: on track for IMO 2020
Import-distribution markets:
Solid growth in markets with
structural deficits
Focus on operational delivery
Growing global demand for
chemicals
Continued positive investment
climate petrochemical industry
Chemicals
Reap the benefit of current market
Strong European biofuels market
despite dependency to changes in
government policies
Good global vegoil demand
Vegoils
& biofuels
Gases Steady cash flows
Strong growing demand in
LPG for residential and
petrochemical markets
Strong growth in LNG imports
in Asia (including China)

Strategy execution well on trackStrategic direction is set towards growth and productivity improvements
7Vopak HY1 2019 - Analyst presentation
Efficiency program increased to EUR 40 million by 2019Drive productivity and reduce the cost base
Invest EUR 100 million in new technology,
innovation programs and replacing IT systems
Global roll-out of Terminal Management Software
in progress
3.2 million cbm to be commissioned in 2018 and 2019
Projects in line with long-term market developmentsCapture growth
Sustaining and service improvement capex budget
include investments in our fuel oil network
Spend EUR 750 million on sustaining and
service improvement capex

~10%~10%
~15%
35-40%
2019
35-40%
25-30%
20172014
40-45%
20-25%
40-45%
10-15%
25-30%
25-30%
post 2019*
Industrial terminals
LNG, LPG &
Chemical gases
Chemicals
Oil
~25%
20192014
20-25%15-20%
5-10%
20-25%
5-10%
50-55%
~20%
45-50%
2017
5-10%
25-30%
40-45%
post 2019*
Americas
China
Asia & Middle East
Europe & Africa
Proportionate revenue per product
Proportionate revenue per region
Portfolio transformationShift towards industrial terminals, chemical and gas terminals
* Excluding terminals held for sale
Note: keeping market conditionals equal and only taking announced projects into account 8Vopak HY1 2019 - Analyst presentation
LNG, LPG
& Chemical
gases
• ETPL LNG - Pakistan
• RIPET LPG - Canada
• Vlissingen LPG - the Netherlands
Industrial
terminals • PT2SB - Pengerang, Malaysia
• Deer Park - Houston, US
Chemicals• Alemoa - Brazil
• Merak - Indonesia
• Botlek - the Netherlands
Oil • IMO conversion
• Mexico - Veracruz
• Divestments Algeciras, Amsterdam,
Hamburg and Tallinn
Key projects
Solid financial performance and significant increase in earnings per share
Vopak’s strategy delivery is well on track
Further steps in the delivery of our strategy and alignment of our portfolio
Significant new capacity taken into operations to meet new customers demand
Capacity conversions for IMO 2020 bunker fuels is progressing well
Key messages
9Vopak HY1 2019 - Analyst presentation

Storing vital products with care
Gerard Paulides
Member of the Executive Board and
CFO of Royal Vopak
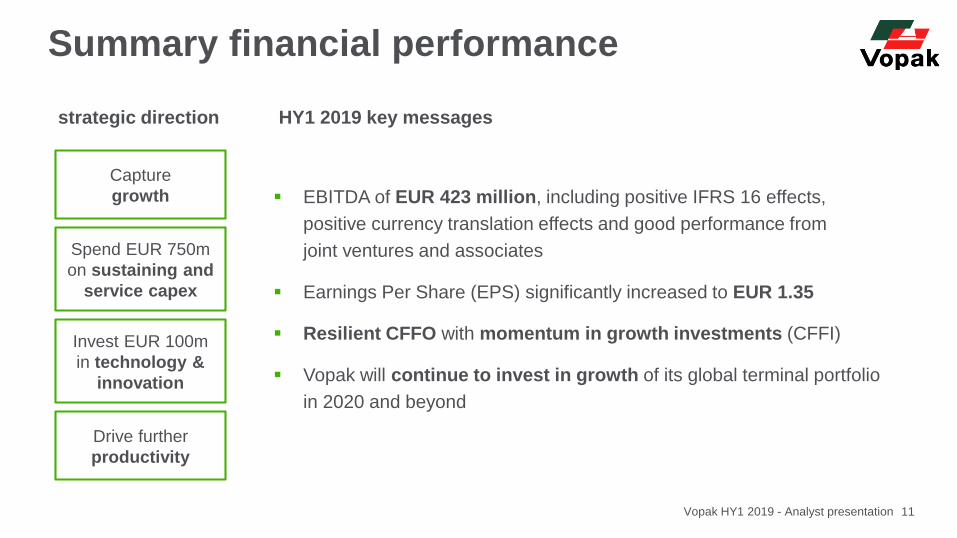
Capture
growth
strategic direction
Spend EUR 750m
on sustaining and
service capex
Invest EUR 100m
in technology &
innovation
Drive further
productivity
EBITDA of EUR 423 million, including positive IFRS 16 effects,
positive currency translation effects and good performance from
joint ventures and associates
Earnings Per Share (EPS) significantly increased to EUR 1.35
Resilient CFFO with momentum in growth investments (CFFI)
Vopak will continue to invest in growth of its global terminal portfolio
in 2020 and beyond
HY1 2019 key messages
Summary financial performance
11Vopak HY1 2019 - Analyst presentation
7.55.1
9.5
7.8
5.5 0.9 1.3
24.3
HY1 2019Adjusted
HY1 2018
HY1 2018
422.6
398.3
FX-effect LNGAmericasChina &
North Asia
Asia &
Middle East
Europe &
Africa
370.9
378.4
pro forma
HY1 2019
IFRS 16
effects
Global
functions,
corporate
activities
and others
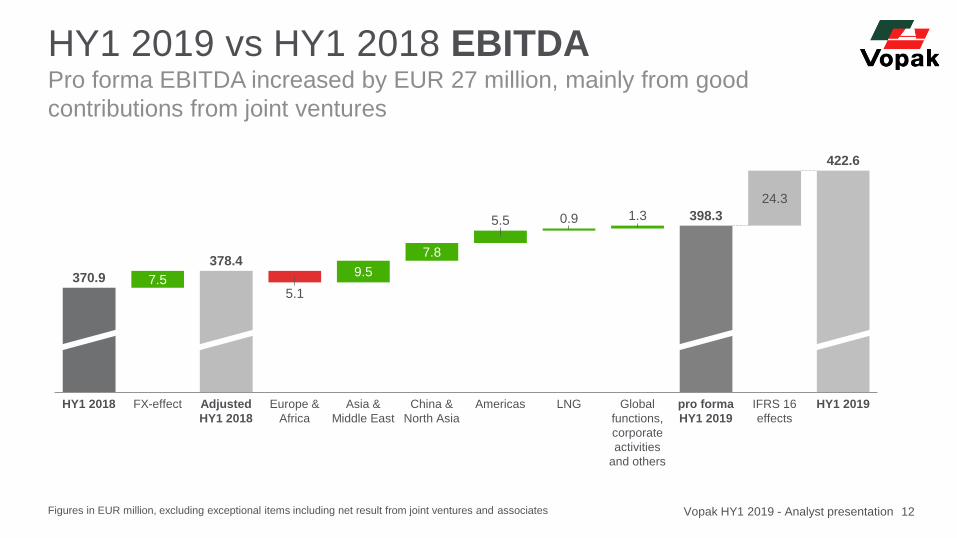
HY1 2019 vs HY1 2018 EBITDAPro forma EBITDA increased by EUR 27 million, mainly from good
contributions from joint ventures
Figures in EUR million, excluding exceptional items including net result from joint ventures and associates 12Vopak HY1 2019 - Analyst presentation

Americas
34.9 33.4 28.5 35.9 39.6
90 89 89 89 91
Q4
2018
Q2
2019
Q2
2018
Q1
2019
Q3
2018
LNG
Europe & Africa
China & North Asia
74.5 77.2 70.3 73.6 76.2
83 86 85 82 83
Q2
2019
Q3
2018
Q1
2019
Q2
2018
Q4
2018
11.9 13.619.0 15.1 13.7
79 73 7383 79
Q1
2019
Q3
2018
Q2
2018
Q2
2019
Q4
2018
Occupancy rate (in percent) for subsidiaries
only, with the exception of LNG
(pro forma) EBITDA (in EUR million) excluding
exceptional items and including net result from
JVs & associates and currency effects
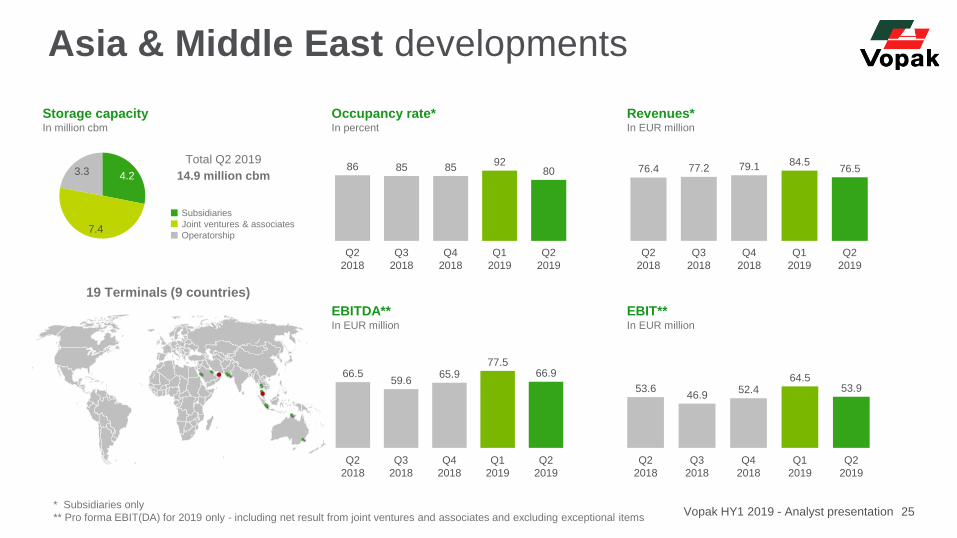
Asia & Middle East
66.5 59.6 65.9 77.5 66.9
86 85 85 9280
Q3
2018
Q4
2018
Q1
2019
Q2
2018
Q2
2019
9.6 6.8 10.2 9.8 9.5
95 95 95 96 96
Q4
2018
Q2
2018
Q3
2018
Q2
2019
Q1
2019
Divisional segmentationEurope & Africa and Asia & Middle East reflect temporary IMO conversion;
Americas and LNG benefit from strong chemical and gas markets
13Vopak HY1 2019 - Analyst presentation

0.2
10.7
1.4 0.3
2.7
3.5 0.6
Q1 2019 FX-effect Asia &
Middle East
Adjusted
Q1 2019
China &
North Asia
LNG Europe &
Africa
Americas Global
functions,
corporate
activities
and others
Q2 2019
214.6 214.8
208.0
Q2 2019 vs Q1 2019 EBITDAQ2 reflects planned temporary conversion activities related to IMO 2020
Figures in EUR million, excluding exceptional items including net result from joint ventures and associates 14Vopak HY1 2019 - Analyst presentation

352
321
196
-11
31
125
Sustaining,
service & IT
investments
CFFO*
(gross)
Tax & other
operating
items
FCF
before
growth
CFFO
(net)
212
Growth
investments
Other
CFFIFree Cash
Flow
before
financing
5
HY1 2019In EUR million
341
313
205
115
28
108
11929
Tax & other
operating
items
CFFO
(gross)
CFFO
(net)
Sustaining,
service & IT
investments
Other
CFFIFCF
before
growth
Growth
investmentsFree Cash
Flow
before
financing
Cash flow overviewInvestment momentum driven by growth project phasing towards 2019
Figures in EUR million
* IFRS 16 classifies lease payments mostly as financing cash flows versus operating cash flows in prior years 15Vopak HY1 2019 - Analyst presentation
HY1 2018In EUR million
CFFO
(net)
FCF
before
growth
Free Cash
Flow
before
financing
Growth
investments
Other
CFFI
Sustaining,
service & IT
investments
Tax & other
operating
items
CFFO
(gross)
CFFO
(net)
FCF
before
growth
Free Cash
Flow
before
financing
Growth
investments
Other
CFFI
Sustaining,
service & IT
investments
Tax & other
operating
items

Robust balance sheet
16Vopak HY1 2019 - Analyst presentation
Target leverage of 2.5 to 3.0 times senior net debt to EBITDA
2.84 2.732.04 2.02
2.49 2.582.99
3.75
2014 2015 2016 2017 Q1
2019
2018 Q2
2019
Target
2.0-2.5 2.5-3.0 3.0-3.5
Maximum ratio under other private placements
programs and syndicated revolving credit facility
Strategic considerations
• Timing of growth opportunities
• Shareholder distributions
2.5-3.0
Senior net debt : EBITDA ratio net debt to EBITDA ratio scenarios

2019
~340
~125
2018
~265~240
2017
Investment phasingBalanced approach for growth, sustaining, service improvement and
IT investments
* For illustration purposes only, new announcements might increase future growth investments
** Growth capex at subsidiaries and equity injections for JV’s and associates
*** Sustaining, service improvement and IT capex including investments in fuel oil network
1,8992,012
1,729
850
2008 -
2010
~1bn
2014 -
2016
2011 -
2013
2017 -
2019
New
projects*
Growth
investments**
Other
investments***
Investments 2008-2019In EUR million
Growth investments with clear
return criteria based on future
cash flow and risk profile
Sustaining and service
improvement investments
influenced by (environmental)
legislation and portfolio
developments
IT investments for rolling out
digital systems and create
value by digital opportunities
InvestmentsInvestments 2017-2019In EUR million
17Vopak HY1 2019 - Analyst presentation

Global fuel oil network
18Vopak HY1 2019 - Analyst presentation
Fuel oil capacity conversions for the IMO 2020 bunker fuels will support
new market requirements as from Q4 2019
* Fuel oil capacity excluding divested terminals and terminals held for sale.
Fuel oil hub terminal
Fuel oil bunker terminal
Terminal under strategic review
Panama
Los Angeles
Estonia
Divested
Fujairah
IMO ready
Singapore
Conversion ongoing
~35%
55%
15%
~65%
2017
45%
10%
45%
2020 2020*
30%
VLSFO
HSFO
Flexible (HSFO/VLSFO/MGO)
Fuel Oil capacity Rotterdam
Conversion ongoing
Hamburg
Held for sale
Algeciras
Held for sale

441 411453
HY1
2017
HY1
2018
91 86 86
HY1
2019
HY1
2017
HY1
2018
394 371 398
HY1
2017
HY1
2018
91 86 85
HY1
2017
HY1
2018
HY1
2019
IFR
SB
AS
ED
NO
N-I
FR
S
PR
OP
OR
TIO
NA
TE
Occupancy rateIn percent
EBITDAIn EUR million
Occupancy rate*In percent
EBITDAIn EUR million
Non-IFRS proportionate
information provides
transparency in Vopak’s
underlying performance
and free cash flow
generating capacity
100 115 138
HY1
2017
HY1
2018
HY1
2019
99 108 125
HY1
2017
HY1
2018
HY1
2019
Maintenance, Service
& IT CapexIn EUR million
Maintenance, Service
& IT CapexIn EUR million
Non-IFRS proportionate information
Vopak HY1 2019 - Analyst presentation 19Excluding exceptional items
* Proportionate occupancy rate excluding divested joint venture in Estonia and fully impaired joint venture in Hainan
Pro forma
HY1 2019
Pro forma
HY1 2019

Capture
growth
strategic direction
Spend EUR 750m
on sustaining and
service capex
Invest EUR 100m
in technology &
innovation
Drive further
productivity
EBITDA of EUR 423 million, including positive IFRS 16 effects,
positive currency translation effects and good performance from
joint ventures and associates
Earnings Per Share (EPS) significantly increased to EUR 1.35
Resilient CFFO with momentum in growth investments (CFFI)
Vopak will continue to invest in growth of its global terminal portfolio
in 2020 and beyond
HY1 2019 key messages
Summary financial performance
20Vopak HY1 2019 - Analyst presentation

Looking ahead
Vopak’s expansion program will add in total 3.2 million cbm in 2018 and 2019,
of which 2.1 million cbm was commissioned up to the end of June 2019
Growth investments amount to approximately EUR 1 billion for the period 2017-2019
Fuel oil capacity conversions for the IMO 2020 bunker fuel regulations are progressing
well and will support new market requirements as from Q4 2019
Vopak will continue to invest in growth of its global terminal portfolio in 2020 and beyond
21Vopak HY1 2019 - Analyst presentation

Storing vital products with care
Questions &Answers
Vopak Half Year 2019
financial results

Royal Vopak31 July 2019
Analyst presentation
Vopak HY1 2019 financial results
For more information please contact:
Investor Relations contact:Laurens de Graaf, Head of Investor RelationsTelephone: +31 (0)10 400 2776e-mail: [email protected]
Media contact:Liesbeth Lans, Manager External CommunicationsTelephone: +31 (0)10 400 2777e-mail: [email protected]
Royal VopakWesterlaan 103016 CK RotterdamThe Netherlandswww.vopak.com
Upcoming events:
Publication of Q3 2019 interim update04 November 2019
Publication of annual results12 February 2020
Publication of Q1 2020 interim update21 April 2020
Annual General Meeting21 April 2020

Europe & Africa developments
Occupancy rate*In percent
153.2 155.8 158.2153.8 151.9
Q1
2019
Q4
2018
Q3
2018
Q2
2018
Q2
2019
83 86 85 82 83
Q2
2019
Q2
2018
Q3
2018
Q4
2018
Q1
2019
Revenues*In EUR million
EBITDA** In EUR million
74.5 77.270.3 73.6 76.2
Q1
2019
Q3
2018
Q2
2018
Q4
2018
Q2
2019
* Subsidiaries only
** Pro forma EBIT(DA) for 2019 only - including net result from joint ventures and associates and excluding exceptional items
EBIT** In EUR million
36.4 38.931.3
35.544.7
Q2
2018
Q3
2018
Q4
2018
Q1
2019
Q2
2019
18 Terminals (5 countries)
Storage capacityIn million cbm
11.3
1.3
Subsidiaries
Joint ventures & associates
Total Q2 2019
12.6 million cbm
Vopak HY1 2019 - Analyst presentation 24
Occupancy rate*In percent
76.4 77.2 79.1 84.576.5
Q2
2018
Q4
2018
Q3
2018
Q1
2019
Q2
2019
86 85 8592
80
Q2
2019
Q1
2019
Q2
2018
Q3
2018
Q4
2018
Revenues*In EUR million
EBITDA** In EUR million
66.559.6
65.977.5
66.9
Q3
2018
Q2
2019
Q2
2018
Q4
2018
Q1
2019
* Subsidiaries only
** Pro forma EBIT(DA) for 2019 only - including net result from joint ventures and associates and excluding exceptional items
EBIT** In EUR million
53.646.9
52.464.5
53.9
Q2
2018
Q3
2018
Q1
2019
Q4
2018
Q2
2019
19 Terminals (9 countries)
Storage capacityIn million cbm
4.23.3
7.4
Subsidiaries
Joint ventures & associates
Operatorship
Total Q2 2019
14.9 million cbm
Asia & Middle East developments
Vopak HY1 2019 - Analyst presentation 25

Occupancy rate*In percent
8.6 7.9 8.310.5 9.8
Q2
2018
Q4
2018
Q3
2018
Q1
2019
Q2
2019
7973 73
83 79
Q4
2018
Q2
2018
Q3
2018
Q1
2019
Q2
2019
Revenues*In EUR million
EBITDA** In EUR million
11.913.6
19.0
15.113.7
Q2
2018
Q4
2018
Q3
2018
Q1
2019
Q2
2019
* Subsidiaries only
** Pro forma EBIT(DA) for 2019 only - including net result from joint ventures and associates and excluding exceptional items
EBIT** In EUR million
9.611.3
16.6
12.4 11.0
Q2
2019
Q1
2019
Q2
2018
Q3
2018
Q4
2018
9 Terminals (3 countries)
Storage capacityIn million cbm
0.8
3.4Subsidiaries
Joint ventures & associates
Operatorship
Total Q2 2019
4.2 million cbm
China & North Asia developments
Vopak HY1 2019 - Analyst presentation 26

Occupancy rate*In percent
71.5 70.3 71.175.6 77.0
Q2
2018
Q3
2018
Q4
2018
Q2
2019
Q1
2019
90 89 89 89 91
Q1
2019
Q3
2018
Q2
2018
Q4
2018
Q2
2019
Revenues*In EUR million
EBITDA** In EUR million
34.9 33.428.5
35.939.6
Q3
2018
Q1
2019
Q2
2018
Q4
2018
Q2
2019
* Subsidiaries only
** Pro forma EBIT(DA) for 2019 only - including net result from joint ventures and associates and excluding exceptional items
EBIT** In EUR million
24.2 23.5
16.9
24.326.9
Q1
2019
Q2
2018
Q3
2018
Q4
2018
Q2
2019
19 Terminals (6 countries)
Storage capacityIn million cbm
3.4
0.2 0.5
Subsidiaries
Joint ventures & associates
Operatorship
Total Q2 2019
4.1 million cbm
Americas developments
Vopak HY1 2019 - Analyst presentation 27
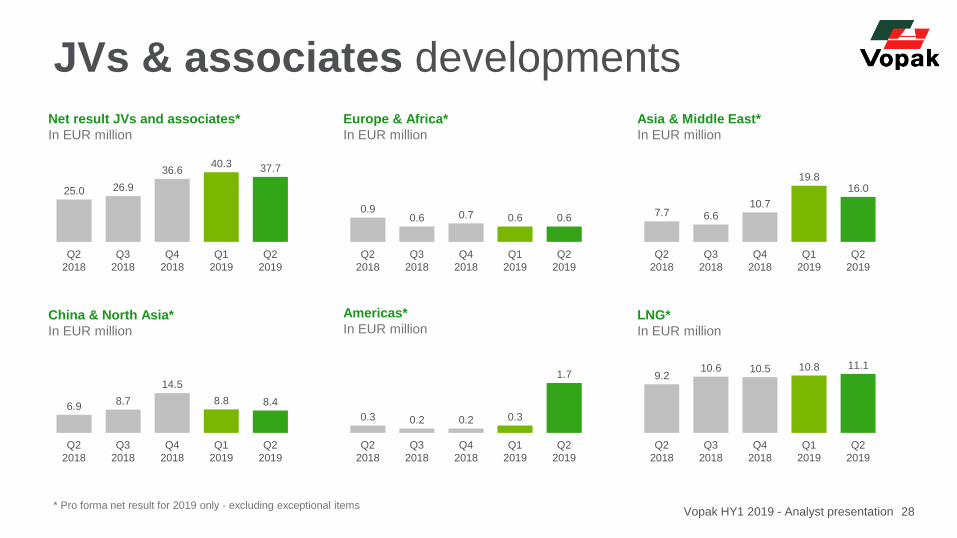
JVs & associates developments
Net result JVs and associates*
In EUR million
* Pro forma net result for 2019 only - excluding exceptional items
Europe & Africa*
In EUR million
Asia & Middle East*
In EUR million
China & North Asia*
In EUR million
Americas*
In EUR millionLNG*
In EUR million
25.0 26.9
36.640.3 37.7
Q1
2019
Q2
2018
Q3
2018
Q4
2018
Q2
2019
0.90.6 0.7 0.6 0.6
Q2
2019
Q2
2018
Q4
2018
Q3
2018
Q1
2019
7.7 6.610.7
19.816.0
Q1
2019
Q2
2018
Q4
2018
Q3
2018
Q2
2019
6.98.7
14.5
8.8 8.4
Q2
2018
Q2
2019
Q3
2018
Q4
2018
Q1
2019
0.3 0.2 0.2 0.3
1.7
Q2
2019
Q2
2018
Q3
2018
Q4
2018
Q1
2019
9.210.6 10.5 10.8 11.1
Q2
2018
Q2
2019
Q3
2018
Q4
2018
Q1
2019
Vopak HY1 2019 - Analyst presentation 28

Project timelines
29Vopak HY1 2019 - Analyst presentation

No commercial impact
Accounting change only, no net cash impact
No economic impact on the business and
how we manage it
Modified retrospective method
Pro forma -excluding IFRS 16- figures
presented for comparison purposes
Impact Vopak 2019IFRS 16 Leases
IFRS 16 Leases
Vopak HY1 2019 - Analyst presentation 30
Key figures In EUR million
EBITDA 40 – 50
Net profit 0 – (10)
IFRS 16 Lease liabilities (jan 1st) ~675
Return on Capital Employed (ROCE)reported on
consistent basis
Net debt to EBITDA ratio ‘Frozen GAAP’
Cash Flows
Cash flows from operating activities 45 – 55
Cash flows from financing activities (45) – (55)
Total cash flows No impact
Top Related