


Languages
Pages
Legal

Stock Prices, Prediction Markets, and Information Efficiency: Evidence
from Health Care Reform
By Joshua Bell
April 1, 2011
I would like to thank Professor William Evans for his advice and counsel throughout the year on this research project.

2
A. INTRODUCTION
Prediction markets are online trading forums where individuals buy and sell contracts
based on the uncertain outcomes for future events. These types of betting exchanges began with
academic research in U.S. political elections, but as prediction markets have grown in size and
design, the types of events have similarly expanded to predicting anything from the recent NFL
Lockout to the amount of winter snowfall in New York City or whether a terrorist attack will
occur somewhere in the world before 2013.1 Prediction markets, as an industry, are still
relatively small, but rapidly growing in popularity and full of promise for economics. Research
thus far has examined prediction markets as tools for forecasting, risk management, and
information aggregation, focusing largely on how the efficient market hypothesis (EMH) applies
to the functional mechanics of these betting exchanges.
The EMH stipulates that securities markets are rather effective in processing and
incorporating information into stock prices. For example, good news from a company‘s
quarterly earnings report will drive up the price of its stock. As a type of (albeit smaller)
financial market, prediction markets can serve as a test of the efficient market hypothesis. If the
EMH applies to prediction markets, the following should be true: First, news and other
information surrounding a particular event should change the price of a prediction market
contract as the news becomes publicly available. Second, the most efficient prediction markets
should aggregate news and other information rather quickly into their contract prices, thus
preventing opportunities for arbitrage and other market manipulations. Lastly, if prediction
markets are efficient, as is the stock market, information surrounding a particular event, say
health care reform, should be reflected in both contracts traded in prediction markets and in
stock prices for companies affected by that particular event (health care firms).
1 Intrade, the self-proclaimed World‘s Leading Prediction Market, has garnered significant press attention in the past few weeks for this last event (terrorist attack before 31 Dec 2013). Many people have questioned the ethical dimensions of such a market, while the website holds that it may in fact prove a tool in assessing the potential risk of attack. The US Department of Defense similarly garnered criticism for trying to create its own prediction market for terrorist attacks in 2003.
3
This paper explores U.S. health care reform in 2009-2010 as a measure of the
information efficiency in prediction markets. Barack Obama championed universal health care
as a key part of his presidential platform in 2008, and by the following summer, debate had
picked up in the House of Representatives. During the year long reform effort, Intrade.com, a
leading prediction market website, hosted two different contracts (referred to in this paper as
the Public Option Contract and the ObamaCare Contract) which covered the event window of
health care reform.2 In looking at how price movements in these contracts correlate with health
care stock prices, prediction markets can be utilized as a tool to potentially tap into the rich
information embedded in security prices to reveal market expectations of health care reform.
This analysis furthers a growing body of empirical research regarding prediction markets
in events studies for financial economics. The conclusions in this paper suggest an important
future for prediction markets in economic research. The findings show through a variety of tests
that the ObamaCare Contract and the Public Option Contract are indeed informationally
efficient, quickly pricing news into the probability that health care reform would pass through
Congress. Regressing these contract prices on their immediate lags reveals that only the first lag
is statistically significant and slightly negative, indicating a small bid-ask bounce.3 These
findings are consistent with other economic literature concerning how quickly information is
processed in prediction markets.
Correlation tests, adjusting for the change in the overall market as measured by the S&P
500, suggest that news and other information which impact stock prices for health care firms
also appear to drive the prices for the ObamaCare and Public Option prediction markets.
However, the statistical significance for these correlation coefficients depends strongly on the
2 A distinction must be made. The Public Option Contract ran from June 16, 2009 until December 31, 2009. This contract asked whether a public option would be included in the final reform bill, if a reform bill were passed at all. The ObamaCare Contract ran from January 21, 2010 until President Obama signed the bill into law on March 23, 2010. This contract asked whether Congress would pass ObamaCare. 3 Bid-ask bounce is the price fluctuation between what a trader is willing to buy (bid) and the price a trader is willing to sell (ask), absent of other market movement. Bid-ask bounce is most noticeable in thinly traded securities. Prediction market securities have shown slight bid-ask bounce, but not enough to deviate away from the mean beliefs of market participants.

4
thickness or thinness of the prediction market. A prediction market with a trading volume less
than 10,000 overall trades during the event window conveys much less about price drivers, and
as a result, loses power as an information-aggregating tool relative to the stock market. Evidence
from the ObamaCare Contract suggests that the winners of the reform effort are health care
facilities (hospitals), managed care firms, and brand pharmaceuticals, while medical device
distributors, health services, and generic pharmaceuticals are losers. Furthermore, the Public
Option Contract indicates that managed care firms were largely expected to lose market
capitalization should a government-run program be legislated in the final reform effort.
The paper is divided into five remaining sections. First, a detailed history of prediction
markets and corresponding research, as well as the timeline for health reform in 2009-2010.
Second, a presentation of several empirical tests of the ObamaCare Contract and the Public
Option Contract as appropriate proxies for the probabilities of health care reform passing
through Congress. Third, a summary of the correlation tests between the daily change in Intrade
prices and stock prices. Fourth, through OLS regression, a time series analysis of the expected
market cap effect in the health care industry contingent on the inclusion of a public option.
Fifth, a concluding discussion of the potential biases which may affect the findings of this paper.
B. PREDICTION MARKETS
Prediction markets are expressively created for the purpose of making predictions.
Traders gamble money on uncertain events in the hopes of winning on a correct bet, similar to
how a person in Vegas might put $20 down on red at a roulette table. However, there is a very
clear and important distinction between a Vegas gambler and a trader in prediction market
contracts: prediction markets offer the opportunity to buy and sell contracts conditional on
available information regarding the event, rather than simply relying on probabilities alone. In
5
fact, interestingly enough, trading activity in prediction markets actually reveals the probability
of an event.4
Since their inception in the late 1980‘s, these markets have evolved to include a variety of
market designs, but the most common market is a winner-take-all, continuous double auction
with a binary outcome. The final cash value for a contract is directly tied to whether a particular
event occurs or whether a particular parameter is met. For example, individuals may trade on
the expectation that The King’s Speech will win the Academy Award for Best Picture, or that the
Dow Jones Industrial Average will close at month‘s end at or above 13,000.
Prediction markets, also known as information markets or event futures, came to
prominence with the emergence of the Iowa Electronic Markets (IEM). Created by the Tippie
School of Business at the University of Iowa, the first markets collected bets on the expected
presidential vote shares for the Republican and Democratic nominees in the 1988 election. As
academic interest developed over the subsequent decade, the IEM expanded to host a wide array
of prediction markets for U.S. political elections at the federal and state level.
The basic structure is simple. A contract pays $1 if a candidate wins, or $0 otherwise.
Before the election is over and the results are official, the contract trades for $p, a value that is
determined through trading activity, which in turn is driven by information about the election as
the news circulates publicly.5 The price of the share, as it fluctuates between $0 and $1, comes to
represent the probability that a certain candidate will win the election. Economists have worked
with this basic structure to discover the value prediction markets might hold for event studies.
4 See Wolfers and Zitzewitz (2005) for a comprehensive analysis of prediction market prices as the probability for event outcomes, analyzing data under several different utility functions. 5 A good contemporary example of this is Sarah Palin‘s ―blood libel‖ comment following the shootings in Tucson, Arizona. Sarah Palin, as a prominent conservative figure, is considered by many to be formulating a presidential bid in 2012. As such, Intrade has hosted a prediction market, asking ―Will Sarah Palin be the Republican nominee in 2012?‖ Prior to her first public comments regarding the tragedy, Palin‘s security was trading around 18 ($1.80), indicating that she had a chance (1 in 20) at garnering the nomination (Mitt Romney was the favorite, trading at 21). However, following her video comments, in which she accused the media of ―blood libel‖ for associating Palin with the shooting, traders immediately went to sell off their contracts, driving the price down to 12 ($1.20), representing a substantial drop off in the perceived probability that Palin would garner the Republican nomination.
6
The first question economists had concerning prediction markets was whether these
forums are accurate in aggregating information relative to other conventional forecasting tools.
Initial research was optimistic. Berg, Forsythe, Nelson, Reitz (2001) showed that the first IEM
election markets had a forecasting error of 1-1.5%, which is decisively smaller than errors
associated with exit polls conducted by Gallup and other agencies. Turning from large national
elections, Leigh and Wolfers (2002) explored the use of prediction markets in local district
elections in Australia. These elections are typically too small-scale to warrant exit polling, and
yet prediction markets were extremely accurate in picking the winner.
Moreover, economists hoped to find other valuable tools in prediction markets in
addition to the fact that they outperform poll-based forecasting. Leigh, Wolfers, and Zitzewitz
(2003) looked to see how prediction markets might compare to independent political analysis.
Their paper focused on a contract which paid out if Saddam Hussein was ousted as leader of
Iraq by a certain date. The contract closely co-moved with an independent measure for the
probability of war (Slate.com‘s Saddameter, a journalist‘s quantitative assessment) and the price
for oil futures, an intuitive indicator for political disruption in the Middle East. The strong
correlation between these three measures suggested that prediction markets are again powerful
tools at aggregating information relative to other more widely used measures.
Furthermore, Giles, Lawrence, Nielsen, Pennock (2001) found that markets hosted on
the Hollywood Stock Exchange for several Academy Award categories were more accurate that
Oscar picks by expert panels. Chen and Plott (2002) worked with data from Hewitt-Packard to
compare how internal prediction markets forecasted sales relative to previously used methods
by the company. Despite the relative thinness of these markets, the predictions were again found
to be more accurate. As the prediction market industry grew beyond political elections to host a
7
wide range of categories, further research has focused on market manipulation, market design,
and other potential biases which may affect their accuracy and power.6
Despite these promising findings, one big impediment has stymied growth in prediction
market applications in the United States: online gambling faces strict regulation. Currently,
eight states bar Internet gambling altogether, while the 2006 Unlawful Internet Gambling
Enforcement Act expanded federal authority to crack down on such online activity. To date, only
the IEM has been grated clearance by the Commodity Futures Trading Commission (CFTC) for
the purposes of academic research. The IEM, as stipulated by their regulatory pass, must adhere
to certain rules that restrict liquidity and access to entry. First, participants must have
expressively academic interests to open an account with the IEM. Second, the CFTC imposes a
$500 limit on any contract traded in a political election market.
Therefore, privately-operated prediction market businesses have been forced oversees to
avoid U.S. federal and state regulations, and consequently, few have developed into highly
functional markets. The two most famous examples are Betfair and Intrade, formerly
TradeSports. Betfair, headquartered in London, concerns itself primarily with European
sporting events: premiership soccer, horse racing, cricket, and rugby. Several reports have
rumored that Betfair is planning an IPO in 2011, and initial speculation places the valuation
around £1 to 1.5 billion ($1.61 to 2.41 billion). Intrade, on the other hand, operates out of
Dublin, Ireland, grew out of the failed TradeSports, the main prediction market competitor to
Betfair. Focusing on events outside the sporting world, Intrade has grown to host over ten
different categories of prediction markets, ranging from Politics to Climate and Weather.7
6 See Gjerstad (2004) for risk aversion in prediction markets, Hanson et. al (1998) for failed manipulative attacks on prediction markets, Notz and Rosenbloom (2006) for real money markets versus play money markets, Manski (2005) for price deviations from the underlying event probabilities, Wolfers and Zitzewitz (2004) for market designs and the applications for each, and Abramowicz (2007) for bubbles and speculative attacks in political election prediction markets. Looking forward, Wolfers and Zitzewitz (2006) suggest that future research will include an analysis of ―feedback loop‖ and endogeniety issues should prediction markets be used to make policy decisions. 7 Currently, Intrade hosts the following categories: Business, Climate and Weather, Current Events, Entertainment, Financial, Fine Art, Fine Wine, Foreign Affairs/International Contract, Legal, Politics, Real Estate, Scientific, Social and Civil, Technology, Transportation
8
Intrade corrects for the restrictions placed on the IEM.8 Anyone can participate, so long
as they have a credit card and access to the Internet, and there is no limit to the maximum bet
on a single contract. Intrade is much more fluid and open as a prediction market exchange.
Furthermore, the individuals who participate on Intrade are overly represented by Wall Street
and the London Financial District, a group of traders much more actively involved in current
events, financial markets, and political policy that the average Vegas gambler.9 Therefore,
Intrade has proven to be a good place to find prediction markets associated with particular
events which hold political policy implications, such as is the case with health care reform.
Barack Obama campaigned heavily on the promise to bring universal health care to the
estimated forty six million Americans who were previous uninsured. Health care was a key piece
of potential legislation for Obama‘s presidential platform, especially given his slogan for ―Hope‖
and ―Change,‖ in addition to the fact that previous Democratic presidents had failed to deliver
any significant policy to the existing health care system. Following his landmark election,
Obama took little time to push health care as a priority in Congress, with strong backing from
Speaker of the House Nancy Pelosi (D-CA) and Senate Majority Leader Harry Reid (D-NV).
Debate picked up in late summer of 2009 as the first draft of the bill entered the House
floor. The focus of the reform effort centered on revamping the private health care insurance
market, providing better coverage for those with pre-existing conditions, and improving drug
coverage in Medicare and Medicaid. The House ultimately passed the Affordable Health Care for
America Act (AHCAA) on November 7th, 2009. The Senate, riding on the momentum of the
8 Here is a simple trading example for a typical contract on Intrade: Suppose a prediction market asks, Will Charlie Sheen be institutionalized by May 31st, 2011? There are only two possible outcomes for this contract - Yes, Charlie goes to the loony bin or No, he does not. When the event window is over and the result is official, if the suits roll in on Charlie, that contract will close at 100. If on the other hand he escapes spending time in a hospital, the contract will close at 0. However, until the event window is over, the contract will fluctuate in value between 0 and 100. To understand profits and losses, think in terms of points. When a contract trades from 63 to 75 - that's 12 points. Each point is worth 10¢. 10¢ x 12 = $1.20. Conversely, when a contract trades from 63 to 37 – that‘s 26 points. 10¢ x 26 = $2.60. Traders and do not have to hold onto the contracts until they expire at either 100 or 0, and there is no limit on the number of contracts a trader can buy or sell for a single prediction market. 9 Leigh, Wolfers and Zitzewitz worked with Intrade CEO John Delaney on their paper, ―What Do Financial Markets Think of War in Iraq?‖ Although the economists were not personally able to see trader addresses and phone numbers, Mr. Delaney mentioned that Wall Street and the London Financial District were well-represented on Intrade. Scanning Intrade forums, the authors found informal evidence to support this claim.
9
House bill, voted in favor of the Patient Protection and Affordable Care Act (PPACA) 60-39 on
December 24th, 2009. Obama was seemingly set to deliver health care reform to America.
While both the Senate (PPACA) and the House (AHCAA) bills were similar, sufficient
differences between the two required another 60-vote majority in the Senate for health care
reform to be enacted into law.10 Heading into 2010, the Democrats were not overly concerned
with this reconciliation given that, despite vehement Republican opposition to reform (all
Republican senators had voted against the PPACA), they maintained a filibuster-proof majority
in the Senate. However, on January 21, 2010, this position changed with the surprise election of
Senator Scott Brown (R-MA).
Following the late Senator Ted Kennedy‘s death in August 2009, the seat was held
temporarily by former aide Paul Kirk Jr. while Massachusetts governor Deval Patrick made
arrangements for a special election on January 20, 2010. The Democratic candidate was state
attorney general Martha Coakley, while Scott Brown, a former state representative, was the
Republican nominee. On January 15th, 2010, an Intrade prediction market for the special
election held that Coakley was strongly favored to win.11 However, just four days later, the
probabilities surprisingly reversed. The election results confirmed the upset victory on January
21st, and Scott Brown was sworn in as a U.S. Senator.
This surprise victory was potentially detrimental to the reform effort. First, Brown‘s
election removed the filibuster-proof majority for the Democrats. Secondly, Brown was a vocal
opponent to health care reform. Consequently, political commentary focused on the decreased
possibility of that reform could pass through the Senate with a 60-vote majority. Democrats
scrambled to regroup the party to approach new strategies for passing the bill. The subsequent
months saw increased debate in Congress concerning the acceptable measures for health care 10 The Henry J. Kaiser Family Foundation has an easily accessible side-by-side comparison tool on their website to understand the similarities between the initial Senate and House bills passed in 2009, as well as the final version signed by President Obama in March 2010. For the sake of consistency, health care reform in this paper refers to the final version of the PPACA. 11 On January 9, Intrade securities were trading around 90 ($9.00) for Coakley and 10 ($1.00) for Brown. The margin closed over the next week, with the contracts trading for 70 and 30, respectively. The weekend of January 15th, the prices reversed, with Brown trading for 77 and Coakley for 25.
10
reform for both political parties.12 Republicans worked to scale back many of the components
which were, in their view, overly expansive. Democrats fought to keep many essential provisions
for the promise of universal health care. Meanwhile, the likely effects of reform were ambiguous
and difficult to assess.13 The ―winners and losers‖ of reform, as pertaining to companies in the
health care industry, were much more undefined given that certain reform measures were
regularly talked in and out of the proposed final version of the bill.
Intrade posted three prediction markets concerning health care reform on its site in
2009. All three asked the question, ―Will a federal government run health insurance plan (a
public option) be approved in the US?‖ by a certain date. The first set the deadline by December
31st, 2009, the second by March 31st, 2010, and the third by June 30th, 2010. All of these markets
closed at zero, largely due to the abandonment of a public option by Democratic House
Representatives during the floor debates for the AHCAA in late 2009.
Following Scott Brown‘s election, Intrade quickly posted a market which asked, ―Will
‗ObamaCare‘ health reform become law in the United States?‖ by June 30th, 2010. This market
(ObamaCare Contract), as well as the December 2009 public option market (Public Option
Contract), garnered significant trading volumes, and therefore are the instruments for analysis
in this paper in regards to the effect of reform on the health care industry.
C. INTRADE SECURITIES
The ObamaCare Contract began trading the same day Scott Brown was sworn into office.
Traders bought and sold contracts on the expectation that an amended health reform bill would
12 Nolan H. Miller and Mohamad Al-Ississ succinctly summarized the partisan critiques of health care reform in their paper, ―What Does Health Reform Mean for the Healthcare Industry? Evidence from the Massachusetts Special Senate Election.‖ ― They write, ―Critics on the left have assailed the individual mandate as well as the lack of a strong public-option in the legislation as essentially a bribe to the insurance industry. Critics on the right, on the other hand, have responded to the provisions of the bill, such as requiring insurers to cover those with expensive, pre-existing conditions, as a quick way to drive them out of business.‖ 13 This paper assumes that the lack of clarity as to the exact substance of the bill as March 23 approached is reasonable and defensible. A Google search for ―winners and losers of health care reform‖ reveals a set of diverse opinions concerning the various sub-industry sectors for health care. Furthermore, the Kaiser Family Foundation released a recent poll in which they found over half the respondents were confused about health reform law.

11
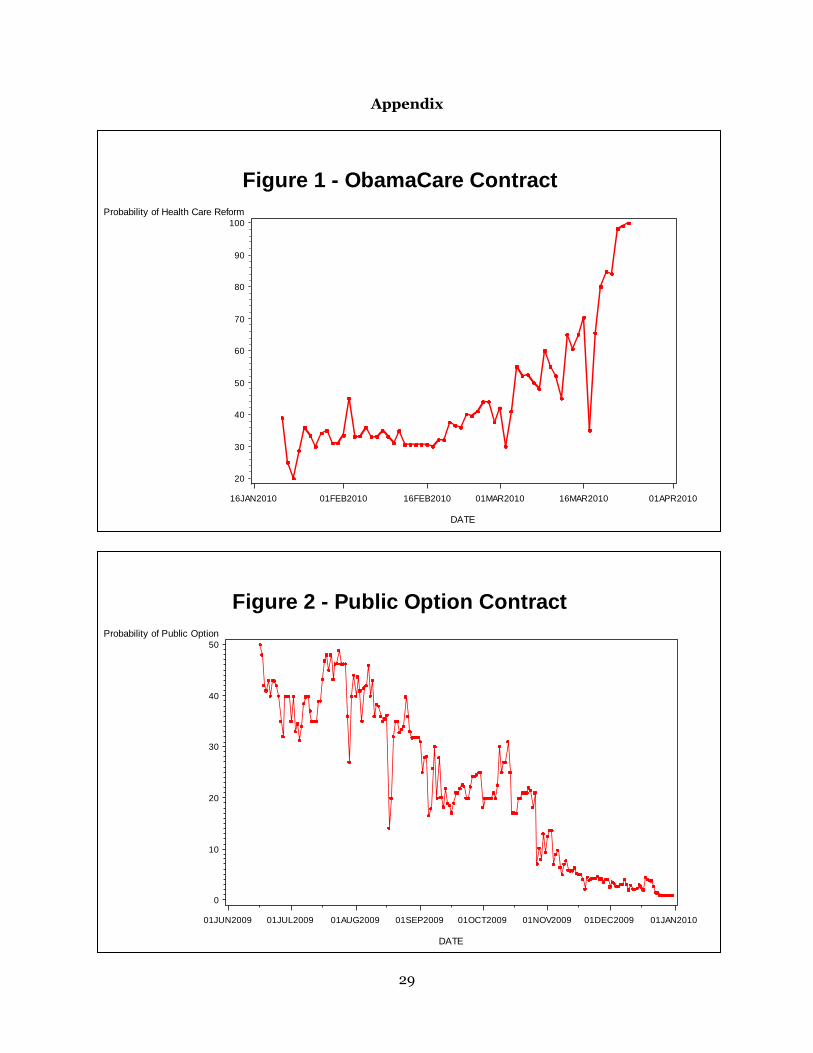
be passed on or before June 30, 2010. The market opened at 38.9 ($3.89 per contract), but
quickly fell to 20 ($2.00) following the upset victory in Massachusetts. Figure 1 displays the time
series for the ObamaCare Contract. Following the initial drop-off, the price of the contract
steadily rose during the subsequent weeks, as activity in the market increasingly reflected the
possibility that health care reform could indeed pass in the Senate. By March 9, the contract was
trading at 60 ($6.00) and two weeks later, Obama signed the PPACA.14
Prediction markets, as a form of financial markets, offer a new means of re-examining
the efficient market hypothesis (EMH). The EMH was introduced in an article by Eugene Fama
(1970) titled ―Efficient Capital Markets.‖ Fama found that empirical tests suggested that
securities markets are very good at reflecting news and other information in stock prices. The
idea followed that as new information becomes available, it quickly disseminates to investors,
who subsequently react by buying and selling, and thus the price adjusts accordingly. As a result,
technical and fundamental analysis of individual stocks would not allow investors to exploit
profitable strategies above the average market return. In fact, investors could only achieve
excess returns of the market if they were willing to take on more risk in their portfolios. The
EMH takes three forms: strong, semi-strong, and weak. Strong EMH holds that security prices
reflect all public and private information, including insider information. Semi-strong EMH
maintains that prices reflect all past public information and quickly change to reflect new
information as it becomes available. Weak EMH argues that prices reflect only past public
information.
The EMH is tied closely to the idea of a random walk, a term used in finance to describe
a stock whose price changes are independent and identically distributed (iid) random shocks to
14 Slate.com ran an article which argued that the ObamaCare Contract ―got health care wrong.‖ In summary, author Daniel Gross points to the fact that because the Intrade contract was trading around 80 ($8.00) a week before Obama signed the PPACA, the market greatly underestimated the chances that health reform could be passed in the Senate. As argued in the previous endnotes, there was a lack of clarity surrounding the bill in general, ranging from what measures would make the final version, to which swing vote senators were for and against reform. Senator Joe Lieberman, a key Independent voter, public announced on March 19th, four days before the reform was signed into law, that he supported the bill. As such, the price for the ObamaCare Contract did not necessarily underestimate the chances of health care reform altogether, but rather again reflected the mean expectations of market participants as to the underlying probability for the event outcome.

12
previous prices. The assumption of iid implies that stocks reflect information, and if information
today is assumed to be independent from tomorrow, then tomorrow‘s news will be represented
in unpredictable and random changes to the stock price. Several empirical tests can determine if
a time series data set follows a random walk. Unit root tests developed by D.A. Dickey and W.A.
Fuller (1979) and P.C.B. Phillips and P. Perron (1988) regress the first difference in data on
lagged values to estimate a parameter (usually denoted as ρ) between 0 and 1. The closer ρ is to
1, more of yesterday‘s value carries over into today. If ρ is equal to 1, then the time series follows
a random walk, and tomorrow is unpredictable. Employing the Augmented Dickey-Fuller (ADF)
test and the Phillips-Perron (PP) test, the ObamaCare Contract can be evaluated to see how
quickly the market incorporates past information into the price. The null hypothesis is that the
time series contains a unit root.15
Yt = μ + ρYt-1+εt
ΔYt = μ + (ρ-1)Yt-1+εt = μ + δYt-1+εt
H0: δ = 0 (where δ = ρ – 1)
Where ΔYt is the first difference in stock prices, Yt-1 is the stock price yesterday, μ is a drift
parameter, and εt is a white-noise error term. The results are documented in Table 1. The t-stat
for ADF is -1.522. The t-stat for PP is -0.83. Both of these parameter estimates are statistically
insignificant. The null hypothesis of a unit root cannot be rejected.
A complementary test to the ADF and the PP is the Kwiatkowski-Phillips-Schmidt-Shin
(KPSS) test for trend stationarity. A time series is trend stationary if, after removing any trend
from the data, the series has a stationary process. Stationary process is a stochastic process
whose probability distribution does not change when shifted through time and space. The mean
and variance, therefore, also do not change, and future values can be accurately forecasted.
15 The PP test differs from the ADF test in the respect that the PP model corrects for heteroskedastic errors. Two main assumptions regarding the random walk hypothesis are that E(εt)=0 and Var(εt)=σε. These assumptions are important insofar as the best guess for the price of a stock tomorrow is the price today, given that all information is priced into the security and the remaining forecastable data is white noise, iid~(0, σε).
13
Random walks do not have a stationary trend as future values are unpredictable. The null
hypothesis is that a time series contains a stationary trend.
χt = τt + βt + εt
H0: σμ2 = 0
Where τt = τt-1 + μt is a random walk and μt ~iid (0, σu); βt is a deterministic trend and εt is a
stationary error. The t-stat for the KPSS test for the previous four lagged values are 0.615, 0.425,
0.353, and 0.304 respectively. Each of these t-statistics is statistically significant at the 1% level,
and the null hypothesis of trend stationarity can be rejected. Therefore, failing to reject the null
in the ADF and PP tests and rejecting the null in the KPSS test is a particularly conclusive means
to indicating a time series contains a unit root and a non-stationary trend.
A second empirical analysis is to regress the change in daily prices for the ObamaCare
Contract on its immediate lags to test whether simple profitable trading strategies exist outside
the use of publicly available information. If parameter estimates for lagged values are strongly
negative and statistically significant, Intrade securities would exhibit a delay in aggregating new
information into their prices, and traders could hypothetically exploit this delay to forecast
accurate price paths for their own personal gain. Table 1 documents the results. The ObamaCare
Contract has a statistically significant, but only slightly negative estimate for the first lag, while
longer lagged values are statistically insignificant. These findings correspond with other
empirical analysis regarding information incorporation in Intrade contracts. For example,
Leigh, Wolfers, and Zitzewitz (2003) found that the TradeSports (now Intrade) contract on the
ouster of Saddam Hussein exhibits slight bid-ask bounce, while other lags were similarly
statistically insignificant.
These econometric tests indicate that these prediction market contracts are
informationally efficient, rapidly processing news and risks and beliefs into its prices, and are
free of simple trading strategies which might manipulate the market. Therefore, the ObamaCare
Contract serves as a good measure for the probability of whether health reform passes through
14
the Senate by June 2010. The same empirical analysis tested the viability of the Public Option
Contract as a proxy for the probability that a government-run program would be included in the
final reform bill. Figure 2 displays the timer series for this market, and Table 1 documents the
results. Similarly, the Public Option security is efficient and absent of foreseeable price changes.
D. STOCK PRICE CORRELATIONS
Health care reform, as with most policy decisions, intends for important social change.
However, the effects of policy outcomes are hard to assess. This is particularly true for
legislation that implements itself over a longer time frame. Many of the provisions in the PPACA
do not take effect until 2013, 2015, and 2018, eight years after Obama signed the bill.16 The
Congressional Budget Office (CBO) initially estimated that health care reform would decrease
the deficit by $143 billion dollars over the first decade. After several requests from Congress, the
CBO generated a second estimate beyond ten years, something the agency rarely does, and
found that health care reform reduces the deficit by $1.2 trillion over a twenty year period,
although this report warned that significant changes could occur that will affect the cost-savings
projections.
Many disagreed with the CBO‘s analysis of the PPACA. Uwe Reindhart, for example, an
economist at Princeton University, responded by saying, ―The rigid, artificial rules under which
the Congressional Budget Office must score proposed legislation unfortunately cannot produce
the best unbiased forecasts of the likely fiscal impact of any legislation.‖ Megan McArdle, chief
business and economics editor at the Atlantic Monthly, agreed with Reindhart‘s opinion,
arguing the assumption that Congress will carry out all that it promises in the PPACA is ―hopeful
but false-minded.‖
16 In fact, the PPACA is undergoing a repeal process in the House of Representatives following the Republican Party gaining control during the midterm elections. The probability (as measured by qualitative political analysis; unfortunately Intrade does not currently have a market for repeal) that the PPACA is reversed is held to be low, but the real push is to delay implementation of several provisions that are viewed to be ―job-killing‖ and ―debt-heavy‖ to the economy.
15
Political opinion is not much better in projecting the effects of health care reform.
Representative Paul Broun (R-GA) said on the House floor, "If ObamaCare passes, that free
insurance card that‘s in people‘s pockets is gonna be as worthless as a Confederate dollar after
the war between the states — the Great War of Yankee Aggression." Michelle Bachman (R-MN)
called health care reform, ―the crown jewel of socialism.‖ Nancy Pelosi has said that the failure
to legislate health reform would do ―violence to the national debt.‖ Harry Reid emotionally
proclaimed during a Senate meeting, "a study that shows 45,000 Americans die every year
because they don't have health insurance, almost 1,000 a week in America. We need reform."
Analysis of this type suffers from what might be termed a ―cheap talk‖ bias. Political
pundits appear on Fox News, MSNBC, CNN, et al. to offer their expert testimony on the
potential outcomes of reform and other political events. However, news outlets maintain a
particular political leaning, and consequently, a pundit‘s perspective can easily fall in line with
the channel‘s partisan bias. Furthermore, most of the discussion surrounding health care reform
focused upon the most prominent measures in the bill, namely the individual mandate, and the
larger political discussion of liberty and equality.
Financial markets provide a nice alternative to expert testimony. First, markets
aggregate opinions, but by requiring that a trader put ―your money where your mouth is,‖ they
lessen the cheap talk bias and create incentives for individuals to reveal their true beliefs about a
particular event, such as health care reform. Second, financial markets take into account not
only the cost of policy today, but incorporate into security prices the harder to assess future
costs of tomorrow. The stocks for health care companies are reacting not only to the immediate
changes, such as higher tax rates, but also reflect how long-term growth potential might be
affected under a reformed health care system.
Prediction markets, as small financial markets, compliment larger stock markets in
assessing the effects of health care reform. Tracking the co-movements of the probability of
reform, as measured by the ObamaCare Contract, against stock prices for health care firms can
16
reveal how investors prepared for reform.17 Correlation tests reveal market beliefs concerning
the impact of policy decisions, under certain assumptions. The main assumption is that news
about the probability of health care reform affecting financial markets is the source of
covariance. The magnitude of this covariance is informative about the reform‘s expected effects
on the health care industry.
The statistical test is simple. The daily change in stock prices is correlated with the daily
change in prediction market prices. The daily change is calculated from the difference between
the logged price today and the logged price yesterday. To control for systemic shocks to the
market, which affect the economy as a whole, the daily change in a market aggregate, in this case
the S&P 500, is differenced from the daily change in each stock.
%Δ(Price)= ln(Pt) – ln(Pt-1)
%Δ(Stock)= %Δ(Price) – %Δ(S&P 500)
ρ(%ΔIntrade, %ΔStock)
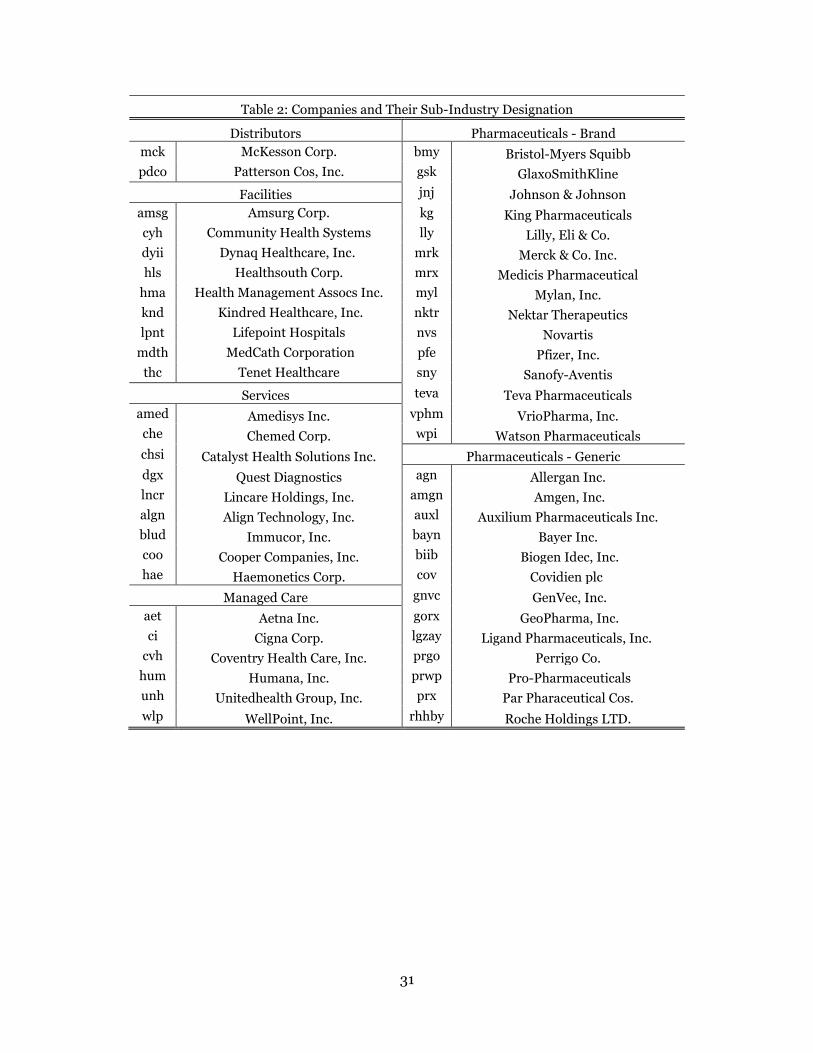
Table 2 displays the company stock ticker and the sub-industry designation, and Table 4
displays the results of the correlation tests. The first column displays the raw correlations
between the ObamaCare Contract and health care stocks, the second column for the S&P-
adjusted. The strongest positive correlations are observed in the sub-industries for facilities
(Health Management Associates ρ= 0.24) managed care (Coventry ρ=0.32), and brand
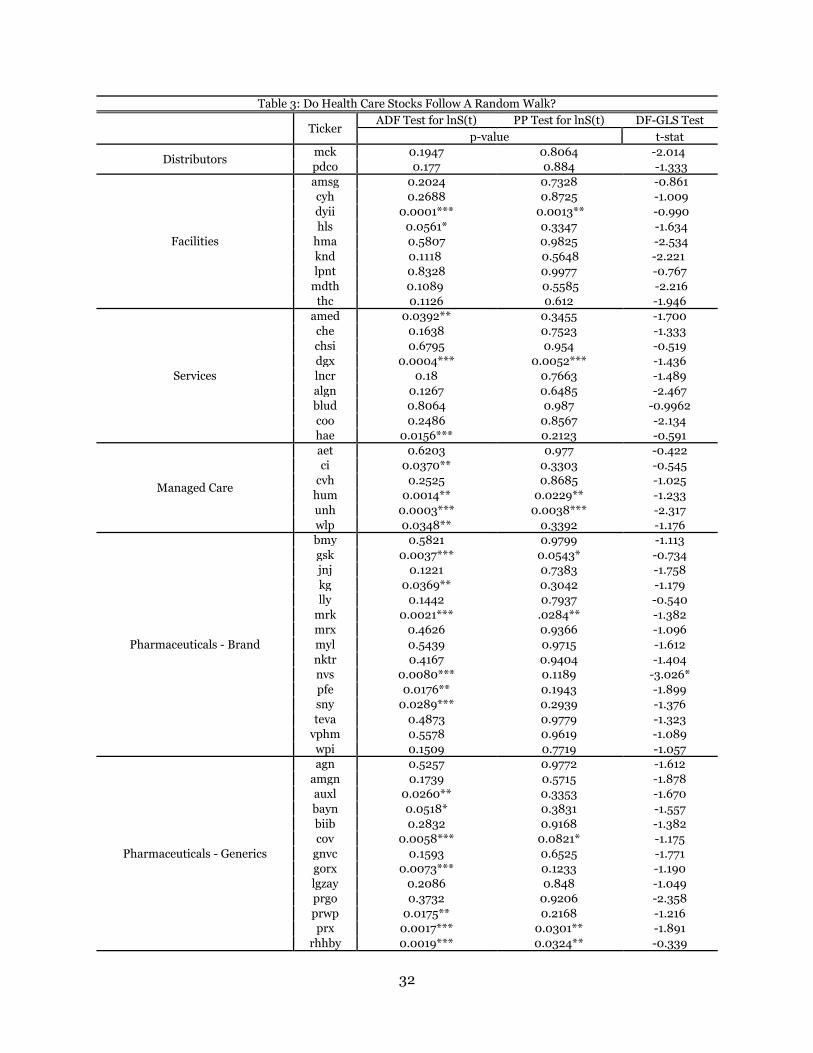
17 Stock prices were collected from the Center for Research in Security Prices (CRSP) at the University of Chicago. The health care companies were segmented according to the sub-industry sectors as determined by the S&P Global Industry Classification (GICS). In order to accurately track the co-movements between stock prices and prediction market probabilities, the same tests for unit roots (ADF and PP) are employed to determine if these health care securities follow a random walk. Table 3 documents the results. However, the event window for the ObamaCare Contract is rather short. The prediction market opened on January 21, 2010, and closed two months later on March 23. Economists have noted that stock movements have shown short term volatility and mean reversion, and as a result, the ADF and PP tests might reject the null hypothesis of a unit root when in fact the stock indeed follows a random walk. In other words, short term noise effects might mask the unit root. The ADF test rejects the null hypothesis at the 5% level for 20 companies, indicating that these stocks do not process news and other information as efficiently during the short time frame. The PP test similarly rejects the null for 7 companies. Elliot, Rothenberg, and Stock (1996) worked together to create a new class of random walk testing. In their paper, ―Efficient Tests for an Autoregressive Unit Root,‖ the economists developed a transformed ADF test, correcting heteroskedastic and/or serial correlated errors through the method of generalized least squares. The ERS Test, named after the economists, is also referred as the DF-GLS Test. This test is conclusively more powerful in discovering unit roots in time series data sets. In applying the ERS test to the stock prices of the collected health care firms, only Novartis has a test-statistic that is statistically significant at the 10% level. The ERS test fixes the short-term volatility and reaffirms the empirical research that stocks are informationally efficient, even in short event windows.

17
pharmaceuticals (GlaxoSmithKline ρ=0.23). The strongest negative correlations are distributors
(Patterson Co. ρ=-0.26), health services (Chemed Corp. ρ=-0.23), and generic pharmaceuticals
(Pro Pharmaceuticals ρ=-0.31).
These findings are compelling. Qualitative analysis found difficulty in placing the
appropriate weights on particular measures in the bill in determining whether a health care sub-
industry would benefit overall from reform. For example, there was considerable discussion on
how managed care firms would be affected. On one hand, these companies would collect
premiums from a potential forty six million new customers. On the other hand, they would face
higher tax rates and government restrictions on the insurances they sell. Pharmaceuticals feared
that greater government involvement in the health care industry would lead to price controls,
but deals increasing supply to Medicare and Medicaid, and the influx in newly insured, would
benefit these companies as well. Other sub-industries, particularly medical device
manufacturers, were similarly debated. Certain components in the reform bill benefited
companies, while others were seen as detrimental to business, and how each would come out
after reform was difficult to assess without quantitatively analyzing how stock prices reacted to
news about reform.
A Google search for the ―winners and losers of health care reform‖ confirms the wide –
ranging opinions regarding the perceived effects of reform. Reuters ran an article on March 22,
2010, which argued that brand pharmaceuticals, biotech companies, device makers, and
hospitals were winners, while managed care and generic drugs were losers. A day earlier, an
article by Forbes magazine told a much different story, arguing that managed care and all drug
companies were winners. The Wall Street Journal posted an analysis piece which had
overlapping opinions to the previous two examples: managed care firms were losers, drug
companies were winners, hospitals were losers, and biotech manufacturers were winners. Some
even picked certain health care firms as both winners and losers, as political analyst Lita Epstein
did in her own analysis of reform.

18
These correlation tests offer a means through which individuals can parse out the cheap
talk bias and harder to assess policy costs in order to elicit what financial markets have to say
about health care reform. An important caveat, however, comes with correlating prediction
market prices with the stock market. The prediction market must have sufficient trading volume
to work well as an information aggregation tool relative to larger, more liquid financial
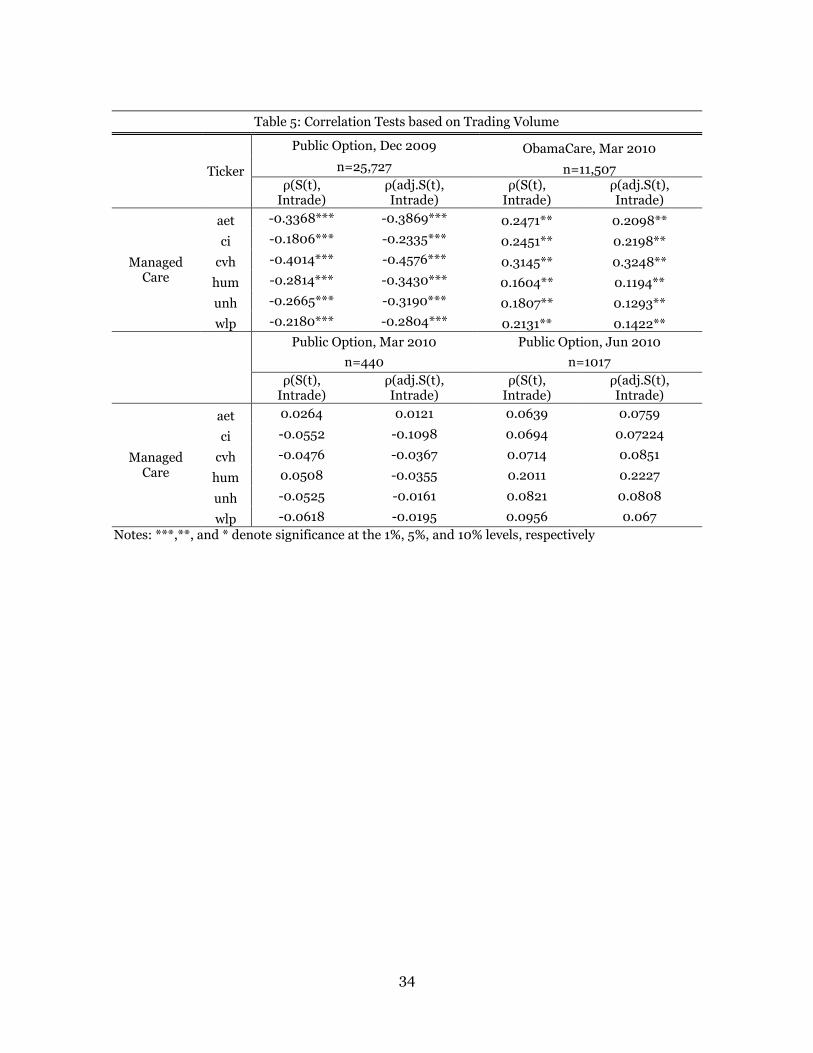
markets.18 Table 5 displays the correlation coefficients between the daily change in various
Intrade securities and managed care firms. The Public Option Contract for December 2009 had
a volume around 25,000 total trades, and correspondingly, each of the correlation coefficients is
statistically significant at the 1% level. For the ObamaCare Contract, which had a trading volume
just over 11,000, the coefficients are significant at the 5% level. For both the Public Option
contracts expiring in March and June 2010 respectively, each of the correlation coefficients is
statistically insignificant.19
The value of prediction markets as tools for processing information depends largely on
the trading volume of the market during the event window. Not surprisingly, research by
Hanson, Oprea, Porter (2006) finds that market manipulation and other inefficiencies are
observed most strongly in prediction markets that are thinly traded. Highly traded markets
offer individuals the profit incentive to correct for manipulations that thinly traded ones do not.
In the case for the ObamaCare Contract and the Public Option Contract, the volumes are
significant enough to prevent such manipulations, and provide meaningful insight into the
expected effects of health care reform.
18 Clarification is needed. This paper‘s findings argue that as prediction markets become thicker, the information contained within them generates stronger co-movements with stock prices. The stock market is highly fluid with thousands and thousands of daily trades. Without sufficient fluidity in prediction markets, these markets simply cannot compliment the trading activity in the stock market. These findings do not refute, nor even address, the relationship between trading volume and forecasting error for prediction markets. Previous research has held that even thinly traded markets outperform more conventional forecasting methods. 19 A separate example offers evidence to support this claim about strength of correlation and thickness of prediction market. During the Auto Crisis of 2008-2010, Intrade hosted several markets gauging the probability of bankruptcy for the Big Three Automakers. The GM market had a trading volume around 10,000, Chrysler around 5,000, and Ford around 500. Tracing the co-movements of the Intrade prices with the three largest auto suppliers (TRW Auto, Johnson Controls, and AmericanAxle Corp.) yields similarly statistical significance on the correlation coefficients. The GM market was significant at the 5% level, while Chrysler and Ford were not.
19
E. MARKET CAP ANALYSIS
A federal government-run public insurance option has long been a goal for many Democrats
because it is seen as a way to both lower health care costs and provide greater coverage. The
argument is that the public option would directly compete with private health insurers with the
hope that the public option, without a profit component, would offer a lower cost alternative and
hence, drive down prices among private plans. The public option would be accountable to
Congress, and would be available in every state as a choice to people who need insurance.
The public option, nonetheless, is a much contested topic. Supporters of the plan argue
that private insurers maintain virtual monopolies in state health care markets throughout the
country, and that a strong, government-run program is the best way to drive down private
insurance costs and offer greater coverage to the middle and lower classes. Opponents of the
public option argue that such a plan is the initial steps towards socialized medicine because the
plan, with government subsidies, would drive private insurers out of business.
Opinion polls are split on support for a public option. Angus Reid Public Opinion, in a
November 2009 poll, found that 52% of Americans supported a public option. A Pew Research
Center report in October 2009 found similar results, showing that 55% of Americans were in
favor of a government-run insurance plan. However, a Rasmussen Reports poll in August 2009
stated that 57% of Americans did not support the AHCAA with the public option included. A
NBC News/Wall Street Journal report around the same time also found that more Americans
opposed the public option, 47% against to 43% in favor.
The split opinion on the public option suggests again that ―cheap talk‖ and partisan
biases influence perspectives on the viability of a government-run insurance plan. Furthermore,
just as the case with the PPACA showed, the specifics of a public option were largely absent from
political analysis. Important items, such as whether or not the public option would be for-profit
or simply break even, or include cost-cutting deals for hospitals and pharmaceuticals that
20
bought into government insurance, were ignored in favor of the bigger question of the federal
government‘s true role in the health care industry.
To get around these biases, and to understand how financial markets responded to
information about the public option, prediction markets provide a quantitative measure of the
probability that a government-run program would be included in the final reform bill.
Comparing the time series of the Public Option Contract against the stock movements of
managed care firms allows for an investigation into how news affected both prices. Table 5
records the correlation coefficients between the daily change in the prediction market against
the daily change in managed care stocks. The results are statistically significant, and strongly
negative, implying that as the probability of a public option became more and more likely,
managed care firms saw their stocks decrease in price.20
The main assumption in these correlation tests is that the source of covariance is news
affecting stock prices, and the size of the covariance signals how strongly stocks react to the
probability of a public option. Coventry Health Care, Inc., for example, has a correlation
coefficient ρ=-0.40, while Aetna, Inc. has a coefficient ρ=-0.34. Other managed care firms have
similarly negative coefficients, which are all significantly larger in absolute terms when
compared to the corresponding correlation coefficients for the ObamaCare Contract. Managed
care stocks reacted more negatively to the probability of a public option than to the probability
of health care reform, implying that the costs of a public option were far greater than the
benefits from the PPACA.
However, prediction markets offer an opportunity to move past correlation and test for
causation. Correlation tests indicate whether or not managed care firms would gain or lose from
Congress adopting a public option, but econometric methods can generate dollar estimates
20 In reality, the probability of a public option went to zero on a steady decline during the event window. Therefore, as the probability decreased, the stocks increased. Nevertheless, strong negative correlation implies that a public option was bad for managed care stocks.
21
which captures the exact magnitude of the expected profit or loss. The model is a simple time
series regression using ordinary least squares.
ΔYt = β0 + β1ΔXt + εt
Where ΔYt is the change in stock price for managed care firms, ΔXt is the change in the
probability for a public option, εt are random errors, and β1 is the parameter of interest. The
model is run assuming arbitrary autocorrelation between errors and as a result, the standard
errors for β1 are calculated using a procedure outlined by Newey-West (1987). This model does
not imply a causal relationship from prediction markets to stock prices. A change in the Public
Option Contract price does not directly affect the stock price of a managed care firm. Rather, β1
captures the relative scaling of the impact of news and information on these two markets.
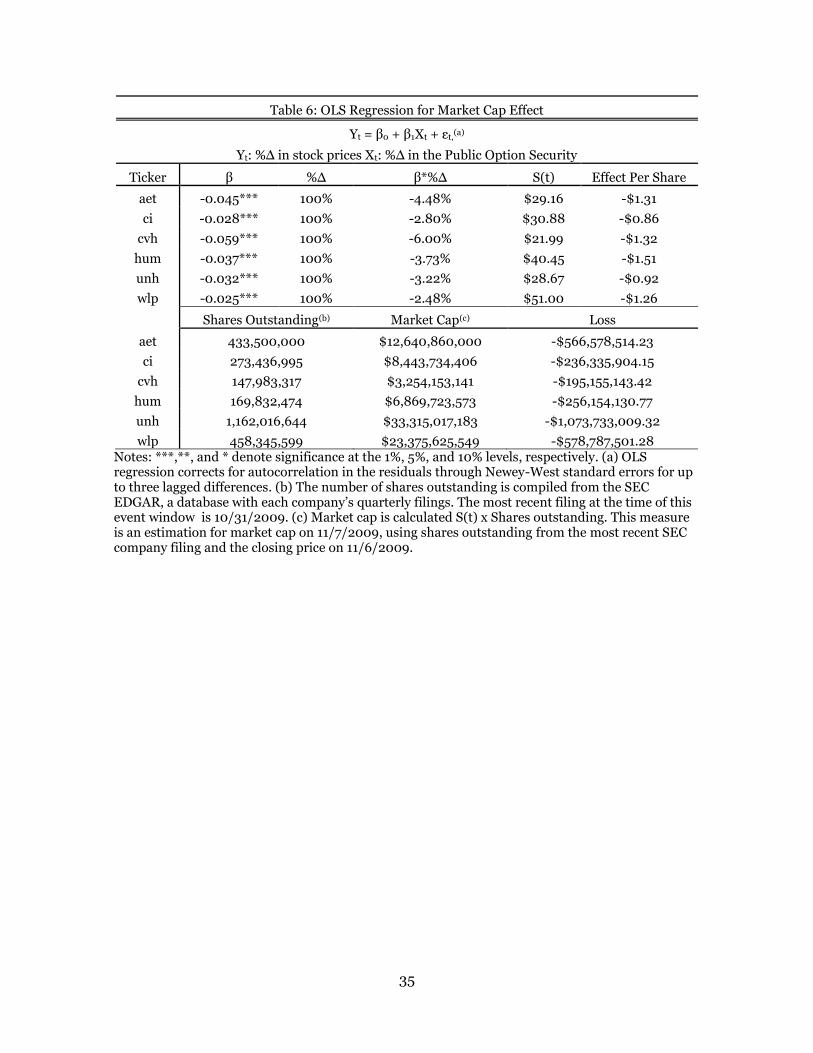
The results of the model are reported in Table 6. The first column displays the parameter
estimates for each company. Each of these estimates is negative and statistically significant at
the 1% level. Coventry has the largest estimate at β1 = -0.59, while WellPoint, Inc. has the
smallest, β1 = -0.025. The size of a company‘s parameter estimate corresponds to the size of the
correlation coefficient. Coventry reacted most strongly to news concerning the probability of a
public option, and thus has the largest parameter estimate. These results suggest that managed
care firms would lose if a public option was included in health care reform. For example, the
parameter for Aetna is -0.045, which suggests that if the probability for a public option
increased ten percent, its stock was expected to decrease by $0.13. Similarly, Cigna would
decrease $0.09 per share, Coventry $0.13 per share, Humana $0.15 per share, UnitedHealth
$0.09 per share, and WellPoint $0.12.
However, the effect of a public option is best understood in comparing how the valuation
of a managed care firm would respond to a public option. Market capitalization, or market cap
for short, is the measurement of the size of a business equal to the number of shares outstanding
multiplied by the share price. The most basic way to think about market cap is as a snapshot of
the value of a company. Businesses are divided into three separate categories depending on their
22
size: small-cap, mid-cap, and large-cap. There is no official delineation between these three
groups, but the general cut offs are $1-5 billion for small-cap, $5-10 billion for mid-cap, and
greater than $10 billion for large-cap.
The market cap effect is calculated through the following process. The parameter
estimated in the model above is an estimate of how stock prices change for a given change in the
probability of Congress adopting a public option. Therefore, if this parameter is multiplied by a
probability change of one hundred percent (the public option is adopted) multiplied by the share
price, this gives the total dollar effect per share. The total dollar effect per share is then
multiplied by the total number of shares outstanding to generate the expected dollar effect.21
The expected market cap losses are as follows: Aetna -$566,578,514.23, Cigna -$236,335,904,
Coventry -$195,155,143, Humana -$256,154,130, and WellPoint, Inc. -$578,787,501.
UnitedHealth, Inc., the largest private insurer, was expected to lose $1,073,733,009.
These market cap estimates are convincing evidence to the expected effect of a public
option on managed care firms. Relative to the overall market caps for these companies, the
expected losses might seem small (3-6%). However, consider the $1 billion expected loss to
UnitedHealth. This is the equivalent of losing an entire small-cap company . These expected
losses are also permanent losses to market capitalization, and in no scenario is losing $1 billion a
good thing for business. Therefore, a public option is expected to significantly and negatively
affect the valuation of a private insurer.
Essential to this analysis is the distinction between expectation and what would actually
happen. In no way are these estimates meant to be understood as dollar forecasts for exact
market cap losses to these managed care firms. Rather, the effect on market cap is a look into
how financial markets responded news and information of a public option. These estimates
suggest that investors believed a public option would decrease the valuation of private
21 The share price is the closing price on 11/6/2009, the day before the House approved the AHCAA. The total number of shares outstanding is retrieved from the SEC EDGAR database for annual and quarterly company filings.
23
insurers.22 However, despite the substantial market cap loss, investors were not discounting as
strongly as qualitative political analysis. Republicans feared that a public option would drive
managed care firms completely out of business. Democrats, on the other hand, hoped that a
government plan would save health care. Neither scenario is greatly reflected in the stock price
movements for managed care firms conditional on the probability of a public option. Rather,
these firms were expected to lose, but still believed to be functional companies with growth
potential in a future health care industry that included a government-run program.
F. CONCLUSION
Econometricians are concerned with generating unbiased estimates in their research,
and thus, an investigation into potential short fallings is necessary to support the findings in this
paper. First, several blog reports suspected that the ObamaCare Contract price was manipulated
in the week prior leading up to its passage through Congress. Second, the nuances of the time
series analysis for the Public Option Contract must be addressed, specifically the direction of
causality and biases which might attenuate the parameter estimates.
Intrade CEO John Delaney responded to blogger questions on March 10 in regards to
trading activity in the ObamaCare Contract market. Delaney responded to a particular question
about demographics, saying, ―it is a reasonably active market but atypically a lot of the trade is
coming from the DC area.‖ The political blogosphere began discussing the possibility that this
prediction market was unfairly influenced by political interests, and in no way reflected the
underlying probability of successful health care reform.
The supposed narrative, as best articulated in an article by Business Insider, is that
Washington interest groups were trying to manipulate this prediction market for political gains. 22 Wolfers and Zitzewitz (2008) followed up their paper ―What do Financial Markets Think of Iraq?‖ to analyze how pre-war estimates differed from how markets actually responded post-invasion. The pre-war estimates held that oil would increase at $10/barrel. However, oil actually fell by $7/barrel as U.S. troops entered Baghdad. At face value, it is easy to claim that the economists were wrong and Intrade securities cannot help to predict what will happen. However, it is important to understand that the $10/barrel estimate suggested that investors were really worried about war in Iraq, and the $7/barrel drop is explained by a less severe war than expected. The pre-war discount reversed itself as war turned out more moderate.
24
First, there was a claim that proponents of the PPACA were manufacturing momentum in favor
of reform in the weeks leading up to March 23. Subsequent reports then argued that in fact the
opposite was true, that opponents were messing with contract prices to spread the belief that
health reform would not be successful, hoping in particular that this news would reach key
swing-vote Senators.23 On March 17, the ObamaCare Contract closed 50% below the previous
closing price, and bloggers hold this observation as the best evidence for market manipulation.
First, it must be said that market manipulation in the ObamaCare Contract has never
been substantiated, and definitely cannot be proven from John Delaney‘s comments alone. He
simply said more people from D.C. were trading the ObamaCare Contract than those living in
other urban areas. This makes sense. Individuals working in Washington are closest to the
reform effort, and would have information to trade on that to others might not have access.
Furthermore, if the market manipulation argument is true, then the probability drop on March
17 actually supports the EMH rather than suggest prediction markets are biased, illiquid, and
poor measures of probability.
The price closed at 35.1 ($3.51) on March 17. A few investors shorted the ObamaCare
Contract so it would fall artificially low levels, in hopes that people would look to Intrade and see
that the (manipulated) expectation for reform was not promising. However, other traders
involved in this market saw the low closing price and recognized that the prediction market was
trading well below the underlying probability, and saw an opportunity to make money. The
profit incentive for the vast majority of other investors quickly drove the price back up as soon
as the market opened the next day. The ObamaCare Contract immediately traded at 66.6
($6.66), reversing 45% of the previous day‘s decline. Exactly as the EMH stipulates, individuals
reacted to news quickly, and the contract price adjusted to reflect this information. As Hanson,
et. al (2006) argued, the thick trading volume of the ObamaCare Contract prevented
23 See http://www.businessinsider.com/are-washington-dc-insider-manipulating-intrade-to-manufacture-momentum-for-healthcare-reform-2010-3 and http://www.businessinsider.com/are-insiders-launching-a-healthcare-counterattack-on-intrade-2010-3 for the full story of market manipulation in the ObamaCare Contract.
25
manipulation from seriously hampering the information-aggregating power of the prediction
market beyond the time between the closing and opening of the market.
Steven Levitt, author of Freakonomics, said, ―regression analysis is more art than
science.‖ Rather than discounting the scientific rigor of econometrics, Levitt is suggesting that as
much qualitative understanding of events is needed as statistical analysis. For example, in
regressing the Public Option Contract on managed care stocks, the direction of causality is
assumed to be from news about the public option to stock prices, as scaled by the prediction
market. The estimated effects indicate that managed care firms were expected to lose significant
market cap should a public option have found its way into the final reform bill. However, is it
possible that financial markets affected the probability of a public option? This would suggest a
reverse causality, which would bias the estimates and discredit the conclusions. The argument is
that as the economy failed to recover in 2009, health care reform became less and less popular,
and as a result, the most unpopular measures were removed from the bill as a compromise to
ensure that legislation was passed through Congress.
However, this argument is not particularly compelling. For one, criticism of Obama and
the Democrats in Congress for focusing on health care rather than the economy has come largely
ex post facto, particularly with the emergence of the Tea Party movement in the 2010 mid-term
elections. Furthermore, the public option has always been a contested issue. Currently, there are
two bills on the Congress floor which would amend a public option to existing legislation, and
yet no congressman will go near these bills. This unpopularity is reflected in the Public Option
Contract price. The contract never traded above 50 ($5.00), and therefore, it can be assumed
that investors considered the adoption of a public option to be unlikely from the beginning.
Lastly, the claim that unpopular measures were cut from reform as compromise is misleading,
as the individual mandate, the lightning rod for most controversy, was in fact legislated. As a
consequence, reverse causality is not assumed to be an issue with the Public Option Contract,
26
and the results are unbiased and compelling evidence for the negative effect of a government-
run program on managed care firms.
In conclusion, prediction markets support the efficient market hypothesis. Unit root
tests suggest that these betting exchanges incorporate news and other information, accurately
reflecting investor belief and opinion into contract prices to offer a probability for an uncertain
future event. Further empirical testing indicates that these contracts process new information
rather quickly, eliminating the potential for investors to earn profit by forecasting predictable
prices changes. However, manipulation is prevented most strongly in prediction markets with
larger trading volumes, as is the case with the ObamaCare Contract. Purported, although
unconfirmed, manipulation was reversed between the close and open of the prediction market,
thus suggesting that the EMH does in fact apply to Intrade securities.
Furthermore, in exploiting the ObamaCare Contract, evidence suggests that hospitals,
private insurers, and brand drug companies benefited from reform, while health services,
medical distributors, and generic drug companies did not. Furthermore, managed care firms
were expected to lose a significant portion of their market capitalization conditional on the
probability that a public option was adopted by Congress. These findings are drawn from
isolating stock price movements for health care companies through correlation tests against
prediction market probabilities for reform. The findings are most statistically significant in
markets that have a trading volume over 10,000 overall trades. If the prediction market has a
volume less than 10,000, the information-aggregating power is decreased relative to other
financial markets.
Lastly, prediction markets have an important in event studies for financial economics,
and the findings in this paper only increase their functionality in economic research. Prediction
markets will continue to grow in size and popularity, which will offer new opportunities to

27
explore important social questions.24 In the coming year, expect for economists to utilize Intrade
securities in looking at issues in the following areas: oil prices and turmoil in the Middle East
(Egypt and Libya, specifically), the forecasting power of political election markets for the
Republican nomination, and how the stock market responds to the probability of Obama‘s re-
election over a Republican candidate. Each of these questions poses serious political and social
implications, and hopefully future studies will continue to offer insight into the interesting ways
in which our world works.
24 Intrade prediction markets for the U.S. presidential election have seen the significant growth in trading volume since 2000. The 2008 election had the most overall trades for a prediction market hosted on Intrade, generating over $25 million in contracts.

28
References
Al-Ississ, Mohamad, and Nolan Miller. "What Does Health Reform Mean for the Healthcare Industry? Evidence from the Massachusetts Special Senate Election." NBER Working Paper. July 2010. Web. < http://www.nber.org/papers/w16193>.
Arrow, Forsythe, Gorham, Hahn, and Hanson, Ledyard, Levmore, Litan, Milgrom, Nelson,
Neumann, Ottaviani, Schelling, Shiller, Smith, Snowberg, Sunstein, Tetlock, Tetlock, Varian, Wolfers and Zitzewitz. "The Promise of Prediction Markets." Science 320, 2008, 877.
Burton Malkiel, ―The Efficient Market Hypothesis and its Critics.‖ Journal of Economic
Perspectives, 17(1), 2003, 59-82. Elliot, Graham, Thomas Rothenberg, and James Stock. ―Efficient Tests for an Autoregressive
Unite Root.‖ Econometrica. 65(4), 1996, 813-836. Fama, Eugene. "Efficient Capital Markets: A Review of Theory and Empirical Work." Journal of
Finance 25(2), 1970, 383-417. Hanson, Robin, Ryan Oprea, and David Porter. ―Information Aggregation and Manipulation in
an Experimental Market.‖ Journal of Economic Behavior and Organization. 60(4), 2006, 448-459.
Leigh, Andrew, Justin Wolfers, and Eric Zitzewitz. "What Do Financial Markets Thing of War in
Iraq." NBER Working Paper. Mar. 2003. Web. <http://www.nber.org/papers/w9587>. MacKinlay, Craig. "Event Studies in Economics and Finance." Journal of Economic Literature
35.1, 1997, 13-39. Newey, Whitney and Kenneth West. ―A Simple, Positive Semi-definite, Heteroskedasticity and
Autocorrelation Consistent Covariance Matrix.‖ Econometrica 55(3), 1987, 703-708. Snowberg, Erik, Justin Wolfers, and Eric Zitzewitz. "How Prediction Markets Can Save Event
Studies." Perspectives on Politics, 2008. Urmee, Khan, and Robert Leili. "Information Processing in Prediction Markets: An Empirical
Investigation." University of Texas - Austin, Nov. 2010. Web. <https://webspace.utexas.edu/uk237/www/files/PredictionMarkets.pdf>.
Wolfers, Justin, and Eric Zitzewitz. "Prediction Markets." Journal of Economic Perspectives
18(2), 2004. Wolfers, Justin, and Eric Zitzewitz. "Using Markets to Inform Policy: The Case of the Iraq War."
Economica 76(302), 2009, 225-50. Wolfers, Justin. "Five Open Questions About Prediction Markets." Information Markets: A New
Way of Making Decisions in the Public and Private Sector. Washington D.C.: AEI-Brookings, 2006.
29
Appendix
Probability of Health Care Reform
20
30
40
50
60
70
80
90
100
DATE
16JAN2010 01FEB2010 16FEB2010 01MAR2010 16MAR2010 01APR2010
Figure 1 - ObamaCare Contract
Probability of Public Option
0
10
20
30
40
50
DATE
01JUN2009 01JUL2009 01AUG2009 01SEP2009 01OCT2009 01NOV2009 01DEC2009 01JAN2010
Figure 2 - Public Option Contract

30
Table 1: Tests for Pricing Efficiency in Prediction Markets
ObamaCare Contract
Public Option Contract
Panel A: ADF and PP Tests for Unit Root
Test Statistic (t-stat) Null Hypothesis: Series is a Random Walk
ADF Test -1.522* -0.464
p-value (p=0.0666) (p=0.3216)
PP Test -0.883 0.274
p-value (p=0.7934) (p=0.9761)
Reject Null Hypothesis? No No
Panel B: KPSS Tests for Trend Stationarity
Test Statistic (t-stat) Null Hypothesis: Series has a Stationary Trend
Lag 0 0.615*** 3.35***
Lag 1 0.425*** 1.79***
Lag 2 0.353*** 1.24***
Lag 3 0.304*** 0.956***
1% Critical Value -0.216 -0.216
Reject Null Hypothesis? Yes Yes
Panel C: Bid-Ask Bounce and Short-Run Pricing Errors
Δ(t-1)
-0.3395*** -0.3003***
-0.1387 -0.0981
Δ(t-2)
-0.1237 -0.0694
-0.1482 -0.1028
Δ(t-3)
0.1398 -0.0678
-0.1507 -0.1076
Notes: ***,**, and * denote significance at the 1%, 5%, and 10% levels, respectively (Standard errors in parentheses). Samples reflect the 52 days (ObamaCare) and 141 days (Public Option) for which equity data is matched to the previous trade of the Intrade securities.
31
Table 2: Companies and Their Sub-Industry Designation
Distributors Pharmaceuticals - Brand
mck McKesson Corp. bmy Bristol-Myers Squibb
pdco Patterson Cos, Inc. gsk GlaxoSmithKline
Facilities jnj Johnson & Johnson
amsg Amsurg Corp. kg King Pharmaceuticals
cyh Community Health Systems lly Lilly, Eli & Co.
dyii Dynaq Healthcare, Inc. mrk Merck & Co. Inc.
hls Healthsouth Corp. mrx Medicis Pharmaceutical
hma Health Management Assocs Inc. myl Mylan, Inc.
knd Kindred Healthcare, Inc. nktr Nektar Therapeutics
lpnt Lifepoint Hospitals nvs Novartis
mdth MedCath Corporation pfe Pfizer, Inc.
thc Tenet Healthcare sny Sanofy-Aventis
Services teva Teva Pharmaceuticals
amed Amedisys Inc. vphm VrioPharma, Inc.
che Chemed Corp. wpi Watson Pharmaceuticals
chsi Catalyst Health Solutions Inc. Pharmaceuticals - Generic
dgx Quest Diagnostics agn Allergan Inc.
lncr Lincare Holdings, Inc. amgn Amgen, Inc.
algn Align Technology, Inc. auxl Auxilium Pharmaceuticals Inc.
blud Immucor, Inc. bayn Bayer Inc.
coo Cooper Companies, Inc. biib Biogen Idec, Inc.
hae Haemonetics Corp. cov Covidien plc
Managed Care gnvc GenVec, Inc.
aet Aetna Inc. gorx GeoPharma, Inc.
ci Cigna Corp. lgzay Ligand Pharmaceuticals, Inc.
cvh Coventry Health Care, Inc. prgo Perrigo Co.
hum Humana, Inc. prwp Pro-Pharmaceuticals
unh Unitedhealth Group, Inc. prx Par Pharaceutical Cos.
wlp WellPoint, Inc. rhhby Roche Holdings LTD.
32
Table 3: Do Health Care Stocks Follow A Random Walk?
Ticker
ADF Test for lnS(t) PP Test for lnS(t) DF-GLS Test
p-value t-stat
Distributors mck 0.1947 0.8064 -2.014
pdco 0.177 0.884 -1.333
Facilities
amsg 0.2024 0.7328 -0.861
cyh 0.2688 0.8725 -1.009
dyii 0.0001*** 0.0013** -0.990
hls 0.0561* 0.3347 -1.634
hma 0.5807 0.9825 -2.534
knd 0.1118 0.5648 -2.221
lpnt 0.8328 0.9977 -0.767
mdth 0.1089 0.5585 -2.216
thc 0.1126 0.612 -1.946
Services
amed 0.0392** 0.3455 -1.700
che 0.1638 0.7523 -1.333
chsi 0.6795 0.954 -0.519
dgx 0.0004*** 0.0052*** -1.436
lncr 0.18 0.7663 -1.489
algn 0.1267 0.6485 -2.467
blud 0.8064 0.987 -0.9962
coo 0.2486 0.8567 -2.134
hae 0.0156*** 0.2123 -0.591
Managed Care
aet 0.6203 0.977 -0.422
ci 0.0370** 0.3303 -0.545
cvh 0.2525 0.8685 -1.025
hum 0.0014** 0.0229** -1.233
unh 0.0003*** 0.0038*** -2.317
wlp 0.0348** 0.3392 -1.176
Pharmaceuticals - Brand
bmy 0.5821 0.9799 -1.113
gsk 0.0037*** 0.0543* -0.734
jnj 0.1221 0.7383 -1.758
kg 0.0369** 0.3042 -1.179
lly 0.1442 0.7937 -0.540
mrk 0.0021*** .0284** -1.382
mrx 0.4626 0.9366 -1.096
myl 0.5439 0.9715 -1.612
nktr 0.4167 0.9404 -1.404
nvs 0.0080*** 0.1189 -3.026*
pfe 0.0176** 0.1943 -1.899
sny 0.0289*** 0.2939 -1.376
teva 0.4873 0.9779 -1.323
vphm 0.5578 0.9619 -1.089
wpi 0.1509 0.7719 -1.057
Pharmaceuticals - Generics
agn 0.5257 0.9772 -1.612
amgn 0.1739 0.5715 -1.878
auxl 0.0260** 0.3353 -1.670
bayn 0.0518* 0.3831 -1.557
biib 0.2832 0.9168 -1.382
cov 0.0058*** 0.0821* -1.175
gnvc 0.1593 0.6525 -1.771
gorx 0.0073*** 0.1233 -1.190
lgzay 0.2086 0.848 -1.049
prgo 0.3732 0.9206 -2.358
prwp 0.0175** 0.2168 -1.216
prx 0.0017*** 0.0301** -1.891
rhhby 0.0019*** 0.0324** -0.339

33
Table 4: Correlation Tests between ObamaCare Contract and Health Care Stocks
Ticker ρ(S(t), Intrade) ρ(adj.S(t), Intrade)
Distributors mck -0.0745* -0.1632**
pdco -0.1008* -0.2630**
Facilities
amsg 0.2630** 0.1810**
cyh 0.1864** 0.1686**
dyii 0.4244*** 0.3949***
hls 0.1181* 0.0918*
hma 0.2514** 0.2392**
knd 0.1129* 0.0859
lpnt 0.1898** 0.1684**
mdth 0.2796** 0.2605**
thc 0.2105** 0.1812**
Services
amed -0.0304 -0.0951
che -0.1705** -0.2319**
chsi -0.1218* -0.2239**
dgx -0.0164 -0.146*
lncr -0.0517 -0.1289*
algn -0.0854 -0.1339*
blud 0.0505 -0.1505*
coo 0.0107 -0.0459
hae -0.1954** -0.2217**
Managed Care
aet 0.2471** 0.2098**
ci 0.2451** 0.2198**
cvh 0.3145** 0.3248**
hum 0.1604** 0.1194**
unh 0.1807** 0.1293**
wlp 0.2131** 0.1422**
Pharmaceuticals - Brand
bmy 0.0051 -0.1046
gsk 0.3012** 0.2279**
jnj 0.2427** 0.0958*
kg 0.1842** 0.1814**
lly 0.1488* 0.0598**
mrk 0.2362** 0.2558**
mrx 0.189** 0.1557**
myl 0.1344* 0.0732
nktr 0.2595** 0.2568**
nvs 0.0627 -0.0562
pfe 0.1997** 0.1605**
sny 0.0961 0.0247
teva 0.3971** 0.2734**
vphm 0.1628** 0.1413*
wpi 0.0776 -0.01
Pharmaceuticals - Generics
agn -0.1621** -0.2530**
amgn 0.0508 -0.0471
auxl -0.1174* -0.1469*
bayn -0.2869** -0.3145**
biib -0.0238 -0.1283*
cov -0.122* -0.1889**
gnvc -0.1331* -0.1443*
gorx -0.2029** -0.2228**
lgzay -0.0443 -0.1205*
prgo -0.0117 -0.0538
prwp -0.026 -0.3084**
prx -0.3058** -0.2377**
rhhby -0.033 -0.1133*
34
Table 5: Correlation Tests based on Trading Volume
Ticker
Public Option, Dec 2009 ObamaCare, Mar 2010
n=25,727 n=11,507
ρ(S(t),
Intrade) ρ(adj.S(t), Intrade)
ρ(S(t), Intrade)
ρ(adj.S(t), Intrade)
Managed Care
aet -0.3368*** -0.3869*** 0.2471** 0.2098**
ci -0.1806*** -0.2335*** 0.2451** 0.2198**
cvh -0.4014*** -0.4576*** 0.3145** 0.3248**
hum -0.2814*** -0.3430*** 0.1604** 0.1194**
unh -0.2665*** -0.3190*** 0.1807** 0.1293**
wlp -0.2180*** -0.2804*** 0.2131** 0.1422**
Public Option, Mar 2010 Public Option, Jun 2010
n=440 n=1017
ρ(S(t),
Intrade) ρ(adj.S(t), Intrade)
ρ(S(t), Intrade)
ρ(adj.S(t), Intrade)
Managed Care
aet 0.0264 0.0121 0.0639 0.0759
ci -0.0552 -0.1098 0.0694 0.07224
cvh -0.0476 -0.0367 0.0714 0.0851
hum 0.0508 -0.0355 0.2011 0.2227
unh -0.0525 -0.0161 0.0821 0.0808
wlp -0.0618 -0.0195 0.0956 0.067
Notes: ***,**, and * denote significance at the 1%, 5%, and 10% levels, respectively
35
Table 6: OLS Regression for Market Cap Effect
Yt = β0 + β1Xt + εt,(a)
Yt: %Δ in stock prices Xt: %∆ in the Public Option Security
Ticker β %∆ β*%∆ S(t) Effect Per Share
aet -0.045*** 100% -4.48% $29.16 -$1.31
ci -0.028*** 100% -2.80% $30.88 -$0.86
cvh -0.059*** 100% -6.00% $21.99 -$1.32
hum -0.037*** 100% -3.73% $40.45 -$1.51
unh -0.032*** 100% -3.22% $28.67 -$0.92
wlp -0.025*** 100% -2.48% $51.00 -$1.26
Shares Outstanding(b) Market Cap(c) Loss
aet 433,500,000 $12,640,860,000 -$566,578,514.23
ci 273,436,995 $8,443,734,406 -$236,335,904.15
cvh 147,983,317 $3,254,153,141 -$195,155,143.42
hum 169,832,474 $6,869,723,573 -$256,154,130.77
unh 1,162,016,644 $33,315,017,183 -$1,073,733,009.32
wlp 458,345,599 $23,375,625,549 -$578,787,501.28 Notes: ***,**, and * denote significance at the 1%, 5%, and 10% levels, respectively. (a) OLS
regression corrects for autocorrelation in the residuals through Newey-West standard errors for up to three lagged differences. (b) The number of shares outstanding is compiled from the SEC EDGAR, a database with each company‘s quarterly filings. The most recent filing at the time of this event window is 10/31/2009. (c) Market cap is calculated S(t) x Shares outstanding. This measure is an estimation for market cap on 11/7/2009, using shares outstanding from the most recent SEC company filing and the closing price on 11/6/2009.
Top Related