


Languages
Pages
Legal


STlESAISTATlSER.MlS2
DEPARTMENT Of INTERNATIONAL ECONOMIC AND SOCIAL AFFAIRS
STATISTICAL OFFICE
STATISTICAL PAPERS Series M Na 82
METHODS USED IN COMPILING THE UNITED NATIONS PRICE INDEXES FOR EXTERNAL TRADE
UNITED NATIONS New York, 1987
i

NOTE
Symbols of United Nations documents are composed of capital letters combined with fmres. Mention of such a symbol indicates a reference to a United Nations document.
GENERAL DISCLAIMER
(a) The designations employed and the presentation of material in this publication do not imply the expression of any opinion whatsoever on the part of the Secretariat of the United Nations concerning the legal status of any country, territory, city or area or of its authorities, or concerning the delimitation of its frontiers or boundaries.
(b) In some tables, the designation “developed” and ‘6developing** economies is intended for statistical convenience and does not necessarily express a judgement about the stage reached by a particular country or area in the development process.
ST/ESA/STAT/SER.M/82
UNITED NATIONS PUBLICATION
Sales No. E.87.XVII.4
01350

CONTENTS
Chapter Paragraphs Page
I.
II.
III.
IV.
v.
VI.
Part One. DESCRIPTION OF THE INDEXES
INTRODUCTION . . . . . . . . . . . . . . . . . . . . . . . . . . . . . . . . . . . . . . . . . . . . . .
BROAD PRINCIPLES FOLLOWED IN CONSTRUCTING THE INDEXES . . . . .
METHODS OF COMPUTATION . . . . . . . . . . . . . . . . . . . . . . . . . . . . . . . . . . . .
A. Individual commodity indexes . . . . . . . . . . . . . . . . . . . . . . . . . .
B. Scope of individual indexes . . . . . . . . . . . . . . . . . . . . . . . . . . .
c. Aggregate indexes . . . . . . . . . . . . . . . . . . . . . . . . . . . . . . . . . . . . .
D. Analysis of price indexes by economic regions . . . . . . . . .
COMPARISON BETWEEN PRESENT AND PREVIOUS WEIGHTING PATTERN .
COMMODITY COMPOSITION OF THE INDEXES AND THEIR SUB-INDEXES
INDIVIDUAL COMMODITY DESCRIPTIONS AND COMMODITY WEIGHTS . . .
l-4
5 - 12
13 - 23
13 - 18
19 - 20
21- 22
23
24 - 26
27
28
Part Two. PRICE MOVEMENTS OF BASIC COMMODITIES AND NON-FERROUS BASE METALS IN INTERNATIONAL TRADE: 1950-1984
HISTORICAL SERIES ..................................................... . .
Primary commodities ...................................................
Food ..............................................................
Cereals .......................................................
Wheat ..................................................... Maize ..................................................... Rice ...................................................... Barley .................................................... Oats ......................................................
Beverage crops ................................................
Coffee .................................................... Tea ....................................................... Cocoa .....................................................
Vegetables ....................................................
Tomatoes .................................................. Onions .................................................... Potatoes ... ............................................... Cassava ................................................... Beans ..................................................... Peas ......................................................
2
3
5
5
6
6
7
8
9
16
26
27
28
29
30 31 32 33 34
35
36 37 38
39
39 40 40 41 41 42
-iii-

CONTENTS (&ntinued)
Meats .........................................................
Beef .................. . ................................... Pork ............ ..*....;o~...............................~ . Bacon ..................................................... Lamb ................ ..r; .................................. Poultry . *~~.~*~~~;..~~...i~~.~~..~~~~~.* ..................
Dairy products ............... ..i; .............................
.. Butter .................................................... Milk ...................................................... Cheese .................................................... Eggs ......................................................
Fruits ........................................................
Citrus fruits ...................................................
Oranges ................................................... Lemons .................................................... Grapefruits ........... ;.***..* ............................
Other fruits ..................................................
Bananas ................................................... Apples ....................................................
Animal feed ...................................................
Fishmeal .................................................. Oilseed cake .... ..f .......................................
Fish ..........................................................
Pepper .........................................................
Wine ..........................................................
Sugar .........................................................
Agricultural non-food .............................................
. .
Fats, oils and oilseeds .......................................
Soyabeans ................................................. Copra ..................................................... Groundnuts ................................................ Soyabean oil .............................................. Olive oil ................................................. Palm oil .................................................. Groundnut oil ............................................. Coconut oil ............................................... Linseed6 .................................................. Cottonseed oil ............................................ Linseed oil ....... . ....... ..i..i .......................... Palm kernel oil ........................................... Sunflower oil ............................................. Animal fats ...............................................
-iv-
Page
43
44 45 46 47 48
49
50 51 52 53
54
55
56 57 58
59
60 61
62
63 64
65
66
67
68
69
70
71 72 73 74 75 76 77 78 79 80
81 82 83 84

CONTENTS (continued)
I.
II.
III.
Textile fibres ................................................
Cotton .................................................... Wool ...................................................... Sisal ........ ..t .......................................... Jute ....................................................... Flax ......................................................
Forest products ...............................................
Logs ...................................................... Lumber .................................................... Woodpulp ..................................................
Page
85
86 87 88 89 90
91
92 93 94
Natural rubber . . . . . . . . . . . . . . . . . . . . . . . . . . . . . . . . . . . . . . . . . . . . . . . . ' 95
Tobacco .......................................................
Hides .........................................................
Minerals ..........................................................
Fuels .........................................................
Crude petroleum ........................................... Coal ...................................................... Natural gas ...............................................
Iron ore ......................................................
Manganese ore .................................................
Chrome ore ....................................................
Crude fertiliser ..............................................
Primary commodities excluding crude petroleum .....................
Non-ferrous base metals ...........................................
Copper ........................................................
Nickel 'I r
........................................................
Aluminium ..................................................... Lead ..... .....................................................
zinc ..........................................................
Tin ...........................................................
Annexes
COMMODITIES NOT INCLUDED IN THE PRICE INDEXES OF PRIMARY COblMODITIES . . .
SOUR& OF
COMP&I SON
DATA FOR TUE INDEXES -' . . . . . . . . . . . . . . . . . . . . . . . . . . . . . . . . . . . . . . .
OF PiUCES OF WHEAT, RICE AND TIN: 1970-1980 . . . . . . . . . . . . . . .
96
97
98
99
100 101 102
103
104
105
106
107
108
109
110
111
112
113
114
115
118
119

Abbreviations and symbols used in the presentation
. . .
API
c.i.f. . f.o.b.
f.i.r.
f.a.s.
RSS
c.658Fe
TPL
-15-
Data not available
American Petroleum Institute
Costs, insurance and freight
Free on board
Free on rail
Free alongside ship
Ribbed smoked sheets
Content of 65% iron
Tricalcium phosphate lime
London Metal Exchange
A short dash on each side of an index number, e.g., -93-, indicates a link with an earlier series and the year when the linkage was effected.
Acknowledgement
The Statistical Office wishes to convey its thanks to the government departments and other agencies, both public and private, which have generously contributed statistical data and other information needed in the compilation of the index number series herein described.
-vi-
Part One
DESCRIPTION OF THE INDEXES
-l-

INTRODUCTION
1. The Statistical Office of the United Nations Secretariat compiles, inter alia, the following indexes relatinq to movements of export prices of commodities enterinq into international trade. They are:
(a) Primary commodities - price index;
(b) Non-ferrous base metals - price index;
(c) Export price index of machinery and transport equipment for selected countries;
(d) Manufactured goods exports - unit value index;
fe) World trade of market economies - unit value index.
The first index shows the price movement of primary commodities, comprisinq raw food and raw materials; the second index refers to an important class of intermediate goods, the non-ferrous base metals; the third and fourth indexes treat of final products and the fifth addresses the entire trade of the world market. economy.
2. The present publication, which is being issued in two volumes, describes the methods used in the compilation of the indexes. Volume I supersedes an earlier publication entitled Methods Used in Compiling the United Nations Price Indexes for Basic Commodities in International Trade, published in 1979, and presents the methodology in respect of the first two named of the indexes. In addition, it lists the individual price series which enter into the computation of the indexes. Shifts in importance of the trade in particular commodities are shown in table 1, which lists the weiqhtinq patterns for the base years 1953, 1959, 1963, 1970, 1975 and 1980.
3. Within,the primary commodities index , sub-indexes are calculated for commodity qroups and commodity classes. Annual indexes, beginning in 1950, and quarterly indexes beginning in 1954, calculated for each commodity group and each commodity class where available, are shown in part two. The series is kept up to date, and current data appear in the Monthly Bulletin of Statistics.
4. Volume II which is in preparation, describes the methodology in respect of the other indexes named.
-2-

I. BROAD PRINCIPLES FOLLOWED IN CONSTRUCTING THE INDEXES
5. Each price index is intended to represent world price movements in international trade of all the commodities to which its title refers.
6. It is the purpose of each index to measure in the aggregate the price chanqes of goods actually moving in world trade by reflectinq, in addition to the effects of ordinary commercial transactions, the effects of such diverse factors as international commodity agreements, national monetary policies as to the convertibility of currencies , government control of trade etc. To this end, the indexes represent as far as possible , chanqes in actual transaction prices of commodities traded internationally. Prior to 1956, weighting was based on the pattern of world trade in 1953; beginning in 1956, the 1959 pattern of trade was used; beginning in 1961, that of 1963; beginning in 1967, that of 1970; beginninq in 1970, that of 1975; z/ and beginning in 1977, that of 1980. The index series are linked at 1956, 1961, 1967, 1970 and 1977 and adjusted for nublication so that 1980 = 100. It is the hope of the Statistical Office to continue reweiqhting the indexes about every five years or when sharp fluctuations in price make it necessary. Historical series of indexes appear in part two of the present report.
7. The term "primary commodities" , as indicated in table 1, is defined to include all the commodities listed in the table. This is based on the Standard International Trade Classification (SITC). 3/ In general, the term "primary commodities" comprises goods listed in sectTons 0 to 4 of the SITC, with the exception of manufactured goods found in sections 0 and 1, as well as the synthetic fibres, synthetic rubber, waste and scrap of primary commodities in section 2; and petroleum products classified in section 3. Commodities not included in the computation of the price indexes of primary commodities are listed in annex I.
8. The metals included in the index for non-ferrous base metals are: aluminium, copper, lead, nickel, tin and zinc (SITC, Rev.2, 682-687 inclusive). The non-ferrous base metals not included in the index accounted, in 1980, for 11 per cent of the value of total exports of all non-ferrous base metals.
9. The indexes for primary commodities and non-ferrous base metals and their sub-indexes are weighted averages of price indexes of individual commodities, each of which is based on specific price quotations for representative grades of that commodity in countries that are major traders of the commodity.
10. All indexes are calculated in terms of United States dollars.
11. A large proportion of the price data used in the computation is obtained directly from national Governments or from their national statistical publications. In addition, the Food and Aqriculture Organization of the United Nations, other specialized agencies and international commodity study qroups and councils are sources of commodity price data for the series. The sources of data for the indexes are listed in annex II. As additional or better price data become available, the indexes will be revised to include them, but it is anticipated that such changes will have a minor effect on the indexes and sub-indexes shown in the Monthly Bulletin of Statistics.
-3-

12. The price series chosen for inclusion into the calculation of the, commodity indexes are those that are most readily available, as well as those. t%t are most representative ofthe commodities. Price series which are representative, but available only at sporadic Intervals, are excluded since their use would only create problems of untimeliness. Unit values of imports and exports are utilized only in instances where there are no available market prices, as in the case of the commodity “fish”.
-4-

II. METHODS OF COMPUTATION
A. Individual commodity indexes
1. Prices
13. Indexes are computed for each of the 66 primary commodities and for each of the six non-ferrous metals,shown in table 1. In an export price index, the ideal price series to use are f.o.b. export prices, but in many instances, such series are not as readily available as c.i.f. import prices or wholesale market prices in either the producing or consuming country.
14. The export price index of primary commodities, as well as the index of non-ferrous base metals, are computed using various categories such as export price f.o.b., import price c.i.f., wholesale prices, commodity exchange prices and, in some instances, producer’s prices as well as auction prices. Although this may be the case, the resulting index is not affected in terms of its validity as well as its reliability since in a free market economy, the price movement for a siven commodity, whether it be export price f.o.b., import price c.i.f. or otherwise, generally follows the same trend. For example, in the case of the commodity wheat, the movement in the “wholesale price in Kansas City for No. 2 hard/dark winter wheat” is virtually the same as the “export price of Canadian Western Red Spring Wheat No. 1 13.5 per cent in store, Thunder Bay”. Similarly, the “wholesale price of milled rice, medium grain No. 2, U.S.A.” follows the same trend as the “price for white rice, 5 per cent broken, f.o.b. Bangkok”; in respect of tin metal, the “ex-works price in Penang, Malaysia”, is virtually equal to the London Metal Exchange price for “tin metal, prompt, standard grade”. These data are shown in annex III, wherein a comparison of series of prices in respect of these commodities is represented in tabular and graphic form. In addition to the illustrative examples, many of the import prices used are land frontier prices. In such cases, the import prices at the frontier have the same movement’as the export prices applicable on the other side of the barrier.
15. The price chosen is the one that most nearly reflects what was paid for the current period’s output. Frequently, where the commodity carries a heavy weight in an index and the country is an important trader , more than one price series is used to represent that country’s trade.
2. Weighting
16. Beginning in 1978, the indexes published have been computed with weights determined by the patterns of primary commodities exports in 1980. The index is a Laspeyres index on base 1980, the formula being
’ P P= n ‘80
‘80 ‘80
where P is the price index; p, price; q, quantity; the subscript n, current period: and the subscript 80, base period 1980.
-50

17. The weiqhtinq of individual price series in the index for a commodity depends first of all on finding a weight, the “country weight”, for each exporting country for which a price series is used. This country weight is proportional to the share of the commodity in the value of total exports of the commodity in 1980. If only one price series is used for the country, the price series receives the country weight; where more than one price series is used for a country, the country weiqht is split among them in proportion to the importance of the trade represented by each price series. These weiqhts that are assigned to the price series within each commodity will be referred to as “intra-weights”.
18. The countries for which price series are available for any particular commodity rarely account for the total trade in that commodity. The weiqhts allocated to the available series have been inflated in one or two ways. In some cases the outstandinq weiqhts have been allocated over all the available price series. On the other hand, if for a particular country which is an important exporter, there is no available price series, but that in respect of a neighbouring country which is also an important exporter of that commodity a price series is available, the weight attributed to both countries is allocated to the price series obtained from the latter. ,
B. Scone of individual indexes
19. Frequently, the movement of the index, the construction of which has just been described, is assumed to represent the averaqe price movement of an aqqreqate of goods larqer than the aggregate on which the computation of the index was actually based. Thus, an index of beef, fresh (part of SITC, Rev.2, 011.1) is assumed to represent the price chanqes of meat of bovine animals, fresh, chilled or frozen (SITC, Rev.2, 011.1) . ’
20. Similar assumptions are made in passina from commodity indexes to commodity qtoup indexes and from commodity qroup indexes to commodity class indexes as described in paragraph 21.
c. Aqqreqate indexes
21. The commodity price indexes are used to compile sub-indexes for commodity groups and commodity classes, as well as the primary commodities index. A commodity group index is a weiqhted average of commodity indexes and the primary commodities index is constructed from commodity class indexes.
22. The weight of each commodity index is computed as the ratio of the value of the exports of that commodity to the value of the exports of all commodities in 1980 directly entering the computation of the commodity group, class and primary commodities index.
.
-6-
D. Analysis of.price indexes by economic regions
23. Every aggregated price index is analysed for developed areas z/ and for developing areas. I/ This is accomplished by calculating two separate sets of weights for each commodity,,the first set of weights being based upon the 1980 exports value of developed areas and the second upon the 1980 exports value of developing areas. With this segregated information, indexes for the developed areas and for the developing areas are separately computed at various levels of aggregation according to the principle laid down in the foregoing paragraphs of this chapter.

.III; COMPARISON BETNEEN PRESENT AND PREVIOUS WEIGHTING PATTERN _.
24. Table 1 shows the iJeighting pattern for the primary commodities and for the non-ferrous base metals price indexes based on export value data respectively for the years 1953, 1959, 1963, 1970, -1975 and 1980.
. 25. The dramatic increase in crude petroleum prices which began at the end of 1973, together with a sustained increase in the volume of trade in that commodity, introduced a drastic change into the weighting pattern after ‘1970 so that the weight of crude petroleum represents 59 per cent of,the total weights in the total export price index of primary commodities (80 per cent of the total exports of primary commodities from developing countries). As a result, in resnect of most of the other commodities the weights have decreased tremendously in 1980 as compared with 1975 and earlier years.
26. The coverage of the new commodity index varies somewhat from that of 1979. First, unlike previous calculations of weighting patterns, the present calculation takes account of the export trade of Eastern European countries and Asian countries of centrally planned economies and the Union of Soviet Socialist Republics. Secondly, the commodity composition has been amplified to include “oats” in the group of cereals and a new commodity group “vegetables”, comprising onions, tomatoes, potatoes, cassava, beans and peas. Commodities included in the primary .commodities price index represent 98 per cent of the total exports of primary commodities in 1980; corresponding percentage for the non-ferrous base metals index is 89 per cent.
-8-

IV. COMMODITY COMPOSITION OF THE INDEXES AND THEIR SUB-INDEXES
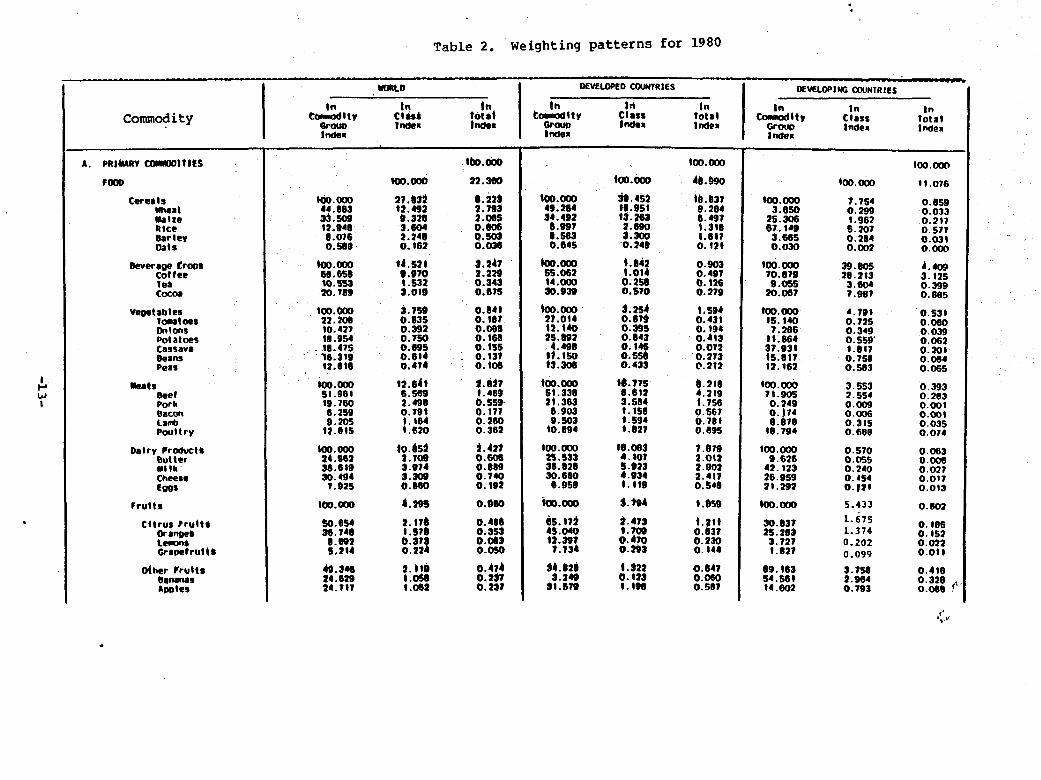
27. Table 2 shows the weighting pattern in 1900 for primary commodities as well as non-ferrous base metals analysed in terms of total index, class index and commodity group index for the world, developed countries and developlnq countries.
-9-
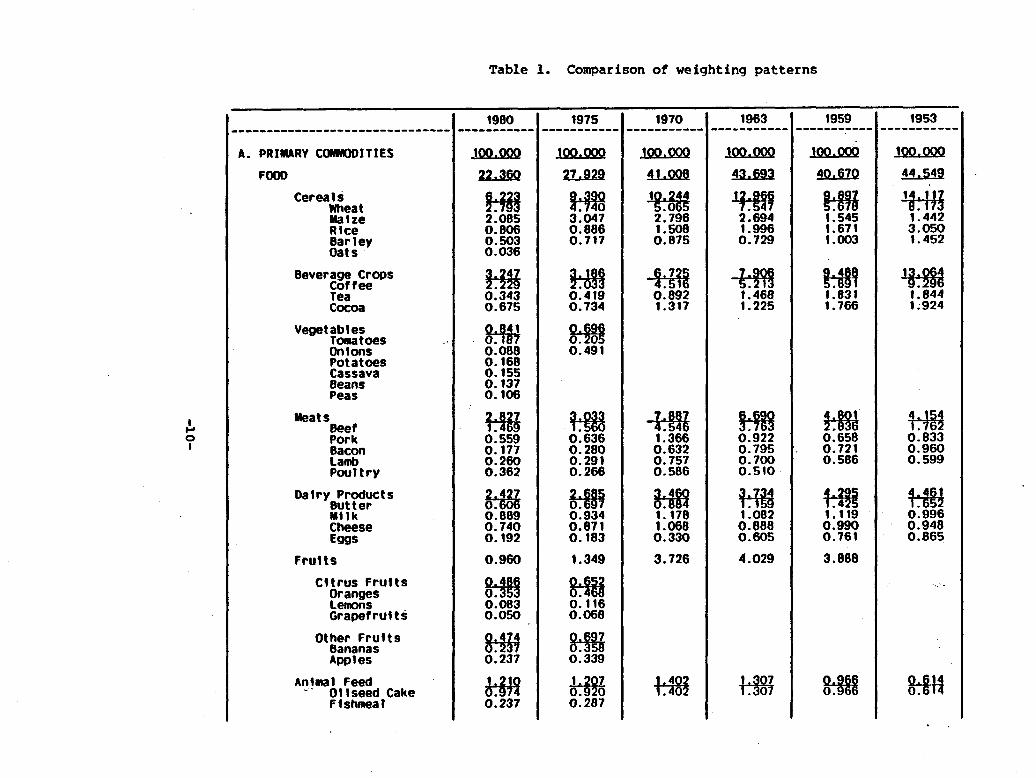
Table 1. Comparison of weighting patterns
A. PRIMARY COMHIITIES
FOOD
Cefeali Wheat
FE Barley Oats
Bever~ge,C&ow
lea COCOa
Veset ables Tomatoes Onlms
$XQZ
f:::
Meats Beef Pork
i!!“,zr Paul try
Frul ts
mJ,~ults
Lemons Grapefrultj
1980 .---------- 1975
.---------s
22.W
!Ml 2:085
222 0:036
41 %%7 .
i%t 0: 155 0.137 0.106
Hi!8 0: 636
:- xii: 0: 266
4 4&i :: 889
oo%! .
0.960
%I7 iii-934 0:671 0.163
1.349 3.726
4 !+di# :‘OB3 0:050
vi3 iii-116 0:06e
w iii:237
%!I3 029
&HI 0: 237
-P- :, 2; 0: 287
1970 .----------
-33% 1:366
:% 0: 586
4 A+! . 0
. . 1963 .-w--m-----
~oo.ooQ
43.693
w 2:694 1.996 0.729
-?+M t:468 1.225
w 1:082
0.888 0.605
4.029
HP7 . d
I
1959 .----------
l3lmxKi 40.670
!H! a
1:83: 1.766
v-8! 1::19
::E
3.888
g 0.
. . 1953 -----------
lOO.OOQ
44.549
k&l 0: 833
ix% .
4 +I?!8 0: 996 0.948 0.865
.._ .
w 0.
.

I i I
I ’
-ll-
.
- .

.
Table 1 (concluded)
MINERALS
Fuels lpru Petroleum
Natural Gas
Ircm Ore Manganese Ore
Chrome Ore *
Nickel Ore
Bawl te
fln Ore
Cower Ore
Zinc Ore
Lead pe
Crude Ferttltter
PRIMARV COMMD9IfIES EXCL . PETROLEUM
6. NON-FLRRWS BASE METALS
2.623
1.251
0.064
0.046
1975 .----------
2.061
0.169
0.099
0.859
50.098
44.117 9.765
23-3E 7:662 6.706
I , m
1970 .----------
iii 31912
1963 1959 .-----s---. .---------.
E 3: 573
3.394 2.615 2.691
0.238 0.310 0.372
0.173 0.096 0.168
1.335 0.464 0.355
0.732 0.426 0.411
0.421 0.345 0.424
1.094 0.293 0.312
0.46( 0.246 0.284
0.316 0.212 0.265
0.477 0.466 0.666
80.179 ~84.880 65.613
loo.fxxJ JoO.ooQ lOO.OOQ
CiE 2ps;
3:617 5.916
5a%z 16:003
5tN: 12: 167
t-E 10: 746
‘~-~~ 13: 376
I . . 1953
21.ooo +iF!R
4:670
2.674
0.260
1.290
0.389
0.425
0.409
0.640
85.115
* .
Table 2. Weighting patterns for 1980
WJRLO OEVELDPED CDDNTRIES DEMLDPtffi COUNTRIES
Commodity A%, Inden t+klt,
lhcler
In totat IrIdeR cc2dzdtl
Imier 255 lnder
tn rotst hte8t
: W I
.
A. PRliURV CMMItIES
m m
Cerells wheat Nslze Rtce 6a;ev
Vewtrbles romatoer OnlollS Potatoes
“,t::r Pea5
*ertt Beef Pork Bacon Lamb Poultry
D8try Frodwt~
$p’
Cheore te95
Frutts
Cttrur Pruttfi
~~’ Grsoefrutt*
OtMr Irutts omana Awte5
i!p$ 24:Tt7
a.759
oo-ii5 0:750 0.695
:*t:: .
t2.641
:*:: 0:19t t.t64 t.620
:-:;: b:st
0 0.22
:.tt&
t:o62
.tbo.oDo
22.360
p;$
2:065 0.606 Q-503 0.036
ii-::: ti231
loo.oDD
rs.edD
t.594 0.43)
8.::: 0:072
‘83::
f.:l: t:lSS
x: 0: 895
KG 2:902 2.417 0.540
t.oss
t.2tt o.s37
8%
0.647 0.060 0.507
T
tDD.ow 11.076
7.754
:-9% 6207 0.264 0.002
0.859 0.033 0.211 0.517 0.031 O.OOD
i:EJ
r:set
I.409 3. I25 0.399 0.665
4.79r
00.3:x p:;
0:tsll 0.563
0.53t o.Deo
8%: $20;
o:cm5
3.x:: 0:DDs
8:Z 0.666
0.393 0.263 0.001 0.001 0.035 0.074
8:E$ 0.240 0.454 0. (21
5.433
1.675 1.374 0.202 0.099
KC 0.793
0.063 0.008 0.021 0.011 0.013
0.602
O.Nl6 0.152
8%::
m.om
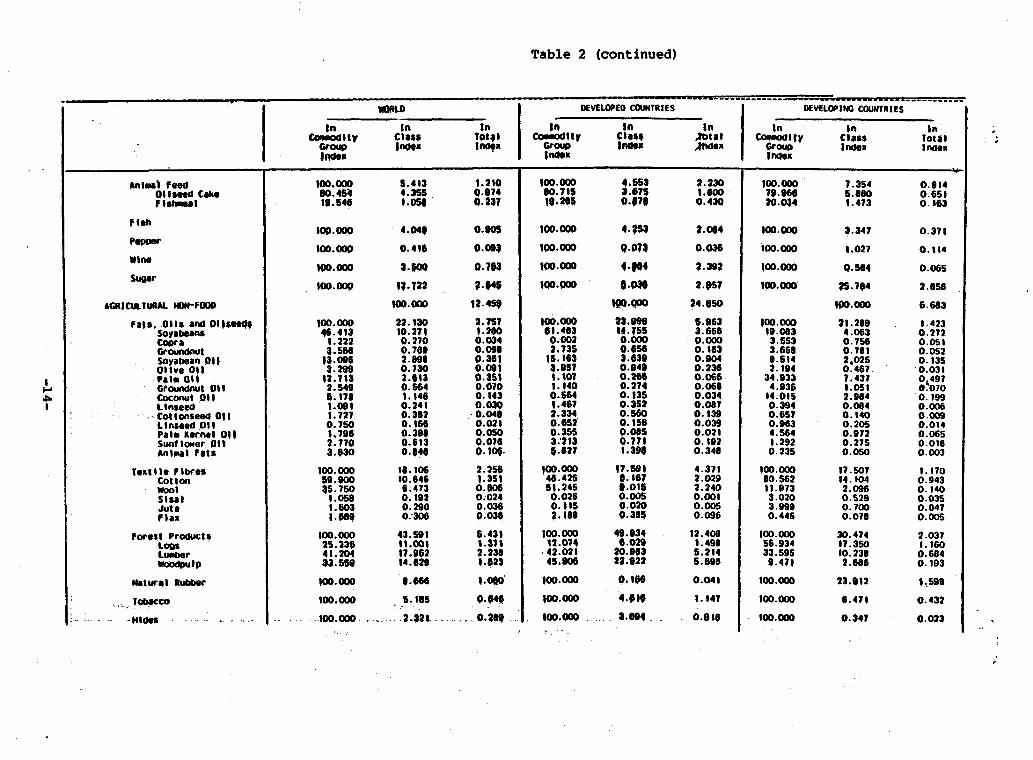
Table 2 (continued)
-----------mm DEVELOPED CCUNTRIES I flEVELOPIW COUNlRlES
Ft*
nrne
Fats.$;.O~,r$OtlS~9
Coors Groundnut Soyabean Ptl
%:eov
zzi%:” Linseed Cottonseed 011 Linseed 011 Pale aernel O)l Suntloer 011 MMal Fats
Tort l;zt:ges
wool Slsal Jut l Flax
Forest Prodvcts Loor Luumr -Jmm
loo.099
109.000
190400
too.oop
1.699
‘ixi 41:204 33.559
1oo.ooo
199.ooo
MlQ.ooo
I.049
0.4t6
3.W
l?.lW
8.:: 0:564 1.146
0.241 0.382 0.166
8Z 0: rq
:i*:: 0:oa 0. Ia2 0.290 0.306
0.005
O.W$
a.103
7.046
12.459
1.151 1.20
8%: $36:
0:ast
8%
.pJ
p?J . .
1ao.ooo
1OO.ooO
wo.m
100.om
‘Z% ok92 2.735
I;.;;:
1: to7 1.140
‘tKE .42:621
45.906
loo.oao
100400
4.p3
0.013
?.#a4
6496
M!@oa, 23.990 14.755
1oo.ooo . 3.691 .’ -.
2.230
i:%
Q.a(l4
0.036
2.392
2.QSl
q4.050
2%
o”:%
o”:%
8*% 01034
8% 0:039 0.021 0.192 0.340
4.311 2.029 2.240 O.ODl
8:%
12.408 1.498 5.214 6.9996
0.041
1.147
0.0W
109.090
100.cKlo
loo.ooo
,*.OlX#
:*:3 1:292
0.235
Ebb 1r:s73
33%: 01445
‘2:E
“i: 5::
tm.ooo
19O.am
19O.ooo
7.354
~:t~
0.814 0.651 0.163
9.347 0.371
t .027 0.114
0.584 0.065
35.7@4 2.056
19o.ooo 6.683
2tz 0: 756 O.?Ol 2,025 0.467
Es: 1:ser 0.084
8% O:S72 0.275 0.050
1.423 0.272 0.05’ 0.052 0.135 0.031 O&497 8.070 0.199
;:g
0:04x
8%:
I. 170 o.s43
8% 0:047 0.00s
39.474
:l-E 2:&36
1.037 I.160
0.684 0. I93
13.912 1,599
6.471 0.432
0.347 0.023 . 1.
;’

. . . . .
Table 2 (concluded)
.
-.-
I F
.a M1tERAl.S
FIleIS Crudd Potrol4ua
ELI GM
troll ore
-----------, WCW.0 wvEl.oPED ccmlRlLS .__lVrCWlKWlL
co&t). $b; fn
Tot81 tZOIl!Ltr +: &I Cks f%l. lndei
.zz IfILler
co&' Inden Indell
Indm Index
I‘ ,
” lOO.bOO &el loO.obo 26.101 wo.ooo 02.241
9?.3a@ #.42i 23.559 1ao.m 99.399 ‘s%
3:402 4.136 %(: 41029 7% 2:r23
‘C-E
g:;g .
E%
;;:;z ‘:*% SL973
98.996 !KY
0.024 l.oeo %E 1:062 0:020 0.074
lOO.OW t.otr 1.2st liM.aw, 7.994 2.084 loo.aoo ~.rJso 0.063
lsngsner Ore
chrom OA
Crud4 Ferttllto?
PRIlYRV ClllmmfttLS EXCL . PLTnoLEtm
B. IICW-FEltROUS 9ASk iErw
Ez Alulnlu
Led ZIK fln
tlm.a3o O.lH 0.084 too.ooo 0.9&t 0. too too.oco 0.094 0.077
100.000 o.oti 0.046 klo.alo 0.242 0.094 too.om 0.039 0.030
100.000 b.S?!l 6.375 100.000 1.as2 0.3-a 1OO.ooO 0.453 0.373
loo.ooo 41.397 to0.w Od.$30 1al.ooo lB.996
tL%mlo lamoo 1Qo.oc0
38*::: 4:*z: 43:031 2p;
!*‘1$ t:s77 2: 143 24.020
.

.
W. XNDIVIDUAL CGMMODITY DESCRIPTIONS AND COMMODITY WEIGHTS
28. The present chapter presents a description of the price series used in calculation of the commodity index, as well as their respective weights within each commodity.
commodity
Beef
Lamb, mutton
Description of price series
Denmark, steers for export, best quality Australia, export price index (1959/60=100) Ireland, bullocks, other markets than Dublin Germany, Fed. Rep. of, import price, beef from
Netherlands, free at border, fresh Germany, Fed. Rep. of, import price, beef from
France, free at border, frozen
New Zealand, frozen carcasses, wholesale price, London
Australia, export price index (1959/60=100), mutton
12.0 34.3 20.9
15.6
17.2
100.0
71.3 28.7
Pork Germany, Fed. Rep. of, import price from Netherlands/Belgium-Luxembourg, free at border
Denmark, first quality, wholesale price
100.0
66.7 33.3
Poultry
Bacon Denmark, average export price, bacon sides
Milk
Butter
Germany, Fed. Rep. of, import price from Netherlands, broilers, delivered free at border (950-1,000 grams)
Netherlands, export price index (1970=100) milk, evaporated, condensed
Netherlands, export price index f1970=100) milk, powder or solid
Pcrmany, Fed. Rep. of, export price index (1970=100) milk, powder or solid
Netherlands, packed for export, ex-dairy U.K., import price, ex-dock, London, Danish butter
import price, ex-dock, New Zealand butter &;alia, export price index (1959/60=100)
100.0
TOO.0
100.0
27.9
29.5
42.6
100.0
49.2 19.9 27.4
3.5
100.0
.
-16-

commodity Description of price series Weights, 1980 1%)
Cheese Emmentaler, wholesale price, Rungis, France Switzerland, hard cheese, export unit value Netherlands, "Gouda" 48% fat, free German border Netherlands, "Edam" 40% fat, free German border
Egs Export price at co-operatives, Copenhagen, Denmark Netherlands, weighted producer's price, including
4% value added tax Germany, Fed. Rep. of, import price from Belgium,
free at border U.S.A., extra large, white, wholesale price,
New York
Wheat U.S.A., No. 1 dark northern spring, wholesale price, Minneapolis
U.S.A., No. 2 hard/dark winter, wholesale price, Kansas City
Canada, No. 1 Canadian Western, Red Spring 13.5% (CWRSI, in store, Thunder Bay, export price, f.o.b.
Canada, No. 3 Canadian Western, amber durum 13.5% in store, Thunder Bay, export price, f.o.b.
Australia, export price index (1959/60=100) Argentina, wheat for bread, export price, f.o.b.
Buenos Aires
Rice Milled rice, medium grain No. 2, U.S.A., wholesale price
White rice, 5% broken, f.o.b., Banakok
Barley U.S.A., wholesale price, Minneapolis, No. 2 malting 21.6 Canadian No. 1 feed, in store, Thunder Bay 36.4 Australia, export price index (1959/60=100) 42.0
Maize Import price, c.i.f., Rotterdam, La Plata, Argentina
U.S.A., No. 3 yellow, c.i.f., U.K., ex-silo, Tilbury
Oats Canadian No. 1 Feed, in store, Thunder Bay
5.9 25.0 25.9 43.2
100.0
0.7
77.3
5.7
16.3
100.0
41.6
10.9
23.0
3.7 18.2
2.6
100.0
57.4 42.6
100.0
100.0
1.3
; . 98.7
100.0 .;:
100.0 :‘ .:
-17-

commodity
Potatoes
Cassava
Beans
Peas
Coffee
Cocoa
Tea
Orange
&.emon
.
Description of price series Weights, 1980 I%)
Denmark producer Bintjie U.S.A. average producer
Bangkok, wholesale pellets Rotterdam, c.i.f., pellets New York, c.i.f., Thai flour
U.S.A., wholesale (Navy beans) phaseolus vulgaris U.K., c.i.f. (Navy beans) phaseolus vulgaris
U.K., c.i.f. (Alaska green peas) pisum sativum
Indicator price, International Coffee Agreement, unwashed arabicas
Indicator price, International Coffee Agreement, Colombian mild arabicas
Indicator price, International Coffee Aareement, other mild arabicas
Indicator price, International Coffee Agreement, robustas
Ivory Coast, f.0.r. Le Havre Average daily closing price, nearest 3-month futures,
N.Y. Cocoa Exchange Spot price, Ghana, U.K.
Kenya, auction price Mombasa, including cesses, excluding export duties
Sri Lanka, c.i.f., U.K. all types North India, c.i.f., U.K. South India, c.i.f., U.K.
Any origin, wholesale price in Germany, Fed. Rep. of 56.9 Any origin, wholesale price in U.K. 43.1
Italian, free at German border Spanish, c.i.f., Hambura
80.4 19.6
100.0
90.6 8.9 0.5
100.0
99.6 0.4
100.0
100.0
31.7
30.4
13.2
24.7
100.0
40.0
31.7 28.3
100.0
20.3 47.1 18.8 13.8
100.0
100.0
44.3 55.7
100.0
-18-

commodity Description of price series Weiqhts, 1980 (%)
Grapefruit
Banana
Apple Import price from Italy, free at the border 100.0
Oilseed Export price, soyabean meal, 44% protein, Decatur, cake U.S.A.
Fishmeal
Tomato
Onion
Pepper
Fish
Sugar
U.K., wholesale price, major markets
U.S.A., Central/South America, f.o.b., port of entry
Import price paid by wholesalers to importers, Hamburg
F.o.r., Guadeloupe, French ports \
Nigerian, qroundnut cake, 54% c.i.f., U.K. Linseed cake, English, 38.5%, ex-mill
Peruvian, 64-658 c.i.f., North Sea ports
Netherlands, free at German border Germany, Fed. Rep. of, import price from the
Canary Islands, c.i.f., North Sea ports
Netherlands, free at German border 70.9 Italy, free at German border 29.1
U.S.A., black Malabar, spot, New York 34.2 Singapore, export price f.o.b., black "Lampong" 52.5 Singapore, export price f.o.b., white "Muntok" 13.3
Canada, export unit value, cod, fillets 14.3 Canada, export unit value, cod, salted 21.8 Japan, export unit value, albacore 13.4 Norway, export unit value index (1970=100) 17.9 Denmark, export unit value, herrinq 32.6
London daily raw price, basis 96% bulk, c.i.f., U.K. International Sugar Agreement daily price, stowed
Caribbean ports l
100.0
72.6
24.0 3.4
100.0
84.3 11.5
4.2
100.0
100.0
67.7
32.3
100.0
100.0
100.0
100.0
43.2
56.8
100.0
-19-

Commodity Description of price series Weights, 1980 (%I
Wine U.K., import unit value from Spain 11.7 EEC Red, table wine, lo-12 degrees 44.2 EEC White, table wine, lo-12 degrees 44.1
100.0
Any origin, c.i.f., European ports Groundnut
Soyabean
Linseed
Copra
Soyabean oil
100.0
No. 2 yellow, bulk, c.i.f., U.K. 100.0
Canada No. 1, export price, in store, Thunder Bay 100.0
C.i.f., European ports, Philippines 100.0
Dutch, crude f.o.b. mill, Rotterdam Wholesale price Decatur, U.S.A.
74.8 25.2
100.0
100.0 U.S.A., wholesale price, crude Cottonseed oil
Groundnut oil
Olive oil
Palm oil
Coconut oil
Palm kernel oil
Linseed oil
Animal fat
Any origin, c.i.f., Rotterdam 100.0
100.0 Spanish drummed, edible f.o.b., Euroports
hlayan, 5% c.i.f., U.K.
Philippines, crude, c.i.f., Pacific coast
100.0
Zaire, bulk sellers, c.i.f., France
Any origin, c.i.f., London/Hull dutiable
100.0
100.0
U.S.A., tallow, bleachable, fancy, delivered Chicaqo
Australia, tallow, export price.index, (1959/60=100)
Germany, Fed. Rep. of, fish oil, any oriqin, C.i.f., North Sea ports
3.6
65.\3
31.1
100.0
Sunflowerseed oil Any origin, ex-tank, Rotterdam 100.0
l
.
-2o-

Commodity Description of price series
Lumber Canada, industry selling price index (1971=100), fir, British Colombia coast
Canada, industry selling price index (1971=100), spruce, f.o.b. mill
Finland, export price, sawn softwood Germany, Fed. Rep. of, import price from Austria Scandinavian spruce, c.i.f., North Sea ports
Woodpulp Canada, industry selling price index (1971=100), bleached sulphate
Canada, industry selling price index (1971-1003, bleached sulphite
Sweden, export price index (1968=1001
Log
Wool
Import price from Ghana "Wawa", c.i.f., North Sea ports
Import price from C&e d*Ivoire, c.i.f., North Sea ports
Import price from West Africa, "Macore", c.i.f., North Sea ports
Australia, export price f.o.b. (1959/60=100) 66.4 Merino 64.8, c.i.f., U.K. 33.6
Cotton Egypt Menoufi, fully qood extra long, c.i.f., North Europe
Turkey, Izmir, standard 1, white l-1/16 medium/long, c.i.f., North Europe
Mexico, S.M., l-1/16 medium/long, c.i.f., North Europe
U.S.A., 'Memphis, l-l/16 medium/long, c.i.f., North Europe
U.S.A., Orleans/Texa& 1 medium, c.i.f., North Europe
Sudan, Gezira SB, long, c.i.f., North Europe
;-,
Jute Raw, Bangladesh white C, c-i-f., U.K.
Flax Belgium, water retted, c.i.f., U.K. :
Sisal' United Rep. of TanzaniajKenya, No. 3 long, C.i.f., London
Weiqhts, 1980 (%I
29.2
28.3 17.0
6.7 18.8
100.0
38.3
31.6 30.1
100.0
21.6
58.8
19.6
100.0
100.0
10.4
7.8
7.6
50.0
18.5 5.6
100.0
100.0
100.0
100.0
-21-

.
. cammoaity Description of price series
‘. . . Tobacco U.S.A., estimated prices received by producers
‘* . Bovine skin Heavy, native steer, f .o.b., shipping points,
U.S.A. Light, native cow, f.o.b., shipping points,
U.S.A. Australia, export price index (1959/60=100)
Natural rubber
Weiqhts, 1980 (%) *_
100.0
50.6
32.9 15.5
100.0
No. 1 RSS, f.o.b., Singapore in bales, buyer’s midday prices
No. 3 RSS, f.o.b., Kuala Lumpur, in bales, buyer’s midday prices
42.0
58.0
100.0
Iron ore Sweden, export unit value Canada, Lake Jeanine, concentrate c.65% Fe, c.i.f.,
North Sea ports Liberia, Bonq Range concentrate, c.628 Fe, c.i.f.,
11.5
32.0
North Sea ports Brazil, Itabira Pebble, concentrate, c.65% Fe,
c.i.f., North Sea ports
Chrome ore Turkey, c.i.f., Euroports 100.0
Manganese ore India, c. i. f., Euroports
Coal U.S.A., coking coal type A, c.i.f., North Sea ports
Germany, Fed. Rep. of, hard coal, ex-mine
9.3
47.2
100.0
100.0
78.9 21.1
:j w
, -22-
Commodity Description of price series Weights, 1980 (%)
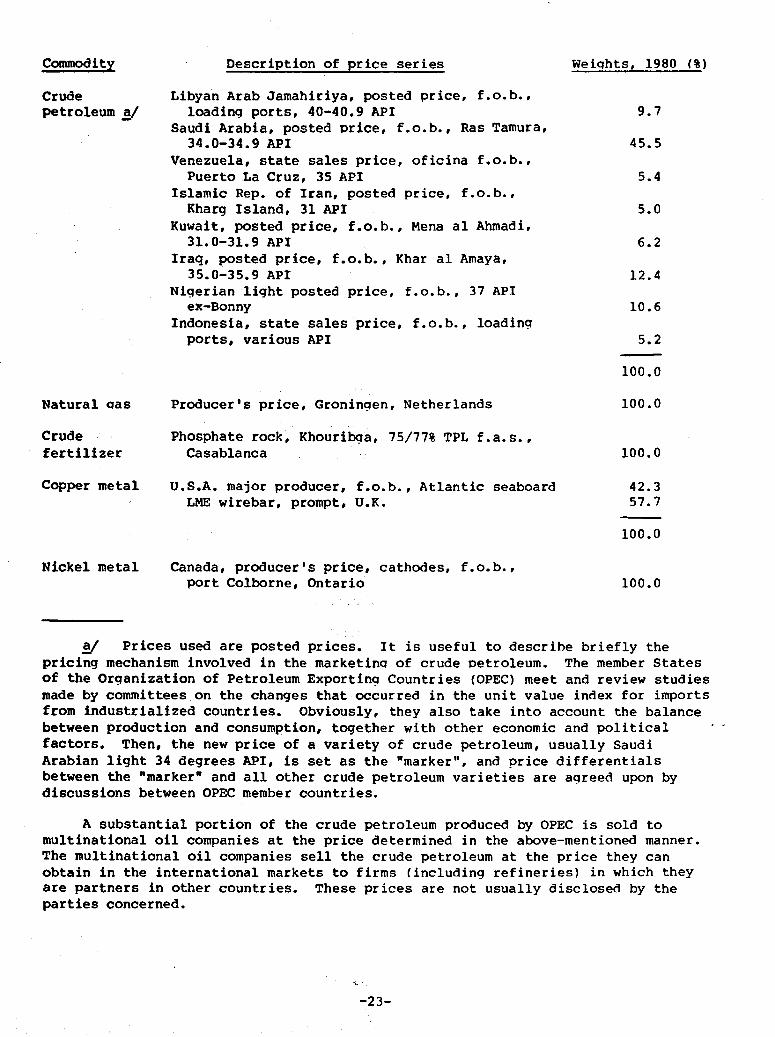
Crude petroleum s/
Natural oas Producer's price, Groningen, Netherlands
Crude Phosphate rock, Khouribga, 75/77% TPL f.a.s., fertiliser Casablanca
Copper metal
Nickel metal
Libyan Arab Jamahiriya, posted price, f.o.b.r loading ports, 40-40.9.API
Saudi Arabia, posted price, f.o.b., Ras Tamura, 34.0-34.9 API
Venezuela, state sales price, oficina f.o.b., Puerto La Cruz, 35 API
Islamic Rep. of Iran, posted price, f.o.b., Kharg Island, 31 API
Kuwait, posted price, f.o.b., Mena al Ahmadi, 31.8-31.9 API
Iraq, posted price, f.o.b., Khar al Amaya, 35.0-35.9 API
Nigerian light posted price, f.o.b., 37 API ex-Bonny
Indonesia, state sales price, f.o.b., loading ports, various API
U.S.A. major producer, f.o.b., Atlantic seaboard LME wirebar, prompt, U.K.
Canada, producer's price, cathodes, f.o.b., port Colborne, Ontario
I.
9.7
45.5
5.4
5.0
6.2
12.4
10.6
5.2
100.0
100.0
100.0
42.3 57.7
100.0
100.0
g Prices used are posted prices. It is useful to describe briefly the pricing mechanism involved in the marketing of crude petroleum. The member States Of the Organization of Petroleum Exporting Countries (OPEC) meet and review studies made by committees on the changes that occurred in the unit value index for imports from industrialised countries. Obviously, they also take into account the balance between production and consumption, together with other economic and political . . factors. Then, the new price of a variety of crude petroleum, usually Saudi Arabian light 34 degrees API, is set as the "marker", and price differentials between the "marker" and all other crude petroleum varieties are agreed upon by discussions between OPEC member countries.
A substantial portion of the crude petroleum produced by OPEC is sold to multinational oil companies at the price determined in the above-mentioned manner. The multinational oil companies sell the crude petroleum at the price they can obtain in the international markets to firms (including refineries) in which they are partners in other countries. These prices are not usually disclosed by the parties concerned.
c.
-23-

., . .
Commodity Description of price series Weights, 1980 (0)
Aluminium U.S.A., producer's price, delivered at New York, 99.5%
Canada, delivered U.K., 99.5% 23.4 76.6
100.0
Lead metal U.K., London Metal Exchange, cash 91.5 Canada, delivered carload lots 8.5
100.0
Zinc U.K., London Metal Exchange, prompt Canada, prime western, delivered
66.5 33.5
100.0
Tin metal Malaysia, straits, ex-works, Penang U.K., LME, prompt, standard grade
41.3 58.7
100.0
Notes -*
1/ Methods Used in Compiling the United Nations Price Indexes for Base Commodities in International Trade, Statistical papers, Series M, No. 29, Rev.2 (United Nations publication, Sales No. E.79.KVII.6).
21 The methods employed are described in Methods Used . . . . Statistical papers, Series M, No. 29, Rev.1 (United Nations publication, Sales No. E.70.KVII.17).
2/ Standard International Trade Classification, Series-M, No. 34 (United Nations publication,
Revised, Statistical papers, Sales No. E.61.KVII.6); and Standard
International Trade Classification, Revision 2, Statistical papers, Series M, No. 34, Rev.2 (United Nations publication, Sales No. E.75.KVII.6).
ij Developed areas or "economic class I countriesw: .America, Canada, Western Europe, Japan, Israel,
United States of Australia, New Zealand and South
Africa. : ..' /
.5J'- Developincj areas 0r aeconomic class'II countries" comprise countries, including Yugoslavia, which are included neither in the developed areas nor in the centrally planned economies (economic class III countries: that is, Eastern European countries (excluding Yugoslavia) and Asian countries of centrally planned economies and the Union of Soviet Socialist Republics).
‘. . ;
-24-

. .
Part Two
PRICE MOVEMENTS OF BASIC COMMODITIES AND NON-FERROUS BASE METALS IN INTERNATIONAL TRADE: 1950-1984
-2s-

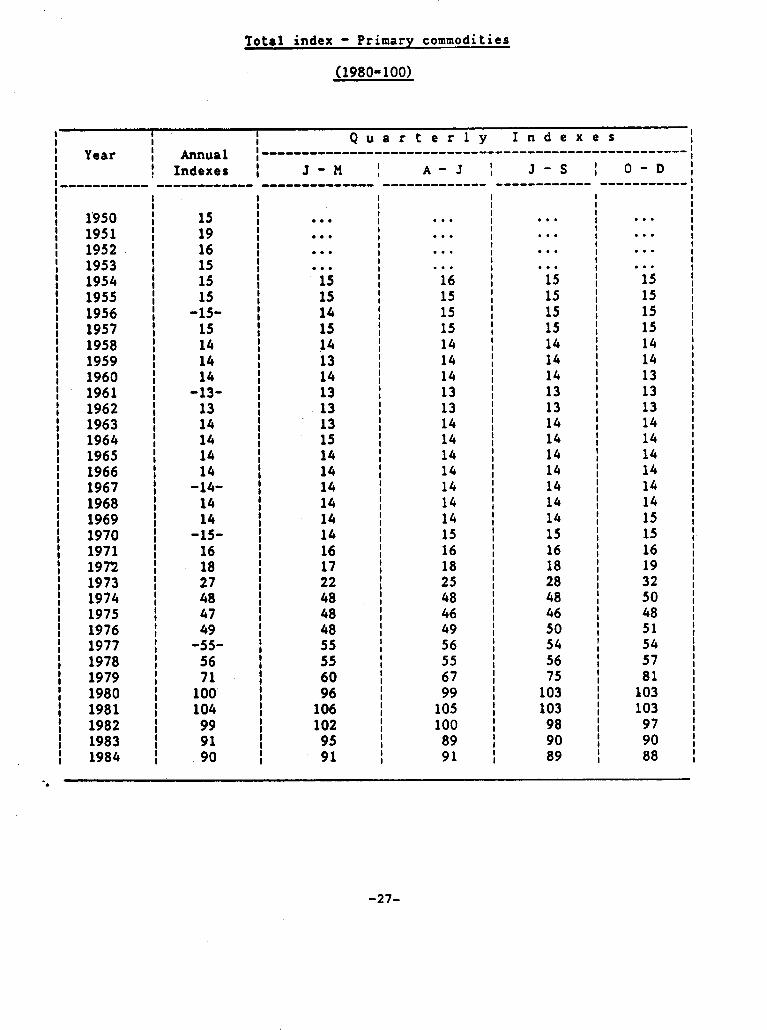
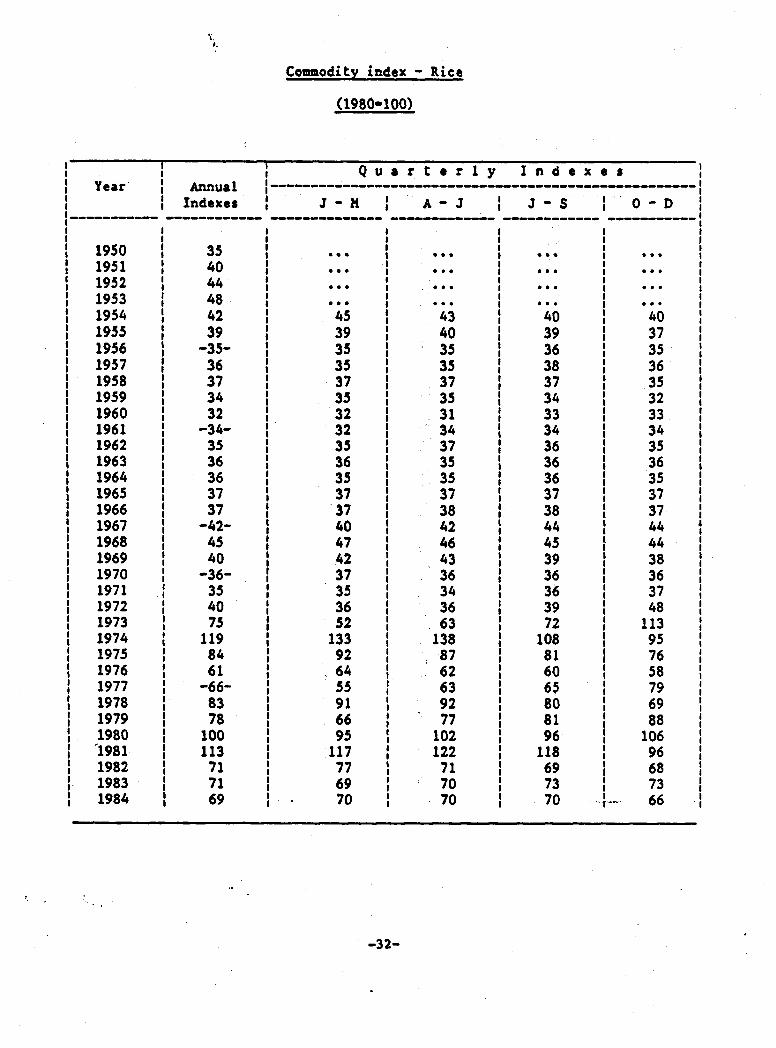
VI. HISTORIC&L SERIES . .P-
The purpose of this chapter is to.provide a historical series, beginning with 1950, for both primary commodities and non-ferrous base metals export price index. In this connection, a word of caution to the user of the historical series is deemed necessary. In order to obtain the series, all indexes calculated under the base years 1953, 1959, 1963, 1970 and‘1975 have been linked to the new base year 1980. In view of the differences in the weighting patterns between base years, indexes linked to the new base year are not strictly comparable with the indexes calculated under the new base year.
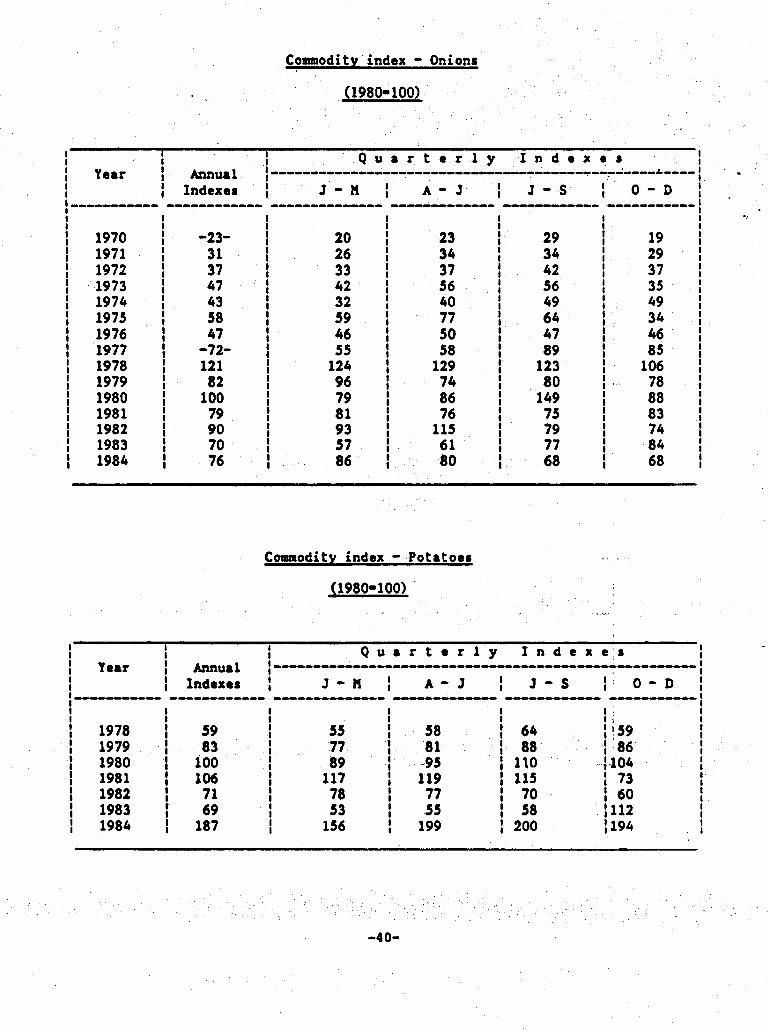
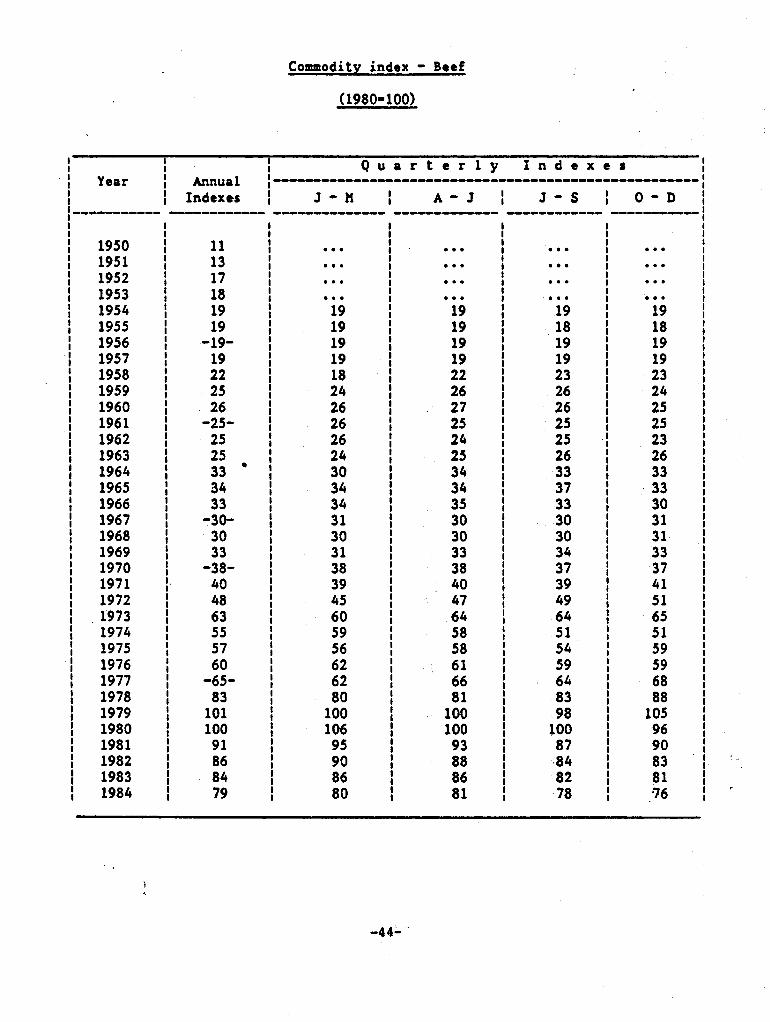
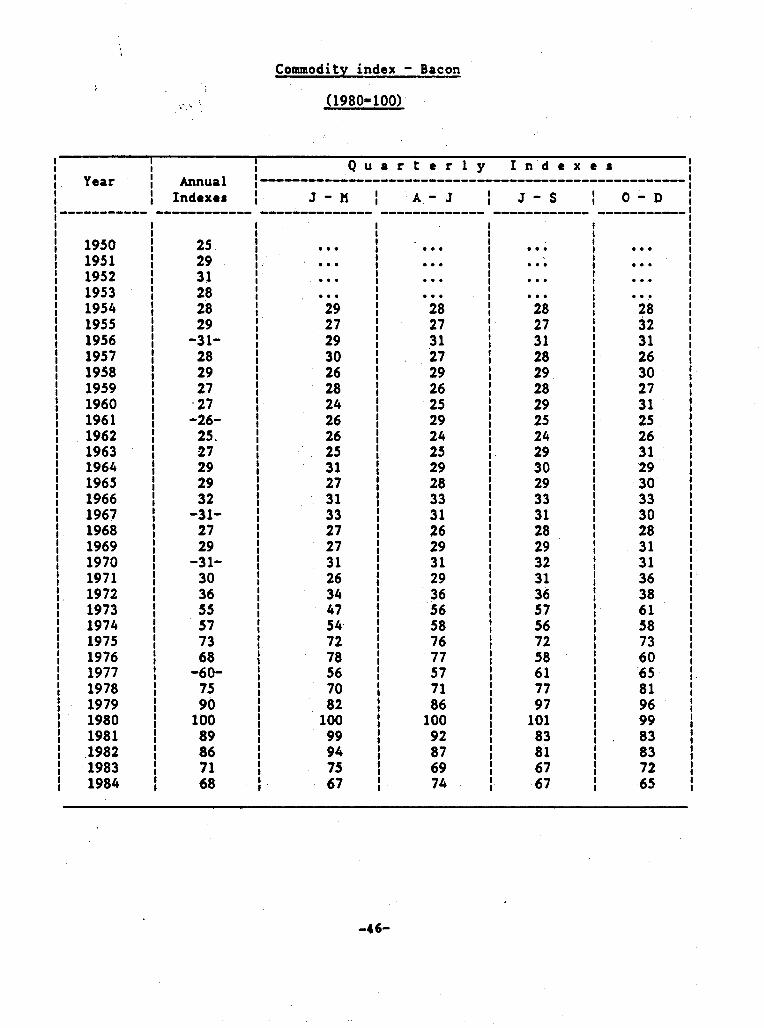
In the following tables, annual indexes from 1950 through 1984, as well as quarterly indexes from 1954 through 1984 , are shown for each commodity, commodity group, class and total index.
.*
. .
.
-26-
Total index - Primary commodities
(1980=100)
I I I I I
Quarterly Indexes I Year -----------------------------------------------------
I I Annual
! Indexes i J -n : A-J 1 J-S 1 O-D ;--------- ------------ -------------- ------------- ------------ -----------
1950 1951 1952 1953 1954 1955 1956 1957 1958 1959 1960 1961 1962 1963 1964 1965 1966 1967 1968 1969 1970 1971 1972 1973 1974 1975 1976 1977 1978 1979 1980 1981 1982 1983 1984
15 19 16 15 15 15
-15- 15 14 14 14
-13- 13 14 14 14 14
-140 14 14
-15- 16 18 27 48 47 49
-55- 56 71
100 104 99 91 90
. . .
. . . . . . . . .
15 15 14 15 14 13 14 13 13 13 15 14 14 14 14 14 14 16 17 22 48 48 48 55 55 60 96
106 102 95 91
. . .
. . .
. . .
. . . 16 15 15 15 14 14 14 13 13 14 14 14 14 14 14 14 15 16 18 25 48 46 49 56 55 67 99
105 100
89 91
. . .
. . .
. . .
. . . 15 15 15 15 14 14 14 13 13 14 14 14 14 14 14 14 15 16 18 28 48 46 50 54 56 75
103 103
98 90 89
. . .
. . .
. . .
. . . 15 15 15 15 14 14 13 13 13 14 14 14 14 14 14 15 15 16 19 32 50 48 51 54 57 81
103 103 97 90 88
-.
-27-

Class index - Food
(1980-100)
I ; I Quarterly I n d c x~~~~~~~~
I Year I I
Annual I -----------------------------------------------------
I I Indexes 1 J-H ; i A-J : J-S : O-D ,
I i
. . . i 1950 1951 1952 1953 1954 1955 1956 1957 1958 1959 1960 1961 1962 1963 1964 1965 1966 1967 1968 1969 1970 1971 1972 1973 1974 1975 1976 1977 1978 1979 1980 1981 1982 1983 1984
27
3: 30 32 28
-28- 26 25 25 25
-27- 25 27 28 28 28
-28- 27 28
-3o- 31 36 55 70 63 66
-76- 77 86
100 89 78 77 74
I i
. . .
. . . i I . . .
1 . . . i 32 I 30 ! 28 f 29 I 28 I 26 ! 25 t 25 I 25 I 25 I 30 I 28 t 28 f 28 I 27 I 28 I 29 I 31 I 34 I 46 ! 67 I 69 I 63 I 77 I 77 I 80 i 95 I 97 I 83
i ;“7
;
.
. . .
. . .
. . .
. . .
:i 28
ix 26 25 25 25 27 29 28 28 28 28 28 30 31 34 53 67 61 67 80 76 83 99 90 79 77 77
. . .
. . .
. . .
. . . 32 28 29 28 28 26 25 25 25 27 28 28 28
‘28 27 28 30 31 36 60 69 62 66 73 75 89
103 84 74 77 72
. . . i
. . . I i . . .
31 j 28 ; 29 1 28 ; 28 ; 26 ; 25 ; 25 ; 26 ; 29 ; 28 ; 28 1 28 ; 28 ; 28 : 30 i 30 f 31 1
‘40 ; 61 ; 78 : 61 1 68 1 74 : 79 ) 92 ;
103 ; 84 I 74 1 78 f 68 ;
-28-

._
Commodity group index - Cereals
(1980-100) r
I ; ; Quarterly Indexes I t Year I Annual i ----------------------------------------------------- I
I 1 Indexes i J-H 1 A-J 1 J-S ! O-D 1
1950 1951 1952 1953 1954 1955 1956 1957 1958 1959 1960 1961 1962 1963 1964 1965 1966 1967 1968 1969 1970 1971 1972 1973 1974 1975 1976 1977 1978 1979 1980 1981 1982 1983
,1984
34 38 38 38 35 32
-310 31
sx
-;x- 32 32 33 32 33
-340 33 33
-310 31 32 60 85 72 64
-59- 72 85
100 100
86 85
. . . . . . . . . . . .
. . . . . . . . . . . .
. . . . . . . . . . . .
. . . 35 34 30 31 30 30 30 29 32 32
i3 33 35 33
%i
23
:i 75 69 59 71 76 94
107 90 84 84
. . . 35 33 32 30 31 30 30 29 32 32 33 32 33 35
3: 30 32 30 48 80 69 68 58 73 82 95
103 88 86 83
. . . 33 33 32 31 31 30 30 30 32 32 33 31 34 33 33 32 31 30 32 68 84 74 63 57 72 89
102 96 84 85 79
. . . 34 30 32 30 30 30 30 32 31 33 33 31 34 33 33 32 32 29 38 77 88 72 57 63 74 92
108 94 82 85 74 .I- I.
I 80
:29-

Commodity index - Wheat
(1980-100)
I I I
I Year I Quarterly Indexes I
i Annual I
L i
---------------------------------------------------- I Indexes J -H ; A-J ; J-S ; O-D .I
I----- ------------ -------------w ------------- --a--------- ----------- I I
1950 1951 1952 1953 1954 1955 1956 1957 1958 1959 1960 1961 1962 1963 1964 1965 1966 1967 1968 1969 1970 1971 1972 1973 1974 1975 1976 1977 1978 1979 1980 1981 1982 1983 1984
41 45 45 46 40 37
-36- 36 36 36 36
-37- 38 38 40 36 39
-39- 37 36
-34- 35 39 73
108 93 79
-6O- 71 88
100 100
89 89 86
. . .
. . .
. . .
. . . 42 40 35 36 37 36 36 36 39 38 40 37 37 40 37 37 34 36 35 53
117 98 89 62 66 76 95
106 93 89 87
. . .
. . .
. . .
. . . 41 39 36 36 36 36 36 36 39 38 40 36 37 41
_ 36 37 34
1 36 35 . .
: .~ 55 :-~. 98
87 :’ 86 I> 59
70 : .. 84
,‘* 93 102 91 91 88
. . .
.*. . . . . . . 38 38 37 36 37 36
3: 39 37 40 36 40
3; 35 34 35 39 85
103 95 75 56 71 94
101 96 85 88 85
. . . .
. . . . . . . . .
39 33 37 36 36 36 36 39 38 39 39 36 40 38 38 34 35 35 49
101 112
92 63 62 75 98
109 97 85 88 85
-3o-

Commodity index - Hoize
(1980=100>
f I I -Quarterly Indexes I I I Year I Annual t ---------------------------------------------- ---w-w- t I I Indexes I J _ -H 1 A-J ( J-S ; O-D ;
1950 1951 1952 1953 1954 1955 1956 1957 1958 1959 1960 1961 1962 1963 1964 1965 1966 1967 1968 1969 1970 1971 1972 1973 1974 1975 1976 1977 1978 1979 1980 1981 1982 1983 1984
27 34 34 29 28 25
-26- 24 22 22
-ii-
21 23 24 24 25
-23- 21 23
-25- 24 24 43 57 48 49
-54- 70 85
100 93 88 8% 72
. . . . . . . . . . . . 27 27 24 25 22 23 22 20 21 23 24 25 24 25 22 22 24 27 22 33 55 48 49 52 67 80 94
102 90 83 81
. . .
. . .
. . . . . . 28 27 27 24 23 22 22 20 21 23 24 27 24 24 21 23 25 26 22 38 52 45 49 53 69
;; 95 89 85 76
. . .
. . .
. . .
. ; . 29 27 27 24 22 22 21 21 21 24 23 24 25 22 20 23 27 23
i: 58 51 49 54 69 87
105 86 89 83 72
. . .
. . .
. . .
. . . 28 23 25 23 21 21 20 21 21 24 24 23 25 22 21 23 27 22 26 50 62 49 48 58 73 88
104 89 85 82 58
-31- .
1950 1951 1952 1953 1954 1955 1956 1957 1958 1959 1960 1961 1962 1963 1964 1965 1966 1967 1968 1969 1970 1971 1972 1973 1974 1975 1976 1977 1978 1979 1980 ‘1981 1982 1983 1984
35 40 44 48 42
-;;- 36 37 34 32
-340 35 36 36 37 37
-42- 45 40
-36- 35 40 75
119 84 61
-66- 83 78
100 113
71 71 69
. . .
. . .
. . .
. . . 45 39 35 35 37 35 32 32 35 36 35 37 37 40 47 42 37 35 36 52
133 92 64 55 91 66 95
117 77 69 70
. . .
. . .
. . .
. . . 43
* ii 35 37
j “3: 34 37 35 35 37 38 42 46 43 , 36 34 36 63
138 87 62 63 92 77
102 122
5; 70
. . . . . . . . . . . . 40 39 36 38 37 34 33
Ed 36 36 37 38 44 45
:: 36 39 72
108
iii 65
ii! 96
118 69
5’0
. . . . . . . . . . . .
40 37 35 36 35 32 33 34 35 36 35 37 37 44 44 38 36 37 48
113 95 76 58 79 69 88
106 96 68 73 66
. . . .
-32-

Commodity index - Barley
(1980=100)
I I I
I Year I I Quarterly Indexes
i i Annual
i
,,,,,,,,-,,,,,,,,,,,,,,----------------------------,----
Indexes J-H ; A-l ; J-S ; 0. i l -D I ----------- ------------ -------------- ------------- -----s-w---- -----------
1950 1951 1952 1953 1954 1955 1956 1957 1958 1959 1960 1961 1962 1963 1964 1965 1966 1967 1968 1969 1970 1971 1972 1973 1974 1975 1976 1977 1978 1979 1980 1981 1982 l’983 1984
39 43 45 37 34 35
-35- 33 34 34 34
-35- 39 38 39 40 44
-430 41 41
-39- 43 43 71
109 169
98 -8l-
76 79
100 106
88 89 93
. . .
. . .
. . .
. . . 33 38 34 35 32 34 36 33 41 40 40 39 44 43 44 41 36 46 39 53
105 115 105
89 77 72 89
116
x: 98
. . .
. . .
. . .
. . . 32 35 36 33 33 33 33 33 40 38 38 39 44 43 44 43 37 44 42 62
101 105 104
88 80 76 94
110 91 85
102
. . .
. . .
. . .
. . . 35 34 34 33 35 34 34 36 38 35 38 40 43 43 39 41 40 42 43 83
112 107
96 73 74 82
106 104
85 92 88
. . .
. . .
. . .
. . . 38 33 35 32 36 36 34 39 37 38 39 41 44 41 40 40 42 40 48 87
116 110
86 75 74 85
112 94 83 96 85
,
-33-

Commodity index - Oats
(1980=100)
. .
I I I Quarterly Indexes I
I Ycai: . I
i Annual i ----------------------------------------------------- I
I I. Indexes I J-H ; A-J ; J-S ; O-D ; ;------ ------------ ------------- ------------- ------------ ----------- !
i I I t I I I
I 1978, ; 66 I 68 : 70 ; 58 ; 67 I 1979 : 81 I 68 I 76 ; 91 ; 90
i
I 1980 : 100 I 88 f 85 : 109 f118 I
I 1981 : 102 t 117 t 106 1 90 ; 96 I
I 1982 ; 83 I 102 ) 91 ; 74 : 67 I
i 1983 1984 ; ; 92 83 I I 96 77 I I 100 75 ; ; 82 87 : : 96 86
I
i
-34-
i. .

Commodity group index - Beverage crops
(1980-100)
I I I
I Year I Annual I Quarterly Indexes
i 1 Indexes i
---u------------------------------------------------ J -X I A-J 1 J-S 1 O-D’
,-w------w- ------w---e- ----u-------- ------------- ------------ --e-v------
1950 1951 1952 1953 1954 1955 1956 1957 1958 1959 1960 1961 1962 1963 1964 1965 1966 1967 1968 1969 1970 1971 1972 1973 1974 1975 1976 1977 1978 1979 1980 1981 1982 1983 1984
29 32 31 33 45 34
-330 32 31 26 24
-22- 22 22 28 25 25
-24- 25 27
-310 27
ii 48 46
-1::- 104 105 100
82 77
. . .
. . .
. . .
. . . 44 39
:: 32 26 24 22 22 22 28 25 26 24 24 26 31 28 27 35 45 45 56
149 111
92 109
86 82 79 99
. . .
. . .
. . .
. . . 49 32 32 32 32 26 23 22 22 23 28 24 26 25 24 25 31 27
.28 39 52 40 77
168 104 100 107 83 75 80 99
. . .
. . . . . . . . .
45 33 34 32 31 26 .24 22 22 22 27 25 25 24 25 26 32 27 32 43 48 49 86
142 98
115 97 77 73 81 94
. . .
. . .
. . .
. . . 42 32 34 32 29 25 24 22 22 23 27 26 25 24 26 30 30 27 33 42 47 SO
106 129 102 115
87 81 78 91 93
-3%

Commodity index - Coffct
(1980-100) .
I I I ..’ I t
Quarterly Indexes I. !eor I Annuo 1 I I Indexes i
i
----------------------------------------------------- J-X ; A-J ; J-S 1 O-D
-w--e---- ------w---e- -----------e-- ----a-------- ---w------w- -----------
I I 1950 1951 1952 1953 1954. 1955 1956 1957 1958 1959 1960 1961 1962 1963 1964 1965 1966 1967 1968 1969 1970 1971 1972 1973 1974 1975 1976 1977 1978 1979 1980 1981 1982 1983 1984
27 30
ix 41 30
-32- 30 27 21 20
-2O- 19 19 25 24 23
-220 22 23
-29-
:;. 36 57 42 83
-146- 95
100 100 81’ ta 77 83
t I . . . I . . . I . . . I . . . I 41 I 32 I I 30 I 32 I 29 I 22 I 20 t 20 I 19 19
I 26 I 24 I 24 I 22 I 22 I 22 I 29 I 27 t 27 I 35 I 49 I I if I 155 I 108 I 79 i 106 I 86 I 80 i 77
a3
. . . . . . . . .
. . . . . . . . .
. . . . . . . . .
. . . 46 29 31 31 28 21 20 20 19 19 26 23 23 22 22 20 30
El 36 59 35 80
172 97 92
110 84 76 76 85
. . . 41 30 33 30 26 21 20 19 18 19 25 24 23 22 .22
5; 26 32 36 61 47 88
135 87
116 98 73
3: 83
. . . 36 29 32 28 25 21 20 19 18 20 25 25 22 21 22 27 29 26 32 37 58 49
108 122
88 114 87 78 79 ’ 81 80
.* . .
-36-

Commodity index - Tea
(1980- 100)
I I f Quarterly Indexes ! Year I Annual 1 -----------------------------------------------------
1 I Indexes i J-24 f A-l 1 J-S ; O-D
1950 1951 1952 1953 1954 1955 1956 1957 1958 1959 1960 1961 1962 1963 1964 1965 1966 1967 1968 1969 1970 1971 1972 1973 1974 1975 1976 1977 1978 1979 1980 1981 1982 1983 1984
I I 68 I 64 i 51
.:: 59
I I
x: I -73- I 68 I 68 I 68 I 68 I -66- I 68 I 65 I 66 I 66 I 63 I -59- I 51
I I
-;;- I 48
I I 2: I 64 I 63 I 70 I -126- I 101 I 100 I 100 I 95 I 98 I 126 f 187
. . .
. . .
. . .
. . . 72
109 66 71 64 64 64 67 66 63 62 62
it 49 46 54
2: 48 59 70 59
122 104 101 105
99 98
111 205
f I I . . . 1 . . . I . . . I . . . I 80 I 70 I 64 I 59 I 68 I 64 1 61 I 68 I 68 I 66 I 66 I 68 I 69 I 60 t 55 I 50 I 55 I 49 I 50 I 49 I 66 I 63 I 65 I 167 I 99 I 96 I 104 I 99 I I 94 I 112 I 183
. . .
. . .
. . .
. . . 87 80 81
;: 73 77 67 70 68 69 70 61 62 52 49 53 48 46 49 61 61 79
115 98
100 101 87 94
115 169
. . .
. . .
. . .
. . . 105
74 85 68 65 69 71 61 69 63 65 63 59 59 49 50 55 49 49 52 68 58 78
101 101 104
92 95
106 166 189
-3l-

. Commodity index - Cocoa
(1980-100)
i i I Quarterly Indexes I Yttr i Annual I -----------------------------------------------------
t f Indexer I J-ll : A-J : J.-S +-------- ------------ ------------- ------------- w-----------
; O-D ---m-w-----
1950 1951 1952 1953 1954 1955 1956 1957 1958 1959 1960 1961 1962 1963 1964 1965 1966 1967 1968 1969 1970 1971 1972 1973 1974 1975 1976 1977 1978 1979 1980 1981 1982 1983 1984
20 26 26 25 42 27
-2o- 23. 33 26 20
-170 16 19 17 12 18
-21- 25 33
-24-
:I: 46 71 52 79
-160- 134 126 100
78 65 81 95
. . .
. . .
. . .
. . . 40 34 20 17 32 28 21 16 16 18 18 15 17
ii
ii 20 19 29 53
4: 153 123 132 122
78 79
if
I I I . . .
I . . . I . . . I . . .
I 47
I 28
I 19
I 20
I 36
I 28
I 21
I 16
1. 16 I 20 I ..: 17 I 11 I 18 1 20 I 22 I 33 I 22 f .‘- 19 I 21
i 45 I 80 I “45 I 70 I 163 I 129 ! ‘-129
i ,101
i 71 62
I 79 I 101
. . .
I I I
. . . . . . . . . . . . 44 24 20 24 32 26 21 16 15 19 18 10 19 21 24 33 25 20 24 61 76 51 84
175 135 120
Xf 58
; . . .
: . . . I t . . .
i 36 I 23 I 19 ,. . .._ 28 t 30 I 24 1 19 I 18 f 16 I 20 I 18 t 14 i 18 .‘,.: . 22 I j 34 I 33
.I I. 24 t : 18 i i 26
1 ; 50 72 I 50 I t 108 I ; 149 I ( 149 ! i 121 ii 83 t : 82 i ; I ;
60
ii 87 86 .
1
_ul ’
-38-

Commodity group index - Vegetables
(1980=100)
I I I . Year’ I i Quarterly Indexes I
Annual ,---------------------------------------------------- I I i
.*- I .i Indexes i J-X 1 A-J 1 J-S
i
----------- ------------ -------------- ------------- ------------
I. i I
I : f
1978 68 I 1979 1 85 I
72 ; 71 ; 63
I 86 1 86 ; 82
I 1980 ; 100 I I 1981 f 99 I
101 I
106 1 100
: 109
I 110 1 92
I 1982 ; 99 85 82 66 I
; 1983 ; 75 I 80 I 76 70
I 1
1984 ; 77 i 89 I I 105 ; 91
O-D ; ----------- I
I 65 I 84 t 93 f 85 I I
f S
I I I
84 1 I
Commodity index - Tomatoes
(19801100)
; I Year I
i
i 1970 1971
i w I
1972 1973 1974 1975 1976 1977 1978 1979 1980 1981 1982 1983 -’ 1984
I
Annual t Quarterly Indexes I
Indexes i
----w----------------------------------------------- J-X : A-J ) J-S I O-D 1
--------u- --------w-m ------------- ------------ --------B-B
I I
I I 1 :
f -3o- 39 1 41 I 19
; t 20 1
32 37 ; 41 I 22 28 37 ;
I ; 51 ; 43 I 27 I 28 1
45 f 49 1 59 I I I 44 1 54 f 72 ; 68 I :i f 46 ; 4: t 87 95 1 63 57 I 38 I 47 ;
t ; ; I 38 51 -68- ;
I I 71 1 71
i
I 44 I 56 74 1
1 88 89 1 49 I 70 1
L 84 132 1 91 f 47 f 66 1 100
I
f 127 ; 116 I 76 I 80 1
88 92
.-. 93 1
130 ; 110 I 45 I 68 1
1 131 103 I
I 57 I 78
1 1
145 97 64 i 67 ; 73 ; I I 76 f 97 63 I I I 57 1
*39-
Commodity index - Onions
(1980-100)
I I
I Year ! Quarterly Indexes I
I Annual
.I
i i
-----~r------------~~~~-~~~-~~~~~~~~~~~~~~~~~-~-~ I , Indexes J-?l 1 A-J ; J-S ; O-D ;
-------w-w -----w--w--- ------------- u---u------ ------------ -w----w---- l I I
1970 : -23~
1971 ; 1972 1 i: ,1973 ; 47
1974 : 1975 ; ii 1976 ; 47 1977 1 -72- 1978 ; 121 1979 1 1980 ) 1:: 1981 1 79
I 1982 : 90 I 1983 : 70 I 1984 ; 76
20
3f 42 32 59 46 55
124 96 79
:: 57 86
i 23 , 34 i 37 : 56 I
i -:
19 29 .i
37 35
i
49 I
34 i 46 ; 85 ;
106 : 78 4 88 ; 83 : 74 ; 84 : 68 f
Commodity index --Potatoes
(1980-100) I
I
I I I Quarterly I
I n d e x e:s I Yam I Annual ; ----------------------------------------~~~~~~~~~~~~~~
i I Indexes i J -I’! ; A-J ; J-S ;’ O-D ;
I --w---u ----------- w-----u----- --------w--w ------------ -----------I
I 1978
i I I I I; t
I I 59 i 55 ; 58 ; I
I 1979 83 ‘77 64 f 159 I
1 81 t i 1980 1981
I ! , : 100 106 I
i
117 89 i ; 119 .95 i ) 88 ,f 86 I
110 115 ” -:.104 i 73 f
i 1982 ; I 77 ; 70 ; 60 I I I 1983 1 2 I iti ; 55 ; 58 ill2 I I 1984 : 187 I 156 I 199 ; 200 ; 194 1

Commodity index - Cassava
(1980=100)
.
.I I I Quarterly Indexes I I I Year I
i
Annual I-----------------------------------------------------~
I Indexes I J-X ; A-J 1 J-S 1 O-D 1
1 I I I I I I i 1978 1 58 I 49 I 53 1 61 1 71
I I I 1979 1 99 f 79 ) 115 I 104 I 97 I I I
I 1980
I 1981
I 1982
i 1983 1984
100 i .93 I 102 ] 107 j 99 I I 73 I
83 1 75 1 70 1 65 I I 75
I -67 I
I 77 ; 76 1 80 I
89 85 I 98 1 91 1 82 I 59 I t 72 i 69 1 so 1 45 I I
‘I.
Commodity index - Beans
(1980-100)
I 1 Yeor i I I -L--a
I I 1978 I 1979 I 1980 I 1981 i 1982 I 1983 I 1984
Annual Indexes
--w----m
85 -. ., 80 : 100
146 49 s7 64
Q.uarterly Indexes I I
---u----------------------------------------------
J-M 1 A-J 1 J-S 1 O-D 1 --w---------- ------------- ------------ -----------/
I I I I I
103 ” ; 90 f 79 / 68 f 74. ; 79 1 83 1 84 t 91. ; 99 ; 103 1107 I 121 1 150 f 157 1157 I
I
54 I 49 1 47 ; 45 I 40 I 49 ; 65 f 75 I 65 I 68 ; 60 f 63 I
. I . .
-II-

Commodity index - Peas
(1980-100)
.
.
i I I Quarterly Indexes
t Year I Annual I ---------------------~~~~~~~~~~~~~~~~~~~~~~~~~~~~~~~~
I i :.Indexes 1’ I -?I ; A-J ; J-S 1 O-D
-------a--- ---LA------- -------------- -0o----o---- ------------ ----------a I
i I I ! I t
1978 : 87 102 1 87 : 83 : 76 I 1979 ; 96 I 84 1 89 ; 100 :110 I 1980 : 100 i 104 ; 108 : 98 1 91 I 1981 ; 90 I 95 I 86 : 96 f 86 I 1982 ; 92 i 94 95 1 93 ; 85 I 1983 : 77 I
i 77 ( 79 ; 75
I 1984 ; 75 I ;;
i 76 ; 76 ; 76
.
-420

Commodity group index - Heats
(1980-100)
I I I I
Quarterly Indexes f I Year
i Annual I -----------------------------------------------------
I Indexes i J-H ; A-J 1 J-S f O-D 1
1950 1951 1952 1953 1954 1955 1956 1957 1958 1959 1960 1961 1962 1963 1964 1965 1966 1967 1968 1969 1970 1971 1972 1973 1974 1975 1976 1977 1978 1979 1980 1981 1982 1983 1984
17 18 22 22 23 23
-24- 24 25 26 27
-26- 26 27 32 33 34
-31- 31 33
-37- 38 45 63 57 61 65
-69- 84 97
100 91 84 78 74
. . .
. . .
. . .
. . . 22 23 23 25 22 26 27 27 26 25 31 33 34 31 31 31 38 37 44 57 60 60 66 66 81 95
103 94 90 80 75
. . .
. . .
. . . . . . 23 23 24 24 26 26 27 26 25 25 32 33 35 31 31 33 38 38 45 63 59 63 65 68 81 95
101 91 86 78 77
. . .
. . .
. . .
. . . 23 23 24 24 26 27 27 25 26 28 32 35 34 31 30 34 36 38 46 67 54 60 63 69 84 98
101 85 82 76 72
. . .
. . .
. . . . . . 23 23 23 23 26 25 27 25 26 29 33 33 31 31 31 34 36 40 47 66 55 63 64 73 88
101 96 91 80 76 70
-43-
Commodity index - Beef
(1980-100)
1950 1951 1952 1953 1954 1955 1956 1957 1958 1959 1960 1961 1962 1963 1964 1965 1966 1967 1968 1969 1970 1971 1972 1973 1974 1975 1976 1977 1978 1979 1980 1981 1982 1983 1984
I 11 I 13 I 17 I 18 I 19 I 19
-19- i 19 I 22 I 25 I 26 I
-25- 25
i
25 I 33
l I
34 33
-3O- 30 33
-38- 40 48 63 55 57 60
-65- 83
101 100
91 86 84 79
. . .
. . .
. . .
. . . 19 19 19 19 18 24 26 26 26 24 30 34 34 31 30 31 38 39 45 60 59 56 62 62 80
100 106 95 90 86 80
. . .
. . .
. . .
. . . 19 19 19
:‘2 26 27 25 24 25 34 34 35 30 30 33 38 40 47 64 58 58
:i 81
100 100
93 88
. . .
. . .
. . .
. . . 19 18 19 19 23 26 26 25 25 26 33 37 33 30 30 34 37 39 49 64 51 54 59 64 83 98
100 87 .84 82 78
. . .
. . .
. . .
. . . 19 18 19 19 23 24 25 25 23 26 33 33 30 31 31 33 37 41 51 65 51 59 59 68 88
105 96 90 83 81 .76

Commodity index - Pork
(1980-100)
I’. I I
f Year I kurU8l
I Quarterly Indexes
‘! i
-----------U------------------------------------~---
Indexer i J-X ; A-J 1 J-S ; O-D ; ------N_- a--------- --I---w----- ------------- ------------ -----------
1950 1951 1952 1953 1954 1955 1956 1957 1958 1959 1960 1961 1962 1963 1964 1965 1966 1967 1968 1969 1970 1971 1972 1973 1974 1975 1976 1977 1978 1979 1980 1981 1982 1983 1984
23 27 31 29 29
-;;- 31 30 29
-fX-
ii 31
ii -340
33 36
-41- 41 49 69 62 73 78
-82- 91 96
100 87
f5 69
. . .
. . .
. . .
. . . 28 29 31 33
3: 28
ix 28 39 30 35 33 33 33
ii
:t 65 70 80 78 93 94
103
x: 79 69
. . .
. . .
. . .
. . . 30 28 32 31 30 28 26 28 28 25 27 28 34 33 35 34 42 39 48 68 61 73 77
8’: 91
101 81 83 72 73
. . .
. . .
. . .
. . . 29 28 32 30 30 29 28 28 28 31 29 31 38 39 32 38 40 42 48 77 57 72 77 83 89 98
103
t3 70 70
. . .
. . .
. . .
. . . 29 33 31 29 31 29 31 28 31 31 30 33 36 33 31 40 39 45 51 73 65.w. 76 77 87 93
103 94 ., 98 83 71 66
Commodity index - Bacon i
. . : *. (1980-100)
I I I
I Year I I Quarterly Indexes I
i Annual , ---------------------------------------------------- I
i Indexes I J-X ; A-J : J-S ; O-D ;
I ----------- ------------ -------------- ------------- ------------ ----------- I
1950 1951 1952 1953 1954 1955 1956 1957 1958 1959 1960 1961 1962 1963 1964 1965 1966 1967 1968 1969 1970 1971 1972 1973 1974 1975 1976 1977 1978 1979 1980 1981 .1982 1983 1984
25 29 31 28 28 29
-310 28 29 27
.27 -26-
25. 27 29 29 32
-3l- 27 29
-310 30 36 55 57 73
-g- 75 90
100 89 86 71 68
. . .
. . .
. . . . . . 29 27 29 30 26 28 24 26 26 25 31 27 31 33 27 27 31 26 34 47 54 72 78 56 70 82
100 99 94 75 67
. . .
. . .
. . .
. . . 28 27 31
z 26 25 29
f : 29 28 33 31 26 29 31 29 36 56 58 76 77 57 71 86
100 92 87 69 74
. . . . . . . . . . . . 28 27 31 28 29 28 29 25 24
i’o 29 33 31 28 29 32 31 36 57 56 72 58 61 77 97
101 83 8i 67 67
. . .
. . . . . . . . .
28 32 31 26 30 27 31 25 26 31 29 30 33 30 28 31 31 36 38 61 58 73 60 ‘65 81 96 99 83 83 72 65
-460

Commodity index- Xutton and lamb
(1980-100)
I I I t Quarterly Indexes t
I Year i Annual i ----------------------------------------------------- I I I Indexes I J -N ; A-J I J-S ( O-D 1
1950 1951 1952 1953 1954 1955 1956 1957 1958 1959 1960 1961 1962 1963 1964 1965 1966 1967 1968 1969 1970 1971 1972 1973 1974 1975 1976 1977 1978
; 1979 ‘. -1980
1981 1982 1983 $984
14 15 17 19 21 23
-23- 25 23 19 22
-2o-
i: 25 27 26
-25- 23 2?
-27- 27 35 56 54 50 53
-63- 80 88
100 100
88 71 66
. . .
. . .
. . .
. . . 19 22 24 25 23 22 21 21 19 21 22 29
25” 25 26 27 27 35
58 51 51 61 72 83 94
103 100
65 69
. . .
. . .
. . .
. . . 20 23 23 26 21 20 21 20 19 20 24 27 26 24 23 25 28 27
2: 56 52 51 61 73 89
106 111
93 71 73
. . .
. . .
. . .
. . . 20 24 22 25 23 18 23 18 23
;‘7 27 27 24 22 26 28 27
;ft 51
2 63 84 92
103 88 86 74 63
. . .
. . .
. . .
. . . 24 23 23 24 24 18 23 19 23 24 29 27 24 25 23 28 27 28 35 64 50 49 56 68 89 87 99 99 73 74 59
-47-

Commodity index - Poultry
(1980-100)
I I I
i i i Quarterly Indexes I
Year Annual ----------------------------------------------------- ! i 1 Indexes i s-n : A-S 1 s-s O-D
1961 1962 1963 1964 1965 1966 1967 1968 1969 1970 1971 1972 1973 1974 1975 1976 1977 1978 1979 1980 1981 1982 1983 1984
-370 40 42 42 46 45
-39- 41 42
-42- 41 46 70 62 70 77
-819 85 96
100 86 72 68 67
i i . . . . . . I . . . i . . . i . 47 . .
i 39 I 39 I 41 f 45 t 40
i 2; 1 62 I 68 I t 74 I 79
i 83 92 i 103
i 92 80 I 68 I 71
i I . . .
i . . . . . . I . . . I ! . . . I 42 I 39 t 39
i 41 44 I 39 i 45 I 67 I 63 f 71 I 75 I 79 I 81 i 103 92
I 87 1 75 I 69 I I 69
. . .
. . .
. . .
. . .
. . . 41 40 42 43 43 42 47 83 61 71 78 82 87
100 101
80 70 64 65
. . .
. . .
. . .
. . .
. . . 38 39 42 44 37 42 46 71 63 71 80 83 88 99 93 84 63 70 64
.
. ,
:’ .

Commodity group index - Dairy products
(1980-100)
I 1 I Quarterly Indexes I
I Year I Annual ! ----------------------------------------------------- I
I I Indexes i J -X 1 A-J ; J-S 1 O-D t ;------- ------------ -------------- ------------- ------------ ----------- 1 I
1950 1951 1952 1953 1954 1955 1956 1957 1958 1959 1960 1961 1962 1963 1964 1965 1966 1967 1968 1969 1970 1971 1972 1973 1974 1975 1976 1977 1978 1979 1980 1981 1982 1983 1984
24 26 28 27 25 26
-26- 25 23 24 24
-22- 22 24 24 27 27
-28- 26 26
-27- 38 44 50 56 66
-f4- 85 92
100 90 88 83 74
. . .
. . . . . . . . .
25 25 27 24 22 23 24 22 22 24 23 27 27 28 27 26 27 33 46 44 51 68
4: 83 93 99 94 90 87 79
. . .
. . .
. . .
. . . 24 24 25 24 21 22 22 22 22 23 24 27 27 28 26 26 27 35 44 48 56 68 63 70 82 89 99 88 88 84 77
. . .
. . .
. . .
. . . 25 26 26 25 22 25 24 22 22 24 25 27 26 28 24 26 27 38 42 53 56 63 65 72 86 91
103 84 86 80 71
. . .
. . .
. . .
. . . 26 30 26 25 25 28 24 22 24 25 27 28 28 28 25 26 28 44 42 53 61 64 69 77 91 94 99 93 86 80 69
-49-

Commodity index - Butter
(1980=100)
I I I Indexes I Year I Annual (
Quarterly I ----------------------------------------------------- I I Indexes 1 J-X 1 I
+------- ------------ -------------- A-J ; J-S ; O-D ;
------------- ------------ ----------- I 1
1950 1951 1952 1953 1954 1955 1956 1957 1958 1959 1960 1961 1962 1963 1964 1965 1966 1967 1968 1969 .l970 1971 1972 1973 1974 1975 1976 1977 1978 1979 1980 1981 1982 1983 1984
17 17 20 20 19 20
-19- 16 14 19 17
-15- 17 19 20 20 18
-18- 16 16
-16- 39 39 43 45 56 58
-65- 79 90
100 91 88 82 71
I I . . . I . . . I . . . I . . . I 20 I 20 ! 20 I 16 I 13 I 16 I 19 I 16 I 17 I 18 I I 21 I 21 I 19 f 18 I 16 f 16
I I
:f I 48 I 41 I 41 I 56 ! 56 I 61 I 75 I 89 ! 97 I 96 I 89 I 85 ! 78
. . . . . . . . .
.‘. . . . . . .
. . . . . . . . .
. . .
19 19 17 17 12 17 16 15 17 18 20 20 18 18 16 16
if 47 43 45 58 57 63 76 90 99 91 89 84 72
. . .
:; 18 17
:; 16 15 18 20 20 19 18 18 16 16 16 41 41 44 45 55 58 66 80 91
104 86 88 81 67
. . . 19 22 18 16 16 22 16 16 18 21 21 19 18 17 16 16 17 45 40 42 48 55 59 70 85 91
101 92 86
-5o-

Commodity index - Milk
(1980=100)
i i i Quarterly Indexes .- f Year I Annual I-------------------------------------------------~---
f 4 Indexes I J -N 1 A-J 1 J-S 1 O-D 1---------- ------------ -------------- ------------- ------------ --------y-- i I I 1950
195’1 1952 1953 1954 1955 1956 1957 1958 1959 1960 1961 1962 1963 1964 1965 1966 1967 1968 1969 1970 1971 1972 1973 1974 1975 1976 1977 1978 1979 1980 1981 1982 1983 1984
23 27 28 26 23 23
-24- 25 23 22 23
-2o- 19 18 21
Xf -29-
25 25
-29- 35 43 49 60 71 67
-72- 85 93
100 93 95 90 82
. . .
. . . . . . ..* 23 23 24 25 24 21 24 21 19 18 16 25 27 29 29 25 29 31 46 44 53 74 67 70 82 92 99 97 97 97 85
. . .
. . .
. . .
. . . 23 22 23 25 23 21 23 20 19 18 18 24 26 28 27 25 29 33 43 47 61 74 65 71 82 90
100 90 96 92 85
. . .
. . .
. . .
. . . 22 22 24 25 23 21 22 19 19 18 22 23 25 28 23 25 29 35 42 53 62 68 66 73 85 93
104 88 93 86 79
I I I I I I
I
I
i I
f
I
I I I I I
i I I
I
I
I
I I I I I I I
I
I
f I I I I I I
I
I
I
I
I
I
. . .
. . .
. . .
. . . 21 23 25 25 23 23 22 19 19 19 23 23 28 30 23 27 29 42 41 52 66 67 70 76 90 97
100 99 95 85 77
-1
I
I
I
-51-

Commodity index - Cheese
(1980-100)
I I I Quarterly Indexes I I Yqar i Annual I ----------------------------------------------------- I I I Indexes I J-H I A-J ; J-S : O-D 1 I----- ------------ -------------- ------------- ------------ -‘-w------w- I
i 1950 1951 1952 1953 1954 1955 1956 1957 1958 1959 1960 1961 1962 1963 1964 1965 1966 1967 1968 1969 1970 1971 1972 1973 1974 1975 1976 1977 1978 1979 1980 1981 1982 1983 1984
22 23 25 24 23 26
-270 25 23 26 25
-25- 26 27 28 30 30
-32- 31 32
-7o- 71 60 52 60 71 70
-78- 93 93
100
ii 76 68
. . . . . . . . . . . . I
. . . . . . . . .
. . . . . . . . .
. . . 23 23 28 28 22 26 26 25 26 26 28 30 31 32 31 31
5; 55 46 54 73 70 74 89 97
101 89 84
. . . 23 24 26 26 21 25 24 25 26 26 28 30 30 33 30 31 68 74
fi
f X 67 76 88 90
100 82 82 77 72
. . . 23 26 28 29 21 26 25 24 25 26 28 30 31 33 30 32 69 68 59 55 59 68 69 78 93 91
102 78 78 74 66
. . . I
. . . f i . . .
23 i 28 : 27 f 23 f 28 ; 28 : 25 f 25 : 26 ; 28 : 30 1 30 : i 32 ( 32 ; 31 ! 33 I 75 : 69 ; 65 ; 55 ; 65 f 69 i 75 ! 84 i
101 ; 94 ) 96 1 87 f
-52-

Commodity index - Eggs
(1980-100)
i I I Quarterly Indexes I I I Year I Annual I -----------------------------------------------------
t i Indexes i .’ J-H ; A-J ; J-S 1 O-D ;
1950 1951 1952 1953 1954 1955 1956 1957 1958 1959 1960 1961 1962 1963 1964 1965 1966 1967 1968 1969 1970 1971 1972 1973 1974 1975 1976 1977 1978 1979 1980 1981 1982 1983 1984
51 58 62 60 55
-;“7- 55 52 47 49
-5O- 46 58 47 62 51
-52- 50 50
-39- 47 51 77 71 66 78
-84- 80 87
100 92 76 76 76
. . .
. . . . . . . . .
51
ii 45 51 45 41 48 41 66
t’g 51 51 47 55 39 45 55 57 79 69 78 90 89 88
104 101
88 76 94
. . .
. . .
. . .
. . . 45 50 53 46 49 40 43 51 44 52 43 56 47 47 48 49 39 39 49 70 68 65 69 78 77 81 95 90 74 71 78
. . .
. . .
. . .
. . . 56
ti 60 51 47 53 54 44 59 45 65 50 54 50 47 39 46 46 83 63 61 76 81 76 83 96 84 68 72 66
. . .
. . .
. . .
. . . 71 74 60 66 57 55 59 47 53 53 53
.E 57 57 48 39 60 53 98 74 68 89 86 80 97
103 93 73 83 64
-53-
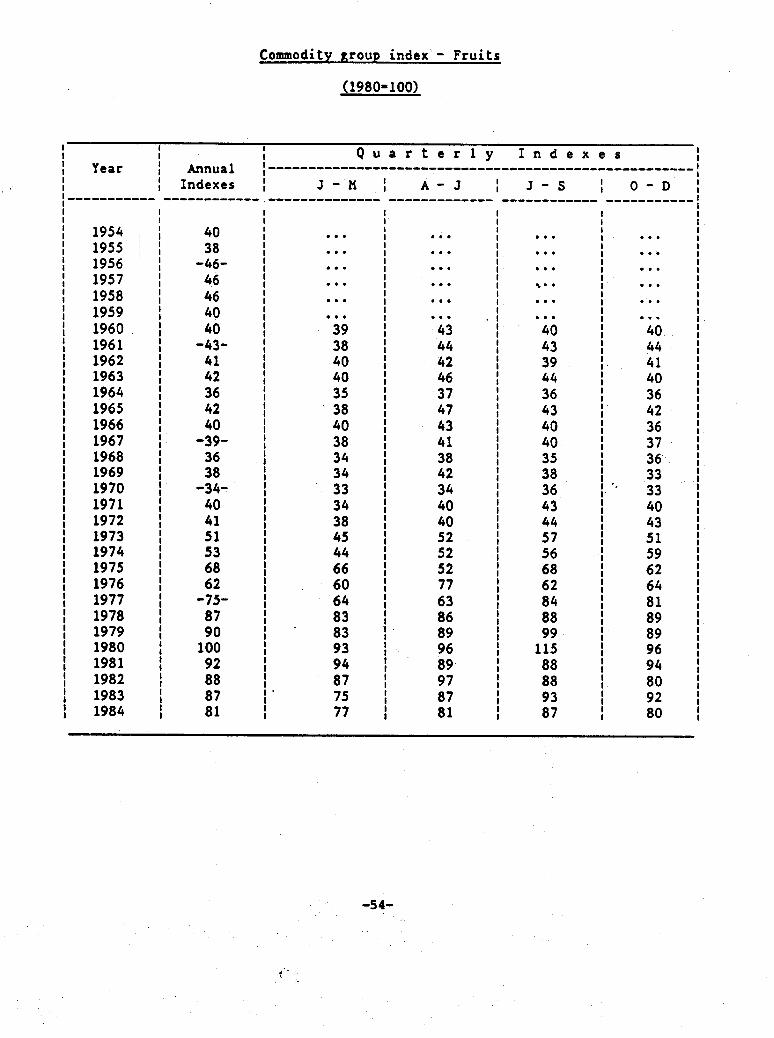
Commodity group index’- Fruits
(1980=100)
I I I Indexes I Year I
Quarterly I Annual ( -----------------------------------------------------
I I I
Indexes i ~--------
J-.H f A-J 1 J-S ( O-D I ------------ -------------- ------------- --------w-w- ----------- f
1954 1955 1956 1957 1958 1959 1960 1961 1962 1963 1964 1965 1966 1967 1968 1969 1970 1971 1972 1973 1974 1975 1976 1977 1978 1979 1980 1981 1982 1983 1984
40 38
-46- 46 46 40 40
-43- 41 42 36 42 40
-39- 36 38
-34- 40 41 51 53 68 62
-75- 87 90
100 92 88 87 81
. . .
. . .
. . .
. . . . . . . . .
39 38 40 40 35 38 40 38 34 34 33 34 38 45 44 66 60
f i 83 93 94 87 75 77
. . .
. . .
. . .
. . .
. . .
. . . 43 44 42 46 37 47 43 41 38 42 34 40 40 52 52 52 77
t: 89 96 89 97 87 81
. . .
. . .
. . .
. . .
. . .
40 43 39 44 36 43 40 40
ii 36 43 44 57 56 68 62 84 88 99
115 88 88 93 87
. . . 40 44 41 40 36
:: 37 36 .33 33 40 43 51 59 62 64 81 89 89 96 94 80 92 80
-54-

Commodity group index - Citrus Frui to
(1980=100)
I I ! Quarterly Indexes I Year i
I Annual I ----------------------------------------------------- I
I I Indexes I J-H 1 A-J i f--S 1 d-D i ;--------- ------------ -------------- ------------- ------------ ----,------, I I I I I I I
-3o- ; 27 j I I I
I 1970 ; 29 I 32 I I I 1971 I 1972 I 1973 I 1974 I 1975 f 1976 I 1977 I 1978 I 1979 I 1980 I 1981 I 1982 I 1983 f 1984
I 38 I 30 f 37 i t
43 I 36 I 32 i 32 39 t 47 I 40 ; 43 I 52 I 50 I 43 1 48 I 50 f 62 I 56 ; 63 1 63 : 56 I 54 1 55 I 57 I -64- I 50 1 60 1 I 73 I I 77 77 I I I I 97 97 I I I I 100 100 I I I I 92 92 ; ; I I 83 83 I I I I 83 83 I I I I 77 77 I I I I
33 j 40 ; 40 1 54 1 57 1 66 1 61 1 71 1 I
65 ; 65 I 84 I I 92 1 79 f 94 I 116 ! I 99 1 94 1 96 I 108 : 101 1 92 1 84 I
I 94 I I 98 1
76 f 79 I 72 ) 77 I
94 I 82 ; 91 I I I 91 1
60 I 66 I I 94 f 87 1
-55-
,

. ’
Commodity index - Oranges
(19801100)
I t I Quarterly Indexes I
i Year I A!lnur1 ; ---------------------~~~~~~~~~~~~~~~~~~~~~~~~~~~~~~~~ I
i i Indexes I J -X : A-f ; J-S t O-D :
----------- w-0-0-0a-0 - --------- u_--0-u---- ------------ ----------- i i I 1970 I 1971
i 1972 1973 I 1974 i 1975 I 1976 I 1977 I 1978 I 1979 I 1980 I 1981 I 1982
i 1983 1984
I I -29- f 37 I 31 I 47 I 51 I. 64 I 63 i -69- I 80 I 99 I 100
i 94 87 I 85 I 83
I I 26 I 31 i 28 I 40 I 44 I 59 t 60 I 55
i 70 82 I 95
i I
;;
i 77 60
i
I
I 27 i , 36
‘28 44 50 67 63
2 99 96 87 83 82 69
29 41 32 51 52 62 62 72 86
118 107 97
102 88
105
33 38 36 52 56 68 66 76 95 96
101 100 86 93 97
-56-

I I I .Year I Annua 1 I I Indexes )------ ------------
I I I 1970 1 -33- I 1971 ; 41 I 1972 ; 54 I I 1973 ; 56 I 1974 : 52 I 1975 ; 67 I 1976 ; 47 I 1977 ’ : -620 I 1978 1 66 t 1979 ; 94 f 1980 ; 100 I 1981 ; 88 i 1982 f 63 i 1984 1983 : ; 53 76
Commodity index - Lemons
(1980=100)
:
I I Quarterly Indexes I 1 I ------------------------------;-,-,,,,,,------------- I
I I J-H ; A-J f J-S 1 O-D j -------------- ------------- I I
B-B--------- -----------;
I I I I I I 28 1 30 I 38 I 34 ; I 29 : 34 I 51 1 49
I 1
45 I 72 I I 55 1 2 1 46 I 68 I I 70 ;
51 ; 44 I I 48 I 65 (
; 54 55 I 87 I I 70 44 1
1 36 I 55 I I 52 ;
40 ; 64 I 68 I 63 ;
1 51 53 1 73 f 88 77 1
; 86 I 104 110
1 ;
99 96 1 101 i I 104 1 92 ; 78 I 87 I
67 1 58 t 60 I 96 1
I 67 1 59 I 101 I I 89 1
49 I 53 I I 56 1
-57-

Commodity index - Grapefruits
(1980=100)
I I I Quarterly Indexes I I Year t Annual I ----------------------------------------------------- I I I I Indexes , J -II 1 A-J : J-S ; O-D I I -s--w------ ---------s-s -------------- ------------- ------------ ----------- I
I
i I I f I
1970 1 -29- t 24 1 30 i 32 I 31 I f
I 1971 ; 34 I 26 ; 34 I 40 I 35 : I 1972 f 33 I ; ! 1973 : 33 ;
:‘o I 33 I 32 I 33 I 29 I 33 : 39 :
I 1974 ; 37 I 30 I 34 I 39 I 44 I 1975 ; 40 I 37 f 77 I 37 I 43
; :
f 1976 : 34 I ; I 1977 : -39- 1
35 [ 29 i 29 1 40 35 36 I 40 I 47 54 i 60 t 84 ! 75
; I 1978 ; 68 t ; f 1979 ; 88 I ; I 1980 ; 100 I
64 75 i 118 ! 95
i 1981 ; 82 I 82 i 93 129 I 97 I
I 1982 : 80
1983 1984 : f 78 74
i 83 78 I I 83 I 84 ;
:
i i
69 j 79 i 95 I 78
63 64 i 71 73 I 97 87 I I 83 73 ; ;
-58-

Commodity group index - Other Fruits
(1980-100)
I I I Indexes I I I Year ( I
Quarterly Annual ----------------------------------------------------- I I
i I I Indexes , J -I! I A-J 1 J-S 1 O-D )
------------ I ----------- -------------- ------------- ------------ ----------- I I I 1970 j
I I t 39 ; 40 41 i 33
I
i -39- ;
1971 ’ :;
I 38 t 43 : I 42 I 38 1 1
I 1972 ; I 43 f 50 I 46 I SO t 1 t 1973 1 54 f 50 1 61 I 61 t 45 1 I 1974 ; 56 I 45 1 57 I 63 1 I 60 I 1975 : 74 I ^ 75 1 93 I 73 I I 57
f
! 1976 ; 67 : 66 I 71 I 66 I 66 1
78 1 82 I I 94 I I 91 1
i 1977 ; -86- f 1 I 1978 t 97 I ; f 1979 ( 83 I
101 ; 107 I 93 I 87
1980 *; 100 ( 86 1 84 I 81 I 79 1
I 1 I 1981 I 91 :
92 1 96 i 122 I 92 97 1 95 83 1 91 ;
i 1982 1983 f : 94 91 : I 99 78 1 1 115 97 I I 81 96 I I 92 78 94 ; 95 I I 80 I I 73
1 f I 1984 ; 86 I 1
-59-

Commodity index - Bananas
(1980-100)
I ’ 1 I
I Year ; kmual I Quarterly Indexes I
i -----------~----u----~~~~~~~~~~~~~~~~~~~~~~~~~~~~~~
t i I
Indexes J-H ; A-J : J-S O-D ~.----
1 : -0---------- -e------------ ----------I-- ------------ -----------
I f I I
I I
1970 ( I I !
-410 f 45 ; 45 38 36 I
I ; ; 1971 1 36 ; 37 ; 36 34
i 1972 ; 38 ;
I ( :
40 39 ; 44 I 40 I 39 ; I 1973 ; 42 I 40 ; 45 I 44y 41
) I ; ;
I 1974 49 42 ; 53 I 53 49 ; :
I ; I 1975 64 65 ; 56 60 I 1976 :
77 : t I
; -9t 63 :
; 67 I 64 63
I 1977 ; ; 1
73 : 78 ; 66 65 : 1
; ; I 1978 73 77 ; 84 : 62
t ; I 68 ;
I 1979 83 77 ; 93 I 82 : 80 ; ;
I I 1980 100 104 ; 107 I 95 ; 95 ;
I 1981 ; 104 1 112 : :
114 .I 91 ;
t 99 : I 1982 97. 106 84 82 I 1983 :
1 116 I 1
) ( 112 100 ; 133 I 115 I 100
; (
I 1984 95 ; 102 ; 110 ; 92 I 78 f h.
i ,
-6O-

Commodity index - Apples
(1980-100)
I t 1 Quarterly Indexes I I
i Year I AnnU81 ; -----------------------------------------------------~
I I Indexes I J-H f A-J ; J-s 1 O-D ;
! 1970, 1 1971 ; 1972 ; 1973 : 1974 ; 1975 ; 19.76 ; 1977 ; 1978 : 1979 ; 1980 ; 1981 : 1982 ; 1983 : 1984 ;
121 f 82 :
I
32 47 51 77 56
107 69 80
129 74 86 76
115 61 80
1 i 41 I 47 1 59 I 78 I 68 I 90 I 65 I 124 1 123 I 80 I 149 I 75 I 79 i 68 77
-61-

Commodity group index - Animal Feed
(1980-100)
1971 1972 1973 1974 1975 1976 1977 1978 1979 1980 1981 1982 1983 1984
-37: 37 49
110 69 57 76
-9o- 85
100 100
83
:; 74
! I 36 I 38 I 44 ! 134 i 58 I 54
37 39
,40 90 83 56
;; 84 92
101 89 84 93 81
i I 73 I 112 f 81 I 101 I 98 I
i zi
I 92
I 79
I I : 39 ; 38 : 37 ; 36 f 47 : 65 ) 125 ; 91 ; 66 ; 70 ; 59 ; 59 : 85 : 87 ; 75 f 78 : 84 : 90 ; 104 f 101 ; 103 ; 98 : 78 : 83 ; 85 f 87 ; 86 ; 85 ; 71 ; 66

Commodity index - Fishmcal
(1980= 100)
I I Indexes I
I i Quarterly I
Year f i
Annual I-----------------------------------------------------l Indexes I
f---------- J-H ; A-J 1 J-S 1 O-D j
------------ -------------- ------------- ------------ -----------I
I I I I I
I 1970 ; I I I
-39- : 38 ; 38 I 39 I I 1971 ; I
I 39 34 37 34 I 32 32 j
I 1972
;
1
1 I 43 : 32 ; 37 I 45 60 I
: 1973 ;
I I
107 I 81 ) 114 I 121 112 i I 1974 ; 75 I 102 1 74 I
I I 60
I 1975 : I I
50 ; I 64 i
48 I 1976 1 46 ; 76 I 58 ; 72 I 49 I 58
I 1977 ; -92- ; 91 1 99 I
83 f 90 i
85 91 I I 1978 ;
f 83 I 87 1 85 I
I 82 I I
I 1979 ; I I 78
80 79 1 76 I
I ( I 81
f I 1980 85 i
100 101 1 97 97 I I
I 1981 : I 103
95 I 109 ; 102 I 89 I I 1982 : t I I 81
73 ! 72 I 76 j
I
I 1983 1. I
90 87 I x7. 96 ’ I 1984
: i6’ ; : I 73 I 84 1 75 I I 66 I 64 i
.; ’ .
-63-

Commodity index - Oilsttd coke and meal
(1980-100)
I I I I Year I I
Quarterly Indexes I -----------------------------------------------------
i i Annual
i I
Indexes J-M ; A-J ; J-S : O-D ;
1950 1951 1952 1953 1954 1955 1956 1957 1958 1959 1960 1961 1962 1963 1964 1965 1966 1967 1968 1969 1970 1971 1972 1973 1974 1975 1976 1977 1978 1979 1980 1981 1982 1983 1984
28 32 36 35 35 33
-320 28 28 32 31
-31- 34 36 35 36 40
-39- 38 37
-4o-
z: 121
73 64 83
-98- 88 97
100 102
92 105
83
. . .
. . .
. . . . . . 34 34 32 31 26 31 33
3: 35 36 35 37 39 37 37 39 42 47
101 83 63 67
109
it 89
110 97
104 96
. . .
. . .
. . .
. . . 34 32 32 28 26 30 32 32 33
2 35 39 37 37 37 38 42 50
153 57 62 79
126 88
101 84
1.09 96
101 91
. . .
. . .
. . .
. . . 35 33
25 30 32 32
3: 37 34 37 43 39 39 37 42 43 52
137 74 67 92 77
Xi 106
ii 108
76
. . . . . . . . . . . . 36 34 32 25 32 34
-30 .3L
37 37 36 37 40 37 37 37 41 41 72 90 78 64 93 79 93 94
122 91 87
109 69, 1
-640

Commodity index - Fish
(1980-100)
j I I QuaCterly Indexes I I I year ; -Annual I-----------------------------------------------------~
I ! Indexes I J-W ( A-J 1 J-S 1 O-D 1
I 1950 ; 1951 ; 1952 1 1953 ; 1954 1 1955 f 1956 ; 1957 ; 1958 1 1959 ; 1960 ; 1961 ) 1962 ; 1963 ; 1964 ( 1965 ; 1966 f 1967 1 1968. f 1969 .e-. .I 1970 ; 1971 1 1972 1 1973 1 1974 ; 1975 1 1976 1 1977 ; 1978 I 1979 1 1980 ; 1981 ; 1982 ; 1983 ; 1984 :
13 13 14 14 15 14
-15- 15 16 16 16
-17-. 18 18 19 20 23
-22- 21 23
-27-
:: 51 60 50 66
-74- 90 95
100 96 88 80 77
. . .
. . .
. . .
. . . 15 14 15 15 16
if 17 18 -18 19 20 22 23 21 22 24
3: 44 ,63
:8” 74 a9 94 96 95 96 82 78
. . . . . . . . . . . . . . . . . . . . . . . . . . . . . .
14 14 15 14 15 16 16 17 18 la 19 19 22 21 21 21 25 30 37 49 61 50 63 67 87 91 99 96 93 85 79
. . . 15 15 15 15 16 17 16 17 la 18 19 20 23 18 la 23 28 30 38 51 57 48 69 74 92 95 99 94 a3 76 75
. . . 15 16 16 16 16 16 16 ia ia ia 19 21 24 22 21 26 30 32 41 58 59 50 74 81 92 99
105 99 ai 77 74
I I I I I I I I I I I I I I I I I I I I I I I I I I I I I I I I I I
I I I I I
I I I I I I I
I I I I I I I I I
1
I
I I I
-65-

Commodity index - Pepper
(1980-100)
I 1 I I Quarterly Indexer I Ye8r I Annual ; ---------------------~~~~~~~~~~~~~~~~~~~~~~~~~~~~~~~ i
I ) Indexes I J I
i--------- ---v--------
-I4 : A-J ; J-S ( O-D I -------------- ------------- ------------ -----------
I I I I I I I
I 1970 ; -640 ; 63 : 62 ; 65 64 i I 1971 ; 56 ; 56 : 57 ; 55
( I 55 :
: 1972 : 52 ; 51 ; 51 I 52 53 ; I 1973 ; 67 ; 62 ; 65 I 72
j
69 : I 1974 ; 92 ; 8: i x9 I 95
I 98 ;
I 1975 ; 94 ; ; ; 94 90 ; I 1976 ; 95. : 86 : 94 ; 92
i
I I ;;“2 I
i 1977. ; -1290 1 124 ; 133 t 128 I I 1978 ; 117 ; 134 f 122 I 105 105 ; I 1979 : 107 : 102 : 103 I 113
I 112 :
I 1980 ; 100 f 112 ; 99 ; 95 i
95 : I 1981 ; 79 ; 88 ; 79 ; 71 I 77 ; I 1982 : 75 t 81 ; 77 70 ; 72 ;
i 1983 1984 ; : 118 80 ; 1 120 79 ) 1 113 75
: I
1 117 76 1 I 120 90 : (
-66-

i
u~wu~~~~uuuu~*~*W~WOwww~ww~w~~~~~~~ i
~00w0~~~wG~O~~~rw~G~uuu~w~ou~u~uww~ I I I 1 ------------------------------------------------------------------------
i iw ------------------------------------------------------------------------ -- , I I Ll
In
uOwu~zfmuuuwknPbbWwWwwwwwww*w~~w:~ :: I I*1 I3
wPO~~r~~~~NNW~WOwu~~~uu~~w~u~~~~ l -0
lcnf
I &
I
IS
I Ix
------------------------------------------------------------------------ -- I ID
I I-
I I I --------------------------------------------------------------------------------

. Commodity index - Sugar
(1980-100) .
7 * .
..- , I I I - I I Quarterly Indexes i q Year I
Annual 1 -----------------------------------------------------
Indexes 1 J-X ; A-J ; J-S ; O-D
1950 1951 1952 1953 1954 1955 1956 1957 1958 1959 1960 1961 1962 1963 1964 1965 1966 1967 1968 1969 1970 1971 1972 1973 1974 1975 1976 1977 1978 1979 1980 1981 1982 1983 1984
16 18 15 13 12 12
-13- 17 12 12 12
-ll- 12 20 16 11 11
-ll- 11 13
-14- 16 26 35
105 72 41
-29- 28 35
100 61 30 30 20
. . . I i
. . .
I . . .
I . . . I . . . I 13 I 12 t 13
. . . . . . . . . i
. . . I
. . . I . . . I
12 1 12 I 13 I 15 12 i 12 I 12 I 11 I 12 I 18 t 12 f 10 I
10 i 11 I 11 I i3 I
I
. . . . . . . . . . . .
12 12 12 17 13 12 11 12 10 14 22
-11 11 10 11 13 12 17 30 33 49
117 50 31 30 29 69 88 44 23 25
. . . 12 12 14 14 13 12 12 10 13 25 11 10 10 12 12 13 15 17 28 38
165 48 28 26 30 48
125 44 23 31 16
i
i
18 12
I 11 I 11 i 12
I
i :: 17 i 11 i 11 I 12 i
i 11 14
I 14 I 16 I I 25
i 12
I 65 I 49 I 32 I 27 I 29 i 97 1 59 i
i
30 32
I 22
14 i
15 i 22 I 34 f
106 I 60 I 37 1 27 f 26 I 33 I I
111 I 52 I 24 I 37 I 16 f
I
-68-

Class index - Agricultural non-food
(1980-100)
I I I
I Year I Annual I Quarterly Indexes
i , -----------------------------------------------------
I Indexes i J-H f A-J 1 J-S 1 Ok I --e--e----- ---------- ------------- ------------- ------------ -----------
1950 1951 1952 1953 1954 1955 1956 1957 1958 1959 1960 1961 1962 1963 1964 1965 1966 1967 1968 1969 1970 1971 1972 1973 1974 1975 1976 1977 1978 1979 1980 1981 1982 1983 1984
39 55 39
l% 36
-360 36 32 33 34
-330 31
:3 33 33
-31- 31
$-
34 37
4: 61 68
-75- 80 96
100 93 82 86 90
. . .
. . .
. . .
. . . 36 36 35 37 33 32 35 33 32
ii 33 34 32 30 32 32 34
i: 77 62 61 76 75 91
100 99 85
it
. . .
. . . . . . . . .
36 36 36 36 32 34 35 33 32 32 33 33 34 32 31 33 33 33 37 57 73 60 65 81 79 96 96 95 85 84 96
. . .
. . .
. . .
. . . 36 37 36 36 31 34 33 33 30 32 32 33 33 30 30 32 32 34 37 68 72 61 72 72 81 98
102 90 80 89 86
. . .
. . .
. . .
. . . 36 36 37 34 31 34 32 32 31 33 33 33 32 30 31 32 33 34 41 69 68 59 74 71 86 98
102 87 e 77 90 85
-69-

Commodity group index - Fats, oils and oilrctds
(1980-100)
.
I I I ‘Annual I
Quarterly Indexes I I Year f ----------------------------------------------------- I I i Indexer i S-U .I A-J i S-S ; O-D ; I I ----------- ------------ I -------------- ------------- ---w--w----- -----a.-----,
I i 1950 I 1951 I 1952 I 1953 I 1954 f 1955 I 1956 I I 1957 i, 1959 1958
I 1960 I 1961 i 1962 ! 1943 I 1964 i 1965 ! 1966
i 1967 1968 I I 1969
i 1970 197.1 t i972 I 1973 1 I
1974 I 1975 I 1976 I 1977 I 1978 I 1979 I 1980 i 1981
i 1982 1983 t 1984
43 54 44 42 43 39
-42- 41 38
3: -37-
34 37 37 41 41
-37- 36 37
-43- 44 42 74
111 76 75
-9l- 97
109 100
96 80 91
109
. . . . . . . . . . . . 45 40 41 43 37 39 37 38 35 36 37 43 41 37 37 36 40 45 40 55
109 86 65 94 88
109 100 103
84 74
114
. . .
. . .
. . .
. . . 44 38 44 40 37 40 37 39 34 37
i3 40 37 38 36 43 43 42 66
105 73 69
113 100 113
91 102
86 80
122
. . .
. . .
. . .
. . . 41 38 41
:; 37 36 37 33 36 37 41 41 37 34 36 43 44 41 91
115 79 82 79 97
112 102
93 76
103 143
. . .
. . .
. . .
. . . 40 38 42 39 41 38 35 35 34 37 41 41 38 37 34 38 45 42 43 85
115 68 83 80
103 103 107
87 72
109 99
-7o-

Coamodity index - Soyabeans
(1980-100) ,
I I I I I Quarterly Indexes I
I Year I Annu81. f ---------------------------------------------------- I I I Indexer i J -H 1 A-J 1 J-S i O-D 1 +------ ----------w- u---------w- --------m---- -----------L ---------m- I I
1950 1951 1952 1953 1954 1955 1956 1957 1958 1959 1960 1961 1962 1963 1964 1965 1966 1967 1968 1969 1970 1971 1972 1973 1974 1975 1976 1977 1978 1979 1980 1981
-1982 .1983
I984
40 46 46 t3 48 37
-4o- 35 32 32 31
-37- 34 37 37 39 43
-39- 37 36
-4o- 43 47 79 92 73 77
-93- 90
101 100
96 83 94 96
. . .
. . .
. . .
. . . 49 41 38 37 32 32 31 38 34 37 38 41 40 40 37 38
37 43 45 67 89 79 63
100 84 99 94
104 86
103 80
. . . . . . . . . . . . . . . . . . . . . . . . . . . . . . 57 37 46 35 32 32 31 42
;‘7 36 40 43 40 38 37 39 42 48 70 77 71 72
122 97
103 88
102 88 84
108
. . . 48 34 37 36 32 31 33 36 33 37 36 37 46 38 37 34 41 44 46 98 95 77 87 74 88
103 106
89 80
105 88
. . . 42 35 37 34 31 31 32 34 34 39 39 37 41 37 36 35 43 44 49 82
106 66 87 78
2 113 , 68
77 108
84
-71-

Comodity index - Coprr
(1980-100)
\
I I I I I I I ‘Qurrterly Indexer I i I
Yew ‘- i Annurl f -r---~--i-------------~~~~~~~~~~~-~~~~~~~~~~~~~~~-~ t
I i hd8X88 i J -X ; A-J ) J-S ; O-D :
1 ,-,,A,,,-, ------------ -H------w---- -w------w-- -w-w------- -0----w--w I i
1950 1951 1952 1953 19s4 195s 1956 19317 1958 19s9 1960 1961 1962 1963 1964 196s 1966 1967 1968 1969 1970 1971 1972 i973 1974 1975 1976 1977 1978 1979 mo 1981 1982 1983 1984
ii 37 Sl 44 40
-380 39 48 60 48
-390 37 42 4s 50 42
-44- 51 45
-490 42
3;
149 57
& lo;4 149 100 a3 69
109 158
. . .
. . .
. . .
. . . s2 44 s’9 44 66 54
i: 40
;: 46 41 58 4s 51 48 31 . .
174: 73 45 94 89
150 123 90 73 69
163
. . . . . . . . . . . . 42
290 37 44 62 48
is 41 45 5S 41
2 42 52 43 32 .- 6S
166 S6 49
110 9s
160 94 84 74 94
174
. . .
. . .
. . .
. . . 40 39 36 39 47 s2 45 39 36 41 so 46 41 43 45 43 46 40 30 as
138 33 72 74
106 152 96 81 65
139 lS7
. . . i
. . . I
. . . I I
. . . 42 I
39 i 37 : 42 f
ix I’ i
44 37 39 . 1
45 i 4s : 47 ; 39 1 53 1 42 ; 49 : 49 ; 36 : 33 :
111 ; 113 ;
46 i 79 ; 80 ;
127 ; 134 I 88 ; 79 1 62 ;
13s 1 139 1
-720

Commodity index - Groundnuts
(1980=100)
, i
II ,a’ I Year I4 . Annual I
Quarterly Indexes I ------IIIIII---------------------------------------- I
I i f Indexes , J -li ; A-J : J-S ; O-D I ‘! t ---------- ------------ ----m-I------ ----a-------- ------------ ----------- I
1950 1951 1952 1953 1954 1955 1956 1957 1958 1959 1960 1961 1962 1963 1964 1965 1966 1967 1968 1969 1970 1971 1972 1973 1974 1975 1976 1977 1978 1979 1980 1981 1982 1983 1984
32 41 46 43 45 42
-44- 43 35 36
-;;- 35 34 38
iii -35-
31 41
-46- 51 53 76
110 93 85
-.l lo- 124 113 100 127
77 72 70
. . .
. . .
. . .
. . . 47 44
2 37 34 41 40 36 35 35 4i 39 38
’ 28 42 43 57 50 68 93
110 78
109 112 124 98
129 87
. . .
. . .
. . .
. . . 46 40 46 44 36 38 40 40 35 35 38 40 37 36 32 43 45 51 52 72
121 90 80
122 131 118
89 148
79 72 70
. . .
. . .
. . . l . .
44 43 43 39 34
3s” 37 34 35 37 41 38 34 31 39 46 48 52 88
114 91 84
108 126 112 100 139
7’: 70
. . .
. . .
. . .
. .*. 42 40 44 38 35 36
I 33 36 34 33 40 42 38 32 34 39 49 48 57 75
112 80 96
100 129
98 113
92
3; 70
-730

Commodity index - Soyabean oil
(1980=100)
I Year i Quarterly Indexes I
I i
Annual i
i I ----------------------------------------------------- I
Indexes , J -H ; A-J ; J-S 1 O-D : ----------- -B---------- -------------- ------------- ------------ ----w----w- I !
1954 1955 1956 1957 1958 1959 1960 1961 1962 1963 1964 1965 1966 1967 1968 1969 1970 1971 1972 1973 1974 1975 1976 1977 1978 1979 1980 1981 1982 1983 1984
52 46
-52- 48 41 35 35
-45- 36 36 37 45 47
-39- 33 37
-49- 51 42 77
143 99 76
-96- 103 112 100
87 76 91
123
I I t . . . ! . . . I . . . I . . . I . . . I . . . I 30 I 47 t 41 I 37 i 33 I 47 I 48 I 41 ! 36 I 36 i 50 44
I 44 i 49 I 125 I 120 I 66 I 94 I 95 I 110 I 100 I 91 ! 76 i 117 69
. . . . . . . . . . . . . . . . . . . . . . . . . . . . . . . . . . . . . . . . . . . . . . . .
33 49 37 37 33 44 47 41 35 34 48 49 44 68
122 98 66
120 109 110
92 88 ‘83 75
143
. . . 36 43 33 35 37 44 51 38 31 37 48 55 40
100 161 103
84 86
104 118 106
88 75
108 118
. . . 39 41 35 36 46 45 44 36 32 42 54 50 40 92
162 75 85 85
106 112 102
80 69
113 116
-74-

Commodity index - Olive oil
(1980-100)
I I I I Quarterly Indexes I I
-----------------------------------------------------
I Year I Annual 1
I Indexes I J -M 1 A-J 1 J-S 1 O-D 1
1950 1951 1952 1953 1954 1955 1956 1957 1958 1959 1960 1961 1962 1963 1964 1965 1966 1967 1968 1969 1970 1971 1972 1973 1974 1975 1976 1977 1978 1979 1980 1981 1982 1983 1984
17 25 18 19 17 20
-3o- 25 21 19 19
-18- 21 30 19 21 21
-22- 22 22
-23- 24 30 44 68 74 71
-72- 79 89
100 99 99 84 81
. . .
. . .
. . .
. . . 17
:‘: 28 21 18 18 18 18 34 17 21 21 22 22 22 22 23 27 38 62 71 76 73 78 86 93
108 99 87 86
. . .
. . .
. . .
. . . 17 19 31 26 21 19 20 18 20 36 17 21 21 22 22 22 23 23 28 44 70 69 70 73 74 89 95 97
103 86 88
. . .
. . .
. . .
. . . 17 20 30 24 21 20 19 18 21 27 20 21 21 22 22 22 23 24 34 46 71 79 71 70
30 92
105 90
101 81 79
. . .
. . .
. . .
. . . 17 23 27 21 21 19 18 18 24 21 21 21 21 22 22 21 23 25 33 49 70 76 70 73 83 89
108 101
95 84 72
-75

Commodity index - Palm oil .
0980-100)
i Year i
I
I Quarterly Indexes I
i i Annual , ----------------u----~~~~~~~~~~~~~~~~~~~~~---------- I
Indexes I J-H : A-J ; J-S : O-D ;
1950 1951 1952 1953 1954 1955 1956 1957 1958 1959 1960 1961 1962 1963 1964 1965 1966 1967 1968 1969 1970 1971 1972 1973 1974 1975 1976 1977 1978 1979 1980 1981 1982 1983 1984
f X 46
35 40
-44- 44 39 41
-g-
36 38 41 44 41
-400 29 32
-440 45 37 64’
115 74 69
-890 102 115 100
99 77 85
127
. . . . . . .*. . . . . . . . . . . . . . . . . . .
I : ..* I
. . . I
. . . . . . I 38 ; 41 ; 44 ; 41 ; 38 : 40 ; 38 : 38 1 35 : 40 ; 42 : 44 ; 40 ; 39 1 26 ; 40 ; 45 : 42 I 37 : 77 ;
131 I 66 ; 78 f 79 ;
108 ; 106 :
96 t 84 ; 62 ;
116 : 106 )
. . . 36 41 41 45 41 40 39 39 39 37 40 44 43 41 34 29 44 47 35 43
107 89 62 89 91
120 114 110
90 62
150
. . . 38
, 38 44 44 40 45 38 40 37 37 40 46 40 39 30 30 47
,~ 43 .38 56
103 68 62
111 101 119 101 107
87 - 70 146
. . . 38 39 44 43 37 39 38 38 35 39 41 44 41 40 26 30 42
i67 .j 81
117 73 76 80
109 115
90 94 69 91
105
-76:

Commodity index - Groundnut oil
i (1980-100) . .
! 1 I I
I Quarterly Indexes I i Year i AilnuiL f ---------------------~--------------~~~~~~------- I
i I Indtxos i J-H ; A-J 1 J-S 1 O-D j
2.. 1930 1951 1952 1953 1954 1955 1956 1957 1958 1959 1960 1961 1962 1963 1964 1965 1966 1967 1968 1969 1970 1971 1972 1973 1974 1975 1976 1977 1978 1979 1980 1981 1982 1983 1984
I I I ix I 55 t 51 I 51 I 45 I -52- i 49 I 43 I 40 I -42- 42
I . 38 I 38 I 41 I 42
i I
-g- I 33 I 40 I -42- t 49 I 46 I 63 I ‘ I 124 ” ! 92 ! ’ 81 I -99-
i : 129 105 I : 100 ; ! 125 1;. 69
. . . . . . . . . . . .
. . . . . . . . . . . .
. . . . . . . . .
; : 84 I 1 120
I I I I I I I I I I I I I
I
I I I I I
I I I I
I
I
I
I
I
I
I I I I I I I I
I I
! I I I I I
I
i I I I
I
I
. . . . . .
53 45 50 54 44 40 42 42 39 38 39 42 40 40 32 38 40
I 50 I 43
.53 i22 108
80 ioi 114 115
87 109 104 136 165
. . . 53 45 52 50 42 42 42 42 37 38 40 41 39 40 33 42 42 49 45 57
124 85 73
103 134 110
84 135
75 64
137
. . . 50 46 50 47 42 40 42 41 37 38 42 40 40 39 33 39 42 50 46 68
123 93 82 94
129 104 105 136 66
102 117
. . . 47 44 54 45 42 40 41 41 37 38 43 42 40 37 34 40 46 47 50 76
128 83 90 99
140 91
124 97 ‘55 113 105
. .
(:’
-77-

Commodity index - Coconut oil
(1980-100)
1950 1951 1952 1953 1954 1955 1956 1957 1958 1959 1960 1961 1962 1963 1964 1965 1966 1967 1968 1969 1970 1971 1972 1973 1974 1975 1976 1977 1978 1979 1980 1981 1982 1983 1984
53 61 37 50 44 36
-360 37 44 52 43
-350 33 37 41 47 40
-42- 52 44
-510 43 31 73.
161 63 63
-870 106 150 100 83 66.
107 182
. . .
. . .
. . . r;.
50 40
:: 42
ii 37 33 35 38 45 44
ii 44 51 46
..if 174
74 51 91
.89 143 124
79 70 74
159
. . . . . . . . . . . . f3 38 36
ii 45 ‘35 33 36 40 54 39 38 60 42 52 42 32 60
188 61 55
107 96
,169 94 82 72 90
172
. . . . . . . . . . . . 41
3:
14 48 40
ii 37 42
ii 42 47 42 50 45
f3 166
64 70 73
109 161
94 86 63
132 196
.
. . .
. . .
. . .
. . . 42 35 37 39 52 52 38 33 35 39 43 43
S”f 43 48 50 39 29
109 114 52 76 78
131 128
88 83 61
130 200
:

Commodity index - Linseeds
(1980-100)
t I i Quarterly Indexes I
I Year i Annual ----------------------------------------------------- t
f I Indexes i J -I’-! A-J i J-S 1 O-D y------- ---w-------w -------L---w-- ------------- ------------ -----------
1954 1955 1956 1957 1958 1959 1960 1961 1962 1963 1964 1965 1966 1967 1968 1969 1970 1971 1972 1973 1974 1975 1976 1977 1978 1979 1980 1981 1982 1983 1984
I I 41 I 49 I -41- I 41 I 41 I f 45 I 42 I -44- I 44 I 40 I 38
I I
3’f : ’ -38- t 41 I 38 I j -350 I 32 t 40 I ’ 100 I : 149 i j 113 I 93 1 I -8O- I ! 74 :I 99 I i 100 1 v 104 ’ : i ;
91 90
; 1 94 I
. . . . . . . . . . . .
. . . . . . . . . . . .
. . . . . . . . . . . .
. . . . . . . . . . . .
. . . . . . . . . . . .
. . . . . . 43 44 41 42 45 46 -40 40 40 38 40 38 36 36 36 36 42 42 40 40 35 35
.33 34 35 38 65 76
155 134 118 114
89 92 ,94 90 66 78 ?5 100 93 91
io4 108 97 97 80 79 99 95
. . . 43 48 44 38 40 37 36 41 42 40 36 31 38
129 152 133 100
3; 104 110 101
87 97 90
. . . 38 45 40 38 38 36 36 42 40 37 34 32 50
131 153 88 92 65 77 98
108 101
82 103
91
-79-
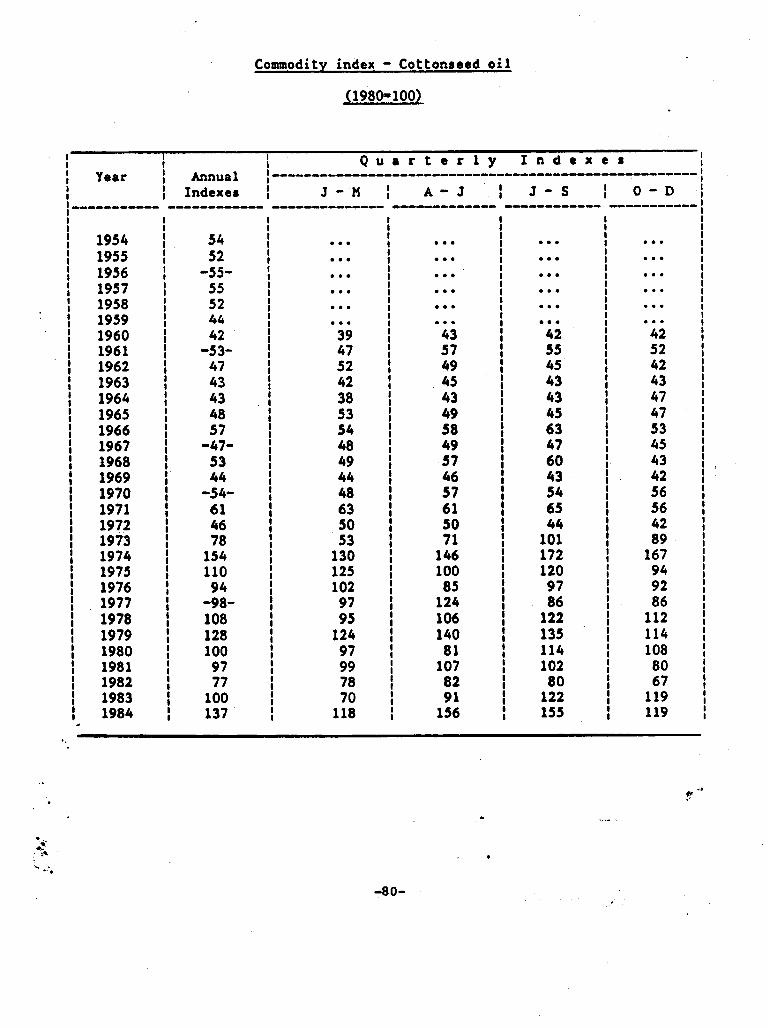
Commodity index - Cottonreed oil
(1980-100)
t I I Quarterly Indexes I I I Year , Annual 1 -----------------------------------------------------
i I
I Indexes f J-H ( A-J : J-S : O-D :
1954 1955 1956 1957 1958 1959 1960 1961 1962 1963 1964 1965 1966 1967 1968 1969 1970 1971 1972 1973 1974 1975 1976 1977 1978 1979 1980 1981 1982 1983 1984
54 52
-55- 55 52 44
-;23_ 47 43 43 48 57
-47- 53 44
-549 61
2 154 110
94 -98- 108 128 100
97 77
100 137
. . . . . . . . .
. . . . . . . . . i
. . . I
. . . . . . I
. . . I
. . . I
. . . I 42 ; 52 ; 42 : 43 : 47 f 47 ; 53 ; 45 ; 43 t.
2: i
56 ’ 42 I
89 i 167 ;
94 ; 92 ; 86 :
112 ; 114 : 108 (
80 : 67 ;
119 ; 119 ;
.
. . .
. . .
. . .
. . . 39 47 52
ii 53 54 48 49 44 48 63
ii 130 125 102
97 95
124 97 99 78 70
118
. . . . . . . . . . . . 5’3 49 45 43
f i 49 57
;“7 61 50 71
146 100
85 124 106 140
81 107
82 91
156
. . . . . . . . . . . . 25’ 45 43 43
di 47 60
ii 65
1:: 172 120 97 86
122 135 114 102
80 122 155
-8O-

Commodity index - Linseed oil
(1980=100)
I I I Quarterly Indexes I
I Year I I
I f
Annual I-----------------------------------------------------~
Indexes I J-N ; A-J 1 J-S / O-D 1
‘1950 1951 1952 1953 1954 1955 1956 1957 1958 1959 1960 1961 1962 1963 1964 1965 1966 1967 1968 1969 1970 1971 1972 1973 1974 1975 1976 1977 1978 1979 1980 1981 1982 1983 1984
46 59 59 35 28 31
-44- 36 35 33 34
-37- 33 28 31 28 25
-27- I 31 31
-3o- 26 27 76
153 101
76 -65-
65 104 100
92 73 68 88
. . .
. . . . . . . . .
31 27 40 39 36 32 34 35 36 28 31 30 27 25 31 32 30 28 27 39
154 114
73 73 51
104 100
95 77 57 71
. . .
. . .
. . .
. . . 29 31 45 34 35 30 34 36 35 29 31 29 25 24 31 30 31 25 25 46
146 111
74 82 67
111 97 95 79 60 81
I I I I I I I I I I I I I I I I I I I I I I I I I I I I I I I I
1 I I I I I I I I I I I I I I I I I I I I I I I I I I I I I I I I I I I I I I
. . .
. . .
. . .
. . . 28 33 45 33 36 33 35 40 33 27 33 28 25 28 31 32 30 26 27
100 151
96 87 60 61
107 96 90 73 78
100
I I I I I I I I I I I I I I I I I I I I I I I I I I I I I I I I I I I
I I I I I I I I I I I I I I I I I I I I I I I I I I I I I I I I
. . .
. . .
. . .
. . . 25 33 44 36 35 35 33 38 30 28 31 26 25 30 31 31 30 25 31
120 161
82 72 46 81 93
107 87 63 78
102
-8l-

. Commodity index - Palm ktrnel oil
(1980-100)
I I 1 I
Qurrttrly Indtxtr I I Ytor
i Annua 1 I
I ---------wIIII-------~~~~~~~~~~~~~~~~~~~~~~~~~~~~~~~ I
I Indcxts , J-l4 ; A-J ; J-S ; O-D ; t ,,,.i. ---- ----------- -0-0-0-0-00-w -0-0-0-0-0-0 e----L..----- -------v-o- I
1954 1955 1956 1957 1958 1959 1960 1961 1962 1963 1964 1965 1966 1967 1968 1969 1970 1971 1972 1973 1974 1975 a1976 1977 1978 1979 1980 1981 1982 1983 1984
42 37
-3a- 38 42 SO 44
-3s- 34 40 42 49 40
-37-
a: -48.
44 34 66
152 59
-xi- 106 146 100 87 67
105 155
. . .
. . . . . . .
. . .
. . .
. . . Sl 37 34 38
:: 44 37 57
43 48 48 36 42
172 76
iif 94
139 123
91 77 64
165
. . . . . .
. . . . . .
. . . . . .
. . . . . .
. . . . . .
. . . 44 35
ii 41 49 40 37 59 41 49 43 35
143 56 54
109 99
155 96 90 73
1;:
. . . 44 34 31 40 43 48 39 37 44 40 46 43 31 80
146
2 77
103 156
91 86 59
133 144
i . . . I . . . I . . . f . . . I . . . I . . . 38
32 . [
36 42
i
44 I 50 1
36 37
i
43 I 47 ; 50 ; 40 ;
33 80
i
116 .i
50 ; 76 ; 80 ;
127 ; 133 ) 90 ;
.
-820
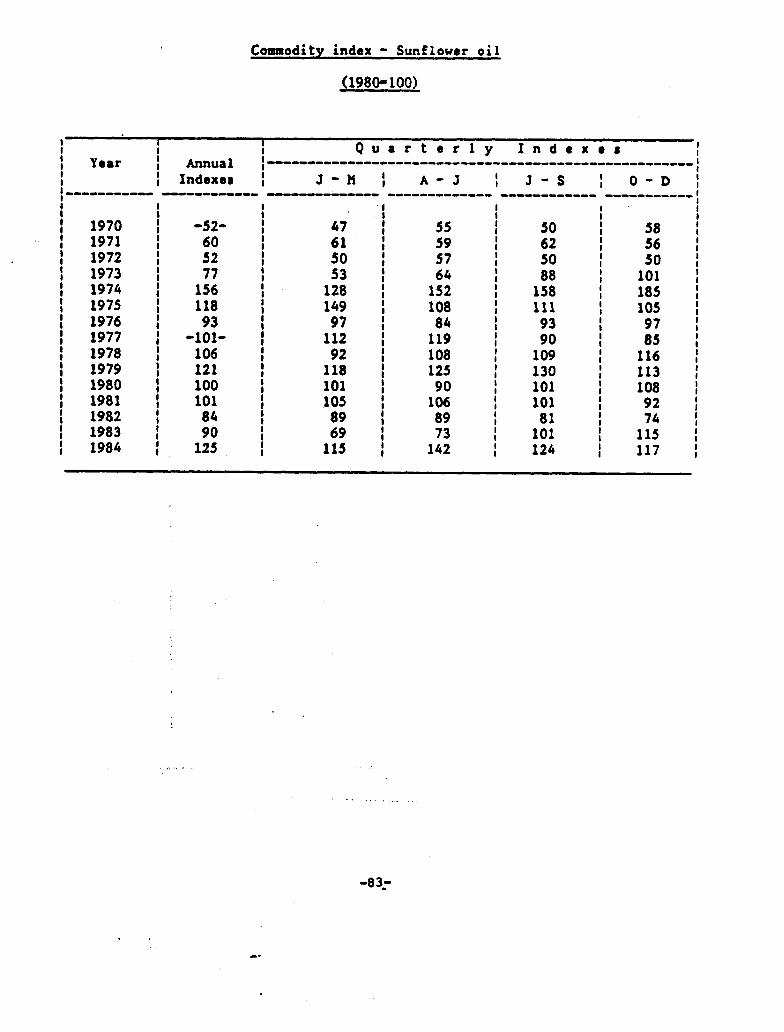
Commodity index - Sunflower oil
(3980-100)
I I I
: I I Quarterly Indexur I
I Year Annual ---------------------....o........................... t
I I Indexer i J -II 1 A-J 1 J-S ; O-D 1 i -0-0-0-0-0. ------a--- -0-0-------- ------------- ------------ ----------.
I I I
I I 1970 ;
I :
I I I -52- 47 55 50 I
I 1971 :
; 60 ;
; t 59
I 1972 t 52 I
4; ; I
I 62 ; ii f
57 ; so ; so I 1973 ; 77 ;
f 53 64 88 101
I ; I I :
1974 : 156 i 128 !
: 152 I 158 I 185 : 1975 ; 118 I 149 ; 108 I I I 1976 : 93 97 ; 84 ’ 111 105 1 93
I 1977 ; -lOl- ;
i I
112 119 I 90 8’3 f ; I 1978 : : 106 I 92 : 108 t I 109
I ) ! I
116 1
1979 121 118 : 125 I 130 I 113 I 1980 :
I 100 ; 101 : 90 t 101 108
I ;
1981 1 101 I I
105 ; 106 I 101 I 92 I 1982 : 84 t 89 89 I 81 I 74 I 1983 (
; 90 69 73 I 101 I
1 1 115
I 1
1984 ; ;
125 I (
115 ; 142 I I I 124 I 117 ;
. _
-83:
. .
0.

Commodity index - Animal fats and oils
(1980=100)
. . f I I Quarterly Indexes I
I Year I Annual i ----------------------------------------------------- I
I I I Indexes i J-X ; A-J ; J-S : O-D i
1950 1951 1952 1953 1954 1955 1956 1957 1958 1959 1960 1961 1962 1963 1964 1965 1966 1967 1968 1969 1970 1971 1972 1973 1974 1975 1976 1977 1978 1979
44 64 38 37 49 44
-44- 46 44 37 35
-37- 30 33 38 46 42
-32- 26 35
-45- 42 36 73
100 69 73
-85- 94
106 100
91 78 75 75
. . . . . . . . . . . .
. . . . . . . . . . . .
. . . . . . . . . . . .
; - 1980
I 1981
I 1982
i 1983 1984
. . . 51 45 43 46 43 40 33 39 33 29 36 46 44 36 28 28 40 45 33 47
104 65 70 78 88
102 104
94 85 72 84
. . . 51 43 43 45 44 39 35 39 30 32 37 46 43 31 26 33 45 43 36 70
106 65 69 96 94
108 101
92 84 7.1 79
..* 48 44 43 46 44 36 37 35 29 34 39 45 42 30 25 38 45 41 37 93
100 74 75 84 96
110 100
89 72 76 67
. . . 48 44 47 46 42 35 37 33 29 36 43 45 39 29 27 40 48 39 39 84 87 72 76 81 97
104 .97 90 72 81 69
l
-840

c
Commodity group index - Textile fibres
(1980rlOO)
I I I I Quarterly Indexes
I I
Year i
Annual t
I I --------------------------------------L-------------- I
Indexer , J-li ; A-J 1 J-S ; O-D 1 ;------- --------- -------------- ----------w-- ------------ ---------+
1 1950 1951 1952 1953 1954 1955 1956 1957 1958 1959 1960 1961 1962 1963 1964 1965 1966 1967 1968 1969 1970 1971 1972 1973 1974 1975 1976 1977 1978 1979 1980 1981 1982 1983 1984
41 57 37 34 35 33
-33- 34 27 26 28
-28- 27 39 30 27 27
-260 26 25
-320 33 43 82 77 63 77
-77- 78 86
100 97 85 86 87
. . . . . . . . . . . . 36 34 33 35 27 27 28 29 27 29 30 27 29 27 26 25 33 32 41 75 81 64 72 81 76 85 97
100 88 85 92
. . .
. . .
. . .
. . . 36 33 32 33 25 27 27 28 27 30 30 27 28 26 26 25 33 33 41 89 73 63 82 72 79 88
102 94 85 88 82
. . .
. . .
. . .
. . . 34 30
3: 24 27 27 27 27 31 29 27 27 26 27 25 31 34 50 93 63 64 86 70 83 89
104 88 81
.PO 81

. -
Commodity index - Cotton
(1980-100)
i
I i Xndcxes 1 J -X I A-J ! J-S ; O-D i
I B-e-------- -0-0-0-&L--w -------------w -0-0-0--w--v ------------ ---w------w ! I
1950 : 1951 ; 1952 : 1953 ; 1954 : 1955 1 1956 ( 1957 ; 1958 f 1.959 : 1960 1 1961 ; 1962 ( 1963 ; 1964 ) 1965 :f 1966 1 1967 ; 1968 ; 1969 ( 1970 ; 1971 ; 1972 ; 1973 ; 1974 1 1975 ; 1976 1 1977 ; 1978 ; 1979 ; 1980 f 1981 ; 1982 ( 1983 ; 1984 :
50 69 52 40 44 42
-409 37
-32 29 31
-31- 31 31 31 30 29
-31- 31 30
-32- .34 38 64 74 62 82
-t79- 78 83
100 92 77 85 86
t I . . . I . . .
. . . I . . .
. . . 1 . . .
. . . 43 I ,( ‘ii
44 i i 38 I “41 40 ; 37 34 ; 34 29 11 29 31
.I 31
31 . 31
31 ! : 31 31 f 31 31 1 31 31 , ,’ 31 29 : 29 30 ; 30 32 :f 31 30 30 , 31
i
i 32
32 34 ~ 39 ; ‘. 40
2 ‘ I ; 51 77 58 : 62 70 ( 76 91 ; 87 72 ) 76 81 * 1 81 96 ; 95
104 f 99 75 ; 79 78 ; 91 ; i:
. . . . . . . . . . . . . . . . . . . . .
44 42
:: 32 28 31 31 31 31
i; 29 31 32 30 32 35
;5 70
.xi 72 79 84
103 88 79 89 82
. . . 45 40 40 36 31 28 31 31 30 31 31 29 29 32 31 31 32 37
’ 36 88
.61 65 93 67 85 85
106 78 75 91 80
. . - .
._
-.-. ._
. . ‘s. ‘-$6- . ’ .
v f . .
.

Commodity index - Uool
(1980-100)
I 1
I i i Quarterly Indexes I
Year Annu81 I ,---------------------------------------------------, i I i Indexes i J -8 ) A-J 1 J-S : O-D 1
1950 1951 1952 1953 1954 1955 1956 1957 1958 1959 1960 1961 1962 1963 -1964 1965 1966 1967 1968 1969 1970 1971 1972 g973 1974 1975 1976 1977 1978 1979 1980 1981 1982 1983 1984
52
ifi
-;:- 58 41 43 44
-43- 43 52 53 44 46
-39- 38 38
-330
:: 114
78 62 67
-73- 76 88
100 JO5
97 88 85
I
f . . . I . . . i . . . I
39 )
34 ; ” 123 : I
93 : 62 : 64 ( 75 ’ f 74 L ; 79 ; 96 ;
105 : 101 . ;
90 1 93 ;
. . .
. . .
0..
. . .
59 53 51 64 41 44 46 45 44 50 54 43 49 42 37 38 35 28 41
116 84 64 65
;; 88
100 103 101
86 90
. . .
. . .
. . .
. . . 57 51 53
:: 48 43 44 41 51 51 44 47 39 38 38 32 28 49
116 73 60 68 70 77 90
102 105
95 86 80
. . .
. . .
. . .
. . . 51 47 58 50 36 46 41 43 44 56 49 47
ii 41 36 28 29 74
103 60 61 73 73 78 93
102 104 91 90 78
. . . ? , . . I ” , , . . . ,
‘..
-87.

. ,
.‘.
:‘:
Commodity index - Sisal
(1980- 100) : : .
I Indexes 1 J -jf ; A-J ; J-S ; O-D i
1954 1955 1956 1957 1958 1959 1960 1961 1962 1963 1964 1965 1966 1967 1968 1969 1970 1971 1972 1973 1974 1975 1976 1977 1978 1979 1980 1981 1982 1983 1984
26 25
-24- 23
fi 32
-28- 32 45
,40 28 26
-23- 21 21
-19- 22 30 64
130 83 61
-680 65 88
100 86 77 74 77
I I
i . . . . . .
I
. . . . . .
. . . . . . i I
. . . I
. . . I
. . . t
. . . I
. . . t
. . . 32 27
1
36 45 ‘.
i,
33 27 24 . 21 22 21 18 20 33 85
133
ii 68 64
106 94 81 74 73 80
i . . . t . . . I . . . I . . . i I 32 I 30 I 29 ( 43 I 45 I 29 I I 26 I 24 ! 20 I 22
i 20 21 25 49
I 125 I 120 I t is I 67 I 64 I 106 I 91 f 77
i I
. . .
. . .
. . .
. . . 32 29 30 47 45 28 26 23 21 22 19 22 30 54
129 82 57 68 65 78
103 86 77
;:
. . . i** . . . . . . 32 28 31 47 38 28 26 22 21 21 18 23 31 69
133 67 61 72 65
102 98 85 77
3;
-88-

.,
Commodity index - Jute
(1980=100)
I I I Quarterly Indexes I Year I Annual i -----------------------------------------------------
i i Indexes i J-H ; A-J : J-S ; O-D f-------- a---------- --ewI----II ------------- ------------ -----------
1950 1951 1952 1953 1954 1955 1956 1957 1958 1959 1960 1961 1962 1963 1964 1965 1966 1967 1968 1969 1970 1971 1972 1973 19!4 1975 1976 1977 1978 1979 1980 1981 1982 1983 1984
55 90 49 39 49 49
-479 54 47 48 72
-91- 63
:: 70 75
-69- 67 70
-67- 69 75 71 84 92 77
-82- 102 103 100 100
93 86
80 I 106 .f 102 ; 99 I
,103 ; 103 :
81 1 104 ;
. . .
. . .
. . .
. . . 45 51
5”: 51 49 68
101 59 64 59 70 73 74 63 75 69 68
;4 77
101 74 81
101 104
98 100 100
85 104
. . .
. . .
. . . . . . 46 46
5: 47 47 65 77 59 58 67 68 75 65 66 66 67 70 68
s’: 79 74 83 97
109 97 92 87 85
129
. . .
. . .
. . .
. . . 56 40 52 50 43 50
102 72 64 59 77 68 75 63 75 67 65 73 67 69
106 76 81 85
102 96
105 104
81 95
183
-89-

Commodity index - Flax
(1980=100)
f t i
Quarterly Indexes i Year I Annual i ,-----------------------------------------------------,
1 1 Indexes i J -N ; A-J 1 J-S ; O-D i
1950 1951 1952 1953 1954 1955 1956 1957 1958 1959 1960 1961 1962 1963 1964 1965 1966 1967 1968 1969 1970 1971 1972 1973 1974 1975 1976 1977 1978 1979 1980 1981 1982 1983 1984
35 56 46 39 40 40
-38- 37 34 34 38
-38- 37 43 49 46 46
-4s 44 42
-45- 48 59 80 96 85 94
-llO- 119 132 100
75 77 91
104
. . .
. . .
. . .
. . . 40 42 38 38 34 33 38 38 36 40 49 45 47 45 44 44 39 48 56 67 95 87 80
118 113 135 110
77 87 81
109
. . .
. . .
.*.
. . . 40 41 37 37 34 33 37 38 36 40 49 46 46 45 43 44 42 46 58 76
102 84 82
115 111 133 101
66 79 85
108
.*. . . . . . . . . .
40 40 37 36 34. 33 38 38 37 42 49 46 46 44 44 41 49 46 60 86 96 87
101 107 119 137
99 69 73 95
100
. . .
. . .
. . .
. . . 42 39 38 36 34 37 38 38 38 49 48 47 46 44 44 40
:x 63 91 91 83
114 102 131 124
89 91 69
100 102
-9o-

Commodity index - Forest products
(1980-100)
I I I Quarterly Indexes I I Year I Annual f -----------------------------------------------------~
t +----
I. Indexes I J-n i ‘A-J 1 J-S 1 O-D 1 ------------ -------------- ------------- ------------ -----w---w- I
t i I I 1 I I I 1970
i -27- : 26 1 27 I 28 I 28 1
f 1971 29 i 28 ; 29 I 29 I 30. 1 I 1972 ( 32 I 30 : 31 I 32 I 34 ; I 1973 ; 47 40 ; 45 I 50 53 1
i 1974 1975 ; : 56 55
t I
i
I 56 i ‘5:
: t 59 57 I I
55 56 I 1 55 53, .I ; I 1976 ; 63 1 61
I 65 I 68 ;
I 1977 f -69- 68 69 70 I 68 1 I 1978 ; 73 I 70 I ; 70 I 72 I 73 1 I 1979 ; 91 I 83 ; 87 I 94 I 91 ; I 1980 ( 100 I 99 f 99 1 103 I 100 1 I 1981 ; 90 t 95 1 92 I 87 I 90 1 f 1982 I 81 : 86. 1 84 I 80 I 81 1 I 1983 ; 79 I 78 1 81 I 79 I 79 : I 1984 ; 79 I I 80 ; 84 I I 76 I I 79 1
-91-

..,
t .
. Commodity index - Log, .
(1980-100)
-920
. ‘
.

. ,&nmodi ty index - Lumber
i (1980-100) :
,
i I I Quarterly Indexes I I
I Year I Annual I -----------------------------------------------------l
i
i Indexes i J-l4 ; A-J I J-S ; O-D i ---------- ---e---w -------------- ------------- ----L------- ----------- I
I i 1950 I 1951
i 1952 1953 I 1954 I 1955 I 1956 t 1957 I 1958 I i 1959 1960 I 1961 I 1962 f 1963 t 1964 I 1965 I 1966 i 1967 I 1968 I 1969 I 1970 i 1972 1971
i 1973 I 1974 I 1975
i 1976 1977 I 1978 ! 1979 .I 1980 I :. -1981 t 1982
4 1983 I 1984
20 29 28 - 27 27 29
-28- 28 26 26 27
-27- 26 26 27 28 29
-29- 30 32
-31- 35 44 65 67 60. 70
-77- 85
102 .lOO -86 -74 81 75
. .
I I . . . ! . . . ; . . . i : . . . I 27 I 29 I 29 I 27 I 27 I 26 I 28 I I 2 I 26 I 27 I 29 I .29 1 29 I 29 I 32 I 30 I 32 f :
. . 39 . . 54
I 68 I 60 : 65 ! 75 I 82 I ‘. 96 I 105 ; .’ _: 93 i,“’ ‘77 I 78 I I 81
. . . . . . . . .
. . . . . . . . .
. . . . . . . . .
. . . 27 29 29 28 26 26 28 28 26 26 27 29 29 29 30 33 30 34 41 65 73 61 69 79 83 99 95 90 75 85 78
. . . 28 30 28 28 26 26 27 27 26 26 27 28 29 29 30 32 31 37 46 71 66 59 72 79 85
107 102 83 74 81 71
. . . 29 29 27 27 26 27 27 26 26 26 27 28 29 28 30 30 31 38 50 70 60 59 75 75 90
‘09 97 79 72 79 68
.
-93-

Commodity index - Woodpulg
(1980-100) :r
1950 1951 1952 1953 1954 1955 1956 1957 1958 1959 1960 1961 1962 1963 1964 1965 1966 1967 1968 1969 1970 1.971 1972 1973 1974 1975 1976 1977 1978 1979 1980 1981 1982 1983 1984
24 51 40 27 29 30
-310 30 29 28 28
-28- 25
f’8 29 28
-280 28
jf- 34 33 41 66 81 78
-72- 63 83
100 100
92 81 93
I i . . . t . . . I . . . I . . . I 28 I 30 I 31 I 31 t 30 I 28 t 28 I 28 8 27 I I f: I 29 i 28 ! 28 I’ 28 I 28 I 32 I .34 : 33 f 34 I 56 I 82 I 78 I 77 I 61 I 75 I 95
i 100 102 I 79 I 87
. . .
. . .
. . .
. . . 29 30 31 30 29 28 28 28 25
fi 29 28 28 28 28 32 34 32 38 64 83 77 72 60 80
102 100
99 81
100
29
3: 30 29 28 28 28 25
ii 29 28 28 27 28 34 34 32
;:, 80 79 73 62 84
102 99 90 82 89
I . . . ! . . . I . . . t . . . !
29 :
3: i
30 28
i
28 i 28 : 28 ” 26 27
,i.
28 t 28 I
28 i 27 ; 27 ; 29 ; 34 ; 34 : 32 ;
I ;; ; 79 ; 79 f 67 ; 71 : 92 ;
101 : 102 :
80 1 82 ; 96 1 -
-940
_ . .

-
Commodity index - Na~&o; &bber : .
‘(198011oo)
I I I Quarterly Indexes I Year t Annual I ----------------------------------------~~~~~~~~~~~~~~~~~~~~~
I f -Indexer I J-N ; A-J 1 J-S 1 O-D y------ ------------.--------~-~~~~ -0-0-0-0----- -0-------o-B -----A-----
1950 1951 1952 1953 1954 1955 1956 1957 I958 1959 1960 1961 1962 1963 1964 1965 1966 1967 1968 1969 1970 1971 1972 1973 1974 1975 1976 1977 1978 1979 1980 1981 1982 1983 1984
35 52 31 22 22 35
-31- 29 26 34 36
-270 26 24 22 23 21
-17- 17 22
-18- 22 23 47 50 39 54
-58-
ii 100
75 58 75 67
I I . . . I . . . I . . . I . . . I 19 I 31 I 34 I 30 I 25 f 29 t 39 t 26 I 27 ! 25 I 22 I -23 I 23 I ‘19 I 15 I 21 I .22 I 24 I 22 1 35 I 68 I I 28 I 56 I 61 : 80 I 108 i 91 I 58
i 66 79
. . . . . . . . .
. . . -. . .
. . . . . .
. . . . . . . . .
21 30 28 30 23 33
iii 26 24 22 24 22 19 17 23 19 24 22 43 53 37 56 5s 65 93 96 78 58 76 69
. . . 23 42 30 30 25 35 34 28 24 22 22 22 20 17 18 25 17 21 22 55 43 41 55 58 73 93 98 70 57 78 62
. . . 27 39 33 26 28 39 29 26 25 23 23 22 ’ 20 ’ 16 . 19 21 16 21 26 56 36 41 56 61 80 93 98 63 57 78 56
-95

Commodity index 7 Tobacco
(1980-100)
1950 1951 1952 1953 1954 1955 1956 1957 1958 1 1959 1960 1961 1962 1963
’ 1964 1965 1966 1967 1968 1969 1970 1971 1972 1973 1974 1975 1976 1977 1978 1979 1980 1981 1982 1983 1984
38 44 45 46 47 48
-470 49 49 49 49
-49- 49 52 54 54 55
-54- 53 54
-56- 51 56 58 67 72 74
-8O- 86 95
100 113 128 130 130
. . .
. . .
. . . . . . 46 46 46 46 49 47 48 49 47
ii ,54 55 54 52 53 56 51 56 58 63 75 72 78 83 92 98
107 126 131 125
. . .
. . .
. . .
. . . 46 49 47 49 49 49 49 49 48
ii
z: 54 53 55 56 51
ii 63 73 71 79
ii 99
107 126 130 126
. . .
. . .
. . . . . . 49 47 49 49 51 50
zi
2’2 54 54 54 54 51 53 56 51
55: 68 69 $5 81 87 94 99
116 128 132 131
. . .
. . . . . . . . . 48 49 47 50 48 49 49 51 51 54 56 55 55 53 52 53 56 51
2i 74 73 78 83 89 98
104 120 133 128 137
I I
i i Quarterly Indexes I
Year Afmua 1 ----------------------------------------------------- I I Indexes I J-l’l ; A-J : J-S : 0-.D :
----------- ----------- ------------- - --------- ----------- L---------- I
.
-96-

Commodity index - Hides .,
(1980=100)
I I
i 1 Quarterly Indexes I Year f Annual t-----------------------------------------------------
I i Indexer 1 J -M.; A-J ; J-S 1 O-D
1950 1951 1952 1953 1954 1955 1956 1957 1958 1959 1960 1961 1962 1963 1964 1965 1966 1967 1968 1969 1970 1971 1972 1973 1974 1975 1976 1977 1978 1979 1980 1981 1982 1983 1984
52 67 38 38 31 28
-310 30 30 41 37
-36- 33
i8’
9: -31-
29 36
-32- 32 66 75 57 49 72
-8O- 102 164 100
94 86
108 138
. . . . . . . . . . . .
. . . . . . . . . . . .
.
. . . . . . . . . .* .
. . . 34 27 31 28 28 36 39 35 36
2; 27 42 36 28 33 34 29 45 84 66 37
i: 84
165 113
ii 88
130
. . . 34 28 32 29 29 45 41 36 33 27 28 30 47 33 28 37 33 33 60 74 63 51 77 84 93
200 84
100 87 98
139
. . . 31 28 31 31 30 46 36 37 32 25 28 34 46 29 29 37 30 32 70 74 59 52 78 80
110 155
96 90 84
117 144
I I I I I I I
I I I I I I I I I I I I I
I
: I I I I
I
1
I
I I
I I I I I
I
i I I I
I I I I I I I I I
I I
I
I I I 1 I
‘27 31 29 29 31 38 34 36 31 26 28 34 37 28 31 36 30 35 88 70 43 57 70 75
120 133 107 88 83
127 139
-970

-. . .
Chsr indc* - thcrols
(1980-100)
1950 1951 1952 1953 1954 1955 1956 1957 1958 1959 1960 1961 1962 1963 1964 1965 1966 1967 1968 1969 1970 1971 1972 1973 1974 1975 1976 1977 1978 1979 1980 1981 1982 1983 1984
: 6
"6 6
-79
3
f -60
6
% 6
f-
6
-;-
;
:3
2x -44-
44 61
100 112 110
E3
. . .
. . . l . .
. . .
6 6
5 7 6
f 6 6 6 6 6 6
: 7
8 10 36 38 40 43 44 47 95
111 111 104 95
. . .
. . .
. . .
. . . 6 6 7 7 7 6 6 6 6 6 6 6 6 6 6 6 7 9 9
11 37 37 40 43
it 100 112 110 95 95
. . .
. . .
. . .
. . . 6 6 7 7 7 6 6 6 6 6 6 6
f 6 6
; 9
12 37 37 40 '44 44 65
103 112 109 94 95
I I . . . I . . . I . . .
. . . i 6: I
i 6 7
; 6 6 6 6 6 6 6 6 6 6 7 7
8 17 37 40 40 44 44 75
104 113 109 95 95
-9s
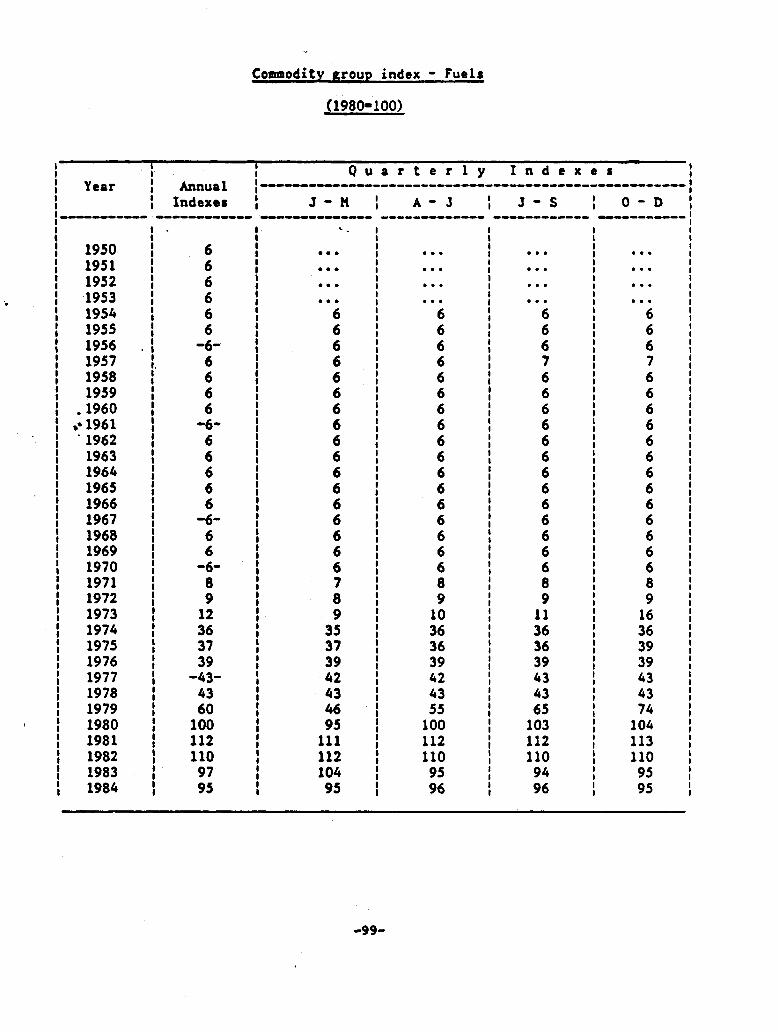
Commodity group index - Fuels
09801100)
I I 1950 I 1951 I 1952
. i 1953
I 1954
i 1955 1956 I 1957 I 1958 I 1959 I ,196O t
. I l * 1961 -
I 1962
i 1963
i 1964 1965 I 1966 I 1967 I 1968 I 1969 i 1970 I 1971 I 1972 I 1973 I 1974 ! 1975 f 1976 I 1977 t 1978 f 1979 I 1980 I 1981 ! 1982 I 1983 I 1984
6 6 6 6
f -6~
6 6 6 6
-60 6 6 6 6
-;-
f -60
8 9
12 36 37 39
-43- 43 60
100 112 110
97 95
. . .
. . .
. . .
. . . 6 6
: 6 6 6
: 6 6 6
f 6 6 6 7 8 9
35 37 39 62 43 46 95
111 112 104 95
. . .
. . .
. . .
. . . 6 6 6 6 6 6 6 6 6 6 6 6 6 6 6 6 6 8 9
10 36 36 39 42
5”: 100 112 110
95 96
. . . . . . . . . . . .
6 6 6 7 6 6 6 6 6 6 6 6 6 6 6 6 6 8 9
11 36 36 39 43 43 65
103 112 110
94 96
. . .
. . .
. . .
. . . 6 6 6 7 6 6 6 6 6 6 6 6 6 6 6 6 6 8 9
:t 39 39 43 43 74
104 113 110
95 95
-99-

Commodity index - Crude petroleum
(1980-100)
I I I I Quarterly Indexes t I ----------------------------------------------------- I Year I Annual I I I I I Indexes ( J -n ; A-J ; J-S ; O-D ; ----------- ------------ -------------- ------------- e----------- ----------- I
I I I I 1950 I 1951 ’ i-
- 1952 1953
I 1954 I 1955 I 1956 I 1957 I 1958 I I 1959 I 1960 I 1961 I 1962 I 1963
i 1964 1965 I 1966 I 1967 I 1968 I 1969 i 1970 I 1971 I 1972 I 1973 I 1974 I 1975 I 1976 I 1977 I 1978 I 1979 i 1980 I 1981 I 1982
i 1983 1984
5 5 5 6 6 6
-6- 6 6 6 6
-5 5 5 5 5 5
-5- 5 5
-5- 7 7
10 34 34 36
-4o- 40 58
100 112 109 96 93
. . . . . . . . .
. . . . . .
I . . . I . . . I . . . I . . . I
6 6 i 6 I 6 I 6 f 6 I 6 I 5 I 5 I 5 :i
5 I 5 I : I
I 5 I 5 I 5 :I 7 I 8 ,I 9 I
35 ,I I
;: ,i 41 40 i 63 I
103 i 111 I 109 t
93 t 93 I I
. . . . . . . . . . . . . . .
6 6 6 6 6 6 6 5 5 5 5 5 5 5 5 5 5 6 7 8
34 34 37 40 40 44 95
112 110 103
93
. . . 6 6 6 6 6 6 6 5 5 5 5 5 5 5 5 5 5 7 8 9
34 34 36 40 40 54
100 112 109
. . . 6 6 6 6 6 6 6 9 J- 5 5 5 5 5 5 5 5 7 8
15 34 37 36 41 40 73
104 111 109 93 93
i
-lOO-

Commodity index - Coal
. (1980-100) . .
: I I
i Quarterly Indexes
I Year Annual I -----------------------------------------------------
i I Indexes i J-H i A-J I J-S 1 O-D
I e---------- ----a------ ------------- ------------- ------------ -----------
1950 1951 1952 1953 1954 1955 1956 1957 1958 1959 1960 1961 1962 1963 1964 1965 1966 1967 1968 1969 1970 1971 1972 1973 1974 1975 1976 1977 1978 1979 1980 1981 1982 1983 1984
16 17 18 19 18 18
-220 22 18 18 18
-180 18 19 19 20 20
-2o- 19 20
-270 30 31
;: 84 80
-840 89 91
100 102 93 83 82
. . .
. . .
. . .
. . . 19 18 21 21 18 18 18
:: 18 19 19 20 20 19 19 2s 29 31
;: 90 78
x;
;: 101 100
x4 -_
.*.
. . .
. . .
. . . 18 18 22 22 18 18 18 18 18 18 19 19 20 19 18 20 26 30 31 38 64 86 79 82 87 90
101 100
94 85 84
. . .
. . .
. . .
. . . 18 18 22 22 18 18 18 18 18 18 19 20 20 19 19 20 28 31 32 43 76 80 80 84 87 90
103 101 90 80 83
. . . l . .
. . .
. . .
18 19 23 22 ia 18 18 18 ia 19 * 19 20 20 20 19 23 29 31 32 44 91 79 a3 a7 93 92 99
108 87 80 80
-lOl-
'*.

Commodity index -‘Natural gas
: (1980=100) ?
.
f 1 t Quarterly Indexes I ----------------------------------------------------- i I
Year I Annual I
i I Indexes i J -H ( A-J ; J-S 1 O-D i
----------- ---w------- k,swwm.-------- ------------- -----w----w- w---------- f
i i I I I
i 1970 1971 ; , -18- 20
i i 20 : I 20 16 i 20 17 I I 20 20 : ( 20 : 1 ’
I 1972 ; 19 ) ! 1973 ) 28
I 18 : 18 i 19 I 19 I 25 ; 25 30 :I 30
I i 1974 1975 ; ( 54 31
I I.’
31 I ; 54 31 ,I : 54 31 4 54 31 ii 54 I I ’
I 1976 f 64 : i .I 1977 ; -7O-
1 63 I 65 i 65 ,I 65 .I 70 ;
i I 1978 ‘I 68 : 70 I 70 f ?O ,I 65
: I 1979 . . i 72
: 69 : 69 i 69 I
82 I 1980 ,; 100
1 60 : 70 76 ~; 108 ; ;
1981 1. ; 1982
; 137 I 88 ) 99 I 105 ;I 154
i 160 ; 146 I 144 :I! 144 115 :, 131 : 148 I
; j
: 148 ( .
I 1983 : 142 I 145 141 I I I 137 .I 147 ! 155 I 160 i 164 ‘i 166
1 ! 1984”. ; 161 :
a-“- ! .
-102L

Commodity index - Iron ore
(1980-100)
t I 1
I Quarterly Indexes I
I Year i
A!Ulllal I
I Index98 i
--cIIIIIIII----------------------------------------- I
J-H : A-J. 1 J-S : O-D ;
1950 1951 1952 1953 1954 1955 1956 1957 1958 1959 1960 1961 1962 1963 1964 1965 1966 1967 1968 1969 1970 1971 1972 1973 1974 1975 1976 1977 1978 1979 1980 1981 1982 1983 1984
30 35 48 52 47 47
-Sl-
ii
i: -53-
53 51 49 50 Sl
-48- 48 47
-49- 46 46 59 67 83
-;;- 71 85
100 92 96 92 85
. . .
. . .
. . .
. . . 47 4’2 50 55 54 51 53 53 52 52 49 50 51 48 48 48 49 48 45 57 69 83 79 77 69 82
103 94 97 91 85
. . .
. . .
. . .
. . . 47 48 52 56 54 51 52 53 52 49
5”: 51 48 47 45 52 45 44 64 65 83 80 76 72 88
100 90 95 90 a4
. . . . . . . . . . . .
46 48 51 53 54 50 52 53 53 49 49 49 51 48 47 47 52 45 48 64
:z 83 76 75 89 99 90 94 92 83
-103-

Cobaodity index - ?langanese ore
: (1980-100) :
,I . .
I I I t
_ I
,Quartcrly Indexes -f I Year
i Annual I ----w-----------w--------------------------------- I
t Indexes I ( I
J-H ; A-J ; J-S ;. O-D i ,s--0-we-.. -0-0-0-w--w- -------------- -w---------- ------------ -0-0---w--c, i I
i 1954 1955 I 19% f 1957 I 1958 I 1959 I .1960 I 1961 I I 1962 I 1963 -
1 i 1964 1965 * I 1966
I 1967 t -1968
- ( 1969 i 1970 I 1971 I 1972
i 1973 1974 i 1975
i ,1976 1977 I 1978 i 1979 I 1980 I 1981 I 1982 I 1983 I 1984
66 64
-87- 110
81 60 59
-58- 55
ii 58 58
-53-
ii ‘38-
40 38 47 71 86 ‘89
-910 85 83
100 105 101
84 83
I i . . . I . . . f . . . I . . . I . . . I . . . I ; 59 t 59 I 56
i 51 51 I 58 I I 57 I 58 I 52
i 39 38 I 38 I 40 I 38 I 69 I 84 I I ,t’: I 90 i 83 I 86 t 105 I 105
i 96 82
I I
i . . . . . .
I . . . I .I
. . .
I . . .
I . . .
I 59 59
I 56 I I
: 51
I :
:i 59
i i 53 I I I .
ti
I _ 38
i 40 37
: : t 3; I 88 I I i
xi 85
; I.. 83
i :‘, 105
I 105
I . 99
i 86 82
..C . . .
. . . . . .
. . . . . . . . . . . . . . . . . . . . .
59 58 56 SO 51 58 59 53 46 39 38 40 38 55 72 87 91 91 83 83
105 105
99 78 82
. . . 59 57 53 48 55 56 59 51 41 39 38 42 36 55 72 86 91 91 83 83
106 105
99 75 85
2 .
-104-

Commodity index - Chrome ore
(1980-100) ’
i Indexes f J-n ; A-J ; J-S 1 O-D
1954 1955 1956 1957 1958 1959 1960 1961 196.2 1963 1964 1965 1966 1967 1968 1969 1970 1971 1972 1973 19.74 1975 1976 1977 1978 1979 1980 1981 1982 1983 1984
22 22
-260 30 27 26 25
-25- 25 23
:3 25
-270 26 27
-3o- 35 35 32 38 85 93
-93- - 33
93 100 123 103
93 93
I . . . I . . . I . . . I . . . I I . . . I I
. . . . . . . . . . . . . . . . . . . . . . . . . . . . . . . . . . . . . . . . . . . . . . . . 25 25 25 23
f3 25 26 25 27 30 35 35 30 39 88 93 93
ii3 93
123 99 93 93
. . . 25 25 25 23 23 23 25 27 25
3x 35 35 30 41 93 93 93
83 93
123 97 93 93
. . . 25 25 25 23 23 23 25 28 27 27 30 35 35 32 41 93 93 93 93 93
123 123
93 93 93
I . “ . ( t . “ , ,
-105-

.
i Commodity index - Crude fertilizer
(1980-100)
I
i
I
I I Quarterly Indexes I
----------------------------------------------------- I
Year I
Annual , I
I I Indexes I J-H ; A-J ) J-S : O-D ; ----------- ----------- -------------- ------------ I ------------ ---------- I
1950 195 1 1952 1953 1954 1955 1956 1957 1958 1959 1960 1961 1962 1963 1964 1965 1966 1967 1968 1969 1970 1971 1972 1973 1974 1975 1976 1977 1978 1979 1980 1981 1982 1983 1984
17 20 21 21 21 21
-21- 20 21 20 21
-21- 21 21 21 22 24
-22- 22 22
-23- 23 23 26
101 131
93 -76-
68 70
100 106
96 70 74
.-.
. . .
. . .
. . . 21 21 21 20 20 21 21 20 20 20 21 22 24 22 22 22 23 23 23 24 81
131 93 76 70 70
100 106
98
. . .
. . .
. . .
. . . 21 21 21 20 21 21 21 21 21 20 21 22 24 22 24 22 23 23 23 27 81
131 93 76 67 70
100 106
98 70 76
. . .
. . . . . . . . .
21 21 21 20 21 21 21 21 21 21 21 22 24 22 22 22 23 23 23 27
121 131
93 76 67 70
100 106
94 70 75
i i . . . I . . . I . . .
i . . . I
21 i 21 ; 21 ; 22 i 21 ! 20 I 20 ; 21 f 21 : 21 : 21 ! 22 ’ *i 24 1 24, I 22” ; 22 i I ;I 23 ; 23 ; 23 ; 27 ;
121 ; 131 ;
93 ; 76 : 67 : 70 :
100 ; 106 :
94 1 70 ; 74 1
-106-
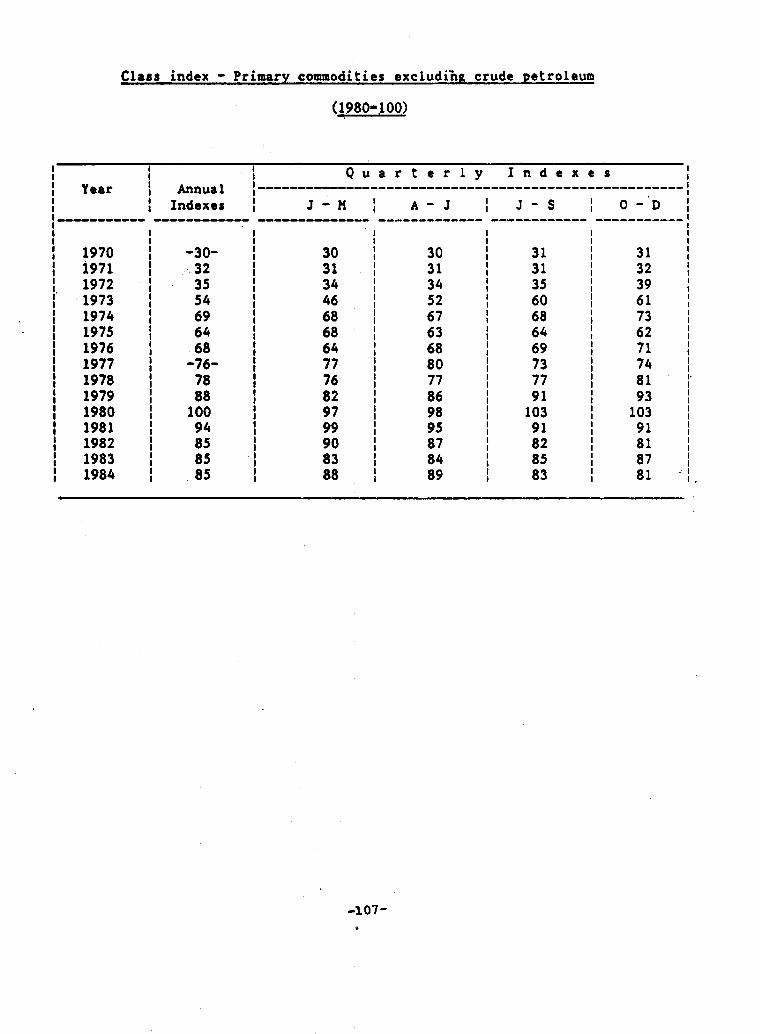
Class index - Primary commodities excludihg crude petroleum
f
I i
I I
Year Annual I Quarterly Indexes I
i i
---------------------~~~~~~~~~~~~~~~~~~~~~~~~~~~~~~~~ I t Indexes J -H ; A-J ; J-S ; 0-‘D I I f------ ----------- -------------- ------------- ------------ ----------- I I I I I I I I 1970 ) -3o- : 30 ( 30 i 31 I I i971 1 :. 32 ; 31 1 31 31
31 j 32 ,
f. 1972 ; 35 I 34 ; 34
j
35
1 I I 39 ;
I 1973 ; 54 ; 46 ; 52 I 60 I 61 1 I 1974 ; 69 I 68 ) 67
I 68 I 73 1
I 1975 ; 64 ; 68 1 63 I 64 I 62 1 I 1976 : -;;- I 64 ; 68 ! 69 I 71 1 ! 1977 ) i 77 1 80 73 I 74 1 i 1978 : 78 ; 76 f 77
j 77 ! 81 ‘*
I 1979 : 88 ; 82 1 86 I
91 I
i 1980 1981 ; f 100 94 1 : 97 99 ; ; 98 95
I
103 91 I I
93 j
I 103 91 ( I 1982 1 85 I 90 ; 87 I 82 I I 1983 ; 83 ; 84 I 1
81 j 87
I 1984 ; 88 1 89 i ii’3
I 81 ‘j,
-107- *

” :.
Total index - Non-ferrous base metals
(1980=100)
1950 1951 1952 1953 1954 19s5 1956 1957 1958 1959 1960 1961 1962 1963 1964 1965 1966 1967 1968 1969 1970 1971 1972 1973 1974 1975 1976 1977 1978 1979 1980 1981 1982 1983 1984
22 30 31 27 27 32
-330 27 24 27
-fS- 26
f ‘: 35
-g. 39 45
-470 41 40 G 58‘ 71 5S 60
-640 69
1’0: 88 77
;t.
. . .
. . .
. . .
. . . 26 31 36 29 23 27 28 26 27 26 27 33 40
-. 38 44 41 52
.40 42 45 75 57 s4 66
. 65 84
108 92 82 76 80
. . .
. . .
. . . . . . 27 31 34 28 23 27 28 27 26 26
,29 35 43 .3s
* 38 44
‘. 51 42
” 41 53 88 55 61 64 65
.t; 88 77 81
. . .
. . .
. . .
. . . 27 33 32 26 2’4 26 28’ 27 26 26 32 34 39 35 37 48 44 41 39 63 65 54 64 62 70 92 99 87 76 80 74
. .
-108-

Commodity bdex - Copp.er
‘(1980-100)
I 1950 ) 1951 : 1952 ; 1933 1954 r
1 ’
195s 1956 1957 1958 1959 1960 1961 1962 1963 1964 1965 1966 1967 1968 1969 1970 1971 1972 1973 1974 197s 1976 1977 1978 1979 1980 1981 1982 1983 1984
23 28
ii 31 42
-420 28 2s
;; -29-
30 30 3s 43 57
-49- 53 65
-64- 49 49
82 56 64
-600 62 91
too 79 67 72 62
I I . . . I . . . i . . . f . . . I 30 I 39 I . 49 I 33 I 22 I 30 I 33 t 28 I I 3x I I 390 t
i zz
I 65 I 56 I 76 I 8 48 I ,: 51 I 59 I 107 I ,158 I 57 I 66 I t ii: t 120 I 83 I 71 I 73 I 66
. . .
. . . . . . . . .
ii
i: 24 30 32 30
3x 33 44 63 4s 51 62 73
:f 74
127 57 70 62 60 92 93 80 66 78 65
. . .
. . .
. . .
. . . 31 43 38 26 26
3: 29 30 30 36 42 5s 46 48 69 59 so 48 92 79 56 71 5s
:i 96 78 65 74 60
. . .
. . .
. . . 34 46 3s 24 30 31
ii 30 30 43 47 5s 5s so 72 so 47 46
100 62 53 58 56
83 90 7s 66
-109-

Commodity index - Nickel
(1980-100)
I I I .,-Q u a r t c r 1 y Indexes I I Year t Annual 1 ----------------------------------------------------- I I I I Indexes I J-X 1 A-J ; J-S 1 O-D :
I
1950 1951 1952 1953 1954 1955 1956 1957 1958 1959 1960 1961 1962 1963 1964 1965 1966 1967 1968 1969 1970 1971 1972 i973 1974 1975 1976 1977 1978 1979 1980 1981 1982 1983 1984
11 14 14 15 16 17
-18- 21 20 20 20
-2o- 21 2i 21 21 21
-23- 24 28
-34- 35 37 40 45 54 59
-62- 61 79
100 100
94 94 94
. . .
. . .
. . .
. . . 15 17 17 21 20 20 20 20 21 21 21 21 21 22 24 27 33 35 35 40 42 53 57 63 61 62 97
101 94 94 94
. . .
. . .
. . . . . .
15 17 17 21 20 20 20 20 21 21 21 21 21 22 24 27 33 35 35 40
fS 57 62 62 78 *
101 101
94 94 94
. . .
. . .
. . .
. . . 15 17 17 21 20 20 20 21 21’ 21 21 21 21 23 24 27 33 35 37 ‘40 48 54 58 63 61 88
iO1 101
94 94 94
. . .
. . .
. . . ***
*.-*. 16 ii 18
:i 20 20 21 21 21 21 21 22 24
:; 35 35 40 40 48 57 63 61
ii; 101
99 94 94 94
-llO-

Commodity index - Aluminium
(1980=100)
I 1 Indexes I I f I .I Quarterly I
Year ----------------------------------------------------- I i
Annual i I
i Indexes i J-H ; A-J 1 J-S 1 O-D ;
----------- -----------e ------------- ---------w-w- -------w--w- -----------~
1950 18 1951 20 1952 24 1953 24 1954 25 1955 27 1956 -3o- 1957 32 1958 30 1959 30 1960 .31 1961 -31- 1962 29 1963 27 1964 29 1965 30 1966 29 1967 -3o- 1968 31 1969 .33 1970 -35- 1971 35 1972 33 1973 33 1974 43 1975 49 1976 51 1977 -64- 1978 73 1979 85 1980 100 1981 94 1982 85 1983 84 1984 89
. . . . . . . . . l . . . . . . . . . . . . . . . . .
. . .
25 26 28 32 32 30 31
2 28 28 30 29 30 30 32 34 35 37
3: 51
d80 73 78 99
101 88
iI:
. . . 25 26 29 32 30 30 31 31 29 27 29 29 29 30 31 33 35 35 34 33 42 50 47 62 70 81 95 95 86 86 92
. . . 25 27 30 32 30 30 31 31 29 27 29 30 29 30 31 33 35 35 30 34 46 48 54 69 74 89
102 88 84 86 87
I I I I
I
I I I I I I
t
I
I
t
I
1
I I I I
I I I
I
I I I I I I
I I I
I
f I I I I I I
I I I
I I I I
I
t I
i I
. . . I . . . f . . . I
I
. . . 25 ; 27 1 31 1 32 I 30 1 30 1 31 1 29 f 29 1 28 ; 29 1 29 1 29 f 30 ; 31 1 34 1 35 : 36 ; 31 ; 35 ( 48 1 47 1 55 1 69 1 77 ; 91 1
105 ; 90 ; 82 1 87 ( 83 1
-lll-
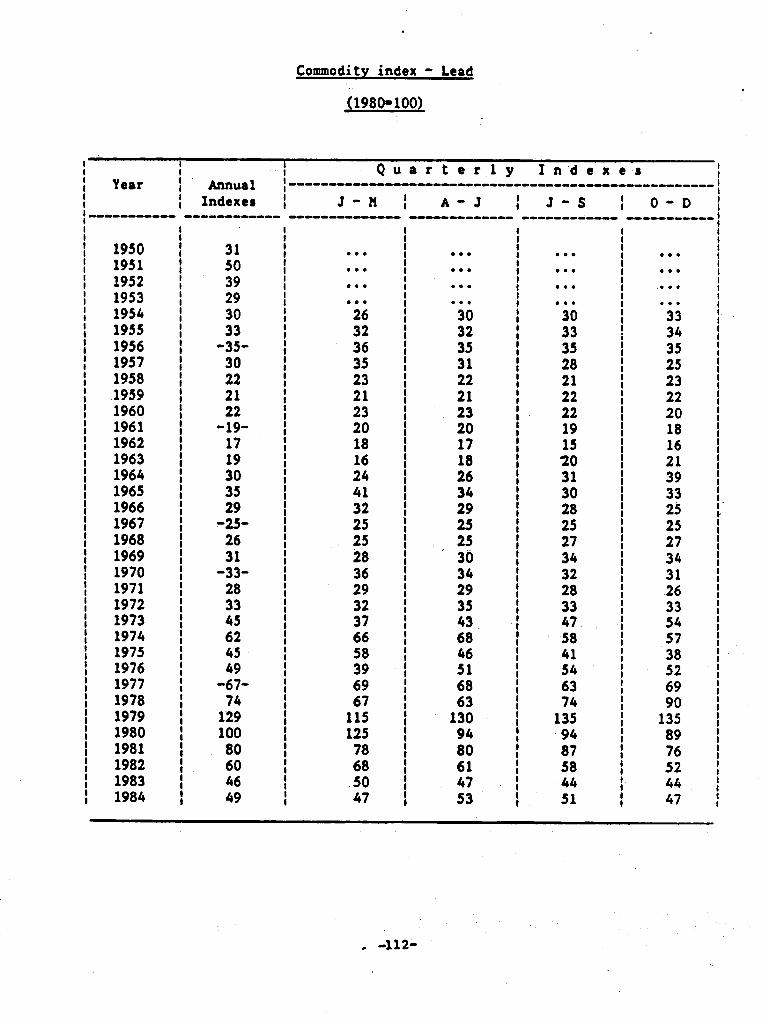
.
Commodity index - Lead . . (1980=100)
Quarterly I n d c x ema I I
i i
i , Indexer
-I-------- I-----------
1950 1951 1952 1953 1954 1955 1956 1957 1958 1959 1960 1961 1962 1963 1964 1965 1966 1967 1968 1969 1970 1971 1972 1973 1974 1975 1976 1977 1978 1979 1980 1981 1982 1983 1984
31 50 39 29
ii -350
30 22 21 22
-19- 17
:i
ii -25.
26 31
-33- 28 33 45 62 45 49
-67- 74
129 100
80 60 46 49
J-H 1 A-J ; J-S ; O-D i -I----------- -0a---------- ------------ -0-0-0-0-0- I
. . .
. . .
. . .
. . . 26 32
iii 23 21 23 20 18 16 24 41 32 25 25 28 36 29 32 37 66 58 39 69 67
115 125
78 68 50 47
. . . . . . . . . . . . 30 32
i: 22 21
ii 17
2t :i 25 25 30 34 29
ii 68
it 68 63
130 94 80 61 47 53
. . . . . . . . . . . . 30 33 35 28 21 22 22 19 15 20
ik 28 25 27 34 32 28 33 47 58 41 54 63 74
135 94
2 44 51
. . . . . . . . . . . . 33 34 35 25 23 22 20 18 16 21 39 33 25 25 27 34 31 26 33 54 57
5”: 69 90
135 89 76 52 44 47
. -112-

Commodity index - Zinc
. . (1980-100)
‘1. i‘
1 t Quarterly Indexes I
Year 1 Annual t I -----------------------------------------------------1
I Indexes i J-H 1 A-J 1 J-S ; O-D j I---------- ------------ -------------- I ------------- ------------ -----------
I
1950 1951 1952 1953 1954 1955 1956 1957 1958 1959 1960 1961 1962 1963 1964 1965 1966 1967 1968 1969 1970 1971 1972 1973 1974 1975 1976 1977 1978 1979 1980 1981 1982 1983 1984
41 66 51 29 29 33
-36- -’ -29
:3 32
-28- 24 27 42 40 37
-36- 35 37
-399 41 50 97
143 97 95
-8O- 79 97
100 114
96 99
113
. . . . . . . . . . . .
. . . . . . . . . . . .
. . . . . . . . . . . .
. . . 27 31
ii 23 27 33 29 24 24 35 41 40 37 35 35 39
‘, 38 50 56
163 103 93 92 69 97
102 102 108
89 126
. . . 29 33 35 31 22 27 33 29 24 27 44 41 36 36 34 36 39 39 51 70
181 98
101 82 74
102 93
113 90 92
123
I I I I
1 I I I I I I I I I I I
I
I I I I I I
I I
I I
1
f
I I I
I I I I I I I I I
I
I I I I I I I
I I I
I
I
I
I
. . . 29 33 34 27 23 31 32 27 23 27 46 40 36 35 35 38 40 42 49
104 124
95 98 74 82 95 99
123 92
103 104
I I I I I I I I I I I I I I I I I I I I I I I I I I I I I I I
f I I I I
f
I I I I I I I
I I
I I I I I I I I I I
I
I I
I
I
I
. . .
3.0 35 36 24 26 34 31 25 24 31
’ 43 40 37 35 35 40 39 46 50
160 104
93 87 71 89 95
105 118
92 110
99
I I I I I I I I I I I I I I
I I I I I I I
I I I I I I I
I I I
I I I I I I I I I I I I I I I I I I I 1 I I I I I I I I I I I
t
I
I
-113-
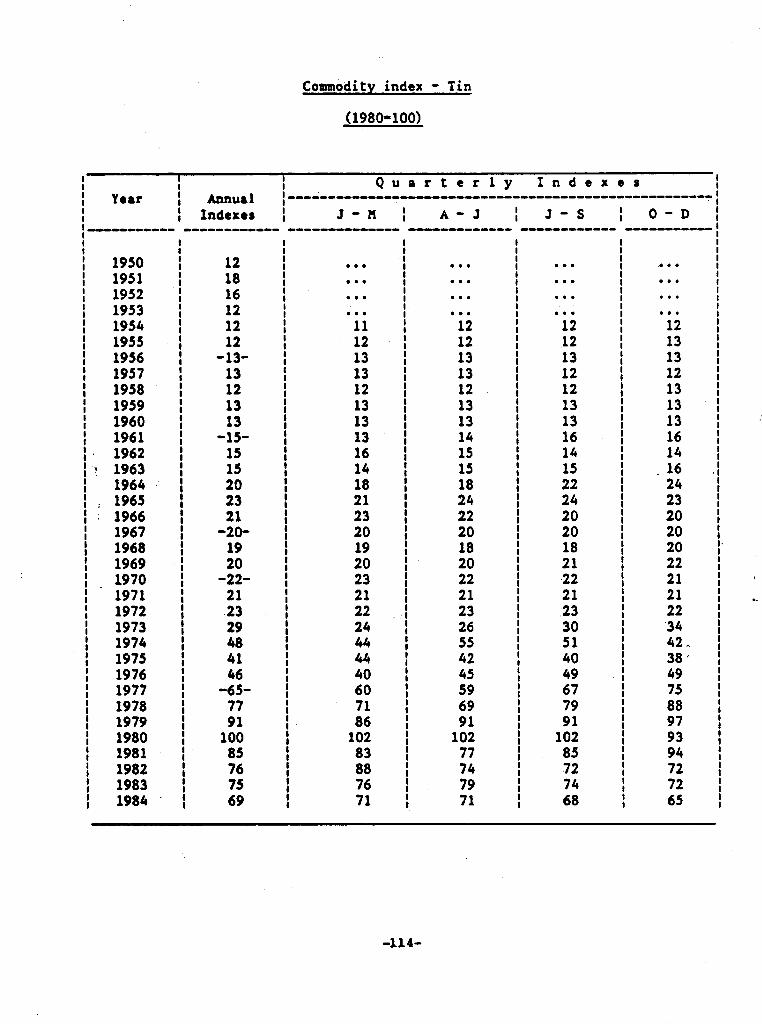
Commodity index - Tin
(1980-100)
1950 1951 1952 1953 1954 1955 1956 1957 1958 1959 1960 1961 1962 1963 1964 1965 1966 1967 1968 1969 1970 1971 1972 1973 1974 197s 1976 1977 1978 1979 1980 1981 1982 1983 1984
12 18 16 12 12 12
-130 13 12 13 13
-lS- 15
:‘o 23 21
-2O- 19
-fB- 21 23 29 48 41 46
-65- 77 91
100 85 76 75 69
i I . . . I . . . t . . . I . . .
i 11 12
i I 13 I 13 I 12
i 13 13 13 16
I 14 t I 18 I 21 I 23 I 20 t 19 I 20 I 23 I 21 i I
22
i 24 44
I 44
i 40
I 60
i 71 86
i
i 102
83 I 88 I 76 I 71
. . .
. . . . . . . . .
12 12 13 13 12 13 13 14 15 15 18 24 22 20 18 20 22 21 23 26 55 42
ii 69 91
102 77 74 79 71
. . .
. . .
. . .
. . . 12 12 13 12 12 13 13 16 14 15 22 24 20 20 18 21 ,22 21 .23 30 51 40 49 67 79 91
102 85 72 74 68
. . .
. . .
. . .
. . . 12 13 13 12 13 13 13 16 14 16 24 23 20 20 20 22 21 21 22 .34 42. 38 ’ 49 75 88 97 93 94 72 72 65
-114-

Annex I
COMMODITIES NOT INCLUDED IN THE PRICE INDEXES OF PRIMARY COMMODITIES
SITC Revision 2 Related Code of Code SITC, Revised
Section 0
Item Group
014
035.02
035.03
035.04
071.2
072.3 Cocoa butter and cocoa paste 072.3
036
037
048
056
062
073
A. Manufactured or semi-manufactured goods excluded
Descriptions
Meat and edible meat offals, prepared or preserved, n.e.8.; fish extracts
Cod (not in fillets), dried, whether or not salted
Fish, dried, salted or in brine father than cod of heading 035.02)
Fish, smoked (whether or not cooked before or during the smokinu process)
Crustaceans and molluscs whether in shell or not, fresh (live or dead), chilled, frozen, salted, in brine or dried; crustaceans, in shell, simply boiled in water
Fish, crustaceans and molluscs, prepared or preserved, n.e. s.
Cereal preparations and preparations of flour or starch of fruits or vegetables
Vegetables, roots and tubers, prepared or preserved, n.e.s.
Sugar confectionary (except chocolate confectionary) and other sugar preparations
Extracts, essences or concentrates of coffee and preparations with a basis of those extracts, essences or concentrates;,roasted chicory and other roasted coffee substitutes and extracts; essences and concentrates thereof
Chocolate and other food preparations containinu cocoa, n.e.6. _
013
031.2
031.2
031.2
031.3
032.02
048
055.1, 055.4
062.01
071.3, 099.01
073
-115-

SITC Revision 2 Related Code of Code SITC, Revised
Item Group Des&ip;tions
091 Margarine and shortening
098 Edible products and preparations, n.e.6.
091
099.02, 099.03, 099.04, 099.05, 099.06, 099.07, 099.09
Section 1
112.3 Beer made from malt (including ale; stout and porter)
112.4
:.
Spirits (other than those of heading 512.16); liqueurs,and other spirituous beverages, n.e.s.t compound alcoholic preparations (known as "concentrated extracts") for the manufacture of beverages
122 Tobacco, manufactured 122
Section 2
. . i' 233 Synthetic rubber latex; synthetic rubber and
reclaimed rubber; waste and scrap of unhardened rubber
266 Synthetic fibres suitable‘ for spinning
Section 3
334 Petroleum products, refined
335 Residual petroleum products, n.e.s. and related materials
112.3
112.4
231.2, 231.3, 231.4
266.21, 266.22, 266.23
332.1, 332.2, 332.3, 331.02, 332.4, 332.5, 332.51, 332.52, 332.91
332.6, 332.61, 332.62, 332.92, 332.93, 332.94, 332.95, 332.96, 521.1, 521.4
351 Electric current 351
-116-

SITC Revision 2 Related Code of Code SITC , Revised
Item Group Descriptions
081.1, 081.4,
081.2, Hay and fodder; bran, sharps and other residues: 081.9 flours and meals, of meat; and food wastes and
prepared animal feeds, n.e.s.
233.2
263.3
268.6
268.5
B. Waste and scrap materials excluded
Reclaimed rubber; waste and scrap of unhardened rubber
Cotton waste (includinq pulled or qarnetted raqs) not carded or combed
Waste of sheep’s or lamb’s wool or of other animal hair (fine or coarse) , n.e.s.
269 Old clothinu and other old textile articles; rags 267
282 Waste and scrap of iron or steel 282
288 Non-ferrous base metal waste and scrap, n.e.s.
c. Miscellaneous goods excluded
111 Non-alcoholic beverages, n. e. s. 111
Horsehair and other coarse animal hair fexcludina wool), not carded or combed
289 Ores and concentrates of precious metals; waste, scrap and sweepinqs of precious metals (other than qold)
291 Crude animal materials, n.e.s.
292 Crude vegetable materials, n.e.s.
081.1, 081.4,
085.2, ‘;‘t)8lT.92,
081.93, 081.94, 081.99
231.3, 231.4
263.3
262.6, 262.9
284.01, 284.02, 284.03, 284.04, 284.06, 284.07, 284.09
262.5
285.02
291.1
292
-117-

Annex If
SOURCES OF DATA POR THE INDEXES
International organisations
Food and Agriculture Organisation of the United Nations Rome
International Coffee Organisation Gill and Duffus, Limited London London
International Cotton Advisory Council Washington, D.C.
Metal Bulletin London
International Monetary Fund Washington, D.C.
Petroleum Economist London
International London
Rubber Council The Bank of Japan Tokyo
International London
International London
International London
International London
Sugar Organisation
Tea Committee
Tin Council
Wheat Council
Unite&Nations Conference on Trade and Development Geneva, Switzerland
World Bank Washington, D.C.
r . .
National government organisations
Statistical Bureau of Australia Statistical Bureau of Canada Statistical Bureau of Finland Statistical Bureau of France Statistical Bureau of Denmark Statistical Bureau of the Federal Republic of Germany Statistical Bureau of the Netherlands Statistical Bureau of Norway Statistical Bureau of Sweden Statistical Bureau of Switzerland Statistical Bureau of the United Kingdom Statistical Bureau of the United States
,
Other sources
Board of Trade London
The Public Ledger London
The Wall Street Journal Eastern ed., Princeton8 N.J., U.S.A.
U.S. Department of Labor Washington, D.C.
-118-

Annex III
COMPARISON OF PRICES OF h=T, RICE AND TIN: 1970-1980
Description I Prices
Currency/Unit 1970 1971 1972 li73 .1974 1975 1976 1977 1978. 1979 1980
hxeat
Wholesale price in Kansas City for No. 2 hard/dark winter wheat $US/60 lbs.
Export price of Canadian Western Red Spring Meat No. 1 13.58, in store, Thunder Say $US/60 lbs.
Rice
%olesale price of milled rice, medium grain No. 2 U.S.A. $US/lOO lbs.
h%ite rice 5% broken, f.o.b.
L Bangkok $US/lOO lbs.
Y- Tin
W-works in Penang, Malaysia $US/m. ton
UK, LME, prompt, standard grade $US/m. ton
1.54 1.60 1.86 3.58 4.74 3.96 3.46 2.60 3.20 4.00 4.32
1.76 1.74 1.91 4.00 5.58 5.02 4.06 3.37 4.19 5.52 6.15
8.53 8.64 9.19 17.96 25.61 18.99 11.19 15.14 18.30 17.30 22.50
6.54 5.95 6.51 13.61 24.78 16.52 10.97 12.35 16.70 15.10 19.60
3 594 3 411 3 670 4 692 7 790 6 619 7 452 10 670 12 492 14 811 16 405
3 665 3 500 3 762 4 822 8 187 6 842 7 614 10 661 12 932 15 481 16 801

._
$US/60 lbs <
6.5
6
5.5
5
4.5
4
3.5
3
2.5
2
1.5 I..
: i i
1970 1971 1972 1975 1974 1975 1976 1977 1978 1979 198t
Year
Legenc¶r 0 USA% NO. 2 hard/dark + cw?s: lo.1, 13.5%
S-0. Table 1
Figure fr Prices of wheat
-120-
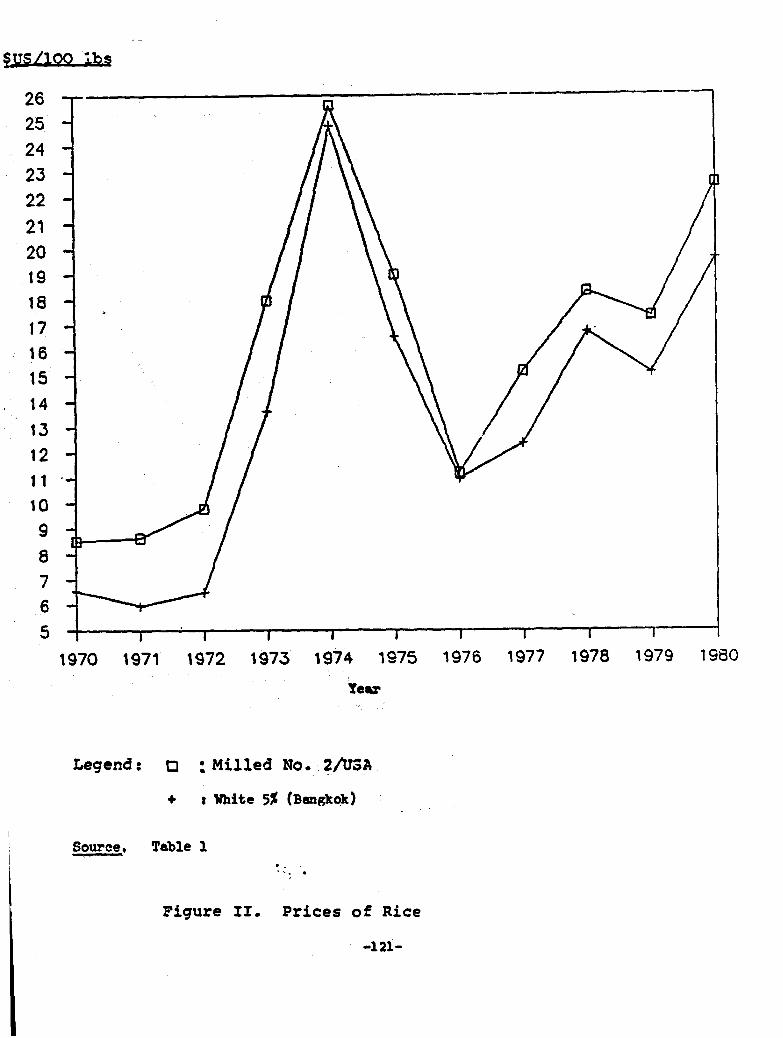
26
25
24
23
22
21
20
19
18
17
16
1s
14
13
12
11
10
9
a
7
6
5 I I I I I I I I I i ---A A-.-
3 1970 1971 1972 1973 1974 1975 1976 1977 1978 lY/Y 1 YUC
Yew ’
Legend: n :Milled No. 2&A
+ 8 White 5% (Bawkqlr)
Source q Table 1 . . -*. * ,
Figure 11. Prices of Rice
-121-

$US/lOOO m. tons
17
16
15
14
13
12
11
10
f8
7
6
5
4
3
1970 1971 1972 1973 1974 1975 1976 1977 1978 1979 1980
Year
Legend: D : Ex-works in Penang
+ t U.K., =,PmPt
Source. Tabli 1
Figure III. Prices of tin
86-34145 6405f (E) -122-


HOW TO OBTAIN UNITED NATIONS PUBLICATIONS United Nations publications may be obtained from bookstores and distributors throughout the world. Consult your bookstore or write to: United Nations, Sales Section, New York or Geneva.
COMMENT SE PROCURER LES PUBLICATIONS DES NATIONS UNIES Les publications des Nations Unies sont en vente dans les librairies et les agences dtpositaires du monde entier. Informez-vous aup& de votre libraire ou adressez-vous a : Nations Unies, Section des ventes. New York ou Get&e.
KAK HOJIYYl4Tb H3&4HH5i OPI-AHH3AIJHH OR’bE,LWHEHHbIX HAHMH kf3AaHsn OpfaH&i3aUHH O6aeAuHeHHblx Haunt4 MOmHO K)'llUTbB KHWEHblXMara3WIaX HareHTCTBaXBOBCeXpaftOHaXMHpa.HaBOAkiTeCIIpaBKli 06 W3AaHURXBBallleMKHU)KHOM Mara3UHe HJIW IlHLLIHTe no aAPeCy: OpraHH3aUWl 06WAHHeHHbIX Hattug, CeKUWl IlO npoAaxeH3AaHwil,Hbm-Gioprcmu IKetieBa.
COMO CONSEGUIR PUBLICACIONES DE LAS NACIONES UNIDAS Las publicaciones de las Naciones Unidas e&n en venta en librerfas y casas distribuidoras en todas partes del mundo. Consulte a su librero o dirfjase a: Naciones Unidas, Seccidn de Ventas, Nueva York o Ginebra.
Litho in United Nations, New York 86-34145-January 1987-2,750
01350 United Nations publication Sales No. E.87.XV11.4
ST/ESA/STAT/SER.M/82
Top Related