![Desing of Beams [Uyumluluk Modu]kisi.deu.edu.tr/ozgur.ozcelik/Ekonomi/ARCH 206/ARCH-205_2014-2015... · Castellated Beams . ... PRISMATIC BEAM DESIGN (cont) • Shear Stress ... EXAMPLE](https://static.fdocuments.in/doc/165x107/5af895747f8b9abd588bc6c3/desing-of-beams-uyumluluk-modukisideuedutrozgurozcelikekonomiarch-206arch-2052014-2015castellated.jpg)


Languages
Pages
Legal


INFORMATION TO USERS
This manuscript has been reproduced from the miaofilm master. UMI films
the text directly from the original or copy submitted. Thus, seme thesis and
dissertation copies are in typeMiter face, while others may be from any type d
computer printer.
The quallty of thi. ntprocluctlon la dependent upon the quality of the
copy submitled. Broken or indistinct prim, coIor8d or poor quality illustrations
and photographs, print bleedthrough, substandard margins, and improper
alignment can adverseIy affect r8production.
ln the unlik~l~ event that the author did not send UMI a complete manuscript
and there are missing pages, these will be not8CI. Also, if unaulhorized
copyright material had to be removed, a note will indicate the deletion.
Oversize materials (e.g., maps, drawings, chalts) are reproduced by
seetioning the original, beginning al the upper Ieft-hand comer and continuing
from left te right in equal sections with small overtaps.
Photographs induded in the original manusaipt have been reproduced
xerographically in this copy. Higher quality 6- x V black and white
photographie prints are available for ..y photographs or illustrations appearing
in this copy for an additional charge. Contact UMI directly to order.
Bell & Howell Information and leaming300 Nor1h Z8eb R08CI. AnnArbor, MI 481~1346 USA
800-521-0800

•
•
STABILITY OF CASTELLATED BEAM WEBS
by
Sevak Demirdjian
Mareb 1999
Department of Civil Engineeringand Applied Meebanies
McGill UniversityMontreal, Canada
A thesis submitted to the faeulty of Graduate Studies andResearch in partial fulfilment of the requirements of theDegree of Master of Engineering
© Sevak Demirdjian
1+1 National Ubraryof Canada
Acquisitions andBibliographie Services
395 Weflington StreetOttawa ON K1A 0N4canada
Bibliothèque nationaledu Canada
Acquisitions etservices bibliographiques
395. rue WellingtonOIIawa ON K1 A 0N4Canada
The author bas granted a nonexclusive licence allowing theNational Library ofCanada toreproduce, 1030, distribute or sencopies of this thesis in microfo~
paper or electronic formats.
The author retains ownership of thecopyright in this thesis. Neither thethesis nor substantial extracts from itmay be printed or otherwisereproduced without the author'spernnSSlon.
L'auteur a accordé une licence nonexclusive permettant à laBibliothèque nationale du Canada dereproduire, prêter, distribuer ouvendre des copies de cette thèse sousla fonne de microfiche/~dereproduction sur papier ou sur formatélectronique.
L'auteur conserve la propriété dudroit d'auteur qui protège cette thèse.Ni la thèse ni des extraits substantielsde celle-ci ne doivent être imprimésou autrement reproduits sans sonautorisation.
0-612-50601-0
Canad~
•
•
ABSTRACT
A study on the web-buckling behavior of castellated beams is described in this thesis.
80th elastic and plastic methods of analysis are utilized to predict the tàilure modes of
these beams.
Interaction diagrams predicting formation of plastic mechanisms. yielding of [he
horizontal weld length and elastic buckling analysis using the finite element method are
correlated with a number of experimental test results from previous studies given in the
literature.
Test-to-predicted ratios for a total of 42 test beams ranging from 45° to 60° openings are
computed with the plastic and elastic methods of analysis. and a mean of 1.086 and
coefficient of variation of0.195 are obtained. A parameter study covering a wide range of
60° castellated beam geometries is perfonned to derive elastic buckling coefficients under
pure shear and bending forces. An elastic buckling interaction diagram is then detined.
which along with the diagrams utilized in the plastic analysis. can be used to predict the
e1astic buckling and plastic failure loads under any given moment-to-shear ratio.
To incorporate the effect of plasticity associated with buckling, expressions are derived to
improve the previous theoreticaJ models used. by combining both elastic and plastic
results. This results in an improvement in the coefficient of variation of the test-to
predicted ratios for the 60° beams considered from 0.1 70 to 0.137.

•
•
RÉSUMÉ
Dans la cadre de la présente thèse, une étude sur le voilement de l'âme des poutres
ajourées a été effectuée. Les modes de rupture de ces poutres et les charges
correspondantes sont evalués par des analyses de plasticité et d'élasticité.
Les charges estimées par les diagrammes d'interaction pour la formation d'un mécanisme
de rupture. pour la rupture du joint de soudure horizontal par écoulement. et pour le
voilement de l'âme prédit par analyse par élément finis, sont comparées aux résultats des
plusieurs études antérieures.
Les rapports entre les résultats expérimentaux pour 42 poutres avec 45° à 60°
d'ouvertures et les prédictions par les méthodes d'analyse de plasticité et d'élasticité ont
été obtenus, et une moyenne de 1.086 et un coefficient de variation de 0.195 ont été
obtenues. Une étude paramétrique sur les coefficients de voilement élastique de l'âme a
été effectuée pour des charges en cisaillement pur et en tlexion. pour un grand nombre de
poutres ajourées avec des ouvertures de 60°. Un diagramme d'interaction pour le
voilement élastique de l'âme a été développé. Ce diagramme est utilisé en combinaison
avec les diagrammes pour la formation d'un mécanisme de rupture pour estimer la force
de cisaillement par rapport au moment de tlexion, correspondant à la formation d'un
mécanisme de rupture et au voilement élastique de l'âme.
L'effet de la plasticité lors du voilement de l'âme est ensuite inclus dans les expressions
théoriques. Cette addition réduit l'écart-type de 0.170 à 0.137 sur les prédictions
théoriques pour les poutres ajourées avec des ouvertures de 60°.

•
•
ACKNOWLEDGMENTS
1 would like to express my sincere gratitude to Prof. R.G. Redwood for his constant
guidance. encouragement and help throughout the course of this project.
Special thanks are due to Prof. G. McClure for ail her help throughout the course of this
project. and to ail her guidance and advising throughout my graduate Ievel studies.
The support of Fonds des Chercheurs et raide à la recherche (FCAR) IS greatly
acknowledged.
1would like to thank my parents Krikor and Alice, and my brother Harry for their intinite
support and encouragement for aIl these years. Finally 1 would like ta acknowledge my
uncle Joseph Bedrossian. for his valuable knowledge and help tor many years.
iii
•
•
TABLE OF CONTENTS
ABSTRACT i
RÉsUMÉ ii
ACK..~OWLEDGMENTS iii
TABLE OF CONTENTS iv
LIST OF FIGURES vii
LIST OF TABLES ix
NOTATIONS x
CHAPTER ONE : Introduction 1
1.1 Introduction 1
1.2 Failure Modes ofCastellated Beams 5
1.2.1 Vierendeel or Shear Mechanism 5
1.2.2 Flexural Mechanism 6
1.2.3 Lateral Torsional Buckling 7
1.2.4 Rupture of Welded Joints 9
1.2.5 Web Post Buckling 10
1.2.6 Web Post Buckling Due To Compression 13
1.3 Research Program 14
1.3.1 Objective and Scope of Work 14
1.3.2 Outline of the Thesis 15
CHAPTER TWO : Methods of Analysis 16
2. 1 Genera! _ 16
iv

•
•
2.2 Plastic Analysis 16
2.3 Mid-Post Yielding 19
2.4 Buckling Analysis - 21
2.5 Finite Element Analysis 24-
2.5.1 General 24
2.5.2 Input File Preparation 27
2.5.3 Model Geometry 28
2.5.4 Constraints 28
2.5.5 Loads , 29
2.5.6 Buckling Analysis ; 32
2.6 Summary 34
CHAPTER THREE : Literature Review 35
3.1 General 35
3.2 Literature Review 35
3.2.1 Redwood and Demirdjian (1998) 36
3.2.2 Zaarour (1996) 36
3.2.3 Galambos, Husain, and Speirs (1975) 37
3.2.4 Husain and Speirs (1973) 38
3.2.5 Husain and Speirs (1971) 39
3.2.6 Bazile and Texier (1968) 39
3.2.7 Halleux (1967) .40
3.2.9 Sherbourne (1966) .41
•
•
3.2.10 Toprac and Cooke (1959) 42
3.2.11 Altifillisch~ Toprac and Cooke (1957) .43
CHAPTER FOUR: Reconciliation ofAnalysis With Test Results 52
4.1 General 52
4.2 Comparative Data 52
4.3 Comparisons , 55
4.4 Discussion 57
CHAPTER FIVE : Generalized Analysis and Design Considerations 62
5.1 General 62
5.2 Loading on General Models 63
5.3 Elastic Buckling Interaction Diagram 67
5.4 Parameter Study 73
5.5 Previous Parameter Study 73
5.6 Shear Buckling Coefficients " 76
5.7 Flexural Buckling Coefficients 78
5.8 Effect oflnelasticity on Ultimate Strength 79
CHAPTER SIX : Conclusion 84
REFERENCES 87
APPENDIX A : Finite Element Input File
APPENDIX B : Detailed Test-To-Theory Results
APPENDIX C : Elastic and Plastic Theoretical Computations
VI

•
•
LIST OF FIGURES
CHAPTERONE
Figure 1.1 Castellated Bearns 1
Figure 1.2 Zig-Zag Cutting Dimensions of Rolled Beams 2
Figure 1.3 Castellated Bearn Section Properties .4
Figure 1.4 Castellated Bearn Section Properties with Plates at Mid-Depth 4
Figure 1.5 Parallelogram Mechanism 6
Figure 1.6 Lateral Torsional Buckling 8
Figure 1.7 Weld Joint Rupture 9
Figure 1.8 Web Post Buckling L2
CHAPTERTWO
Figure 2.1 Interaction Diagram 18
Figure 2.2 Free-Body Diagram 20
Figure 2.3 Predicted Web-Post Buckling Moments 23
Figure 2.4 (a) Model used By Zaarour and Redwood (1996) 26
Figure 2.4 (h) Non-Composite Model Used by Megharief(1997) 26
Figure 2.5 Finite Element Model .30
Figure 2.6 Pure Bending and Shear/Moment Arrangement 31
CHAPTER FOUR
Figure 4.1 Test Arrangement of Bearn H 53
Figure 4.2 Interaction Diagram Demonstrating Theoretical Methods 54
"'"

•
•
CHAPTER FIVE
Figure 5.1 Two Hole FEM Model Under Vertical Loads Only 64
Figure 5.2 Three Hole FEM Model Under Pure Shear Forces 65
Figure 5.3 Three Hole FEM Model Under Pure Bending Moments 66
Figure 5.4 Three and Four Hole FEM Models 69
Figure 5.5 Zaarourand Redwood (1996) 70
Figure 5.6 Husain and Speirs (1973) 71
Figure 5.7 Husain and Speirs (1971) 71
Figure 5.8 Altifillisch, Cooke and Toprac 72
Figure 5.9 Shear Buclding Coefficient Redwood and Demirdjian (1998) 75
Figure 5.10 Modified Pure Shear Buckling Coefficient Curves 77
Figure 5.11 Buckling Coefficient Curves Under Pure Bending forces 79
Figure 5.12 Elastic and Plastic Interaction Diagrams 80
Figure 5.13 Comparison of Test Results With Proposed Expressions 83
VIII
•
•
LIST OF TABLES
CHArTER TOREE
Table 3.1 Redwood and Demirdjian (1998) .44
Table 3.2 Zaarour and Redwood (1996) +4
Table 3.3 Galambos Husain and Speirs (1975) .45
Table 3.4 Husain and Speirs (1973) A6
Table 3.5 Husain and Speirs (1971) .47
Table 3.6 Bazile and Texier (1968) .47
Table 3.7 Halleux ( 1967) .48
Table 3.8 Sherboume (1966) .49
Table 3.9 Toprac and Cooke (1959) 50
Table 3.10 Altifillisch. Cooke and Toprac (1957) 51
CHAPTER FOUR
Table 4.1 Summary of Test to Theoretical Predictions 58
CHAPTER FIVE
Table 5.1 Summary of Results under Pure Moment Forces 67
Table 5.2 Summary of Results Under Pure Shear Forces 68
Table 5.3 Statistical Results 82
ix

NOTATIONS
• Ar area of flange
A", area of web
b width ofone sloping edge of the hole
br width of flange
d depth of the original beam section
dl!: total depth of castellated beam section
db depth of bottom tee section
dt depth of top tee section
C compression force
COY coefficient of variation
OOF degree of freedom
E modulus of elasticity
e length of welded joint
FEA finite element analysis
FEM finite element method
F). yield stress
G stiffness matrix
GD differential stiffness matrix
h height of one sloping edge of hole
ho height of hole
hp height of plate
•x
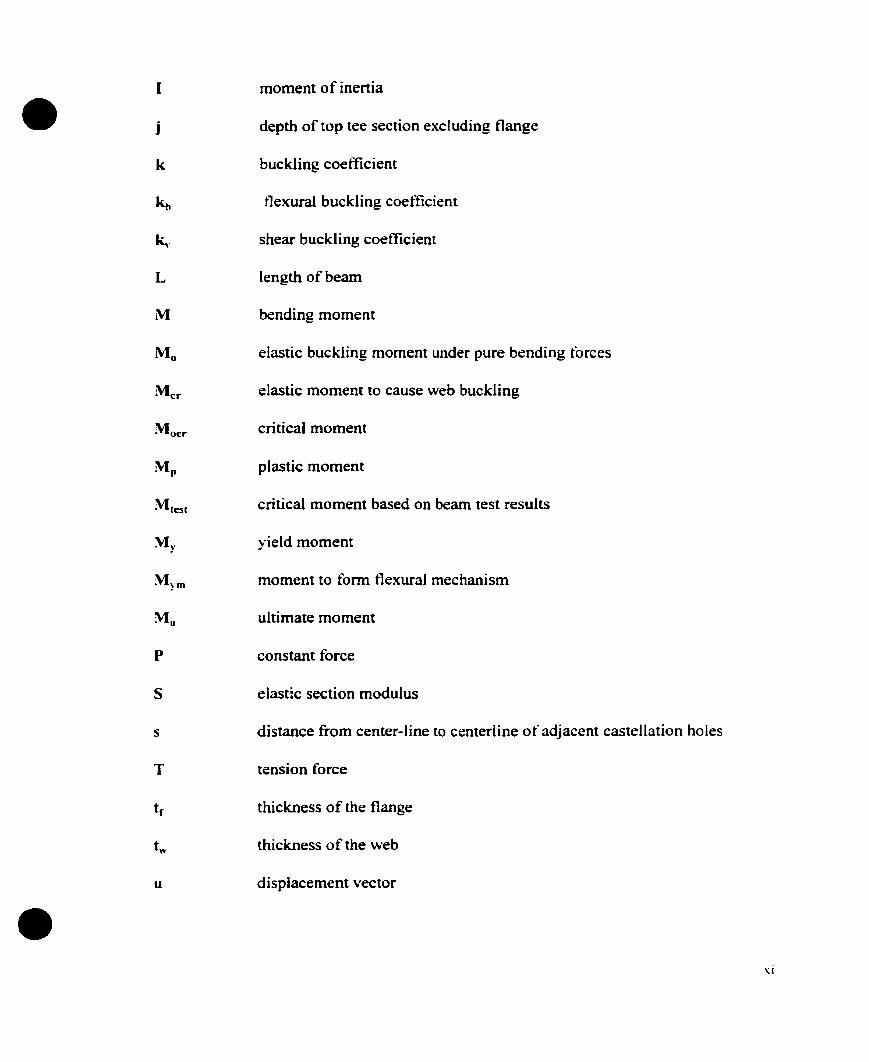
1 moment of inertia
• j depth of top tee section excluding flange
k buckling coefficient
k b tlexural buckling coefficient
~. shear buckling coefficient
L length of beam
M bending moment
Mo elastic buckling moment under pure bending forces
Mer elastic moment ta cause web buckling
Mocr critical moment
M p plastic moment
M tc51 critical moment based on beam test results
My yield moment
Mym moment ta fonn flexural mechanism
Mu ultimate moment
p constant force
S elastic section modulus
s distance from center·line to centerline of adjacent castellation holes
T tension force
tr thickness of the flange
tw thickness of the web
u displacement vector
•XI

u* modified displacement vector
• V Shear force
VI) elastic buclding shear under pure shear forces
Ver criticaJ shear to cause web buckling
Vere shear obtained from elastic anaJysis
Vh horizontal shear force
Vhcr criticaJ value of Vh
Vr~sl criticaJ shear based on beam test results
Vp plastic shear
Vpl shear obtained from plastic anaJysis
v yh verticaJ shear force to cause mid-post yielding
v ym verticaJ shear force to form plastic mechanism
Vu ultimate shear to cause web buclding
W applied load
Yl distance from top of the flange to centroid of tee-section
Z plastic section modulus of castellated beam
Z' full section plastic modulus
Cl. factor utilized in plastic analysis
a factor utilized in plastic analysis
$ angle of castellation
O"cr critical stress
\II expansion ratio
•xii
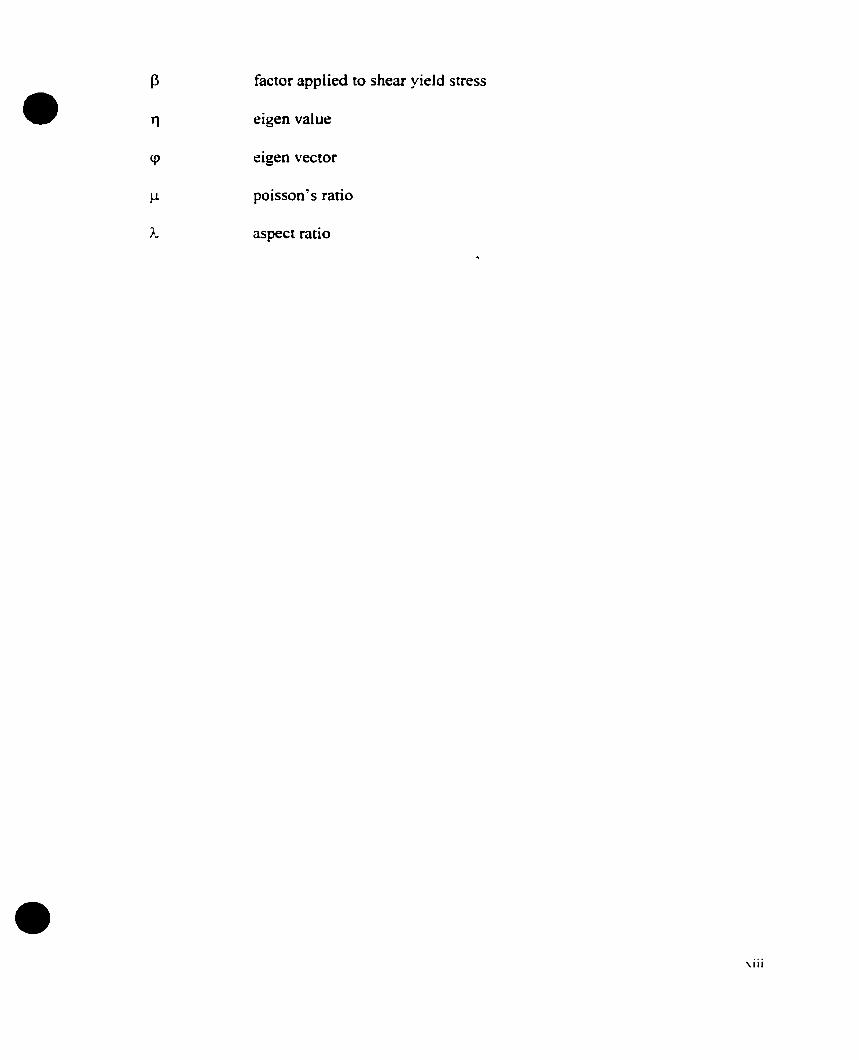
J3 factor applied to shear yield stress
• TI eigen value
<p eigen vector
J.l poisson' s ratio
À aspect ratio
•
•
•
CHAPTERONE
[~TRODUCTION
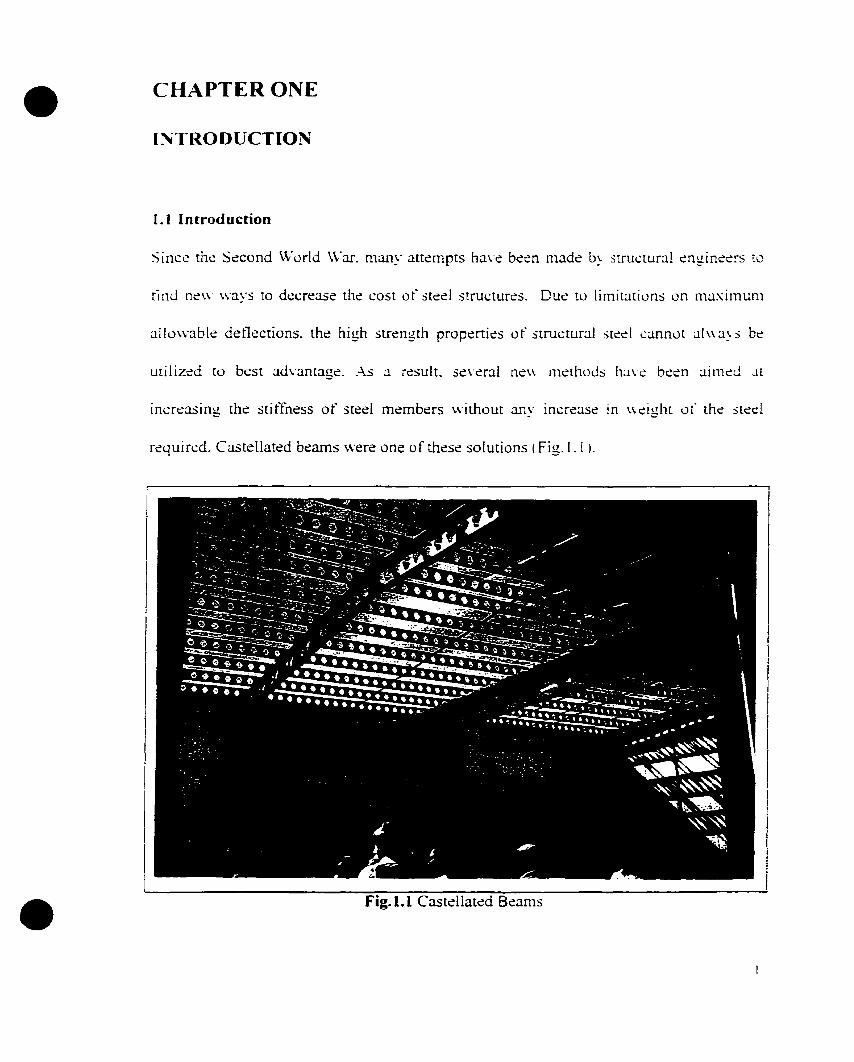
1.1 Introduction
Since the Second \Vorld \Var. many atternpts ha\-e bèen nladè by strUl.:tural èngineèrs tù
rinJ nè\\ \\"ays ta decrease the cost of ::itèd structures. Due to limitations on maximum
allowable det1ections. the high strength properties of structural sted cannot a1\\ay:; be
utilized to best advantage. .-\S a rè~;ult. several nè\\" methoJs h~.l.\"è beèn aimèJ :.lt
increasing the stiffness of steel members without any rncrease ln \\èight of the sted
requiœd. CasteUated bearns were one of these solutions (Fig.l. l l.
Fig.l.i Castellated Bearns

• Castellated (or expanded) beams are fahricated from wide flange I-beams. The web of the
section is eut by flame along the horizontal x-x axis along a "zigzag" pattern as shown in
Fig. 1.2.
•s
d
•
Figure 1.2 Zig-Zag Cutting Dimensions of Rolled Beams
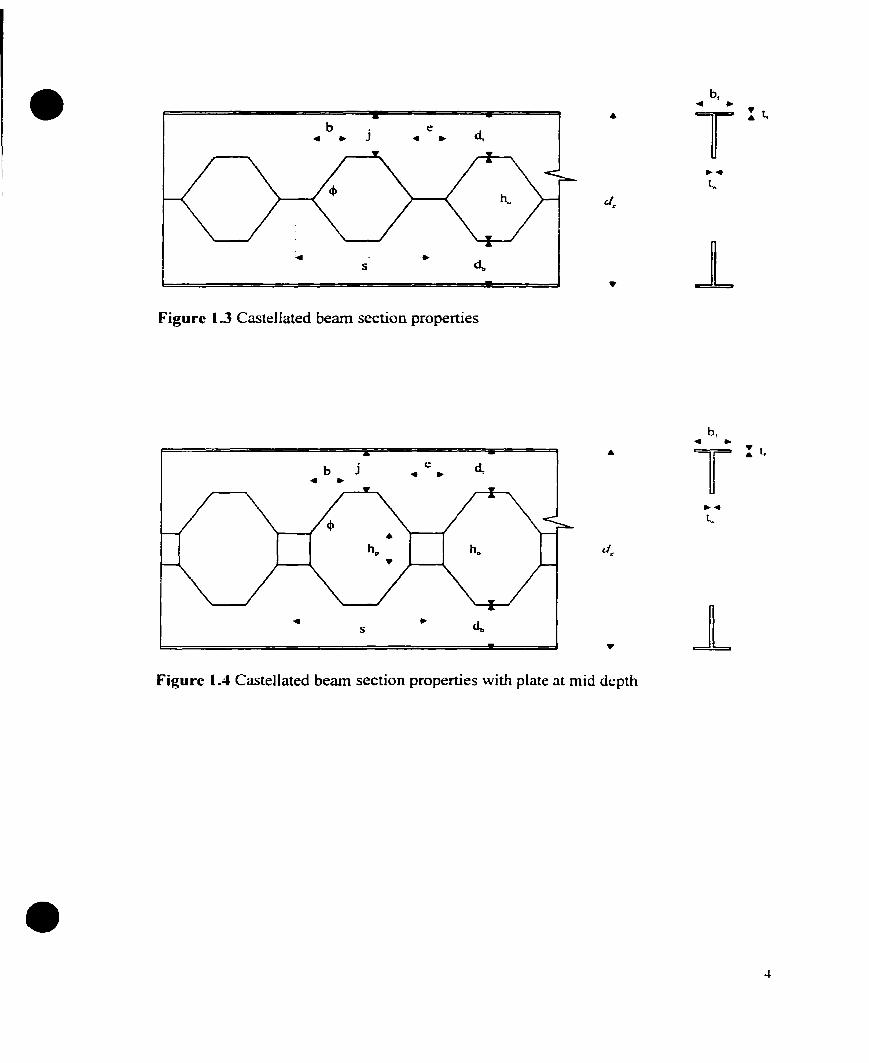
The two halves are then welded together to produce a beam of greater depth with
hexagonal openings in the web (Fig. l.3), or rectangular plates may be inserted between
the two parts. producing octagonal holes (Fig. 1.4). The resulting beam has a larger
section modulus and greater bending rigidity than the original section. without an
increase in weight. However. the presence of the holes in the web will change the
structural behavior of the beam from that of plain webbed beams. Experimental tests on
castellated beams have shown that beam slendemess, castellation parameters and the
loading type are the main parameters, which dictate the strength and modes of tàilure of
these beams.
Castellated beams have been used in construction for many years. Today. with the
development of automated cutting and welding equipment, these beams are produced in
an almost unlimited number of depths and spans, suitable for bath light and heavy
loading conditions. In the past, the cutting angle of castellated beams ranged from 450 to
2

•70° but currently, 60° has become a fairly standard cutting angle. although 45" sections
are also available. It should he noted that these are approximate values. actual angles will
vary slightly from these to accommodate other geometrical requirements. As roof or floor
beams. joists. or purlins, these sections may replace solid sections or truss members.
Their aesthetic attributes produce an attractive architectural design feature tor stores.
schools and service buildings. In structures \Vith ceilings. the web openings of these
members provide a passage for easy routing and installation of utilities and air
conditioning ducts.
Typically. the dimensions of a castellated beam are defined as follows (referring to
Figs. 1.2 to 1.4):
htan~ =
b
•
d = (d - h) ~ (h,,)'24
s = 2(b--:-e)
dExpansion ratio, \V :::; 2
d
where. d = original beam depth
h = depth of eut
hp = height of plate
b = width of sloping edge ofhole
dt = depth of top tee section
(For no plates, hp=O)
3
• b~ . j
s
e~ .
•
br~ •
T: l,
.~
t,.
d"
Figure 1.3 Castel1ated beam section properties
JL•5
b,~ •• T
: l,
b j c~ •~ •
••l.,.
d"
Figure 1.4 Castellated beam section properties with plate at rnid depth
•4

•
•
1.2 Failure Modes of Castellated Beams
To date, experimentaJ studies on castellated beams have reported six different modes of
failure (Kerdal & Nethercot (984). These modes are closely associated with beam
geometry. web slenderness, hole opening, type of [oading, and provision of lateraI
supports. Under given applied transverse or coupling forces, failure is likely to oecur by
one the following modes: Vierendeel or shear mechanism. flexural mechanism. laterai
torsional buckling, rupture of welded joints, web post buckling in shear and compression
buckling.
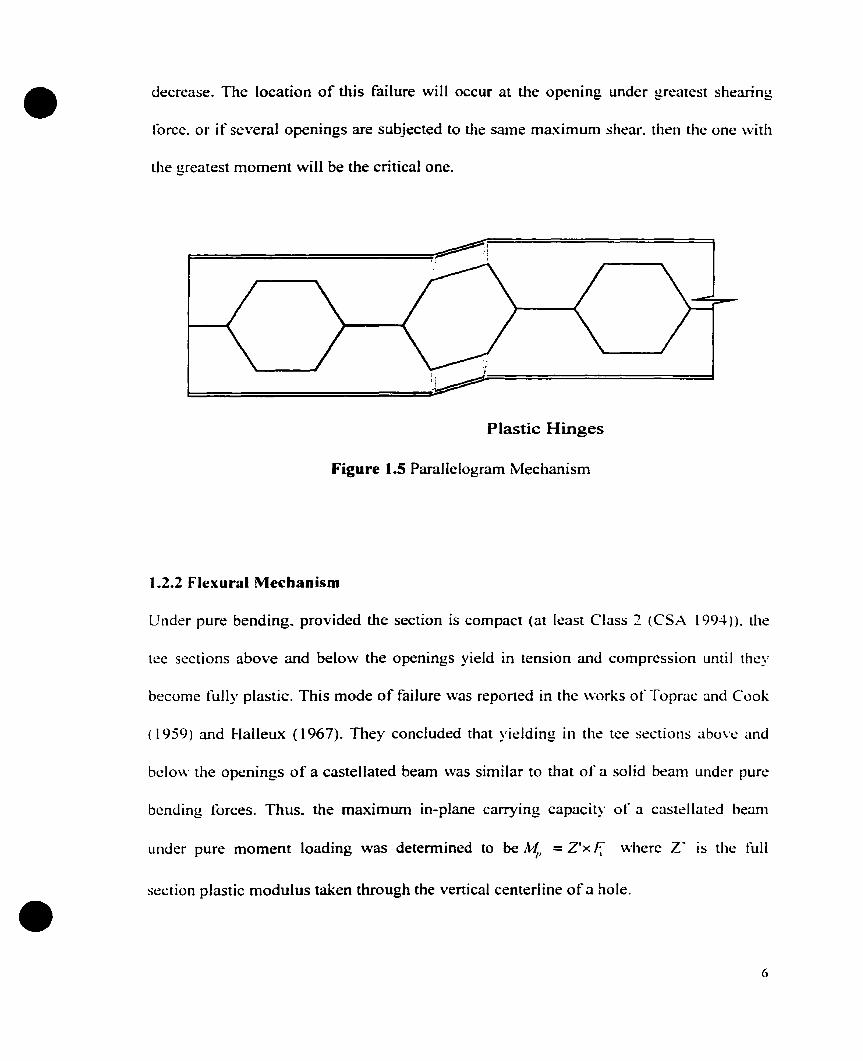
1.2.1 Vierendeel or Sbear Mecbanism
This mode of failure is associated with high shear forces acting on the beam. Fonnation
of plastic hinges at the reentrant corners of the holes defonns the tee section above the
openings to a parallelogram shape (Fig. 1.5). This mode of failure was first reported in
the works of Altifillisch (1957), and Toprac and Cook (1959). Beams with relatively
short spans with shallow tee sections and longer weld lengths are susceptible to this mode
of failure. Shorter spans can carry higher loads leading to shear becoming the goveming
load. When a castellated beam is subjected to shear, the tee sections above and below the
openings must carry the applied shear, as weil as the primary and secondary moments.
The primary moment is the conventional bending moment on the beam cross-section. The
secondary momen~ aiso known as the Vierendeel moment. results from the action of
shear force in the tee sections over the horizontal Iength of the opening. Therefore. as the
horizontal length of the opening decreases, the magnitude of the secondary moment \\"i 11
5
•
•
decrease. The location of this failure will occur at the opening under greatest shearing
force. or if several openings are subjected to the same maximum shear. then the one \Vith
the greatest moment will be the critical one.
F========::::=:;,~l
Plastic Hinges
Figure 1.5 Parallelogram rvlechanism
1.2.2 Flexural Mechanism
Under pure bending. provided the section is compact (at least Class 2 (CSA 1994)). the
tec sections above and below the openings yield in tension and compression until they
becornc fully plastic. This mode of failure was reported in the works of Toprac and Cook
( 1959) and Halleux (1967). They concluded that yie1ding in the tee sections abu\"(;: and
bclow the openings of a castellated beam was similar to that of a solid beam under pure
bending torces. Thus. the maximum in-plane carrying capacity of a castdlated beam
under pure moment loading was determined to be J~l = Z'x F; where Z· 15 the full
section plastic modulus taken through the vertical centerline of a hale.
6
•
•
1.2.3 Lateral-Tonional-Buekling
As in solid web beams, out of plane movement of the beam without any web distortions
describes this mode of failure. Lateral torsional buckling as shown in Fig.l.6. is usually
associated with longer span beams with inadequate lateraI support to the compression
flange. The reduced torsional stiffness of the web, as a result of relatively deeper and
slender section properties, contributes to this buckling mode. Nethercot and KerdaJ
(1982) investigated this mode of failure. They concluded that web openings had
negligible effect on the overall lateraI torsional buckling behavior of the beams they
tested. Funhermore, it was suggested that design procedures to determine the lateral
buckling strength of solid webbed beams could be used for castellated beams provided
reduced cross sectional properties are used.
7
•
•fig. 1.6 Lateral Torsional Buckling (Redwood & Demirdjian 1998)
•
•
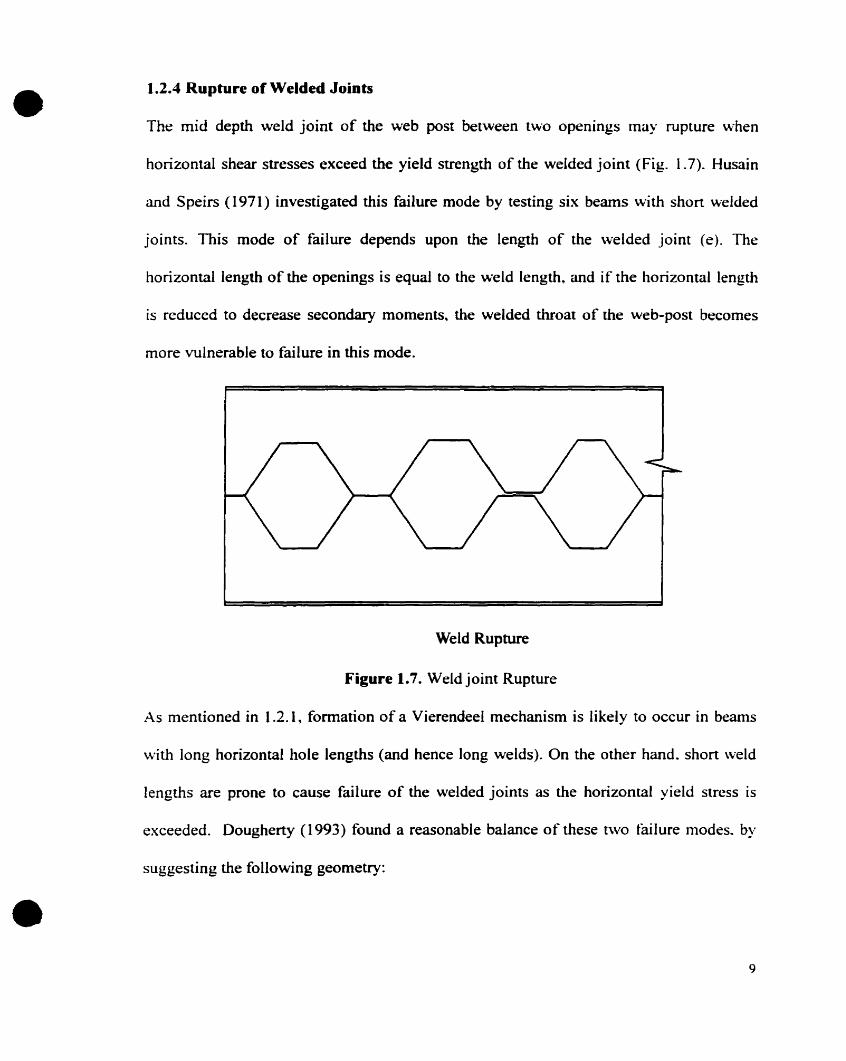
1.2.4 Rupture of Welded Joints
The rnid depth weld joint of the web post between two openings Inay rupture when
horizontal shear stresses exceed the yield strength of the welded joint (Fig. 1.7). Husain
and Speirs (1971) investigated this failure mode by testing six beams ,-"ith short welded
joints. This mode of failure depends upon the length of the welded joint (e). The
horizontal length of the openings is equal to the \veld length, and if the horizontal length
is reduced to decrease secondary moments, the welded throat of the web-post becomes
more vulnerable to failure in this mode.
Weld Rupture
Figure 1.7. Weldjoint Rupture
As mentioned in 1.2.1, fonnation of a Vierendeel mechanism is likely to oecur in beams
with long horizontal hole lengths (and hence long welds). On the other hand. short \veld
lengths are prone to cause failure of the welded joints as the horizontal yield stress is
exceeded. Dougherty (1993) found a reasonable balance of these t\VO tailure modes. by
suggesting the following geometry:
9
• Weld length h"e=-4
and for a 60° cuning angle with no plates.
•
b = O~.. = 0289h..
Therefore. opening pitch s =2(b + e)=2h.. ( 0.289 + ~) =1.08 h.. " 1.1 h..
This concept has been demonstrated in many of the current available Castelite Standard
Bearn Geometry sections. (Castelite Steel Bearn Design Manual 1996).
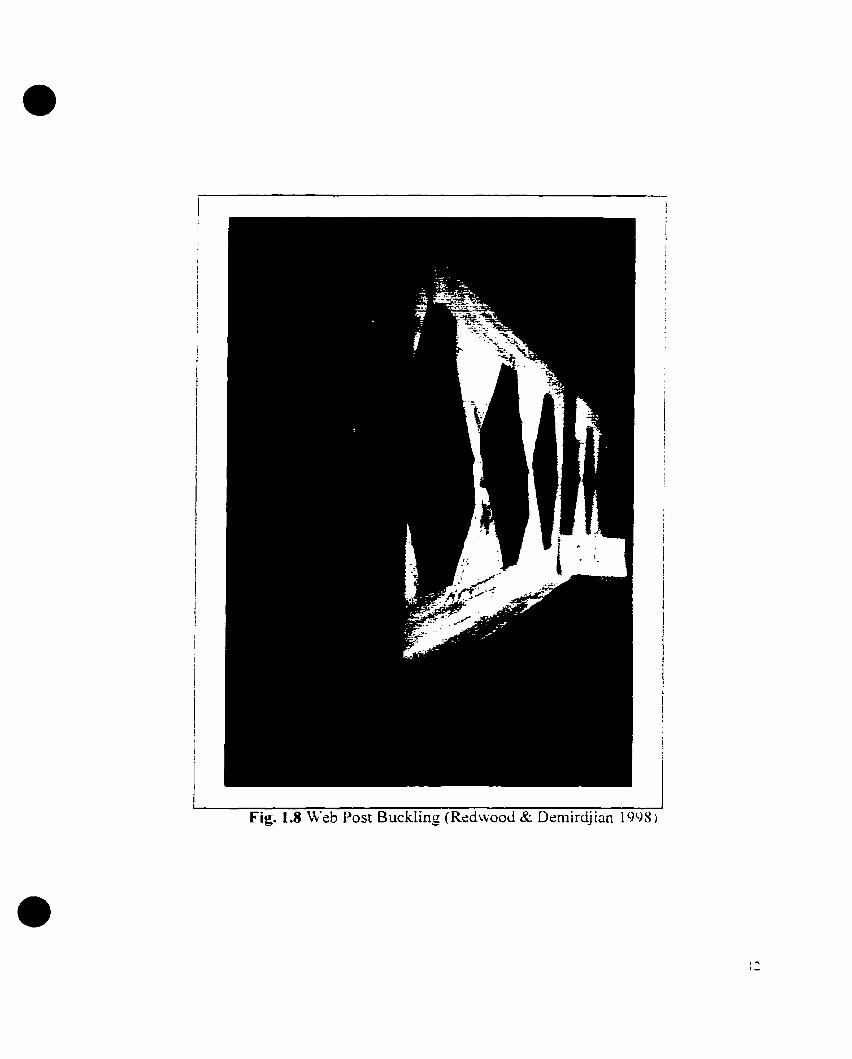
1.2.5 Web Post buckling
The horizontal shear force in the web-post is associated with double curvature bending
over the height of the post. As shown in Fig.I.8, one inclined edge of the opening will be
stressed in tension<t and the opposite edge in compression and buckling will cause a
twisting effect of the web post along its height. Several cases of web post buckling have
been reported in the literature: Sherboume (1966). Halleux (1967). Bazile and Texier
(1968).
Many analytical studies on web post buckling have also been reported to predict the web-
post buckling load due to shearing force. Based on finite ditTerence approximation tor an
ideally elastic-plastic-hardening material Aglan and Redwood (1976) produced same
graphical design approximations for a wide range of beam and hale geometries; sorne
correlations between experimental and non-linear finite element analysis (FEM)
estimations were found in the works of Zaarour and Redwood (1996). Delesque (1968)
10
•
•
used an energy method to solve an elastic buckling problem by treating the web post as a
variable section rectangular beam in double curvature bending. susceptible to laterai
torsionai buckling. However. Zaarour and Redwood (1996) found large differences in the
results obtained from Blodgen' s method in comparison to their test results and tinite
element approximations they used. Blodgett's method is therefore not used in this project.
In recent works of Redwood and Demirdjian (1998). approximations of buckling loads
were derived based on elastic finite element analysis and good correlations between
experimental and theoretical estimations were found. This work showed that the results of
Aglan and Redwood (1976) should not be used for very thin webs. This mode of failure
and these theoretical results are discussed in greater detail in subsequent chapters.
Il
•
•
1
i1
~~~~~IFig. 1.8 \Veb Post Buckling (Redwood & Demirdjian 1998)
,..,1-
•
•
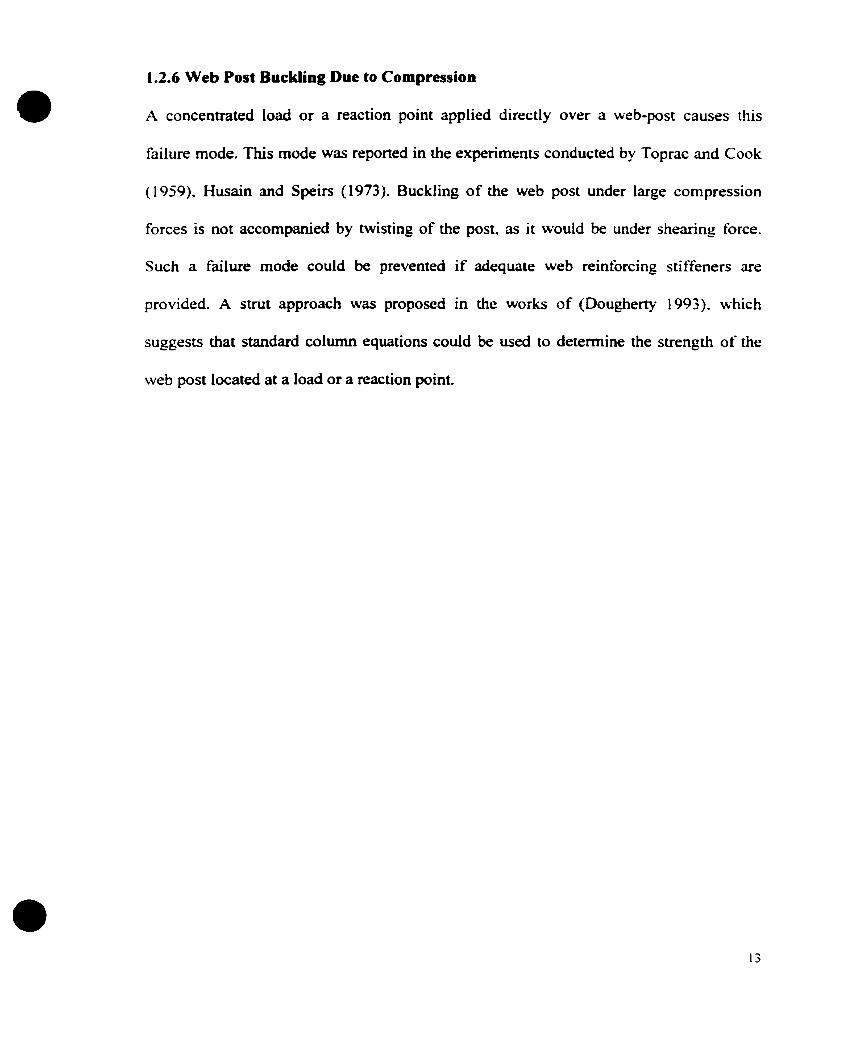
1.2.6 Web Post BuckliDg Due to Compression
A concentrated load or a reaction point applied directly over a web-post causes this
failure mode. This mode was reported in the experiments conducted by Toprac and Cook
(1959). Husain and Speirs (1973). Buckling of the web post under large compression
forces is not accompanied by twisting of the post. as it would be under shearing force.
Such a failure mode could be prevented if adequate web reintorcing stiffeners are
provided. A strut approach was proposed in the works of (Dougherty 1993). which
suggests that standard column equations could be used to determine the strength of the
web post located al a load or a reaction point.
13
•
•
1.3 RESEARCH PROGRAM
1.3.1 Objective and Scope ofWork
The objective of the current research IS to study failure of castellated beams \vith
particular emphasis on web post buckling. The goal is to make use of the available e1astic
and plastic analysis methods. and derive expressions that will predicl critical shear force
eausing web-post buckling.
This thesis uses many previous experimental results to provide compansons \vith
theoretical approximations. and thus validation of the suggested methods described.
The tÏrst part of the research program foeuses on the theoretical methods of analysis to be
used ta prediet failure loads of castellated beams. These methods include plastic analysis
of the Vierendeel mechanism and for yielding of the mid-post joints. The finite element
method is used ta perfonn elastic buckling analysis and predict eritical loads of ail test
beams. A thorough literature search then follows to list ail relevant experimental data to
he compared \Vith theoretical methods. Correlations between experimental and theoretical
results are then made.
The second part of the thesis focuses on general design considerations and thus is aimed
at the principal objective of the research. Elastic buekling modes are investigated under
different moment to shear (MN) ratios. Well-defined relationships. based on pure shear
and pure bending forces to cause web buckling. are developed to predict elastic bueklil1g
loads under any MN ratios. Results of elastic buckling and mechanism yielding loads are
then eombined and fitted curves are derived to predict ultimate shearing forces eausing
14

•
•
web-post buckling. To apply these expressions in a more general fashion. a parametric
study investigating the behavior of a wide range of castellated beam geometries is
developed. and buckling coefficients under pure shear and bending forces are derived.
Suggested predictions are then tested against actual test results. and good correlations are
obtained.
1.3.2 Outlïne of the Thesis
The thesis is divided into six sections. After a brief introduction to castellated beams and
their modes of failure of Chapter 1. Chapter 2 focuses on severaJ theoretical methods of
analysis to predict modes of failure of castellated beams. These methods include plastic
analysis. web-post yielding at mid-height~ buckling analysis. and finite element
approximations. Chapter 3 contains a summary of relevant test data provided by previous
testing and available in the literature. Relevant information on each test beam is
tabulated. Theoretical approaches described in Chapter 2 are tested against actual
experimental test beams, and reconciliation of anaJysis with test results is the topic
covered in Chapter 4.
Chapter 5 focuses on design considerations for castellated beams. Relationships detining
elastic buckling under any MIV ratio are developed. A parametric study. as weil as
expressions estimating shear force causing buckling are derived. Results of suggested
methods are tested against actual experimental test results. and correlations between tests
and theories are made. Concluding remarks are summarized in Chapter 6.
15
•
•
CHAPTERTWO
METHODS OF ANALYSIS
2.1 General
Several theoretical approaches are considered to analyze the yielding and buckling failure
modes of castellated beams. Plastic analysis of the Vierendeel mechanism failure, as \\"ell
as analysis of mid web post yielding are summarized. Elastic finite element buckling
analysis is used to preuict buckling loads. Finite element model generation as weil as
buckling analysis in the MSCINASTRAN finite element package are described.
2.2 Plastic Analysis
The construction of an interaction diagram relating shear force and bending moment at
mid-Iength of an opening has been described by Redwood (1983). This diagram can be
used to study faiIure caused by the formation of a Vierendeel mechanism formed by the
development of four plastic hinges at the re-entrant corners of the tee section. above and
below the hole. For the beam to attain this plastic failure, the web and flanges are
assumed [0 he stable and withstand the high shear load until plastic hinges are formed al
the reentrant corners of an opening in high shear region. As the load increases, primary
and secondary stresses resulting from combined effect of shear and moment forces lead to
complete yield at the four corners thus forming plastic hinges. This analysis is based on
the assumption of perfectly plastic material behavior with yielding according to Von
16

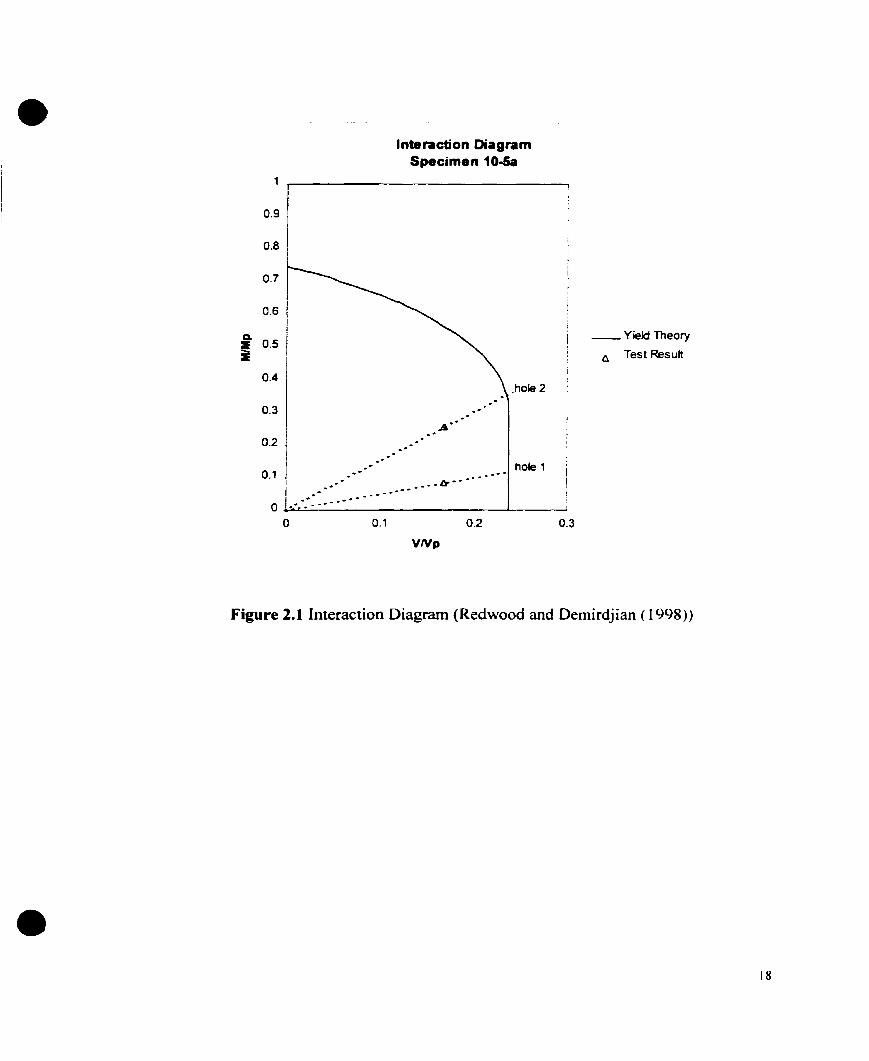
•Mises criterion. A typical interaction diagram is shown in Fig. 2.1. The shear and
moment values have been non-dimensionalized by division of the section's t'Ully plastic
shear and moment capacities.
The diagram can be constructed using the following results:
~=(l-!LJ Iii~ c{ ~~
All-~(l-~)( 1 _)[2k l (1 + ~J -1- ~(l-k,i]
4 Ar t{ .J1 + a 2 c{--=-----------=-----------_..:.1
AMI+--
4Af
And3 (2d~ )! ( hll ) ~a=- --- 1--16 e d~
•
Ta generate the curve, kt is varied between 0 and 1. Below the value 1. the curve
becomes vertica1. for given beam characteristics and hole location subjected to a laad. a
radial line can be drawn from the origin to intercept the interaction diagram for the
corresponding shear-to-moment ratio (V/M). The horizontal and vertical coordinates of
the intercepted point then predict the shear and moment values to cause yield mechanism
failure.
17
• Interaction DiagramSpecimen 10-sa
0.9
0.8
0.7
0.6
f 0.5 j
0.4.hale 2
__ Yield Theary
6 Test Result
0.3
0.2
0.1
o I.-':~~_._-_.--_.-
o 0.1
.-.A--
A.. _-........
VlVp
0.2
.._. hale 1
0.3
•
Figure 2.1 Interaction Diagram (Redwood and Demirdjian (1998»
18

•2.3 Mid-Post Yieldiag
ft is possible for yielding of the web-post at mid-height to occur betore thilure due to
formation of shear mechanism takes place. This mode of failure occurs particularly to
beams with closely spaced openings with low moment-to-shear ratio. The vertical shear
force to cause mid-post yielding is defined through,
V =(d;: -2 y ,)(et... F.~.)~h S J3 (2.1 )
and the basic approach to define this relationship (Hosain and Speirs (971) is derived by
using equilibrium equations from the free body diagram of castellated beam section as
shown in Fig. 2.2.
The horizontal shear force, Vh cao he expressed as
\vhen the vertical shear force V1 and V2 are equal, then
v x S
Vh is defined as the difference between the two horizontal forces CI and C2.
(2.2)
(2.3)
•
This equation is based on the assumption that the line of action of forces CI and Cl are
acting at the centroid of the tee section above the openings.
The web post will yield when the minimum weld-post area is subjected to the shear yield
Fil e t..,F;stress J3' or ~ = .Ji .
Due to the maximum shear stress being al the throat, the yielding is contained, and it cao
IC)
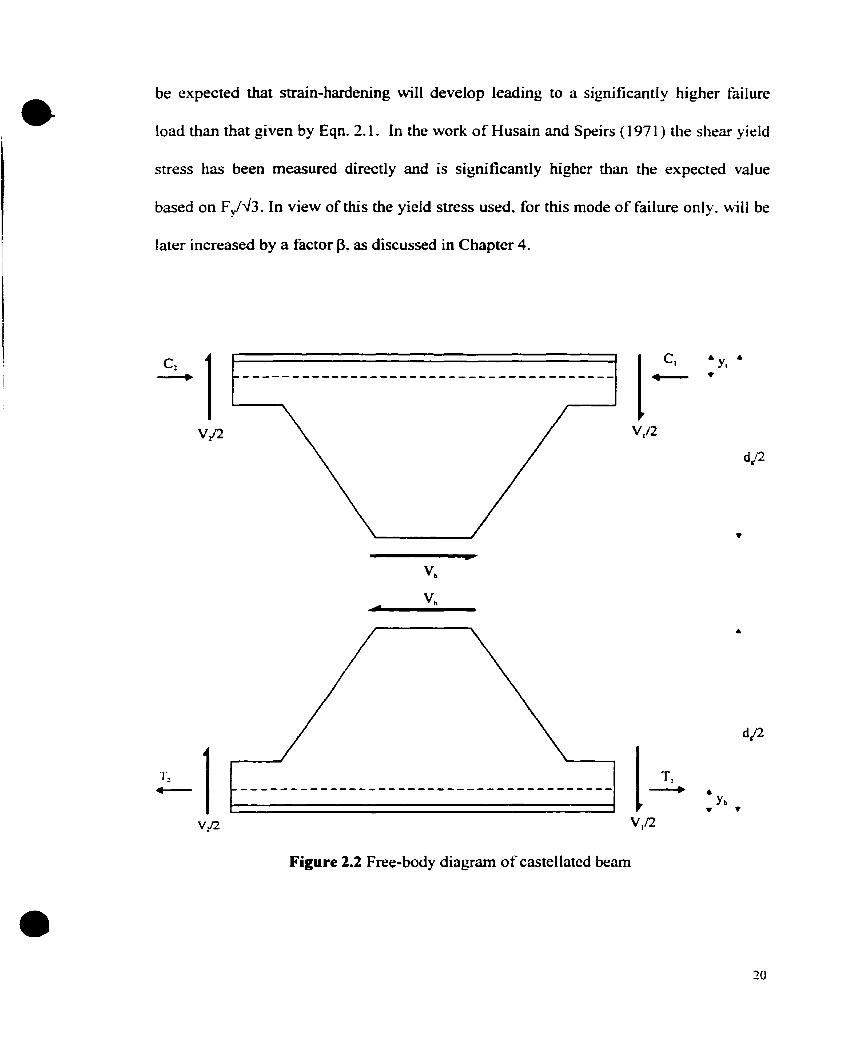
• be expected that strain-hardening will develop leading to a significantly higher failure
load than that given by Eqn. 2.1. In the work of Husain and Speirs (1971 ) the shear yidd
stress has been measured directly and is significantly higher than the expected vaJue
based on F/"';3. In view ofthis the yield stress used~ for tbis mode of failure only. will be
later increased by a factor ~, as discussed in Chapter 4.
~1V/2
[.2- • YI ••
•
d/2
•
c
~1V/2
[~V/2
d/2
•Figure 2.2 Free-body diagram ofcastellated beam
20

•
•
2.4 Buckling Analysis
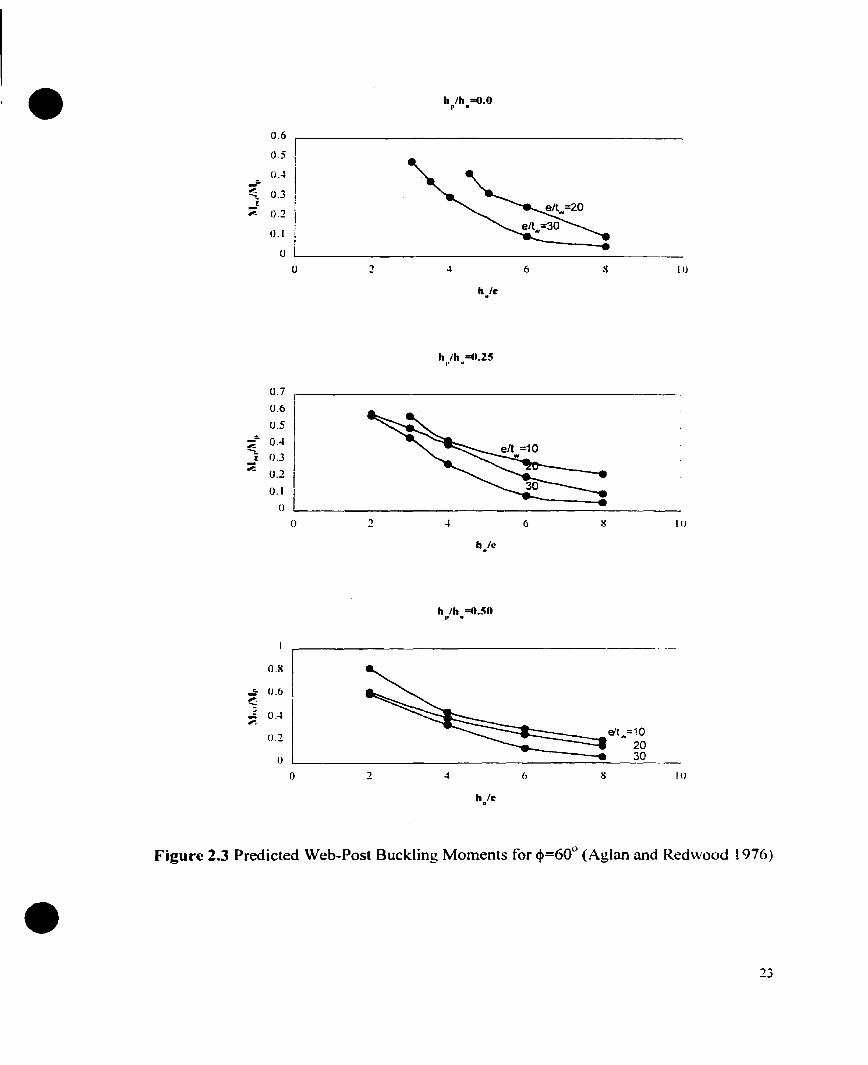
Based on a tinite difference bifurcation analysis of the web post treated as a beam
spanning between the top and bottom of the openings, graphical results relating critical
moments in the post to different beam opening geometries were developed by Aglan and
Redwood (1976). The material was considered to be an elastic-perfectly plastic linear
strain-hardening material. For different hole height to minimum width ratios. c:itical
moments in the post at the level of the top and bottom of the opening, divided by that
section's plastic moment capacity, ~ = 025 (., (s - ei If were presented. as shown in
Fig. 2.3.
For·a given beam, the value of Moc/Mp is tirst read from Fig. 2.3. By multiplying the
given ratio by the section's plastic capacity Mp , as given above. the horizontal shear
Alacting al the minimum weld length is calculated as Vh = h"". From the free body
Il
2
diagram of Figure 2.2, the VtIV ratio is given by Vh = S • Therefore. the verticalV dl:-2y,
., ''vI I.d -"}')- ~ ilL" ~}: - 1
shear force to cause buckling in the web-post is then derived as Va = .sh"
et'W Ifwhere yield on the smallest web-post cross-section J3 is an imposed upper limit on
Vçr. In the work of Zaarour and Redwood (1996), who tested 12 castellated beams.
satisfactory predictions were obtained with the Aglan and Redwood (1976) approach.
However, in more recent work (Redwood and Demirdjian 1998), tests of very thin
21
•
•
webbed castellated beams showed that the graphical results such as shown in Fig. 2.3
provided unsafe predictions. a resuIt that was believed to be due to the assumed restraint
conditions at the top and bottom of the web-pc>st. The method of Aglan and Redwood
(1976) is therefore not considered further in this study.
22
• h Ih =0.0p •
10
0.1OL.- _
o
0.6
05
DAr;;.,:' 0 ~-,. .,.,
l!'::ë 0.2
h)e
h Ih =0.25p •
0.7
0.6
0.5
::; 0.4
i 0.3::;
0.2
0.1
oo 1
~----41-t 6 10
h/e
h lb =0.50l' •
0.8
:;. 0.6
~::; 0.4
0.2
o
•Figure 2.3 Predicted Web-Post Buckling Moments for q.=6üo (Aglan and Redwood (976)
•
•
2.S FINITE ELEMENT ANALYSIS
2.S.1 General
The finite element method has previously been used to perform buckling analyses on
castellated beams and is also used in this project. This section theretore describes the
software used and the specifies of the application to castellated beams.
ln previous work (Zaarour and Redwood~ 1996 and Megharief and Redwood~ 1997) FEM
studies of the buclding of web-posts in composite and non-composite beams were found
to give good approximations of test results (2-10% variations). Bath studies utilized the
finite element package MSC/NASTRAN developed by the MacNeal Schwindler
Corporation (Caffrey and Lee 1994). The same package is used in the current research
with the objective to utilize FEM as a reliable tool to simulate experimental tests and
generate web post buckling loads.
Zaarour and Redwood (1996) studied buclding of thin webbed castellated beams based on
a single web-post model. as shown in Fig. 2.4(a). Mesh refmement was based on the
convergence of web post buclding 1000s in comparison to severa! experimental test
results. Megharief and Redwood (1997) investigated the behavior of web-post buclding
of composite castellated beams. Their model consisted of full flanges. web and transverse
stiffeners and the model comprised two complete web openings as shown in Fig. 2.4(b).
This larger model was needed in arder to incorporate the shear connection between steel
section and slab. and hence the composite action on the beam. The model used in the
24

•
•
current research is sunilar to the non-composite beam model utilized by Megharief and
Redwood (1997) as shown in Fig.2.4(b)~ however. based on the different needs in the
current work~ more refmed meshes and a greater number of openings are used. as
discussed subsequently. The following sections describe the panicular steps necessary to
use the MSC/NASTRAN system and the details of the generation of the models.

•
•
the top and boIlom Inee repruentthe fIangea ln ... x-z .ne
Fig. 2.4(a) Model used by Zaarour and Redwood (\996)
, \ \./ / / / \ V / 1 /'/1 \\ III \\Il \\ Il \\Il \\ Il \\Il \\\ Il \\\Il \\\ III \\\
Hw \\\ 1/1 ~\\\\ III '\\ /TT\\\ III \\\ III\\ III \\\ III\\ Il \\ Il
~_\~\ Il \\ Il\ \ 1 / 1 \ \ \ II--/~//---l
t-....~ -j-+--/........\ /\ \ \ 1 / /\ 1'\ \ '~~+-.............----.......I.-+-...............---.-+--+---+--+--+----If--..........:::::-.......I.-+-~-.-+----+----+-~
, ---.-' ---~I--t-..............-
Fig. 2.4(b) Non-Composite Model used by Megharief and Redwood ( 19(7)
26

•
•
2.5.2 Input File Preparntion
Elastic finite element bifurcation analysis was carried out for aIl test beams. An analysis
in MSCINASTRAN is submined in an input file. which consists of three major sections:
Executive control. Case control and Bulk data. Sample input flle is given in Appendix A.
Executive Control Section: is the first required group of statements to detine the type of
analysis. time allocation and system diagnostics.
Case Control Section: specifies a collection of grid point numbers or element numbers
to be used in the analysis. Requests output selections and loading subcases.
Bulk Data Entry: contains all necessary data for describing the structural model.
Includes geometric locations of grid points, constraints. element connections. element
properties and loads.
To prepare a detailed description of a model. the following classes of input data must be
provided:
Geometry: locations of grid points and the orientations of the coordinate system.
Element connectivity: identification number of grid points to which each element is
connected.
Element properties: definition of the thickness. and the bending properties of each
element.
lv/alerial properties: definition ofYoung's modulus and Poisson's ratio.
Constrainls: specifications of boundary and symmetry conditions to constrain free-body
motion that will cause the analysis to fail.
Loads: definition ofextemally applied loads at grid points.
27
•
•
2.5.3 Model Geometry and Type of Elements
A skeleton model based on a given beam geometry is tirst developed through defining the
x. y. and z coordinates ofeach grid point. Grid points are used to define the geometry of a
structure. to which flnite elements are attached. Each grid point possesses six possible
degrees of freedom (OOF) about the x, y, and z-axes, three translations (T 1. T2. T3) and
three rotations (R l, R2, R3), which constrain the grids to displace with the loaded
structure.
As the geometry of the strueture is defined, the grid points are conneeted by flnite
elements. Two-dimensional CQUAD4 isotropie, linear elastic (MATI) membrane
bending quadrilateral plate elements were chosen to define the flnite elements of the
model. CQUAD4 element input card is defined through four grid points whose physical
location detennines the length and width of the element. By assigning a material
identification number in the CQUAD4 input cardo ail essential material properties.
membrane, bending, thickness, shear and coupling effects of the elements are defined in
the shell element input property card (PSHELL). Similarly, linear elastic properties of the
material, modulus of elasticity, Poisson's ratio are defined in the MATI data entry input
card by assigning a property identification number in the PSHELL entry cardo
2.5.4 Constraints
Single point constraints (SPC) are used to enforce a prescribed displacement (components
of translation or rotation) on a grid point. The degrees of freedom in MSCINASTRAN
28

•
•
are defined as numbers 1~ 2~ 3~ 4~ 5, and 6~ corresponding to three translation. Tl. T2. T3.
and three rotational degrees of freedom. RI. R2. R3. The properties of CQUAD4
elements used in modeling the web. flanges and the stiffeners had zero normal twisiting
stitfness. One way to ensure non-singularity in the stiffness matrix and to account for the
out of plane rotational stiffness or the sixth degree of freedom (RJ) is through AUTOSPC
and K6ROT commands in the Bulk Data Entry. as recommended in the manuals. In aIl
models K6ROT was taken as 10.000. This value is a fictitious number assigned to
suppress singularities associated with the normal degrees of freedom. Values of 100.
10.000 or 100,000 are recommended by the manuals, however. a value of 1O~OOO was
tested to provide acceptable results. Fig. 2.5 shows a typical mesh~ this one comprising
two openings. The model is supported at the bottom left-hand corner where constraints 2
and 3 are applied; these prevent movement in the vertical and out of plane directions.
Displacements in the x and z directions at the upper and lower flange to web intersecting
nodes at the right end are restricted by constraints 1 and 3. to prevent rigid body rotation
about the z-axis. These constraints simulate symmetry of half the span of a simply
supported beam geometry. Out of plane displacements are prevented on the perimeter of
the web.
2.5.5 Loads
Shearing forces were applied to the models by assigning two transverse (negative y
direction) loads al the right hand end, as shown in Fig. 2.5. Moment loads were applied
by applying two equal and opposite (x-direction) concentrated horizontalloads at the left-
29
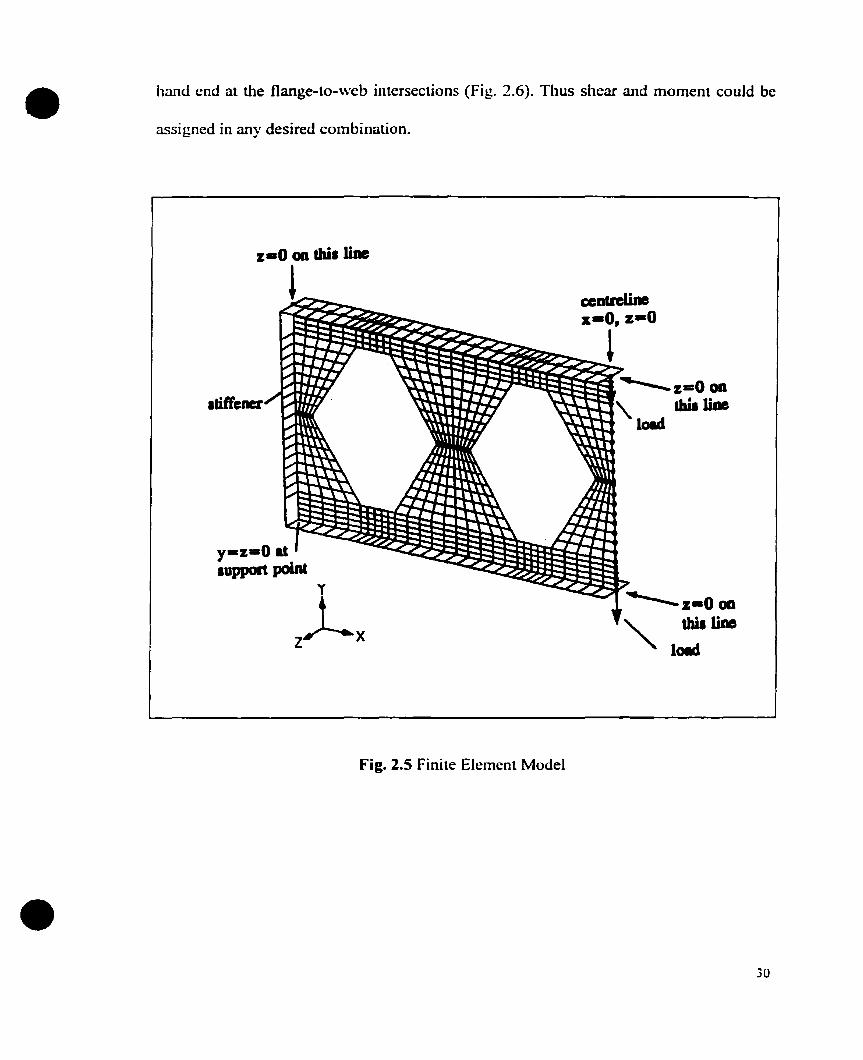
• hand end at the flange-to-web intersections (Fig. 2.6). Thus shear and moment could be
assigned in any desired combination.
•
lliffener
y-zaO alIUpport point
zLx
Fig. 2.5 Finite Element Model
............... Z-OOD
" tbiI Une1_
30

•
• Fig. 2.6 Pure Bending and Shear/Moment Arrangement
31
•
•
2.5.6 Bueklinl Analysis
The type of analysis to be perfonned in MSCINASTRAN is specified in the Executive
Case Control section in the input file using the SOL command with the CEND delimiter
to represent the end of this section.
Linear buckJing analysis is defined through SOL lOS commando Two loading conditions
must be defined in the case Control section. Subcase 1 will define the statie load
condition applied to the system., and subcase 2 selects the method of eigen value
extraction method.
The equilibrium equations for a structure subjected to a constant force May be written as
[G] {u} = {Pl
where G is the stiffiless matrix., u the displacement vector., and P the applied load vector.
To include the differential stiffness effects., [GD] the differential stiffness matrix is
introduced that results from including higher-order terms of the strain-displacement
relations (these relations are assumed to he independent of the displacements of the
structure associated with an arbitrary intensity of load).
Hence., by introducing T) as an arbitrary scalar multiplier for another '~intensity" of load.
the equilibrium equation becomes,
( [G] +rt[GD] Hu·} = {T)P} where u· is the modified displacement
veetor resulting from displacements under an intensity of load, and from differential
sti ffness effeets.
By perturbing the structure slightly al a variety of (oad intensities, the "intensity" factor 11

•
•
to create unstable equilibrium conditions. will be the factor ta cause buckling.
([G] +1l[GoJ){u·} = 0,
This requires the solution of an eigenvalue problem:
[G -llGoHcp} = o.
The solution is nontrivial. (Tl different from zero) only for specifie values ofll that would
make the matrix [G -l1Go] singular.
The product of the first load intensity factor or the first eigenvalue 11 with the applied Joad
would give the first buckJing load of the model. and the eigenvector cp. the buckJed shape.
The requirements for an eigen value solution in MSC/NASTRAN are defined in the Bulk
Data Entry. By using the EIGS entry, and specifying a set identification number for the
model. the range of interests of eigenvalue limits is determined. Two methods of
eigenvalue extraction methods are available in the software invoked by the commands:
INV and SINV. The SINV method is an enhanced version of the rNV method. lt uses
Sturm sequence techniques to ensme that all roots in the specified range have been found.
It is suggested that SINV is a more reliable and more efficient method than the INV
method, and hence is used in all computations. PARAM entry is another statement used
to account for AUTOSPC command to constrain all singularities on the stiffness matrix
as described in Section 2.S.4.
Limitations of SOLIOS required small deflections in the prebuckJed configuration and
stresses to be elastic and linearly related to strains. The two conditions were tùlly
satisfied.
33

•
•
Buckling modes resulting from the analyses were examined carefully in each case.
Unrealistic buclding modes were sometimes obtained.. for example buckling on the
tension side of the beam under pure bending.. and in each such case the associated
eigenvalue was negative. and was rejected. Under pure shear.. the two identical symmetric
modes were associated with positive and negative eigenvalues ofaimost equal magnitude.
and in sorne cases the negative one was marginally lower than the positive one. The
lowest value was accepted.
2.6 Summary
In this chapter the severa! methods of analysis used later in this thesis have been
described. Further details.. especiaIly of the FEM applications. are described when
particular applications are discussed in the following chapters.
34
•
•
CHAPTER TBREE
LITERATURE REVIEW
3.1 General
An investigation of previous literature on non-composite castellated beam tests was
conducted from which data was obtained in order to make comparisons between
experimental and theoretical resuIts in later chapters. For each test beam.. the section
properties, geometry and experimental arrangements were studied and relevant data are
summarized in tables at the end of this chapter.
3.2 Literature Review
Reviews on non-composite castellated beams have been extensively reported in the
literature. However, generally accepted design methods have not been established due ta
the complexity of castellated beams and their associated modes of failure. An outline of
previous experimental work on castellated beams is reported here with the objective of
describing only the main features of each investigation. The data and test results for the
beams described are the subject of detailed analysis in subsequent chapters of this thesis.
The test programs are described in reverse chronological order.
35

•
•
3.2.1 Redwood and Demirdjian (1998)
Four casteUated beams9 two identical ones with four openings 10-5(a), IO-5(b). a third
'.vi th six openings (10-6) and a fourth with eight openings (10-7), aU with identical cross
sectional properties. were tested. The main focus of the experiment was to investigate the
buckling of the web post between holes and to study any effects of moment-to-shear ratio
on the mode of failure. Simple supports and a centra! single concentrated load were used
for aIl specimens. AlI beams were provided with bearing stiffeners at support and at load
points. Mean flange and web yield stress values were obtained from tensile coupon tests.
Based on the experimental ultimate loads, except beam 10-7, which failed by lateral
torsional buckling, buckling of the web post was the observed mode of failure of aU these
beams. Bearn 10-7 is omitted from funher consideration in this project.. since interest is in
web buckling oruy. The buckling mode involved twisting of the post in opposite
directions above and below the mid-depth. Ultimate load values were given as the peak
test loads. Test conditions were then simulated by elastic fmite element analysis. and
good predictions of the buckling loads were reported (4-14% variations).
3.2.2 Zaarour (1995)
Fourteen castellated beams fabricated from 8.10,12. and 14 inch Iight beams (Bantam
sections manufactured by Chaparral Steel Company) were tested. Six of these had 2 in.
(50.8 mm) high plates welded between the two beam halves al the web-post mid-depth.
The objective of the experiments was to study the buckling of the web post between
36
•
•
openings. Simple suppons and a central single concentrated load were used for ail
specimens. AH beams were provided with bearing stiffeners at support and at load points.
Average flange and web yield stresses were obtained from tensile coupon tests for each
size of beam.
The reported ultimate strengths were based on peak load capacities of the beams. Web
post buckling was observed in the failure of 10 cases, and in two cases. local buckling of
the tee-section above the openings subjected to greatest bending moments occurred. Two
laterai torsional buckling modes were also observed; these have been omitted from
further consideration since interest is in web buck1ing only. FEM analysis was aiso used
to predict web-post buckling load.
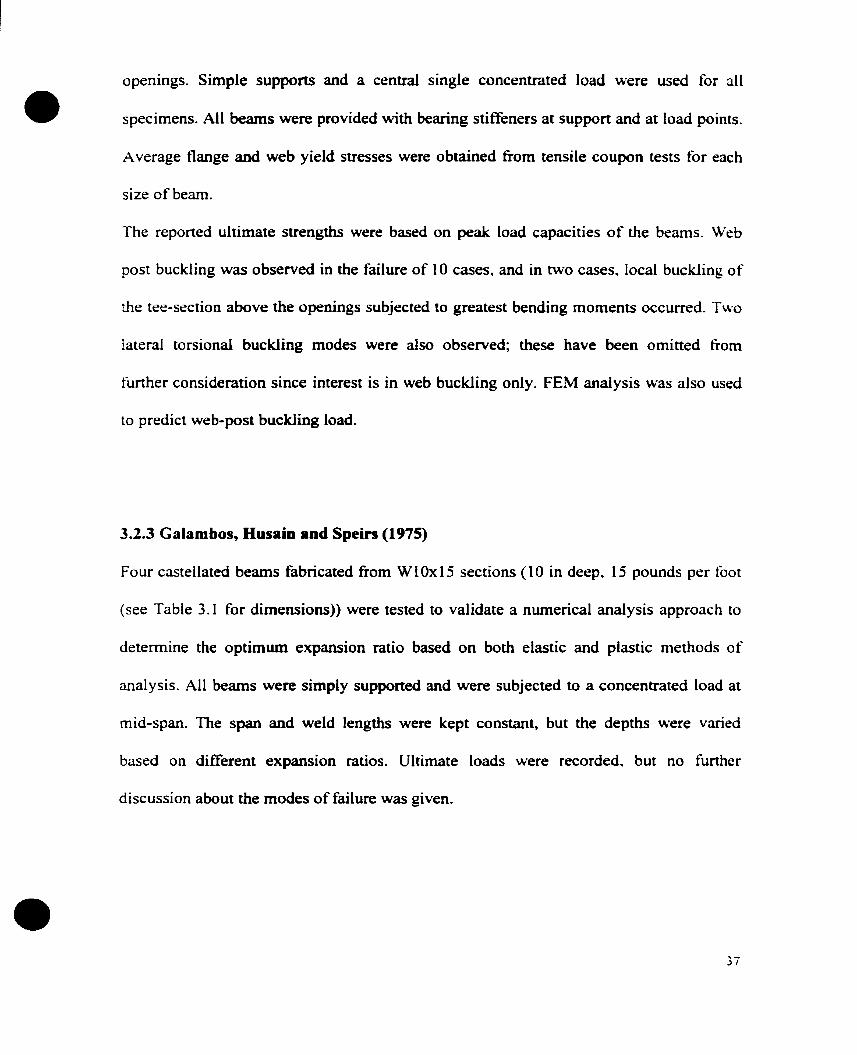
3.2.3 Galambos, Husain and Spein (1975)
Four castellated beams fahricated from W 1Ox 15 sections (Iain deep. 15 pounds per foot
(see Table 3.1 for dimensions» were tested to validate a numerical analysis approach to
determine the optimum expansion ratio based on both elastic and plastic methods of
analysis. AlI beams were simply supponed and were subjected to a concentrated load at
mid-span. The span and weld lengths were kept constant, but the depths were varied
based on different expansion ratios. Ultimate loads were recorded. but no further
discussion about the modes of failure was given.
37
•
•
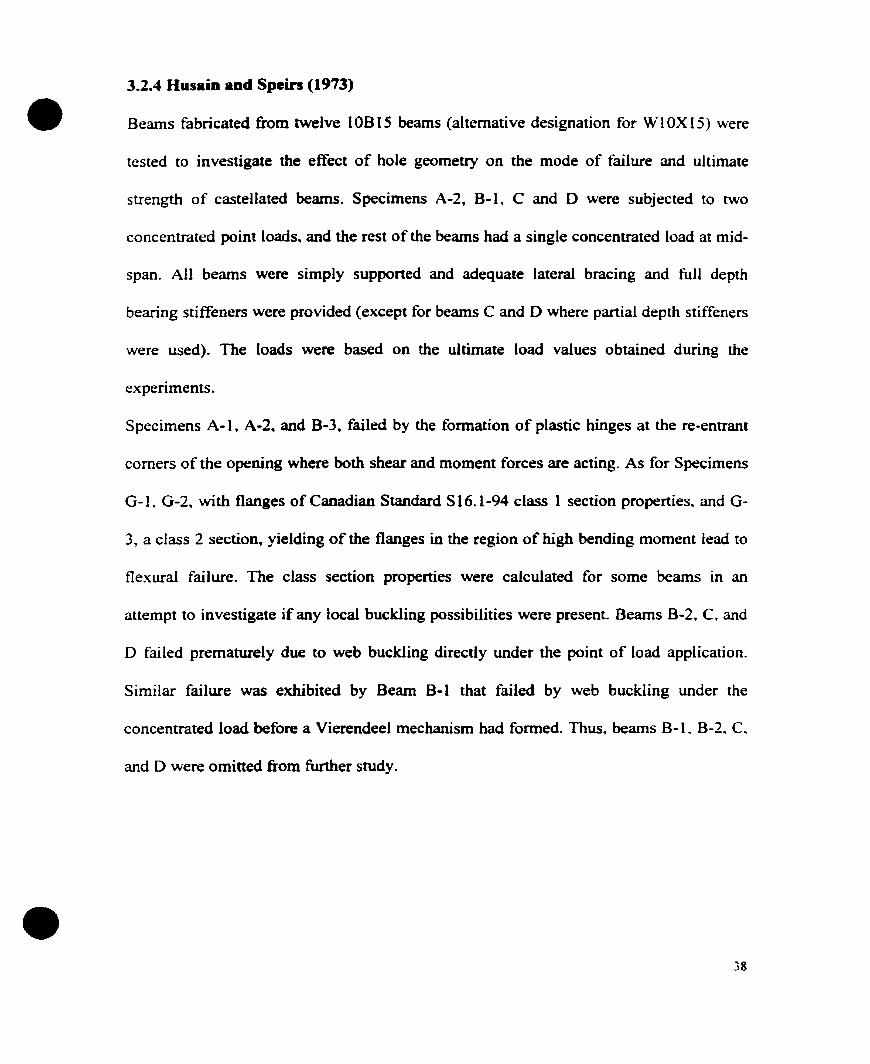
3.2.4 Husain and Spein (1973)
Beams fabricated from twelve lOB 15 beams (alternative designation for W1OX 15) were
tested to investigate the effect of hole geometry on the mode of failure and ultimate
strength of castellated beams. Specimens A-2, B-l, C and 0 were subjected to two
concentrated point 10OOs, and the rest of the beams had a single concentrated load at mid
span. Ail beams were simply supponed and adequate JateraJ bracing and full depth
bearing stiffeners were provided (except for beams C and D where partial depth stiffeners
were used). The loads were based on the ultimate load values obtained during the
experiments.
Specimens A-l, A-2, and B-3, failed by the formation of plastic hinges at the re-entrant
corners of the opening where bath shear and moment forces are acting. As for Specimens
G-I. G-2, with flanges of Canadian Standard S16.1-94 class 1 section properties. and G
3, a class 2 section, yielding of the flanges in the region of high bending moment lead to
flexural fai1ure. The class section properties were calculated for sorne beams in an
attempt to investigate if any local buckling possibilities were present. Beams B-2, C. and
o failed prematurely due to web buckling directly under the point of Joad application.
Similar failure was exhibited by Bearn B-I that failed by web buckling under the
concentrated load before a Vierendeel mechanism had formed. Thus, beams B-l. B-2. C.
and D were omitted from further study.
38
•
•
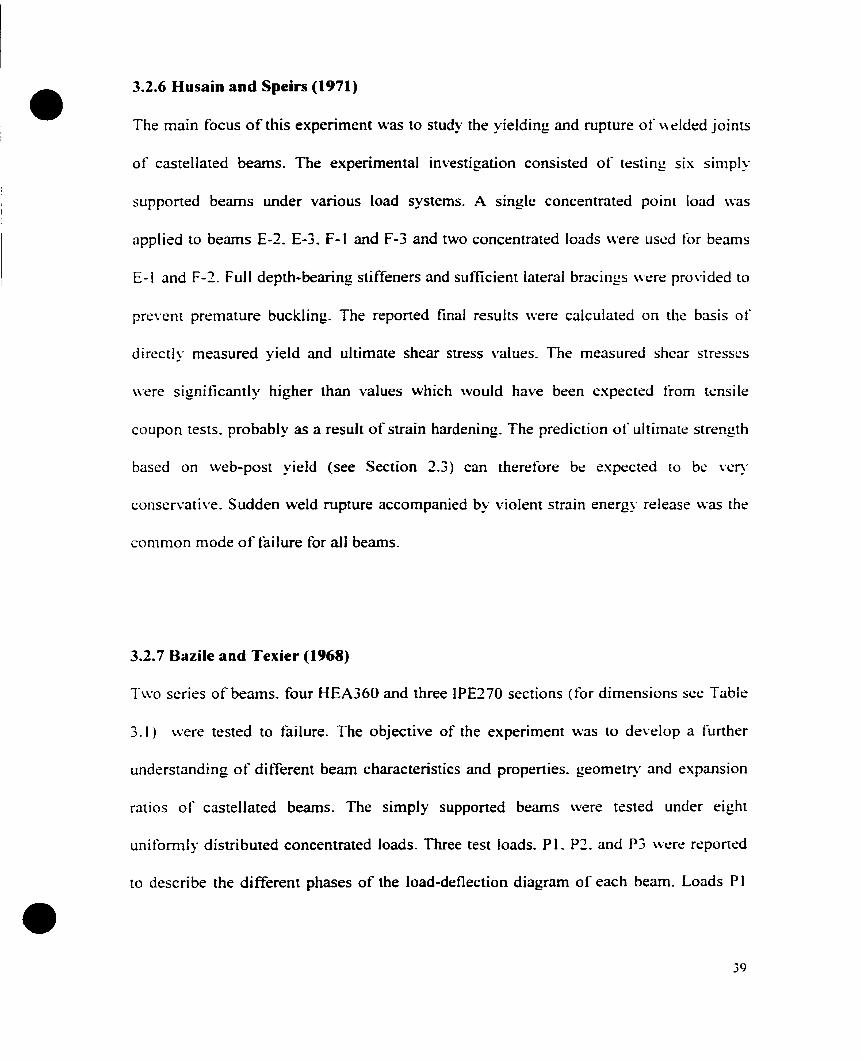
3.2.6 Husain and Speirs (1971)
The main focus of this experiment was to study the yielding and rupture of \\ e1ded joints
of castellated beams. The experimental investigation consisted of testing six simply
supported beams under various load systems. A single concentrated point laad was
applied to beams E-2. E-3. f-I and f-3 and two concentrated loads were us~d tor beams
E-I and F-2. Full depth-bearing stiffeners and sufficient lateral bracings w~r~ pro\'ided to
prevent premature buckling. The reported final results were calculated on the basis of
directly measured yield and ultimate shear stress values. The measured shcar stresses
were significantly higher than values which would have been expected from tensile
coupon tests. probably as a result of strain hardening. The prediction of ultimate strength
based on web-post yield (see Section 2.3) can therefore be expected to be very
conservative. Sudden weld rupture accompanied by violent strain energy release was the
common mode of tài1ure for aIl beams.
3.2.7 Bazile and Texier (1968)
Two series of beams. four HEA360 and three IPE270 sections (for dimensions see Table
3.1) were tested to failure. The objective of the experiment was to develop a further
understanding of different beam characteristics and properties. geometry and expansion
ratios of castellated beams. The simply supported beams were tested under eight
uniformly distributed concentrated loads. Three test loads. PI. P2. and P3 weœ reported
to describe the different phases of the load-deflection diagram of each beam. Loads PI
39
and P2 define sudden changes in slope and P3 was the ultimate load. Flange and web
• yield stresses were obtained from beam coupon tests and full depth stitTeners were
provided at support reaction points. Beams A~ B and E failed under web buck1ing in the
zone of maximum shear. The beams F and G failed by lateraI torsional buckling and were
thus omitted from funher study herein. Beams C and D had deep (200mm) plates at mid
depth. and were reponed as failing by web-post buckling. Estimated strengths of the posts
of these two beams, using the column strength formula of CSA (1994) assuming widths
equal to the maximum and minimum actual widths~ bracket the ultimate test value of the
concentrated load. It is therefore evident that these were compression buckling failures
under the action of the concentrated loads acting directiy above the unstiffened web
posts. Since tms mode is not being studied~ these two beams were not considered funher.
3.2.8 Halleux (1967)
Five types of beams with different geometrical properties~ all fabricated from the IPE300
roUed steel sections, were tested to destruction under two equal concentrated loads
appl ied at the third.span points. The experimental failure load was based on the
intersection of the tangent to the linear pan of the load vs. deflection diagram with the
tangent to the almost horizontal part of the curve. Measured yield stresses are not
reported. Calculations in the reference are based on the yield stress of the materia!. that is.
24 kg/mm2 (235 MPa), and it is later stated that yield stresses determined from unreported
tensile tests were significantly higher than the above·mentioned value. Therefore. due to
• 40
•
•
the uncertainty in the yield stresses the reported results must be treated circumspectly.
3.2.9 Sherboume (1966)
This test pragram was designed to investigate the interaction of shear and moment forces
on the behavior of castellated beams under varying load conditions. The test arrangement
consisted of simply supported beams with full depth bearing stiffeners under load and
reaction points. Seven tests were perfonned which ranged from pure shear to pure
bending loading conditions. Load-detlection curves are given in the paper. From these the
ultimate loads and loads obtained from the intersection of tangents to the initial linear
part and to the aImost linear post-yield part were obtained. Bearn El, subjected to a single
concentrated laad at mid-span, failed through extensive yielding of the throat at mid
depth of the post between the first and second hole opening. Bearn E2 was designed to
investigate the effect of pure moment, and was subjected to two concentrated point loads.
Failure of this beam however, was outside the central control section and was associated
with extensive yielding in the end zones experiencing both shear and moment forces. The
hale closest ta the load was the most severely damaged. Web buckling was the mode of
failure of specimen E3 in the zone of maximum shear, under the two point loading
system. Specimen E4 was designed to study the etfect of pure shear across the central
opening. The detlection curve demonstrates considerable strain-hardening, and web
buckling was the observed mode of failure. Beams LI, L2, and L3 were tested under pure
bending moments. The first two were reponed ta fail by flexuraJ mechanisms. L3 was
also reponed to fail by tlexural mechanism, however, lateraI torsionaI buckling was also
associated with the failure mode.
~I
•
•
3.2.10 Toprae and Cooke (1959)
Nine castellated beams fabricated from 8810 roUed sections were tested to destruction.
The objectives of the investigation were to study the structural behavior in elastic and
plastic ranges. to study load carrying capacity and modes of faiIure~ to compare observed
results with theoretical calculations, and to determine an optimum expansion ratio for
such beams. Loads were applied at four concentrated points and failure loads were
reported as the ultimate loads. Well-defined yield stress values were obtained through
coupon tests and adequate bearing stiffeners were provided under reaction points.
Specimens A and C failed through excessive laterai buckling and are omitted from further
study. The ultirnate load of specimen 8 was recorded~ but no further details were given.
As for specimen D which had a class 2 web tee stem section~ web throat, tee section and
compression flange yieiding progressed in the shear span. As the maximum load was
reached. yield at the top Iow moment hole corner and at web-post mid-depth was evident.
y ielding and buckling of the compression flange in the pure bending region was the
failure mode of Beam E. Local buckling of the compression flange in the constant
moment region was aIso the observed failure mode of specimen F; however. as the load
\Vas further increased~ the beam buclded laterally. A Vierendeel mechanism in the region
of highest shear was the mode of failure of specimen G. Specimen H. with a class 2
nange section, failed through buclding of the compression flange in the constant moment
region. Specimen l, with a class 1 web tee stem section failed through a Vierendeel
mechanism in the highest shear region.
42

•
•
3.2.11 Altf-'lliscb, Cooke and Toprac (1957)
The objective of the investigation was to study the structuraI behavior of castellated
beams bath in the elastic and plastic ranges. and to study their strength and mode of
failure. Three joists fabricated from lOB Il.5 shapes with equal spans and simple supports
and with varying positions of two symmetricaJ concentrated loads were used. Varying
expansion ratio, beam depths. hole and web.post geometries were studied for each of
these tests. Test loads were reported as the ultimate loads obtained during the
experiments. Bearn A was provided with full bearing stiffeners under each load. It failed
through extensive yielding of the tee section and local compression flange buckling in the
region of constant moment. The flange to width ratio of beam A corresponded to a class 2
section.
Beam B consisted of three tests. In the first two, BI and B2. loads were in the elastic
range in arder to verify theoretical stress and deflection analyses. The third test. B3.
involved loading to destruction, but was omined from further study because of the
inadequacy of lateraI bracing system.
Beam C was provided with shon bearing stiffeners. (approximately half beam depth)
below the load points. The first two tests were in the elastic range and the third was
loaded to destruction. The failure mode of this beam involved yielding of the web at the
top law-moment corner of the opening in the shear span nearest the load application
point. followed by local buckling of the compression flange at the other end of the
opening. The flange had a Class 2 section properties. Yielding of the throat was also
noticed.

•
•
TABLE 3.1 Redwood & Demirdjian (1998)BEAM 10-5a 10-5b 10-6 10-7
d • 380.50 380.50 380.50 380.50g
br a 66.90 66.90 66.90 66.90tw
a 3.56 3.56 3.56 3.56a 4.59 4.59 4.59 4.59tr
e a 77.80 77.80 77.80 77.80ho
a 266.20 266.20 266.20 266.20sa 306.40 306.40 306.40 306.40<pb 60.2 60.2 60.2 60.2
Fywebc 352.90 352.90 352.90 352.90
Fvt1am~ec 345.60 345.60 345.60 345.60
TABLE 3.2.a Zaarour & Redwood (1996)BEAM 8-1 8-2 8-3 8-4
d il 302.64 359.66 307.34 358.90g
bra 59.44 58.42 4.57 58.42
t il 3.43 3.48 3.51 3.48wtr il 4.69 4.72 4.57 4.72e il 48.51 48.26 57.40 58.67ha3 222.25 270.76 222.25 270.00
a 224.02 222.25 342.90 342.90sh a 0.00 50.80 0.00 50.80p<pb 60.1 60.1 44.0 44.0F.,., C 374.40 374.40 374.40 374.40
TABLE 3.2.b Zaarour & Redwood (1996) (continued)BEAM 10-1 10-2 10-3 10-4
d il 370.59 417.83 376.43 425.45g
br a 69.09 69.85 70.61 70.61t il 3.58 3.61 3.61 3.68wtr a 4.39 3.98 4.45 4.27
a 58.17 57.66 57.91 58.93e
haa 245.87 295.15 260.53 308.10sa 254.00 254.00 368.30 368.30h a 0.00 50.80 0.00 50.80p<pb 60.3 60.3 45.4 45.4F C 357.10 357.10 357.10 357.10v
For il b c. refer to description of footnotes on page 51 .
•
•
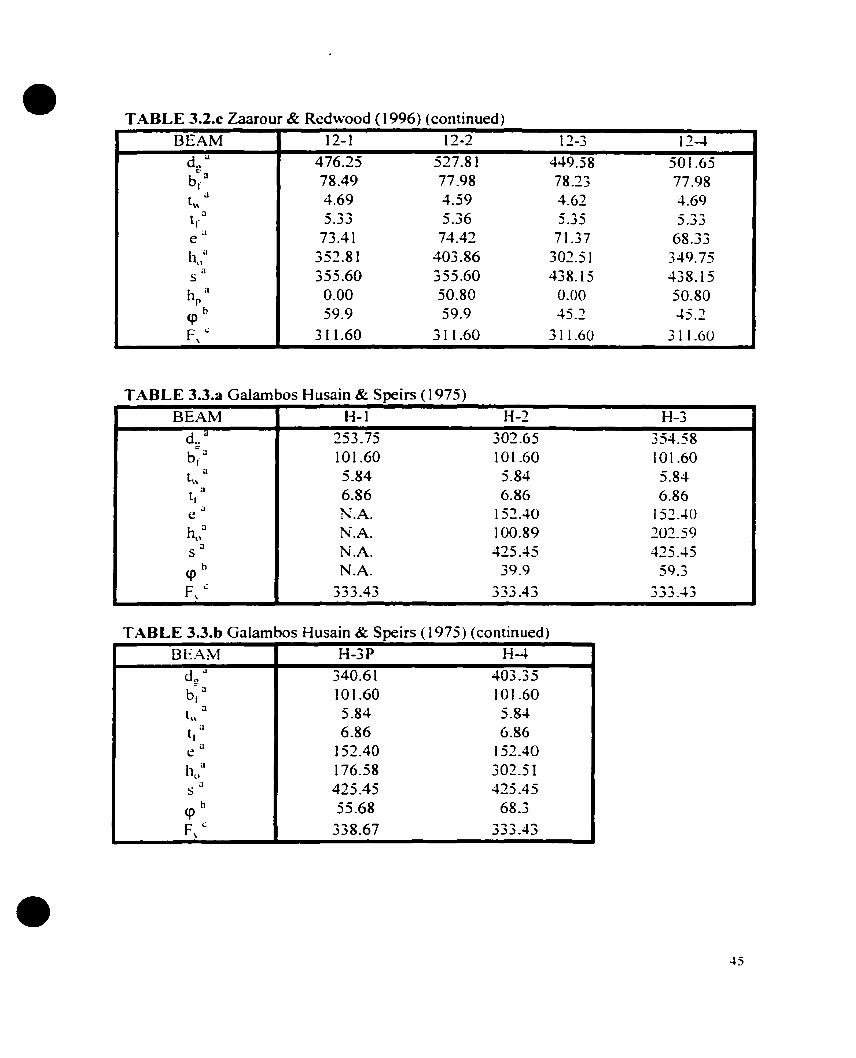
TABLE 3.2.c Zaarour & Redwood (1996) (continued)
BEAM 12-1 12-2 12-3 12-4d.. il 476.25 527.81 449.58 501.65
co
bra 78.49 77.98 78.23 77.981\\
a 4.69 4.59 4.62 4.69a 5.33 5.36 5.35 5.33lfa 73.41 74.42 71.37 68.33e
hoa 352.81 403.86 302.51 349.75a 355.60 355.60 438.15 438.15s
hpa 0.00 50.80 0.00 50.80
<ph 59.9 59.9 45.2 45.2
F\ -= 311.60 31 1.60 311.60 311.60
TABLE 3.3.a Galambos Husain & Speirs (1975)
BEAM H-l H-2 H-3
d:!il 253.75 302.65 354.58
b- a 101.60 101.60 101.601
t\\
a 5.84 5.84 5.84a 6.86 6.86 6.86l,a N.A. 152.40 152.40ea N.A. 100.89 202.59hoa N.A. 425.45 425.45s
<ph N.A. 39.9 59.3
F\.: 333.43 333.43 333.43
TABLE 3.3.b Galambos Husain & Speirs (1975) (continued)
BEAM H-3P H-4
d:!il 340.61 403.35
b- .1 101.60 101.60r1\\
a 5.84 5.84a 6.86 6.8611a 152.40 152.40e
h()a 176.58 302.51a 425.45 425.45s
<ph 55.68 68.3
F\..: 338.67 333.43
45

•
•
TABLE 3.4.a Husain & Speirs ( 1973)
BEAM A-I A-2 8-1 B-2d~ a 381.00 381.00 381.00 381.00b- a 101.60 101.60 101.60 10 l.60rln
a 5.84 5.84 5.84 5.84a 6.83 6.83 6.83 6.83lia 165.10 165.10 127.00 127.00t:
h'la 254.00 254.00 254.00 254.00a 584.20 584.20 400.05 400.05sh 45.0 45.0 60.0 60.0<p
F.: 437.95 335.02 335.02 335.02\
TABLE 3.4.b Husain & Speirs (1973) (continued)
BEAtvt 8-3 G-I G-2 G-3
d..a 381.00 381.00 381.00 381.00
=-a101.60 101.60 101.60 101.60br
lna 5.84 5.84 5.84 5.84
01 6.83 6.83 6.83 6.83lia 127.00 44.45 34.93 28.58~
h'la 254.00 254.00 254.00 254.00a 400.05 381.00 254.00 190.50s
<pb 60.0 41.0 54.1 62.3
F .: 335.02 437.95 314.12 407.27\
TABLE 3A.c Husain & Speirs (1973) <continued)
BEANt C Dd..
<l 381.00 381.00=-a
101.60 101.60brl\\
a 5.84 5.84;1 6.83 6.83lia 101.60 88.90ca 254.00 254.00hoa 457.20 323.85sb 45.0 60.0<p
F~ 335.02 335.02\

•
•
TABLE 3.5.a Husain & Speirs (1971)BEAM E-l E-3 E-3
dg d 381.00 381.00 38 1.00br
a 101.60 101.60 101.60t\\
a 4.88 4.88 4.88t a 6.83 6.83 6.83r
a 68.33 68.33 68.33ehu
a 254.00 254.00 254.00a 390.53 390.53 390.535b 45.00 45.00 45.00q>
F\..: 148.21 148.11 248.21
TABLE 3.S.b Husain & Speirs (1971) (continued)BEAM F-I F-2 F-3
d..a 381.00 381.00 381.00
="a101.60 101.60 101.60br
t\\
a 5.33 5.33 5.33a 6.83 6.83 6.83lra 50.55 50.55 50.55e
hl)a 254.00 154.00 254.00a 147.65 247.65 247.65s
q>b 60.00 60.00 60.00F ..: 248.21 248.21 248.21\
TABLE 3.6.a Bazile & Texier (1968)
BEANt A B C 0d!!a 500.00 600.00 700.00 700.00b~ a 300.00 300.00 300.00 300.00l\\
a 10.00 10.00 10.00 10.00a 17.50 17.50 17.50 17.50lra 168.00 168.00 168.00 168.00ea 300.00 370.00 500.00 470.00hoa 504.00 504.00 504.00 504.00s
hra 0.00 130.00 100.00 230.00
<ph 60.8 55.0 60.8 55.0
FY\\Ch..: 370.00 302.00 315.00 315.00
F\ J1an~c1: 299.00 245.00 256.00 272.00
.p
•
•
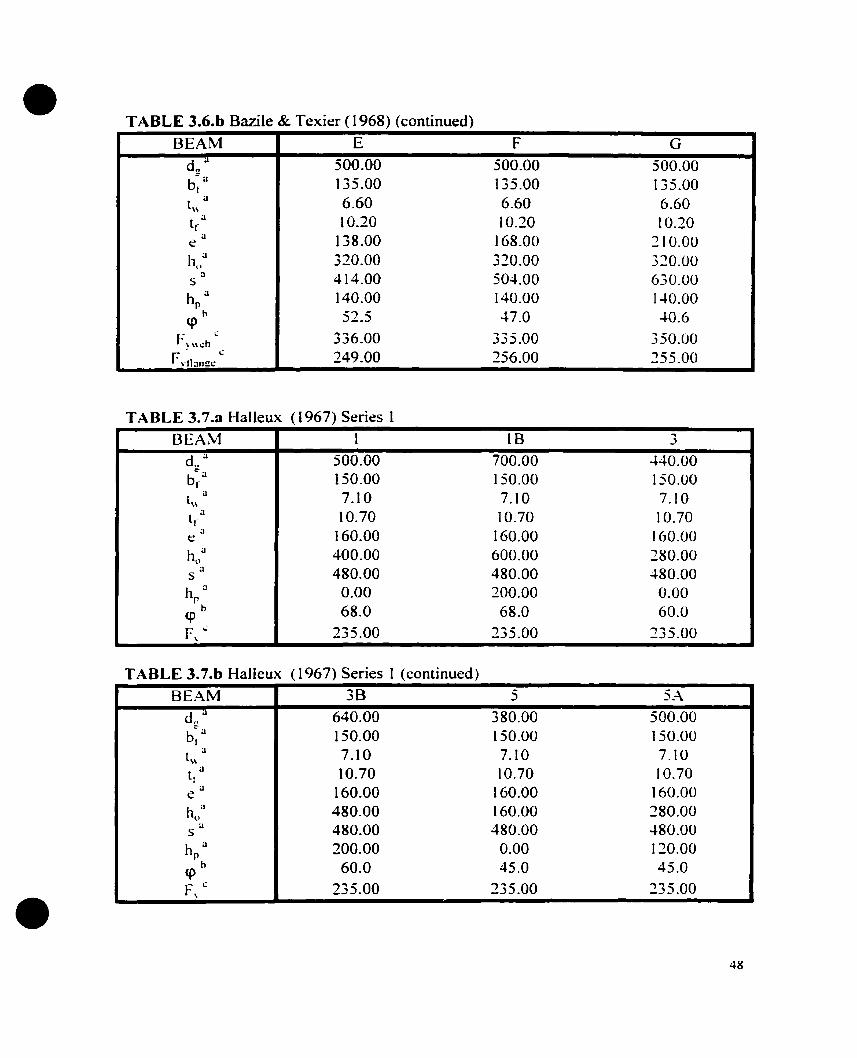
TABLE 3.6.b Bazile & Texier (1968) (continued)
BEAM E F G
d... " 500.00 500.00 500.00='b a 135.00 135.00 135.00f
t\\il 6.60 6.60 6.60
il 10.20 10.20 10.20lfa 138.00 168.00 210.00e
hl'il 320.00 320.00 320.00il 414.00 504.00 630.00s
hril 140.00 140.00 140.00
" -., - 47.0 40.6<p )_.)
FY\\l.:b1: 336.00 335.00 350.00
fv1hm!!C1.: 249.00 256.00 255.00
TABLE 3.7.a Halleux (1967) Series 1
BEAM 1 lB ~
-'d~ il 500.00 700.00 440.00b~·a 150.00 150.00 150.00t\\
il 7.10 7.10 7.10ta 10.70 10.70 10.701
il 160.00 160.00 160.00e
hl'il 400.00 600.00 280.00il 480.00 480.00 480.00s
hril 0.00 200.00 0.00b 68.0 68.0 60.0<p
F ..: 235.00 235.00 235.00\
TABLE 3.7.b Halleux (1967) Series 1 (continued)
BEAM 3B 5 5A
d.. il 640.00 380.00 500.00~il
150.00 150.00 150.00bl
t\\
il 7.10 7.10 7.10il 10.70 10.70 10.70t fil 160.00 160.00 160.00eil 480.00 160.00 280.00hoil 480.00 480.00 480.00s
h il 200.00 0.00 110.00r<ph 60.0 45.0 45.0F C 235.00 235.00 235.00
\
48

•
•
TABLE 3.7.c Halleux (1967) Series 2 (continued)
BEAM 1 ... 3B.J
d" " 500.00 440.00 640.00e-
a 150.00 150.00 150.00brln
a 7.10 7.10 7.10t a 10.70 10.70 10.70r
a 212.00 212.00 212.00eho
a 400.00 280.00 480.00;J635.00 635.00 635.00s
hra 0.00 0.00 200.00h 62.0 52.0 52.0<p
F ~ 235.00 235.00 235.00\
TABLE 3.7.d Halleux (1967) Series 2 (continued)
BEAM 5 5Ad,," 380.00 500.00
::"a150.00 150.00br
t\\
a 7.10 7.10a 10.70 10.7011a 212.00 212.00ea 160.00 180.00hoa 635.00 635.00s
hra 0.00 120.00b 37.0 37.0<p
F\ ~ 235.00 135.00
TABLE 3.8 Sherbourne (1966)BEAM E-l. L-l E-2. L-2 E-3. L-3 E-4
d~;J 228.60 228.60 228.60 128.60b~a 76.20 76.20 76.20 76.20t\\
u 5.84 5.84 5.84 5.841 a 9.58 9.58 9.58 9.58r
a 38.10 38.10 38.10 38.10ca 152.40 151.40 152.40 152.40hoa 164.59 164.59 164.59 164.59s
q>b 60.00 60.00 60.00 60.00
F, l: 283.00 283.00 283.00 283.00
•
•
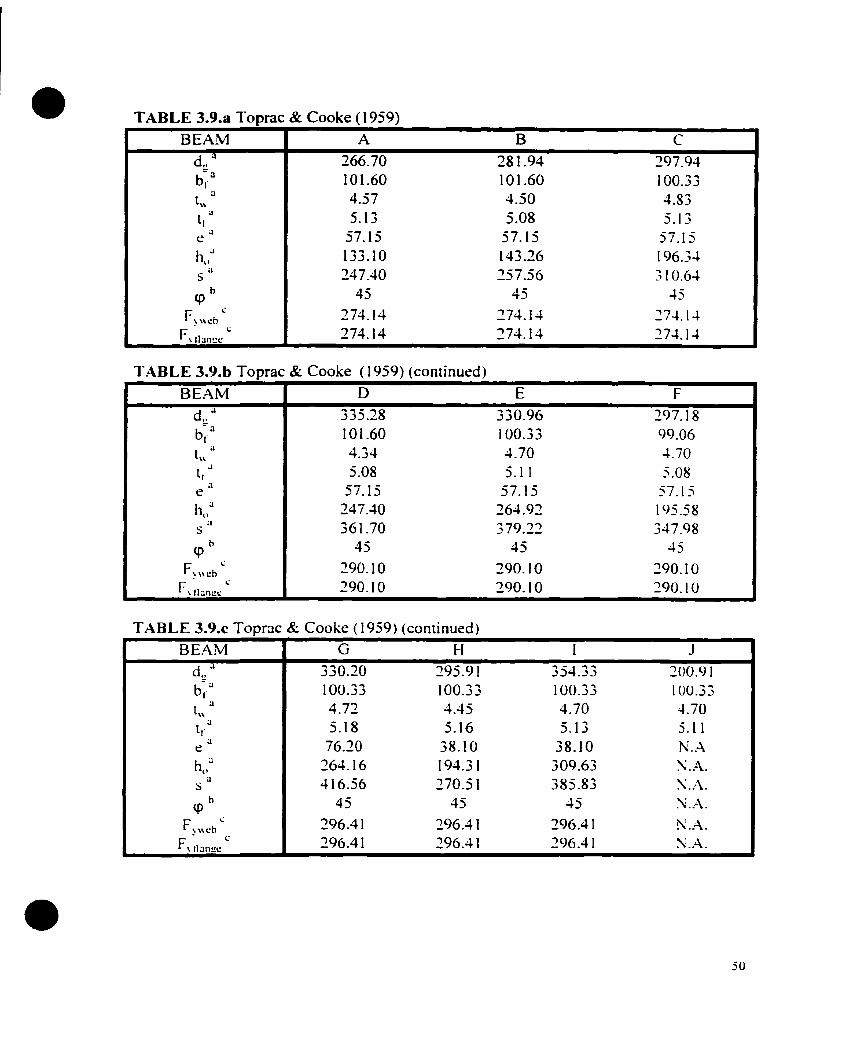
TABLE 3.9.a Toprac & Cooke (1959)
BEAM A B Ca 266.70 281.94 297.94d!!
b:· a 101.60 101.60 100.33
1"a 4.57 4.50 4.83a 5.13 5.08 5.13lra 57.15 57.15 57.15ca 133.10 143.26 196.34hll
.1 247.40 257.56 310.645
cph 45 45 45
FY'H:bc 274.14 274.14 27..J.14
F, t1an"cc 274.14 174.14 274.14
TABLE 3.9.b Toprac & Cooke (1959) (continued)
BEAM D E Fd.. a 335.28 330.96 297.18b;a 101.60 100.33 99.061,\
a 4.34 4.70 4.70a 5.08 5.11 5.08l,a 57.15 57.15 57.15e
hoa 247.40 164.91 195.58;.
361.70 379.12 347.985b 45 45 45cp
Fy\\chc 290.10 290.10 290.10
F, lIi1n~cc 290.10 290.10 290.10
TABLE 3.9.c Toprac & Cooke (1959) (continued)
BEAM G H [ Jd.. a 330.20 295.91 3:>4.33 200.91
::"a100.33 100.33 100.33 IUO.33bl
t"a 4.72 4.45 4.70 4.70il 5.18 5.16 5.13 5.11lra 76.20 38.10 38.10 N.Aea 264.16 194.31 309.63 !'\.A.hoa 416.56 270.51 385.83 !\.A.sh 45 45 45 ~.A.cp
Fy\\cbc 296.41 296.4 1 196.41 N.A.
F, Ilan!!cc 296.41 296.41 296.41 :\.A.
5U

•
•
TABLE 3.10 A1tfillisc~ Cooke & Toprac (1957)
BEAM A B Cd a 330.20 374.65 412.75g
b/ 100.33 100.33 100.33tw
a 4.57 4.57 4.57tr a 5.18 5.18 5.18
a 85.73 88.90 88.90eboa 158.75 247.65 323.85s a 330.20 425.45 501.65cpb 45 45 45
Fywc:bc 326.81 326.81 326.81
F"tlamlCc 297.51 297.51 297.51
a AlI dimensions are in mm.b Angle in degrees.C Yield Stress Fy in Mpa.
51

•
•
CHAPTER FOUR
RECONCILIATION OF ANALYSIS W1TH TEST RESULTS
4.1 General
The results of the previous research work on castellated beams described in Chapter 3 are
compared in this chapter with the methods of analysis described in Chapter 2. AlI shear
and bending moment loads are non-dimensionalized by dividing by the plastic shear or
moment capacity of the section to facilitate numerical comparisons~ and a governing
mode of failure is predicted. Correlations between test results to theory are then reponed.
4.2 Comparative Data
The complete set of data for all 78 beams tested in the references of Chapter 3 are given
in Tables 3.1 to 3.10. Ofthese~ 21 were eliminated from further consideration because
they failed by modes other than those being considered in this project. The remaining 57
beams are considered in this chapter. For reasons discussed below. more of these beams
had to be removed from consideration. For the remainder the predicted and measured
ultimate loads are compared. A summary of these results is given in Table 4.1.
Detailed computations for each of the four predicted failure modes (Vierendeel and
horizontal web-post yield mechanisms~ flexural mechanism and FEM buckling analysis)
are given for each beam in Appendix B. Because of the varying moment-to-shear ratios al
each hale in a beam~ ail hales must he considered independently~ and the most critical one
52

•
•
for each failure mode must he identified.
Construction of the interaction diagrams representing plastic failure mechanisms was tirst
carried out. For the given heam arrangement shawn below (Fig. 4.1 >. such a diagram is
demonstrated in Fig. 4.2.
m..r.cneD'SS·
B-6te» ... DJawtaa
Figure 4.1 Test Arrangement ofBeam H (Toprac & Cooke 1959)
53

• Inttractian DiagramBQM H(Tqrac& Ca*e1959)
1.2 ,.- ----,
___ Yield Theory
~ TEST
:; Bastie FEM__ • !3~1.0
__ 11=1.35
0.50.40.3
VNp
0.20.1
0.8
0.4
holes 7.8hale 6hole 5
hole4
, " 'r'fI. ~,," '1"If. ," , ,,':,' . ..'
'" h"'" rft',' ~/ hale 2
,'" , "I, .,. 1 "l', , ,:~, )" ~"
0.2 ,Z' ,/ 1 ' .......et , .." ",..,( 1 -- hale 11 ,',' · --œ----, ' ..,,' --'o ~'-:."------
a
a-I 0.6
Figure 4.2 Interaction Diagram Demonstrating Theoretical Methods of Analyses.
The radial lines represent the MIV ratios for each of the openings in one-half of the span.
with the two holes under pure bending being represented on the vertical axis as holes 7
and 8. The MIV ratio at the centerline of each opening is used. For each opening.
theoretical predictions of VN p and M/Mp are obtained from the intersections of the radial
lines with the interaction diagram representing Vierendeel and flexural plastic
mechanisms.
On the diagram are also plotted the predicted tàilure loads corresponding to mid-post
•yielding (VyhNp) and the buckling load predicted by FEM. The first of these is based on
54

•
•
Eqn 2.1 with the shear yield stress taken as ~F/~3. This has a constant value for aU web
posts, and plots on Fig. 4.2 as a venicalline (two lines corresponding to two values of p
are shawn). Elastic FEM results are given, although it is recognized that tbis buckling
usually involves inelastic action. The influence of plasticity is considered in Chapter 5.
and is neglected at this stage as good results with elastic analysis have been reported by
Redwood and Demirdjian (1998), and initially the simplest solution was sought.
Based on the typical FEM model arrangements of Section 2.5, a two-hole model with 816
elements, as shown in Fig. 2.5, was chosen to simulate the behavior of a web-post under
high shearing force. This represents a half-span of a beam with four holes, and was
subject to the restraints and other details outlined in Section 2.5. Goly venicalloads were
used and the model is subjected to constant shear force with some small bending forces
which were considered to he negligible insofar as they would affect the buckling load
(see Redwood and Demirdjian 1998). These FEM results are ploned on the interaction
diagram as two points with ordinates representing the moments at the two hales used in
the Madel. Thus it is implicitly assumed that moment has negligible effect; this
assumption is examined in detail in Chapter 5.
4.3 ComparisoDs
AIl modes of failure for each hole in a beam are identifiable on a diagram such as Fig.
4.2. The triangles represent the loading CV and M) at each hole for a given load on the
beam (values given in fact correspond to the failure load). As load is applied to the beam.
55
•
•
these points cao he considered as expanding proportionally outward from the origin. The
critical hole is the one for which the plotted point first reaches the failure envelope. and
the mode would he identified by the part of the envelope attained. This may altematively
be interpreted as identifying the failure hole as that one for which the ratio of test load to
predicted load is a maximum.
The results shown in Fig. 4.2 are affected by the analysis for the horizontal web·post
shear yield mode whic~ as discussed in Chapter 2~ is known to he quite conservative. [f
these results (i.e. the vertical dashed lines) are ignored it can be seen that a flexural
mechanism failure is predicted at holes 7 and 8; hole 6 is almost at the point of failure in
a Vierendeel mechanism mode~ and hales 5 and 4 in the same shear span are farther from
the failure surface. Hales 1, 2 and 3 are loaded weil below the Vierendeel mechanism
load. and are far below the elastic buckling load. The observed failure mode was that of
pure bending~ as predicted by the above reasoning. [f the horizontal yield mode had been
considered holes 1, 2 and 3 would have been critical (with both predicted failure loads
lower than observed). It seems clear that in this case, the horizontal yield mode was not
relevant; in effect the vertical line should he shifted to the right ta reflect a higher shear
yield stress than 1.3SF/v'3.
There is sorne evidence that the effective shear stress at mid·depth of the post at failure is
very high compared with the expected value F/v'3. Husain and Speirs (1971) directly
measured the shear yield stress of notched specimens fabricated from ASTM A36 steel
(nominal Fy=36 ksi (248 MPa» and for a number of specimens the average value was
41.6 ksi (287 MPa). The tensile yield stress was not reported, and so sorne uncertainty
56

•
•
exists as to the enhancement above F/"';3 that this represents. However. if it is assumed
that the A36 web materia! had a real tensile yield stress of about 53 ksi (365 MPa) (such
high values have been measured for A36 steels in the 1960-70 period.. see Redwood and
McCutcheon (1969» then the measured shear yield is 1.35 (=41.6+(53/.../3» times that
expected value of F/.../3. Greater enhancement would occur if the estimate of the tensile
yield was too high. On this basis. it has been assumed throughout that the etfective shear
yield stress at the mid-depth of the posts is 1.35 limes F.;--J3. Thus the factor J3 is taken as
1.35. In the example of Fig. 4.2. it appears that even this enhancement is insufficient to
reflect the effective shear in the test beam.
Following the above procedure. test-to-predicted load ratios were computed for each test
beam. Certain tests had reported maximum test loads.. while others derived their failure
loads from the intersection of tangents of the two curves of load vs. deflection diagram.
Whenever applicable. both reported loads are used for comparisons.
-1.4 Discussion
In general. the numericai results indicate good correlation with test results. Most of the
cases with poor correlation. as indicated in Table 4.1. are those for which yield stress
values were not given. and nominai vaiues have been used. These beams are identified by
asterisks. and are noted in the literature review of Section 3.2.
Excluding the identified beams for which Fy is not known. the mean and the coetlicient
of variation (COV) of the test-to-predicted ratios for aIl other beams are 1.127 and 0.225 .
57
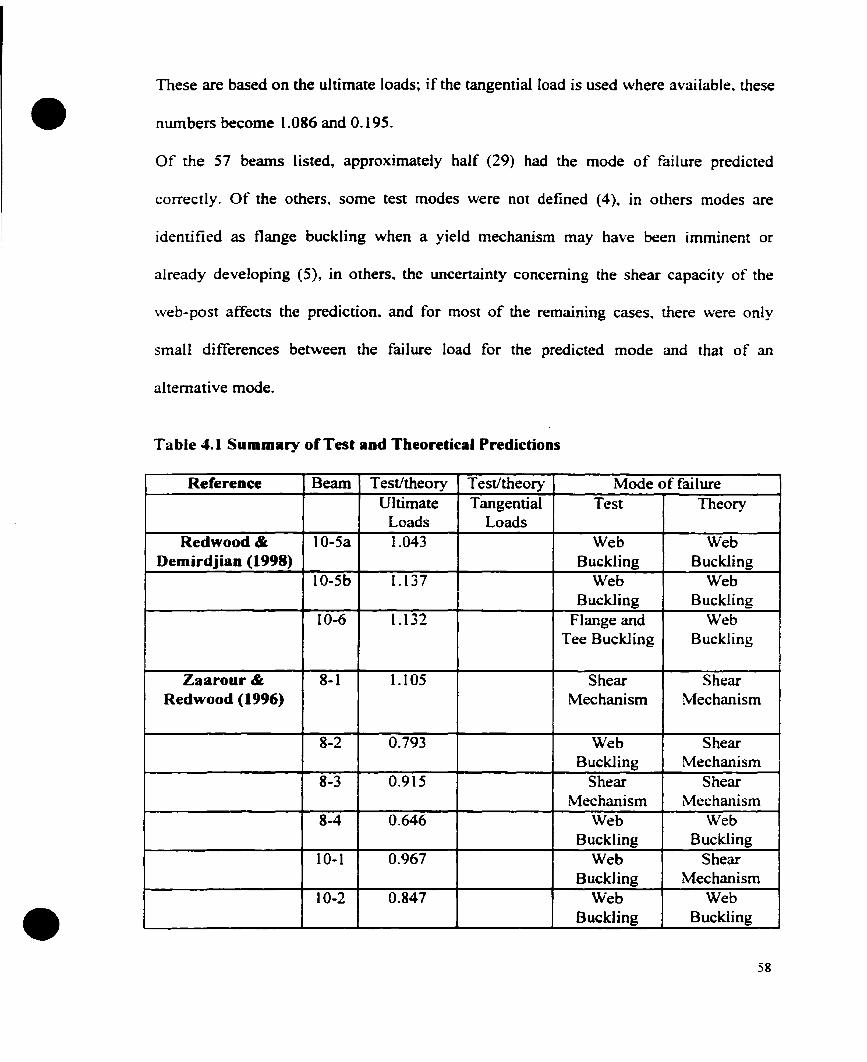
•
•
These are based on the ultimate loads; if the tangentiaJ load is used where available. these
numbers become 1.086 and 0.195.
Of the 57 beams listed~ approximately half (29) had the mode of failure predicted
correctly. Of the others. sorne test modes were not defined (4)~ in others modes are
identified as flange buckling when a yield mechanism may have been imminent or
already developing (5), in others. the uncertainty conceming the shear capacity of the
web-post affects the prediction. and for most of the remaining cases, there were only
small differences between the failure load for the predicted mode and that of an
alternative mode.
Table 4.1 Summary of Test and Theoretical Predictions
Reference Beam Test/theory Test/theory Mode of failureUltimate Tangential Test Theory
Loads LoadsRedwood& 10-5a 1.043 Web Web
Demirdjian (1998) Buckling Bucklinglü-Sb 1.137 Web Web
Buckling Buckling10-6 1.132 Flange and Web
Tee Buckling Buckling
Zaarour& 8-1 1.105 Shear ShearRedwood (1996) Mechanism Mechanism
8-2 0.793 Web ShearBuckling Mechanism
8-3 0.915 Shear ShearMechanism Mechanism
8-4 0.646 Web WebBuckling Buckling
10-1 0.967 Web ShearBuckJing Mechanism
10-2 0.847 Web WebBuckling Buckling
58

•
•
Reference Bearn Test/theory Test/theo1")" Mode of taiIureUltimate Tangential Test Them·y
Loads Loads10-3 0.950 \Veb \Veb
Buckling Buckling10-4 0.813 \Veb \\'eb
Buckling Buckling12-1 0.953 \Veb Shear
Buckling Mechanism
12-2 0.966 \Veb ShearBuckling Mechanism
12-3 0.857 \Veb \Vl:bBuckling Buckling
12-4 0.840 W'eb \VebBuckling Buckling
Galambos, "usain H-2 1.001 N.A. Shear& Speirs (1975) Nlechanism
H-3 1.087 N.A. ShearMechanism
H-3P 1.062 N.A. Shearivlechanism
H-4 1.186 N,A, ShearI\lechanism
"usai" & Speirs A-l 1.136 1.051 Shear Shear(1973) Mechanism rvlechanism
A-2 1.259 1.158 Shear ShearMechanism Mechanism
B-3 1.196 1.137 Shear ShearMechanism ivlechanism
G-I 1.344 1.173 Shear ~lid-Post
Mechanism YieldingG-2 1.146 0.990 Shear Mid-Post
Mechanism YieldingG-3 1.208 1.046 Shear Shear
Mechanism Mechanism"usain & Speirs E-I 1.960* Mid-Post Mid-Post
(1971) Yielding YieldingE-2 1.811* Mid-Post Mid-Post
Yielding YicIding
59

•
•
Reference Bearn Testltheory Test/theol")· tvlode of fàil ureUltimate TangentiaI Test Them·y
Loads LoadsE-3 1.809* Mid-Post Mid-Post
Yielding ",{ieldingF-I 1.497* i\.1id-Post Mid-Post
Yielding YieldingF-2 2.125* Nlid-POSl ~\'lid-Post
Yidding 'y'ielding
F-3 1.530* Flexural ShearrYlechanisl11 :\tlcchanism
Bazile & Texier A 1.314 \Veb Shear(1968) Buckling MechanislTI
B 1.116 Web ShearBuckling Mechanism
E 0.942 \\'eb FlexuralBuckling rvlechanism
Halleux (1967) 1 2.821 ** Shear ShearSeries 1 :vlechanism ivlechanism
lB 3.000** Shear Shear~Iechanism N1echanism
... 2.090** FlexuraI Shear-'Mechanism Mechanism
5 1.504** FlexuraI Shearivlechanism Mechanism
5A 1.727** Flexural ShcarMechanism Mcchanism
Series 2 1 2.854** Shear Shearf\'lechanisnl Mechanism
... 2.181** Shear Shear-'Mechanism Mechanism
3B 2.058** Shear ShearMechanism Tvlechanism
5 1.576** Flexural ShearMechanism :Vlechanism
Sherbourne (1965) E-l 1.503 1.226 ~lid-Post ShearYielding Mechanism
E-2 1.630 1.384 Mid-Post ShearYielding Mechanism
60

•
•
Reference Bearn Testltheory Testltheory Mode of failureUltimate Tangential Test Theory
Loads LoadsE-3 1.700 1.423 Web Shear
BuckJing MechanismE4 1.613 1.442 Web Shear
Buckling LVfechanismL-I 1.063 1.063 Flexural Flexural
Mechanism Mechanism
L-2 1.043 1.043 Flexwal FlexuralMechanism Mechanism
L-3 1.113 1.113 Flexural FlexuralMechanism Mechanism
(L.T.S?)
Toprac & Cooke D 0.956 Flange Flexural(1959) Buckling Mechanism
E 1.277 Flange ShearBuckJing Mechanism
G 1.425 Shear ShearMechanism Mechanism
H 1.218 Flange Mid-PostBuckJing Yielding
1 1.808 Shear ShearMechanism Mechanism
Altfillisch, Toprac A 0.887 Flange Flexural& Cooke (1957) Buckling Mechanism
C 1.122 Flange ShearBuckling Mechanism
*Minimum yield stress values of the corresponding beams were defined. The nominal
yield stress of 248 MPa (36ksi) was used to compute these ratios.
** Actual yield stress values of these beams were not reported. Minimum yield stress
value of235 MPa (24kg/mm2) was used to compute these ratios.
61
•
•
CHAPTER FIVE
GENERALIZED ANALYSIS AND DESIGN CONSIDERATIONS
5.1 General
ln the FEM analyses considered so far. the only loading condition treated approximates
pure shear. and furthermore the model has been limited to one comprising only 1WO
openings. In this chapter more complete models are examined and moment-to-shear ratios
\·arying from pure shear to pure bending are considered. In addition. the analysis has dealt
only with elastic buckling behavior. and the impact of inelasticity is examined.
ln section 5.2. the loading used to create any moment-to-shear ratio is described and in
section 5.3 models containing up to four openings are considered under pure shear as \vell
as pure bending. The effect of moment-to-shear ratio is then considered for four test
beams representative of a wide range of castellated beam geometries. These results are
used to establish a general form of interaction diagram to define elastic buckling loads of
casteIIated beams under any shear to moment ratio. Having established this tàrm. in
sections 5.3-5.7 a parameter study deriving web buckling coetlicients covering a wide
range of geometries is perfonned. The use of these elastic results. in conjunction with the
plastic analyses is examined in section 5.8 with the aim of developing inelastic buckling
equations. These are then compared with relevant test results.
62
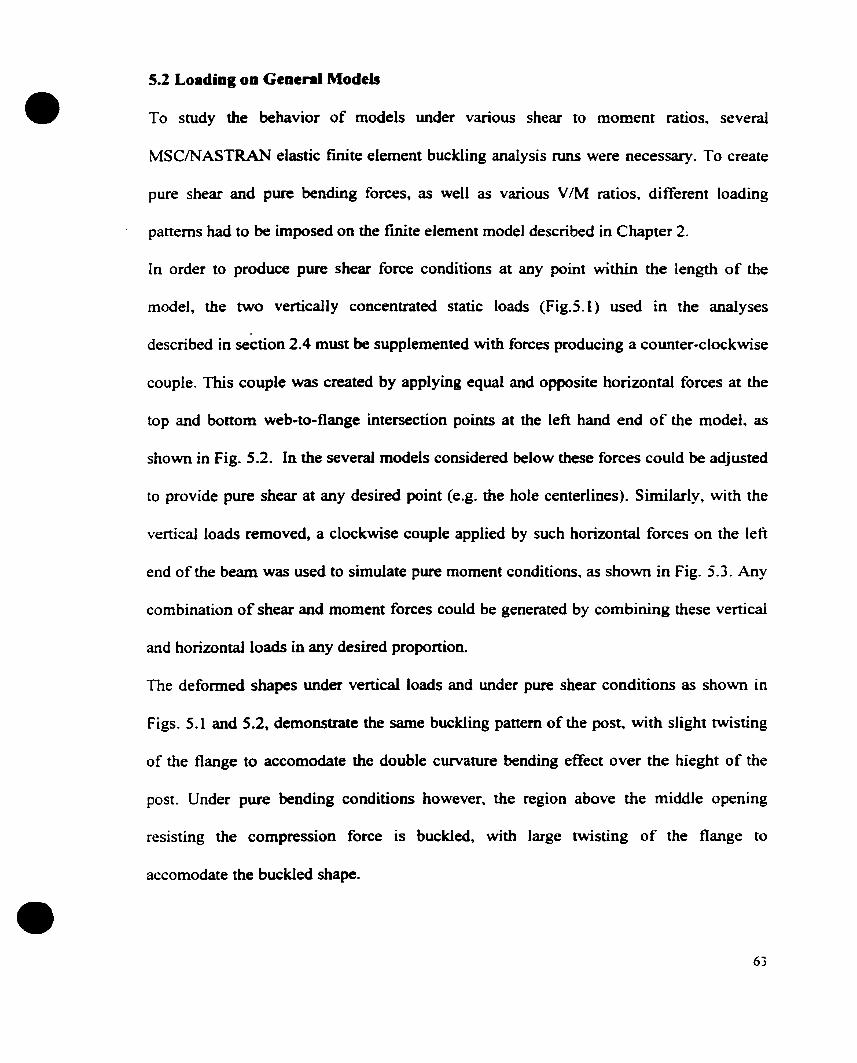
•
•
S.2 LoadiDI OD GeDeral Models
To study the behavior of models under various shear to moment ratios, several
MSC/NASTRAN elastic fmite element buckling analysis runs were necessary. To create
pure shear and pure bending forces, as weil as various VlM ratios, different loading
patterns had ta he imposed on the fmite element model described in Chapter 2.
In order to produce pure shear force conditions at any point within the length of the
model, the two vertically concentrated staric loads (Fig.5.1) used in the analyses
described in section 2.4 must he supplemented with forces producing a counter·clockwise
couple. This couple was created by applying equal and opposite horizontal forces at the
top and bottom web.to-flange intersection points at the left hand end of the model, as
shown in Fig. 5.2. In the severa! models considered below these forces could he adjusted
to provide pure shear al any desired point (e.g. the hole centerlines). Similarly, with the
vertical loads removed, a clockwise couple applied by such horizontal forces on the left
end of the beam was used to simulate pure moment conditions, as shown in Fig. 5.3. Any
combination of shear and moment forces could be generated by combining these vertical
and horizontal loads in any desired proportion.
The deformed shapes under vertical loads and under pure shear conditions as shown in
Figs. 5.1 and 5.2, demonstrate the same buckling pattern of the post, with slight twisting
of the flange to accomodate the double curvature bending effect over the hieght of the
post. Under pure bending conditions however, the region above the middle opening
resisting the compression force is buckled, with large twisting of the tlange to
accomodate the buckled shape.
63
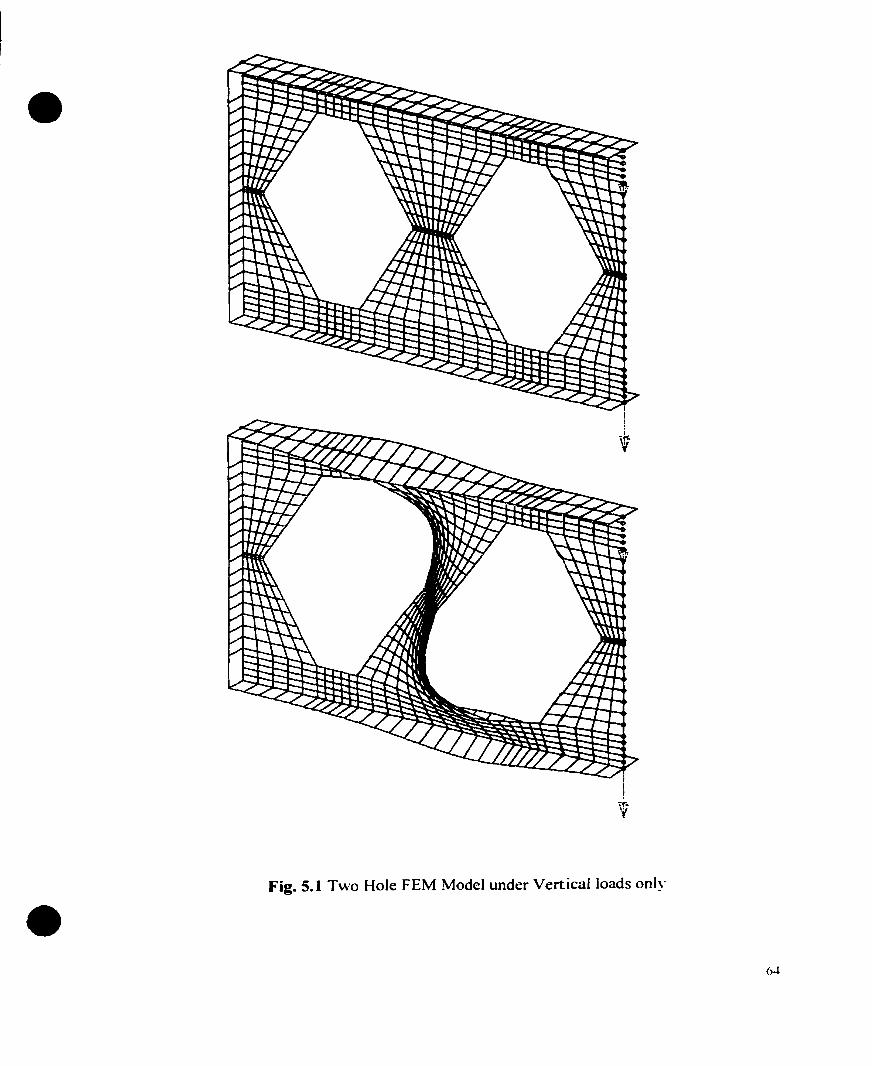
•
•
1!1
1
11!
\fif
Fig. 5.1 Two Hole FEM Model under Vertical loads only

•
•Fig. S.2 Three Hale FEM Madel Under Pure Shear Forces
65
•
•Fig. 5.3 Three Hole FEM Model Under pure Bending l\1oments
66

•
•
5.3 Elastic Bucldinglnteraction Diagram
Due ta the presence of the stiffener on the left end and the applied constraints on the right
of the model~ it was thought that the stiffened web posts adjacent to these ends might
provide restraint ta the rotations of the inner web-post of the two hole model. Ta ensure
there is no such restrain4 models consisting of three and four holes \Vere also
investigated. Both pure bending and pure shear forces were considered tor two. three and
four hole models.. all under the same boundary and loading conditions. These analyses
were carried out for four of the test beams described in the literature. These were beam G-
2 from Husain and Speirs (1973), beam B-l from Altifillisch Toprac and Cook (1957).
beam F-3 Husain and Speirs (1971) and beam 10-3 from Zaarour and Redwood (1996).
These four beams were found to have the diverse properties representing a wide range of
castellated beam geometries.
Results far pure bending are expressed as the beam buckling moment as a ratio of the
plastic moment and are given in Table 5.1. The three and four hale models produce
similar buckling moments and these were lower than for the two hale model.
Beams 2 Hole Model 3 Hale Model 4 Hale MadelMCIMD MC/MD MC/MD
G-2 3.98 3.58 3.43B-l 2.41 2.14 2.11F-3 4.79 4.42 4.2810-3 1.65 1.56 1.54
Table S.l. Summary of Results Under Pure Moment forces.
Similar numerical simulations were canducted ta investigate the behaviar of 2. 3. and 4
hole models under pure shear conditions (Fig. 5.4). The challenge here was to determine
at which hole zero moment forces should he enforced to produce the pure shear condition.
67
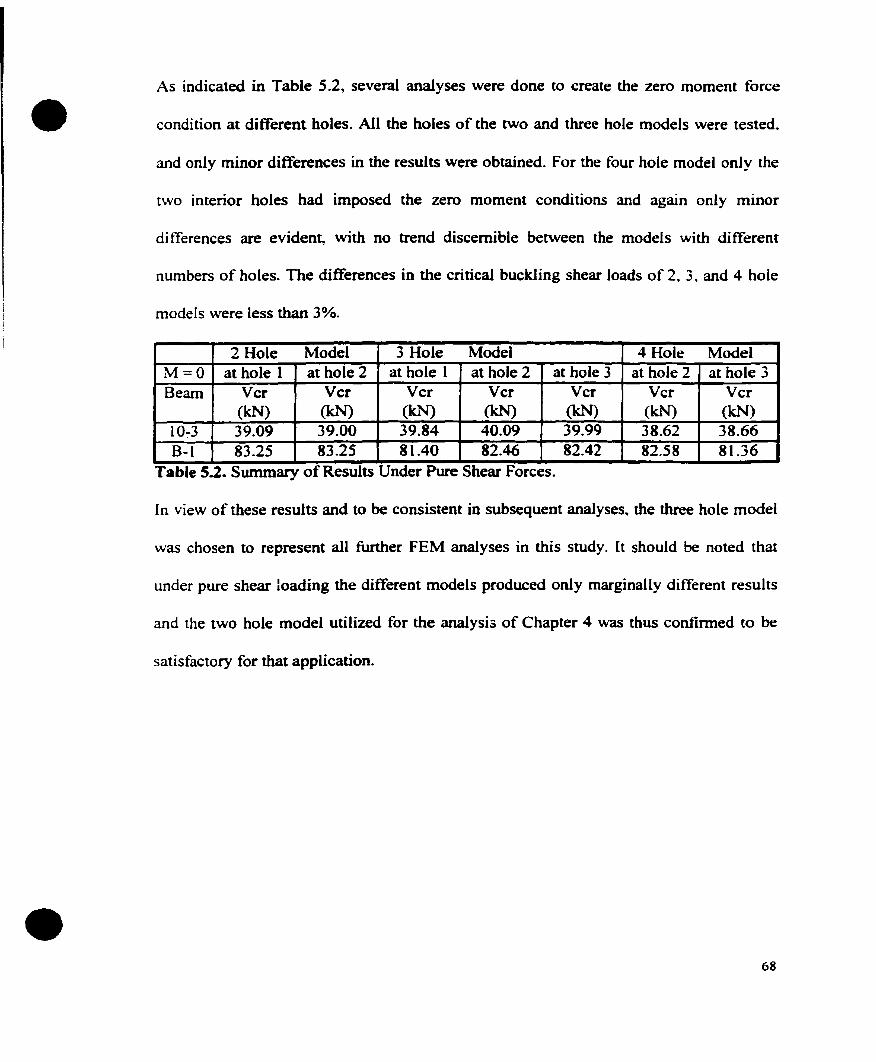
•
•
As indicated in Table 5.2~ severa! analyses were done to create the zero moment force
condition al different holes. Ali the holes of the two and three hole models were tested..
and only minor differenees in the results were obtained. For the four hole model onJy the
two interior holes had imposed the zero moment conditions and again only minor
differenees are eviden~ with no trend discemible between the models with different
numbers of holes. The differenees in the eritieaJ buekJing shear loads of 2. 3.. and 4 hale
models were less than 3%.
2 Hole Model 3 Hole Model 4 Hole ModelM=O at hole 1 at hole 2 at hole 1 at hole 2 at hole 3 at hole 2 at hole 3Beam Ver Ver Ver Ver Ver Ver Ver
(kN) (kN) (kN) (kN) (kN) (kN) (kN)
10-3 39.09 39.00 39.84 40.09 39.99 38.62 38.66B-I 83.25 83.25 81.40 82.46 82.42 82.58 81.36
Table 5.2. Summary of Results Under Pure Shear Forces.
[n view of these results and to be consistent in subsequent analyses. the three hole model
was chosen to represent all funher FEM analyses in this study. ft should be noted that
under pure shear loading the different models produeed only marginally different resuJts
and the two hale model utilized for the analysi3 of Chapter 4 was thus eonfinned to be
satisfaetory for that application.
68
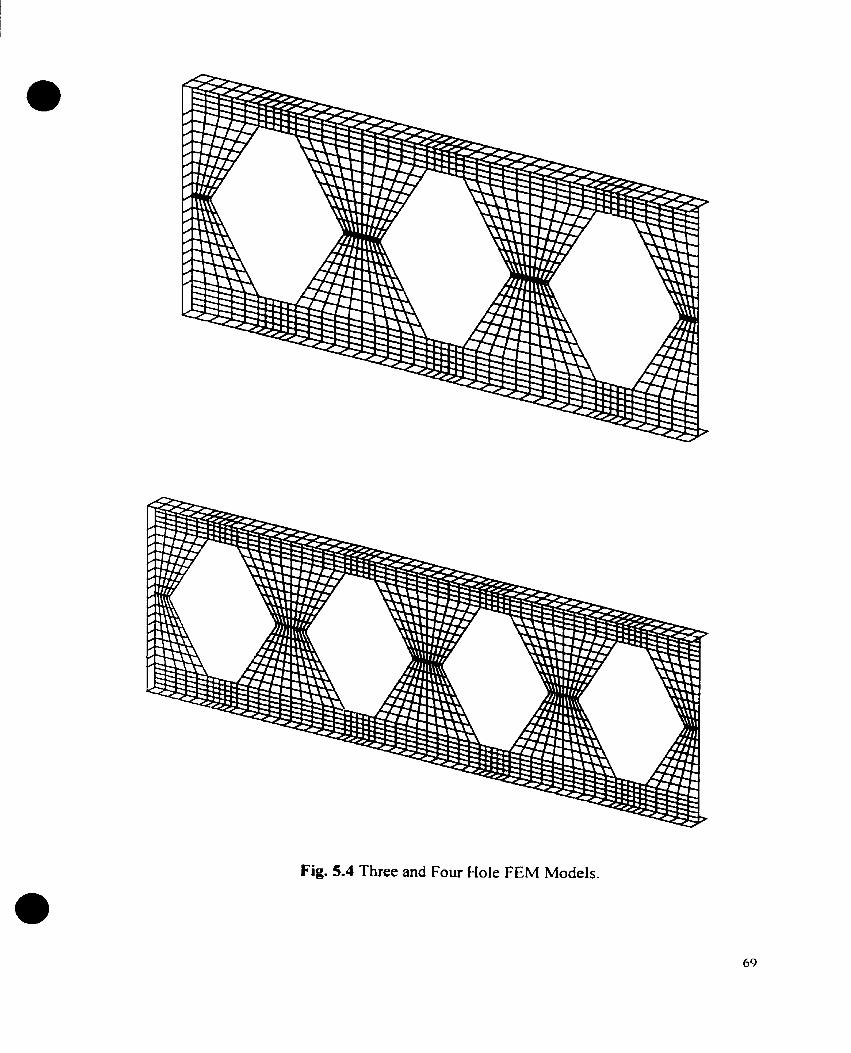
•
•Fig. 5.4 Three and Four Hale FEM Models.
69

• A complete interaction diagram for elastic buckling was obtained for each of the four
selected beams using the three hole model. The results are shown in Figures 5.5. 5.6~ 5.7
and 5.8 (the two ordinales of the elastic FEM results plotted for each VNp ratio refer to
the MN ratio for the tirst two holes of the model).
It cao be seen that under pure bending~ plastic failure occurs al much lower loads than the
buckling loads. Under pure shear, buckIing loads may range from much lower to much
higher values than the plastic failure load. The results shown on these diagrams will be
discussed below.
Interaction Diagramaeam 10-3
0.2 0.3
---"-)
•
2,--- _
1.91.81.71.61.51-41.31.21.1
0. 1
1 0.90.80.7 ---- _0.60.50.40.30.20.1
O"-- ~I{---_----~-
o 0.1
VNp
Figure 5.S Zaarour and Redwood (1996)
____ y ield Theory
x Bastie Fev-t
__n=2
70

• Interaction DiagramBeam G-2
4
____ Vield Theory
x Bastie FEM___ n=2
0.50.4
x
0.2 0.3
VNp
0.1
1
1 L----__----)
oo
0.5
1.5
3.5 r----:lLjll x
3
2.5
2
Figure 5.6 Husain and Speirs ( 1973 )
Interaction Diagrameeam F-3
------~----,
4
3.5
3Q.
~ 2.5-~2
1.51
1 1
0.5
00 0.1 0.2 0.3
x
0.4 0.5
____ Vield Theory
x Bastie FEM___ n=2
•VNp
Figure 5.7 Husain and Speirs (1971)
71

• Interaction Diagrameeam B
2.5 ;- _
111
, 1.51• 1
1 t1
r --------0.5 i -----o.c.
j J
l, ~l.o ------------i~'E_L.-
____ Yield Theory
x Bas tic FBt1___ 0=2
o 0.1
VNp
0.2 0.3
•
Figure S.8 Altifillisch1 Cook and Toprac (1957)
The interaction buckling relationships can be approximated by a curve defined by:
MIl
VIl
J\4p
+Vp
=1 (5.1 )M" v"J\4p Vp
with Mo and Vocorresponding to pure shear and bending conditions respectively. Several
different values of n were examined. The curve found to best represent the FEA results
for the full range of MN was found to correspond to n = 2. [n this way. given Ml! and Vu
values. a relationship defining the buckling behavior under any MN ratio is established.
ï2

•
•
5.4 Parameter Study
Having established a general expression defining the elastic buckling behavior of
castellated beams under any MJV ratio. a parameter study relating the behavior of beams
with ditferent geometries under pure shear and pure bending conditions was carried out.
Elastic finite element analysis was performed on 27 beams ta derive e1astic web buckling
coefficients under pure shear and pure bending conditions. The beams were designed and
selected ta present various ratios and proportions of castellated beam geometries. The
relevant parameters \Vere considered to be the ratio of hole height to minimum web-post
width. hJe. and the ratio of minimum web-post width ta web thickness. e/tw ' Because of
the wide range of possible beam and castellated hale geometries. the parameter study had
to be of limited scope. and thus the following computations are restricted to castellations
\vith a hole edge slope of60o to the horizontal.
5.4 Previous Parameter Study
In a previous study by Redwood and Demirdjian (1998). a parameter study to find the
elastic buckling loads under high shear loading was carried out that incorporated a \Vide
range of beam characteristics. The study assumed elastic behavior throughout. The mid
post weld was assumed to be full penetration and had the same thickness and material
properties as the web. The flange was included in the model because of its importance in
restraining web rotations. but conservative estimates of flange dimensions were used for
the general case. These assumed that the flange was only as thick as the web. and the
tlange width was that of a Canadian Standard S 16.1-94 class 3 section. Thus:
73
• 2(200)1 ., _b f = r-i:' where Fv was taken as -,4~ MPa.
VF~ .
Two series of beams were considered, each with a constant hole height-to-beam depth
ratio. For each series. the relevant parameters were selected to be the hole height to
minimum \veb-post width. hje, and the ratio of minimum web-post width to web
thickness. e/~\._ The castellations had hole edge slopes of 60° to the horizontal. without
intermediate plates at mid-height. This angle is representative of present industr)' standard
cutting angles.
The FEM model consisted of two holes and \Vas identical to that used for the analyses
described above in Chapter 4. Thus loading was primarily a shear load. with two vertical
Ioads applied at one end at the level of the flanges. \Vith the model supported vertically by
a point load at the other end.
ln the study the critical horizontal web-post shear force along the welded joint "vas tound
using FEM. and then the corresponding vertical shearing force on the beam was found.
Incorporating the principal parameters by writing horizontal shear force at buckling as
V. = k Eel,•.Il,r (h
ll) 2
/ Il'
a non dimensional shear buckling coefficient k was derived as
V (h.. Î'It,r )
k = __1_,_,_
Ee/"
(5.2)
(5.3 )
•The tinite clement analysis gave the ratio of shearing torce in the web post to the vertical
74

• shear on the beam~ VtIV. The product of the ratio VhN and the vertical shear force to
cause buckling gave the critical horizontal shear force V/ter in the web-post at the welded
joint. V /ter was then related to vertical shear V through ~; = S • (Eqn 2.3) derivedv d -1 vJ: ~I
from the free body diagrarn of Figure 2.2. where Yt defines the line of action of the
longitudinal force resultant acting in the the tee section. which was taken as being at the
centroid. This was verified by comparing this value with that given by the FErvf for the 17
beams used in the parameter study. An average ratio of 0.983 with coefficient of variation
of 0.02 was found. suggesting that the centroid provided a close approximation.
Values ofk obtained from the parameter study are shown in Figure 5.9.
k curves
98
hJ.d11=0.50
eJt",,=15-30
765432
: ~t..=15:~~=2a
. elt..,=30 :
.. .
7i1
6 1i1
5 11
!;
4
1~
3 1
2:11
1,1 1
1a i
a
hJe
Figure 5.9. Sbear Buckling Coefficient Redwood & Demirdjian (1998)
•The vertical shear that will cause web post buckling can therefore be obtained by
-reading the value of k from Figure 5.9
75
•
•
-using equation 5.2 to tind the horizontal shear in the web post
-using equation 2.3 to transform Vhcr to vertical shear V
These curves cover a wide range of castellated beam geometries with 60° openings.
Through linear interpolation between the two series of curves. the buckling coefficient tor
a wide range of beam geometries can be determined.
5.5 Shear Buckling Coefficients (kv)
The previous parameter study was refined ln the current research to correspond to
buckling under pure shear, and to make the tlange modelling slightly more conservative.
A new study to incorporate pure bending is described in section 5.6. For the current
research the selected mode! consisted of three holes as FEM results revealed its better
performance under bending moment; although no improvement was noted tor pure shear.
consistencv between models for the two load cases was considered desirable. The tlange~ -
dimensions assumed were modified so that the width was based on the assumption 0 f LI
2(145) fClass 1 section. Le. bf = .JF: .(Clause 11.2. Canadian Standard S 16.1-94) \vhere F~
\Vas taken as 350 MPa. This reduced the flange widths. making the tlange restraint
sI ightly more conservative. Narrower flange widths would make aIl cases conservative as
compared to class 3 section. which was found to be slightly unconservative for sorne
compact sections.
Under pure shear conditions, two vertical forces were applied on the right end at the level
of the flanges and two horizontal counter c10ckwise coupling forces were applied on the
76

• left end at the flange ta web intersecting nodes ta counter the overtuming etlèct of the
vcrtically applied forces. Thus there were no bending moments at the centre of the span
(Fig. 5.2).
Fig. 5.10 shows the results of the analyses for web-buckling coefficient kv due ta pure
shear. There were minor variations between the results of the new and the previous study
due ta the minor modelling changes. For beams with hJdg = 0.5. e/t.\ = 15 is plotted on
the curves ta demonstrate the slightly greater dependency of e/t.\ than evident in the
previous study. Furthennore. there are minor differences between the shape of the cun"es
for h)do =0.5. From the FEM studies of different models in Section 5.3 differences up toe
30/0 can be expected between the two and three hole models. and this together with the
tlange modelling change explains the differences between the results sho\'vn in Figs. 5.9
and 5.10.
Il, curves
7
11
6 t
i!
5
4
""~3
2
: ~/tw=i5:eIt,.,=20
: elt..,=30 :
hJdg=O.50
98765432
0'-- _
o
•hJe
Figure S.10. Modified Pure Shear buckling coefficent Curves
77

• 5.7 Flexural Buckling Coefficients (kb)
T0 denve an expression for web buckling due to pure bending moment forces. the same
series of beams under the same conditions were subjected to two horizontal c1ock\vise
coupling forces.
Taking cr",. = i r where S is the section modulus of the unperforated section. and
assuming that the area of the web resisting the compression force is jt,,\. a coefficient k is
defined by
k1C 2 Ecr (' r = (5.4)
!1 ' )] into k"k 1t 2
[2 (1 -Simplifying by incorporating
crLr = (~)E, .from which kh =(0;)C~r.where since 0", = _~\;f_;_r . we can wri te
t ...
(5.5)
This flexural buckling coefficient. kb. is given in Fig. 5.11 for a given variety of
castellated beam geometries. AImost constant kb values are maintained in the hl/dg = 0.74
until the lines curve downward, indicating that hole height to minimum width (ho/e) ratio
has very liule effeet on the overal1 beam buckJing behavior under pure bending forces.
•The kb values vary less than the kv curves, indicating that the flexural buckling load is not
sensitive to the ratio of hole height to minimum width (hde). While comparing the t\VO
78

• series of beams~ larger buckling coefficients under pure moment conditions were found
for the series of beams \vith Iarger tee sections hJdg=O.5. but the behavior was reversed
under pure shear conditions~ where beams with lower tee sections with hd'd..=O.74 had'"
higher kv coefficients.
Thus based on a given beam geometry~ the critical moment to cause elastic buckling is
simply calculated using equation (5.5).
98
. ..
~Jd~".~:
cz- + +
- - - -. - - - -. : .,~..wo..7~ i
7
...~--
6
o •
..' -~---
5432
- ---- .- -., --.' ._ -- ,..-' ..- ,...-- -- -- -. .. _.' --.- .._- - .
o • 0 .•• 0 •..• 00· 0 O·
~~: ~=: :-~":.:':.:~::~
~_ ... ~•.~~~~_ ~~ :_t-..iL ~~_=~::~o ~ ~~-~ ~.' ~
- ... ~ .. -. .. - .. ---. .. .. - - --.. .. .. ... - .. --.. - ..~ .. - .... .. - . ... .. .. .. .. .. .. '.. .._. _.._._.... ...- -_... .. ....- .-.,. - --- .. •.. - ~._. .... - ------ ... ..
- -- ...,. - ...- ...- ... .. .. .. -- --- ... .. - .. ---" --- ------------- ... - .....- .....
1: 1
1.6
1.4
1.2
~
~
0.8
0.6
0.4
0.2
00
hJe
Figure S.ll. Buckling Coefficient Curves Under Pure Bending Forces
5.7 Effect of Inelasticity on Ultimate Strengtb
Since buckling usually involves inelastic action~ the influence of plasticity is considered
•in this section to improve the aIready mentioned methods of analysis and derive general
expressions incorporating both elastic and inelastic buckling actions.
79

• The construction of interaction diagrams for elastic buckling cao now be performed for
any beam \vith 600 openings, and follows the procedure used for the tour beams as
discussed in Section 5.3. Elastic buckling values of shear (V0) and moment (Mo) can be
computed from the kv and kb curves. By dividing the results by the plastic shear and
moment capacities of the section, such a diagram can be plotted on the same axes as the
yield mechanism interaction diagram. (see Fig. 5.12)
Interaction DiagramBeam G·2 Hu_in & Speirs (1973)
4.-- _
3.5
3
2.5
l 2 1
il 11.51
1 L -.0.5 ! -~p~-:v-p-.--"-l
o 1 ~o 0.1 0.2 0.3
VNp
0.4 0.5
_____ Yie/d Theory
___ Bastie Buckling
Curve
•
Figure 5.12 Elastic and Plastic Interaction Diagrams
On this diagram, radial lines from the origin for each hole of the test beams were then
drawn and from each line a plastic and elastic buckling shear capacity is obtained at the
intersection points. For each test beam, the two governing shear values \Vere thus
obtained. the plastic mechanism and elastic buckJing shears. Vpl and Ven:.
80
•To obtain an estimate of the ultimate shear load of the test beams which incorporates the
possible interaction of elastic buckling and yielding failure modes, the fol1owing two
cases were considered:
From equations for inelastic lateral buclding ofbeams (Clause 13.6. CSA (994).
(028}yfpJ . .
~'vf Il = 1.15 ~\tfp 1- . If Mp IS replaced by Vpl and My by Vcre' we can "TItei\1y
(5.6)
1
Altematively, from column strength equations (CSA, 1994) C. = AF. (1 + ")...2 JI J;; .. the
following expression is proposed..
1
V = V fi + ")...2" )-;/1 pl ~ (5.7)
•
where Jo.. is now interpreted as ~ V. 1 and n is a coefficient based on litting to test results.Y:.rr
The equations were then ploned and compared against actuaJ test results for the 600
castellated beams (summary of results is given in Appendix C). To plot the results in a
non dimensional form while maintaining consistency, it was convenient to divide Vu by
Vpl , as indicated in Fig. 5.13.
Based on the results of 17 test beams with 60° holes and relevant failure modes. both
equations 5.6 and 5.7, with n taken as 4.0 in the latter, were found to provide similar
81

•
•
predictions of the test results. The following statistics apply to the tViO predictor
equations
TestlPredic:ted Mean COyEqn.5.6 l.1l3 0.137Eqn.5.7 1.166 0.148
Table S.3 Statlstlcal Results
For these 17 beams the simplified approach taken in Chapter 4~ in which the predicted
strength was taken as the lower of the yield strength and the elastic buckling (FElVt)
strength~ produced a mean of 1.096 and COV of 0.170. The increased mean value for the
two equations is expected~ since both will predict a lower value than the lowest of the
yield and elastic buckling strengths. It should also be noted that for use in equations 5.6
and 5.7, the elastic buckJing strengths were computed using the generalized buckling
interaction equation 5.1 ~ whereas the computations in Chapter 4 were based on exact
modeling of each beam. The lower COVs represent an improvement in the prediction if
equations 5.0 and 5.7 are used.
As shown in Fig. 5.l3~ the four beams with À. of about 0.5 reponed by Sherbourne (1968)
show significant overstrength compared \Vith the predictions. The reason for this is not
clear. but it may be noted that the actual beam cross-section dimensions were not given.
and nominal values have been used in the calculations.
82
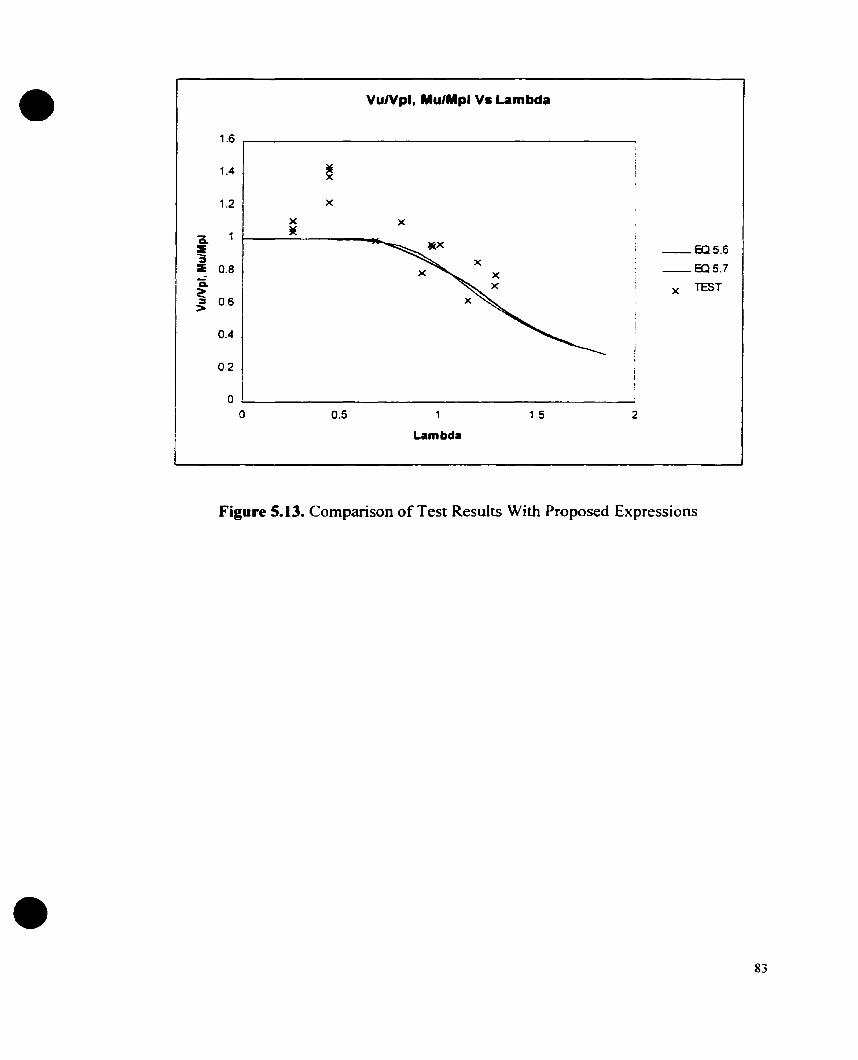
VulVpl, Mu/Mpl Vs Lambda• 1.6
1.4
1.2
Q.
!!=~ 0.8Q.~
0.6=>0.4
0.2
00
x•x
O.S
x
Lambda
2
__ EOS.6
--EOS.?
x TEST
•
Figure 5.13. Comparison ofTest Results With Proposed Expressions
83
•
•
CHAPTERSIX
CONCLUSION
6.0 Conclusion
The objective of this research program was to study the failure of castellated beanls \",·ith
particular emphasis on web-buckling. Several theoretical methods predicting fomlation of
pla'itic mechanisms, yielding at mid-depth of web-posts and elastic buckIing analyses
were correlated with the results of a number of physical tests of castellated beams
reported in the literature.
Since web buckling usually involved inelastic action. the effect of plasticity was
considered in conjunction with elastic FEM results. to modit)-" the theoretical models used
initiaIly.
A parameter study for a wide range of castellated bearn geometries \l,;as pertormed to
deri\'e elastic web buckling coefficients under pure shear and pure bending forces. These
results established elastic buckling interaction diagrams. For any given M/V ratio. results
obtained from elastic and plastic interaction diagrams were established.
The following remarks on the behavior of castellated beams are based on the several
theoretical models used incorporating both elastic and plastic analyses. and their
comparisons with physical test results.
- Results obtained from the interaction diagrams based on plastic analysis used to predict
84
•
•
shear or flexural mechanisms were found to give generally satisfactory predictions. This
diagram is designed based on the properties of a given heam. However~ it does not
account for yielding of the web-pos~ or web-buckling.
- Yield stress developed at the minimum horizontal width of the mid-post~ equation 2.3.
was found to he conservative. A factor of J3 = 1.35 was applied to the shear yield stress to
account for the strain hardening effect expected to he developed at this section. Much
higher failure loads were then obtained compared with those given by the initial stress
limit equation, and this led to more realistic results.
- Elastic buckling analysis with FEM models could he correlated with experimental
results~ and therefore was used to perfonn various parameter studies. However. it was
considered necessary to take into account the effect ofplasticity on the buckling loads. To
do this, the following steps were taken:
- Given the elastic critical buckling loads under pure shear and pure
bending (V0' Mo) loads, a curve of shape (M/Mot + (VN 0)" = 1 with n=2
was fitted to define the buckling 1000s under any VlM ratio.
- A parameter study was perfonned to derive the buckling coefficients
under pure shear and pure bending conditions covering a wide range of
castellated beam geometries. This study in conjunction with the elastic
85

•
•
FEM buckling curves. gave the elastic buckling loads of a variety of
castellated beams under any MN ratio.
- Expressions incorporating both elastic and inelastic behavior of web
buck1ing gave better approximations of the buckling loads. with
coefficient of variations from 0.190 to 0.137.
- The design considerations and computations incorporating the etTect of elasticity and
plasticity on the buckling loads is limited to 60° castellated beam geometries. Extension
to other beam geometries is desirable.
86
•
•
REFERENCES
Aglan. A.A., and Redwood, R.G. 1974. Web buclding in castellated beams. Proc. Instn.Cîv. Engrs. London, U.K., Part 2, Vol. 57, pp 307-320.
Altifillisch. M.O., Cooke, B.R., and Toprac, A.A., 1957. An investigation of open webexpanded beams. Welding Research Council Bulletin, Series No.47, pp 77S-88S.
Bazile, A., and Texier, J.1968. Essais de poutres ajourées (Tests on castellated beams).Constr. Métallique, Paris, France, Vo1.3, pp 12-25.
Caffrey, J.P., and Lee, J.M.1994. MSCINASTRAN: Linear static analysis user's guide.V68. The Macneal-Schwendler Corporation, Los Angeles, Califomia, USA
Canadian Institute of Steel Construction. 1995. Handbook of steel construction, 2nd
edition. Universal Offset Limited, Markham, Ontario, Canada.
Galambos, A.R., Husain, M.U., and Speirs W.G. 1975. Optimum expansion ratio ofcastellated steel beams. Engineering Optimization, London, Great Britain, Vol. 1, pp 213225.
Halleux, P. 1967. Limit analysis ofcastellated steel beams. Acier-Stahl-Steel, 32:3, 133144.
Husain, M.U., and Speirs, W.G. 1971. Failure of castellated beams due to rupture ofwelded joints. Acier-Stahl-Steel, No.l.
Husain, M.U., and Speirs, W.G. 1973. Experiments on castellated steel beams. J.American Welding Society, Welding Research Supplement, 52:8, pp 3298-3425.
Kerdal, D., and Nethercot, O.A. 1984. Failure modes for castellated beams. Journal ofConstructional Steel Research, Vol. 4, pp 295-315.
Megharief, J.O. 1997. Behavior of composite castellated beams. M. Eng. Thesis.Department of Civil Engineering and Applied Mechanics, McGill University.
Raymond, M., and Miller, M. 1994. MSCINASTRAN: Quick reference guide, V68. TheMacneal-Schwendler Corporation, Los Angeles, CaIifomia, USA.
Redwood, R.G. and McCutcheon, J.O. 1969. Bearn tests with unreinforced web openings.Journal of the Structural Division, ASCE, Vo1.94, No.ST1, 1-17.
87
•
•
Redwood~ R.G. 1968. Ultimate strength design of beams with multiple openings. PreprintNo. 757, ASCE Annual Meetings and National Meeting on Structural Engineering•Pittsburgh. p~ U.S.A..
Redwood. R.G.~ and Cho, S.H. 1993. Design of steel composite beams with webopenings. Journal ofConstructional Steel Research, 25: 1&2. 23-42.
Redwood R.G., and Demirdjian S. 1998. Castellated beam web buckling in Shear.Journal of Structural Engineering, American Society of Civil Engineers. 124(8): 12021207.
Sherboume, A.N. 1966. The plastic behavior of castellated beams. Proe. 2nd
Commonwealth Welding Conference. Inst. OfWelding, No. C2. London. pp 1-5.
Toprac, A.A., and Cooke, B.R. 1959. An experimental investigation of open-web beams.Welding Research Council Bulletin~ New York. Series No.47, pp 1-10.
Ward, J.K. 1990. Design of composite and non-composite cellular beams. The SteelCOi1struction Institute.
Zaarour, W.J. 1995. Web buekling in thin webbed castellated beams. M.Eng. Thesis.Department of Civil Engineering and Applied Mechanics. McGill University.
88

•
•
APPENDIXA
Finite Element Input File
This Appendix contains a sample input file ta construct the :2 hole Finite Element mode!
and perform Elastic Buckling Analysis.

•
•
S !!! !!!!!!!!!!!!!!!! !!! !!! !!!! !!!! !!!!!!!!!!!!!! !!!!!!!!!S<A> EXECUTIVE CONTROL SECTIONS !!!!!!!!!!!!!!!!!! !!!!!!!!!!! !!!!!!!! !!!!!! !!!!!!!!!! !!!SS Elastic Buckling analysis of "Castellated Bearn"S1 Hale Model ofreference Bearn 10-3 (Zaarour and Redwood (1996»)SSSSOL 105TIME=900CENDSS !!!!!!!!!!!!!!!!!!!!!!!!!!!!!!!!!!!!!!!!!!!!!!S' B> CASE CONTROL SECTIONS !!!!!!!!!!!!!!!!!!!!!!!!!!!!!!!!!!!!!!!!!!!!!!STITLE ~ beam 10-3SSET 1= 1.73.78.83.88.93, 161.162.163.164,165.238.243.248.253.258.343.348.373.378.427.428.429.430.431.499.504.509.514,519,664.669.674.679.684.769.774.799.804SSECHO = NONEFORCE ~ 1SPC = 10SPCFORCE = ALL
STRESS(PLOT) = ALLDISPLACEMENT(PLOT) = ALL
SSSUBCASE 1SPC = 10LOAO = 10DISP = ALLFORCE = ALLSSUBCASE 2SPC = 10METHOD = 100FORCE = ALLDISP = ALLSSBEGIN BULKPARAM.POST.OPARAM.KIlROT. 10000.0PARAM.AUTOSPC. YESEIGB.100.SJNV,-S.0,S.O,.3,3,,+EIGB-EIGB.MAXSS THIS SECTION CONTAINS BULK DATA fOR SE 0

• sSGRIDGRID 2GRID 3GRID 4
S
oooo
0.0 0.028.956 0.0339.34 0.0368.3 0.0
0.0 00.0 00.0 0
0.0 0
s***************************************s The coordinates for 1057 grid points are defined.S***************************************
705.5612-185.99 -35.31 0s .
GRID 1057 0SCQUAD4 1CQUAD42CQUAD4 3CQUAD4 4
1 2929 3030 3131 32
33 2134 3335 3436 35
•
S****************************************S 816 elements are thus defined through grid points$****************************************
CQUAD4 816 2 867 617 1032 1057SS THIS SECTION CONTAINS THE LOADS. CONSTRAINTS. AND CONTROL BULK DATASENTRIESSSSMATI. 1.200000 0.333333MAT 1.2.200000 0.333333MAT1.3.200000 0.333333SSPSHELL 1.1.3.6068,1PSHELL2.2.4.445.2PSHELL.3.3.9.525.3SSFORCE. 10.609..5000..0.0.-1.0.0.0FORCE. 10.617..5000..0.0.-1.0.0.0SSSPC 10 17 235SPC 10 609 13SPC 10 617 13SPC 10 9 3SPC 10 10 3SPC 10 115 3SPC 10 116 3SPC 10 117 3

• SPC 10 118 3SPC 10 147 3SPC 10 148 3SPC 10 149 3SPC 10 150 3SPC 10 Il 3SPC 10 179 3SPC 10 181 :;SPC 10 180 :;SPC 10 181 3SPC 10 12 3SPC 10 704 3SPC 10 705 3SPC 10 706 3SPC 10 707 3SPC 10 607 :;SPC la T'''? 3J_
SPC 10 7.... 3J,)
SPC la 734 3SPC la 735 3SPC 10 608 3SPC la 760 3SPC 10 761 3SPC 10 761 3SPC 10 763 3SPC 10 759 3SPC la 754 3SPC 10 749 3SPC la 744 3SPC la 605 3SPC 10 809 3SPC 10 803 3SPC la 797 3SPC la 791 3SPC 10 785 3SPC 10 779 3SPC 0 773 3SPC a 863 3SPC 0 614 3SPC 0 601 3SPC 0 615 3SPC a 857 3SPC 0 851 3SPC 0 845 3SPC 0 839 3SPC 0 8.... 3,).:J
SPC 0 827 3SPC 0 613 3SPC a 891 3SPC 0 885 3SPC 0 879 3SPC a 873 3
• SPC JO 864 3SPC 10 865 3
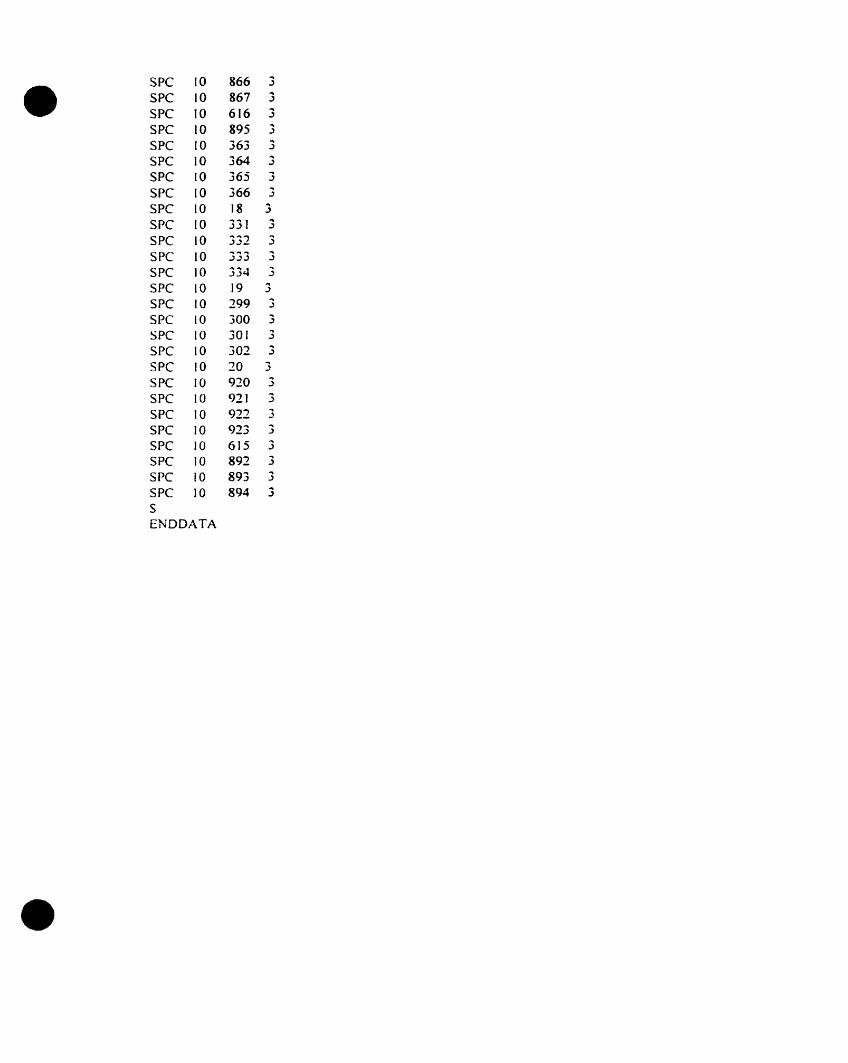
• SPC 10 866 3SPC 10 867 3SPC 10 616 3SPC 10 895 3SPC 10 363 3SPC ID 364 3SPC 10 365 3SPC 10 366 3SPC 10 18 3SPC 10 331 3SPC IO
........ ., 3.J.J_
SPC 10 333 3SPC 10 334 3SPC 10 19 3SPC 10 299 3SPC 10 300 3SPC 10 301 3SPC 10 302 3SPC 10 20 3SPC 10 920 3SPC 10 921 3SPC 10 922 3SPC 10 9"'" 3_.>
SPC 10 615 3SPC 10 892 3SPC 10 893 3SPC 10 894 3SENDDATA
•

•
•
APPENDIXB
Detailed Test-to-Theory Results
This Appendix contains detailed Test-to-Theory computations for ail the beams listed in
Table 4.1. For each test beam. each hole until mid-span is studied. Ail results are
transfonned to shear and moment forces. and are non-dimensiona1. Reported ultimate test
load (V1cs1Np) and (Mtes/Mp), elastic FEM buckling (VcIVp). Shear mechanism (Vym,rvp).
yielding of the horizontal joint (VytIVp), and flexural mechanism (Mtl:s/Mp) ratios are ail
calculated. Ratios of test results to the predicted failure modes are then computed. and
maximum ratio on each row is calculated. The predlcted failure mode is derived based on
the ratio selected by the maximum of ail the ratios of Test-to-Theory on each ro\v.

• •ref: Re~wood & Demi.r~jian (1~98)
beam 10,5ahole ~'!~fV.-~ Ve!'!f' Y'!~'YP Y:th!'!f _P .~~~~~1' "'~m/ftllp V,••lVcr ~'.IfV.~~ Y'e~t!Y'1~ ~~!'~""~~
Max M.,••~Me test prediction Vp Mpratio over over (kN) ~~~~~J~~, ._~_. -- ' ... -
- ----- ----- ----- -_. -- - ._.- -- -_._- -- '-0"-' --- _..----- .. - - •••p. . --- -_. ~-.
_'!~!!r!.J!_ theory1.35
-----~-- . . _. -~--.-.- --~ .. _.-
......o·
1 0,168 0.161 0.238 0,319 1.35 0.085 0.121 1.043 0.706 0.527 0.702 1.043 0.506 1.043 buckling 276 83.2-'--'- ----_P.. .. _.._-_.- ------ ---_._~ ---- --------.- ---_. --- ". ----_.--- ---~..- -'. ~--- _.._.- " "_,0.-- 1· '0---·-·- .- - -...--.- - -_._~ -- -_ .. ---
2 0.168 0,161 0.235 0.319 1.35 0.256 0.363 1.043 0.715 0.527 0.705 1.043 1.524.. ----- -.---_. .._--_.... ._-- ---- .._- --1--.----- --~--- . _.... _----- ------- ._----- - _.0" ____-- ___ 1- - ___ .,. -------- - • -0' ___
-_..... - .. --" _ .. -' - ,- .- -. ~. - _. - . ---, . - - _.~- -- -- .-... - .. - ... ..
beam 10,5b. - -_. .. ---- ·0_ - .... - . - . '0
_. ..... - ... -'. -
ho'e ~,..IY.J! '!c!'!~ YJ~J! '!1tf!J. P M.!!~Mp ~ym!~P V,••lYcr ~....,-,!~~ ~~!~f!.J~ .Mc!!~~l!!' Max ~~.'~~J! test prediction Vp Mp--' .. - .
ratio over over (kNt !~~~~). ,._- --- - --_._- .-0-.- .. - - . - - -- - ... -- -- . -- .- -- _._--.- _ .. --
_. .-; ..... - _~.~~J!. theory
.... - "-- - .- - ..... . - ..
1.35. - --.
1 0.183 0.161 0.238 0,319 1.35 0.093 0.121 1.137 0,769 0.574 0.769 1.137 0.508 1.137 ~~ckljn9 276 83.2(f18~f
... _~ -- ~ .. - -~- --.-- - _.~
2 0.161 0.235 0.319 1.35 0.279 0.363 1.137 0.779 0.574 0,769 1.137 1.525- - _... -- -'-- - .... -. - .. .... - _. -. -- _.. . . - _. _.... - .-- .. -" .
beam 10,6hole V~·f'J.f ~~,Np. ~~mNp V~,,-~... J} ~~.,/M~ "'ym/~p V,"lYer V'.al'Jym V~.~~~~ ~,.~JM~ Max Mc••~Mp test prediction Vp Mp
ratio over over (k~~ (kN.m)~ --_. ---.
~ ----
~!.~"-"p theory1.35
1 0.172 0.152 0.236 0.319 1.35 0.087 0.121 1.132 0729 0,540 0.719 1.132 0,506 1.132 buckling 276 83.2--
2 0,172 0.152 0.235 0.319 1.35 0.262 0.363 1.132 0.732 0.540 0,722 1.132 1.5233 0.172 0.152 0.2 0.319 1.35 0.436 0,508 1.132 0.860 0.540 0,858 1.132 2.535
... - - . - --'- ..
1
11
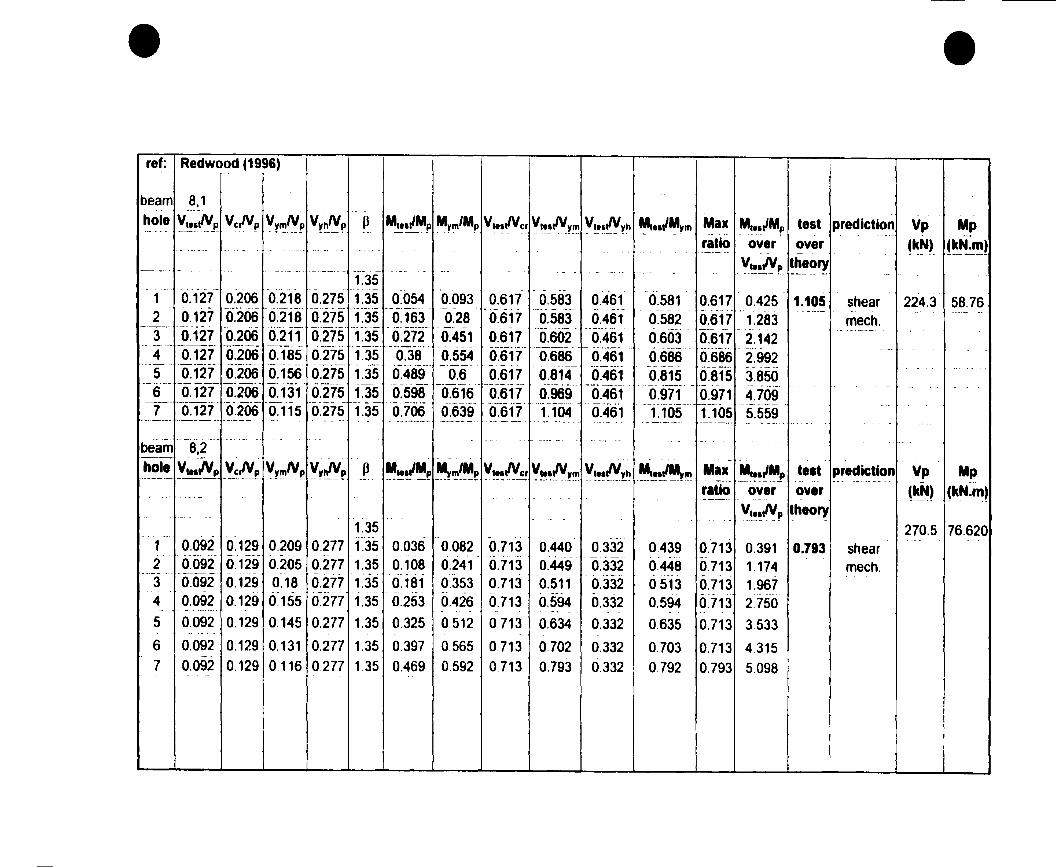
• •ref: Redwood (1996)
beam 8,1- . . . . ..
hole ~~~I'!l' Ver!"~ ~~"!,,!p ~~hN~ Il ~!!.JMp "'~~/Mp VI••lVer VI!~IV~!'). Y!'~~~~ ~I~!~'!'~rn Max ~~.~J~~ test prediction Vp Mpratio ove, over J~N) {~~.~)_ •• t_ •••• __ .. ~. .- ...- ,'- - ...- . . , .. . .. -_.. -._- - - , -
.~!!~P... theory-- _..- _.._--.--- ----- . - ----_._.' -_._~-_.~ ... o·, - . . - . - - .-- - -.--- .-. . .. --- -.
1.35- - ---- - - .. - -~ .. ...
1 0.127 0.206 0.218 0.275 1.35 0.054 0.093 0.617 0.583 0.461 0.581 0.617 0.425 1.105 shear 224.3 58.76--._----_.'. ojœ --,-'._----- - . _.. _-- ----- -. .-_.- ..2 0.127 0.218 0.275 1.35 0.163 0.28 0.617 0.583 0.461 0.582 0.617 1.283 mech.
():275' ---- -- - -- ----.~- - -- ... _-_. -
3 0.127 0.206 0.211 1.35 0.272 0.451 0.617 0.602 0.461 0.603 0.617 2.142-..._-- - .. --. - -- .. _- ..... - ~ ... - -- --_. -- --.-..~-_.- - - ------ .. -_. . --- - ------ - _... ~. - ~ -.---
4 0.127 0.206 0.185 0.275 1.35 0.38 0.554 0.617 0.686 0.461 0.686 0.686 2.992.--~~- . - -.-- ----- ...
5 0.127 0.206 0.156 0.275 1.35 0.489 0.6 0.617 0.814 0.461 0.815 0.815 3.850------ 0:131' -0.616·'~- ... __.--
. 0.971-- -----~._- . - . - ..
6 0.127 0.206 0.275 1.35 0.598 0.617 0.969 0.461 0.971 4.7090]27' '1.35
.__ ...--_ .._.·o~fh7·
-._-_.' '0.461 . -- -~_.~.- -.- ---- .. _--_.__ •...- ... . .
7 0.206 0.115 0.275 0.706 0.639 1.104 1.105 1.105 5.559---._._-- .._-_. -_.--_.- ------ - ------ - --, - ' ......-._-~ ----_.- ....._--- -,. -- .---_.-. -----~-...'_.__ ..
---~.~ .- - ..- - _.,. - - . .. - _ ..
••,_ •••• 0 •• 0- .. - _. -- . .. - . . . ---- - - ... '. -- •• 0 .. ..
beam 8,2.. _..
., .- '.*.
hole y_lVp .Vcl.'!.P.. ~'t'!'!"..p. ~~tl'!'! p ~~~~p ~~'!'~~'! V•••lVer ~~a!Y.!~ ~!!~a!Y..!~ .~!~'!'- Max .~~!~~"J» te.t prediction Vp Mp_..._--- -- - -_ ...- - - _.ratio ove, ove, (~~) (kN.~)- .-- .. - - - -- .. ---_.. . ' .. - ._.-
~'!.~~~ theory- --- . -.. - - -- .. . - .. . .
1.35 270.5 76.620.. 1· .. ..
1 0.092 0.129 0.209 0.277 1.35 0.036 0.082 0.713 0.440 0.332 0.439 0.713 0.391 0.793 shear2 0.092 0.129 0.205 0.277 1.35 0.108 0.241 0.713 0.449 0.332 0.448 0.713 1.174 mech.. _... - .~ - - • • 4""'-,
3 0.092 0.129 0.18 0.277 1.35 0.181 0.353 0.713 0.511 0.332 0513 0.713 1.967... -. ._~.- ._._- _._- .. -. -4 0.092 0.129 0.155 0.277 1.35 0.253 0.426 0.713 0.594 0.332 0.594 0.713 2.750- - _0_·_·__ .. - . . - - ...- . - - . .. -.--
5 0.092 0.129 0.145 0.277 1.35 0.325 0.512 0.713 0.634 0.332 0.635 0.713 3.533.. --
6 0.092 0.129 0.131 0.277 1.35 0.397 0.565 0.713 0.702 0.332 0.703 0.713 4.315.- .
7 0.092 0.129 0.116 0.277 135 0.469 0.592 0.713 0.793 0.332 0.792 0.793 5.098.-

• •beam 8,3
hole V',e~!~p Vc,/Vp VymlVp V~_h_lVp f\ M,es~Mp Mym/Mp Vtes,1Vcr VtesfJ.~r.n Vt~s""-~h ~'e~~M~rn Max M,eslMp test prediction Vp Mp'.
ratio over over (kN) (kN.m)- .- ,. , . ,
VtllfYp theory. , ' .
1.35
1 0.124 0.182 0.218 0.212 1.35 0.083 0.145 0.681 0.569 0.585 0.572 0.681 0.669 0.915 shear 232.9 60.11.- __ ...__ .-"
,O~681 .6.s7i 0:579--______ A
-~_ .. .--. ~- - -2 0.124 0.182 0.215 0.212 1.35 0.248 0.428 0.585 0.681 2.000 mech.
0.585 o.tii.... ~. _. -
3 0.124 0.182 0.171 0.212 1.35 0.413 0.568 0.681 0.725 0.727 3.331~-_. --' -
0.136 0.212 1.35 0.578 0.632 0.681 0.912 0.585 0.915 0.915 4.6614 0.124 0.182-- --- ------_. ----,- --------- _.... -. - ."- .- ~ __ __~_T_'
--~ ._----~- .. - ---..." -- _. ~ ..- - - _. - - . - -----
- -, - .. " ._. - .. - .. -. ----- .. - . - - - - _.beam 8,4- .'
hale ~t!~~~ .~~"'!f!- ~'!rfY~f! V~~~p Il M,~!~~!. ~t'!""'p V'I,/Ver ~CI~tl.t'!' ~~~f.Y!~ ~"~!~~!" Max ~telJM~ test prediction Vp Mpratio over over
, (~~) (~N.~)- - .- .. , .. ------- .' . -" - -- --
Vt~~f".~ theory.. '. . -" -
1.351 0.073 0.113 0.197 0.219 1.35 0.044 0.119 0.646 0.371 0.334 0.370 0.646 0.603 0.646 buckling 270 76.37
1-- . , '.,
2 0.073 0.113 0.193 0.219 1.35 0.133 0.351 0.646 0.378 0.334 0.379 0.646 1.822..
3 0.073 0.113 0.163 0.219 1.35 0.222 0.494 0.646 0.448 0.334 0.449 0.646 3.041_.. _.. - ._- -.
4 0.073 0.113 0.13 0.219 1.35 0.311 0.551 0.646 0.562 0.334 0.564 0.646 4.260~ - .. ' . __.. _L_ _. - _. - . . . --. - , - . -' .. --' , .. -' "
beam 10,1hole V,.,/V~ ~e.N~ V'tmN" V~hlVp l' M~~~~~~ "'~mJ~" V'"/Ver V,••rIY,!!" V~IIIV~h ~,!,lM~m Max M,..~Mp test prediction Vp Mp
ratio over over (kN) (kN.m)
V,••IV~ theory135
1 0.145 0.166 0.296 0.285 1 35 0.148 0.3027 0.873 0.490 0.509 0.489 0.873 1.021 0.967 shear 273.6 81.552 0145 0.166 0.265 0.285 1.35 0.2713 0.4969 0.873 0.547 0.509 0.546 0.873 1.871 mech
31 0.145 0.166 0.215 0.285 1.35 0.3947 0.5864 0.873 0.674 0.509 0.673 0.873 27224 0.145 0.166 0.178 0.285 1 35 0.518 0.6372 0.873 0815 0.509 0.813 0.873 3.573 1
5 1 0.145 0.166 0.150 0285 1.35 0.6414 0.6648 0.873 0.967 0.509 0.965 0.967 4423
i 1
1
i
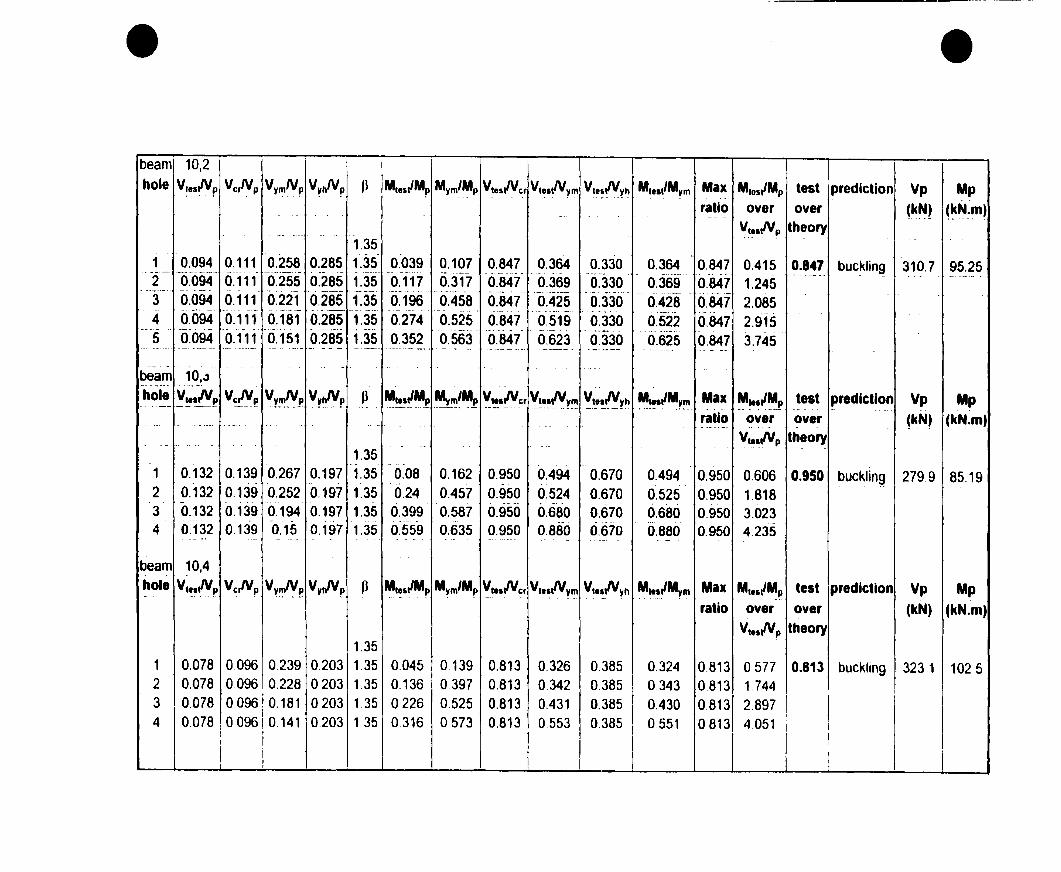
• •beam 10,2
1hole V~.sf!P V~~p VymNp V~hN~ Il M,es~M~ Mym/~p V'esNcr V'8IN~m Vl~~~~~ ~~~"JM~m Max Mle5~Mp test prediction Vp Mpratio over over (~~) (~~~!")- - ~
~-- -
V~..IVp. theory-- ---
1.35..
1 0.094 0.111 0.258 0.285 1.35 0.039 0.107 0.847 0.364 0.330 0.364 0.847 0.415 0.847 buc~linfl 310.7 95.25-----~-- - •. - ---- - .
-0:330. _. --" ----- .
2 0.094 0.111 0.255 0.285 1.35 0,117 0.317 0.847 0.369 0.369 0.847 1.245.- .~ ....._._. _..-~--- ------_. -- ------ .-.---- ---~- -_.- -- - - .. _--- - - -~ -_.- -~ .. - .. '._'--'.'--- --
3 0.094 0.111 0.221 0,285 1.35 0.196 0.458 0.847 0.425 0.330 0.428 0.847 2.085_. . ..- --- --. -- - -_._. 0'-'. ____ .~ ••
4 0,094 0.111 0.181 0.285 1.35 0.274 0.525 0.847 0,519 0.330 0.522 0.847 2.9155 0.094 0.111 0.151 0.285 1.35 0.352 0,563 0.847 0.623 0.330 0.625 0.847 3.745
,- ---_.. --_ .. __ ._- _.__ ._--_ ..~ --- .__ .-_. -' -,-- .-.-- -------_.. _.' . . -' ..--'_. .- ._- - --- ------ - ------ - - ___ o. ____ -. - -_.- ~ - . .-.
beam 10,.3.-
hole ,!~~IVp' Yc!!J2 ~~!"-'Yf. Y~t!'!~ P ~~!~~ ~~~~ Vtt.lVcr ~~~~~~'!' ~~..t!.~~ ~!!.~~~~. Max ~~.~~~ test prediction Vp Mp.- _'0 __ -
ratio ove, over (kN) (k~.m)-- -- . - .~. -_.-- ." .. . -.- - .. - ~ - ._-._ . '" .. -~~~IVp. theory
. - .. -' -- --,
1.35.-
0.08 0.162 0.950 0.494 0.670 0.494 0.606 0.950 buckling 279,91 0.132 0.139 0.267 0.197 1.35 0.950 85.19-- .
2 0.132 0.139 0.252 0.197 1.35 0.24 0457 0.950 0.524 0.670 0.525 0.950 1.8183 0.132 0.139 0.194 0.197 1.35 0.399 0.587 0.950 0,680 0.670 0.680 0.950 3.0234 0.132 0,139 0.15 0.197 1.35 0.559 0.635 0.950 0.880 0.670 0.880 0.950 4.235-- _.. ---- - . ~ . .. -_ .. _- -. _. _.. - - --- - . -- . . .
beam 10,4
hole Vt!,lVp VclVp Vy~'Y~ VyhNp p RI,!,~Mp M~m/Mfl V,.,Ncr V,.~IV~~ V,.~IV'ih M,••~M~m Max Mt.,~~~ test prediction Vp Mpratio over over (kN) (kN.m)
V'.I/VP theory1.35
1 0,078 0.096 0.239 0.203 1.35 0.045 0.139 0.813 0.326 0.385 0.324 0.813 0577 0.8131 buckhng 3231 10252 0.078 0.096 0.228 0.203 1.35 0.136 0.397 0.813 0.342 0385 0.343 0.813 1.7443 0.078 009610,181 0.203 1.35 0.226 0.525 0.813 0.431 0.385 0.430 0.813 2.897
1 14 0.078 009610.141 0.203 1.35 0.316 0573 0.813 0.553 0.385 0551 0.813 4.051 1
1
1
1
1
1

• •beam 12,1hole VlellVp ~c,N~ ~~~!Y~ ~'ttl!Y~ Ji Mle~IJMp ~ymJMp VlellNer Vle.lV~m V!e.IY.'!.h. ~I.~I"'~!" Max M,ulMp test prediction Vp Mp
. - -
ratio over over (k~~ . {~~.~). ~ - ~ . . _. _. _~~_'.. _T_. -_._- -~ - ... - ~. - -' 0·'- . .
-- -- VIII!V.P theory.. - - - - - - - - -- - ~~----. - ...._. ~
- .. -
1.35-- ... -- --- - - ..
1 0.143 0.174 0.211 0.262 1.35 0.072 0.107 0.822 0.678 0.546 0.673 0.822 0.503 0.953 shear 402.6 140.8--- --- .------ ----_._- - .-._-_._- .. Ô~546 . _...... --- _."~--- .. "- _. _._--- - --- --
2 0.143 0.174 0.21 0.262 1.35 0.217 0.32 0.822 0.681 0.678 0.822 1.517 mech.--.....~.-_ .. _._-~~-.- .._--_._--._-
--~ -----._ .. -. - ".- -. .~ - - - .•.. - -_. -.. - .
3 0.143 0.174 0.18 0.262 1.35 0.362 0.458 0.822 0.794 0.546 0.790 0.822 2.531..--- -_._----_._-- -(f.1s' -0.50T-
_._~-----~-~.__ .. ._---_ ... - ------~~ ... .. - -. -
4 0.143 0.174 0.262 1.35 0.534 0.822 0.953 0.546 0.949 0.953 3.545.. ' .~.. -.--_.--- -----~- -.'.--- ._- - ---- .._--_._-.------~- -_._-- ••.• T ~ ... '_._- . . - - -._- - -.. . - ... ~- .. ..
-'-f2~2-------_. - -- -- ... _... ._ T_o -----_._- - . - ~-- .- ._. -. .- - --~ - . - - - -
beam- - -_.... -,'- . - -_.- ------ - ..
hole ~'!..~{Vp ,!~p ~'!."!.~~ .v~tt!'!~ Jl ~'~~Jl ~ny/~p- V,e.lVer ~'!~!Y-~~ ~':!~f!Vh ~e'~~l!!' Max ~!e~~II' test prediction Vp Mp- ••. 0 ' •• __
ralio over over. ~~~~ .. ~~-~~~)_.. - ---_. ... _.--. ._.... -. - --- .. - - --. - - .,,·_0 _. -~ .* - - .. .. . , ._. --- - ------.. •••• _00 •• -- .
~~e~~~. Iheory. . _-- .. . - - ._- --- .. - _..-. -- _....... - .. .. - -.--~ ....- . ~- -
1.35. . .,. . . ~
1 0.113 0.123 0.193 0.267 1.35 0.053 0.091 0.919 0.585 0.423 0.582 0.919 0.469 0.966 shear 436.5 163.8_. . -_. - -- -- ..- ---~----~ -
- ëf423-- ._-- . - .
2 0.113 0.123 0.184 0.267 1.35 0.16 0.262 0.919 0.614 0.611 0.919 1.416 mech.-- - - -- . --- ._- . . .
3 0.113 0.123 0.145 0.267 1.35 0.267 0.344 0.919 0.779 0.423 0.776 0.919 2.363.... - . --
4 0.113 0.123 0.117 0.267 1.35 0.373 0.388 0.919 0.966 0.423 0.961 0.966 3.301. _. _.. - --. _. ~ - ~ ._.. _- ---_. - ~. - .. - .-. . . -. _.~
o ____
.
- -
beam 12,3hole V1e~y' ~~~p' ~~"'-'!'.~ V~JV~ li
..~~~~~ ~~m/~p V,e.lVer V!e~~~~ V~~!".~ ~1!~IM~m Max M..,IMp test prediction Vp Mp. - -
ratio over over (kN) (kN.m)- - " .
VI~llVp theory1.35
1 0.156 0.182 0.285 0.203 1.35 0.1 0.183 0.857 0.547 0.770 0.546 0.857 0.641 0.857 buckling 373.9 127.42 0.156 0.182 0.25 0.203 135 0.301 0.482 0.857 0.624 0.770 0.624 0.857 1.9293 0.156 0.182 0.183 0.203 1.35 0.501 0.588 0.857 0.852 0.770 0.852 0.857 3.212

• •beam 12,4hole V'85/yp Vc,!Vp ~~.n:~P V~hlV~ Il M"s,/Mp M~!"/Mp V,es,lVcr V'~s~~m V'8SIN Yh MI,sIM~m Max M'I5IMp test prediction Vp Mp
. -
ratio over over ~~~t .(kN_,~J--- - . - --- --0_- -
V,e,Nf! theory.. . - - . .
1.35- - .. ...
1 0.11 0131 0.269 0.194 1.35 0.067 0.164 0.840 0.409 0.566 0.409 0.840 0.609 0,840 ~~c~Ii~Q 424.1 152.5- -- - ~ - ~ --_. - - - .
2 0.11 0.131 0.24 0.194 1.35 0.201 0.439 0.840 0.458 0.566 0.458 0.840 1.827.. --- ..
3 0.11 0.131 0.18 0.194 1.35 0.336 0.548 0.840 0.611 0.566 0.613 0.840 3.055--- - ---- -_. __ .. -. -_.. _--- _.- - --" -- ._-- -.~-.--- ... --~ -- ..--- .- ---.- --- ~ - 0-_-- ._-- - - . --- --.
. - ...._... - -_ ..--~--' - . 4_. _. _. _ _. . .. . _._.. 4 _ •. _._ -- _. ..
-_. -- . - .. _.. - - - .. - -.
- - --..
. - . .. - ...
- . ..
ret: _.G~la_rn~~_~LJs~i~ ~ ~~!~~ (1.~75)beam H,2
-- ,_.-
hol. ~'!sJ!'f. .Yc~J! ~~~"!J! V~~_~'!. P ~e'~~J! "'~'!'~~J! V'e.aNer V~~{V~,!, V,.~~~~ ~~~ Max _~~I~!, test prediction Vp Mpratio over over ~~~) (kN,m~. -- ..
Vle,Np theory1.35
1 0.145 0.768 0.502 0.429 1.35 0.096 0.332 0.189 0.289 0.338 0.289 0.338 0.662 1.001 shear 340.2 109.4_. 1- - •.
0.4692 0.145 0.768 0.355 0.429 1.35 0.288 0.705 0.189 0.408 0.338 0.409 1.986 mech.-
3 0.145 0.768 0.245 0.429 1.35 0.48 0.811 0.189 0.592 0.338 0.592 0.592 3.3104 0.145 0.768 0.185 0.429 1.35 0.673 0.857 0.189 0.784 0.338 0.785 0.785 4.641_ ..
5 0.145 0.768 0.145 0.429 1.35 0.865 0.864 0.189 1.000 0.338 1.001 1.001 5.966
!1
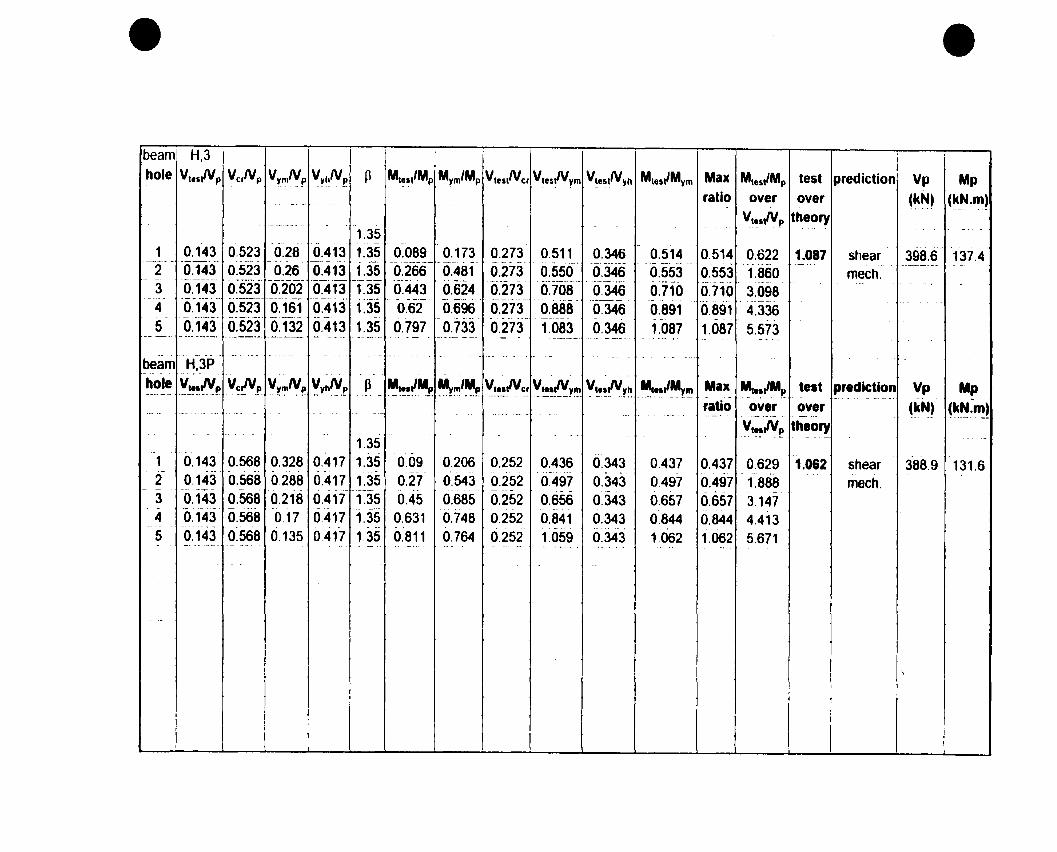
• •beam H,3 1
hole VII.lVp VcrNp V".m"'-p ~~~fVf3. li M,el,/Mp M~m/Mp V'es,fVcr V,esfVvm V~es,fV'Ih MleS~M'Im Max Mles~Mp test prediction Vp Mpratio over over ~~~} ~~_N.,!,}-- -" '0
V,~.~p theory.0 - .__ .~-- - _. . ._ .. -
1.35.'
1 0.143 0.523 0.28 0.413 1.35 0.089 0.173 0.273 0.511 0.346 0.514 0.514 0.622 1.087 shear 398.6 137.4-1.35 -_.._----
'-'-" -- -- -.----_. -.. ' .--~-~-- _. ---_.
2 0.143 0.523 0.26 0.413 0.266 0.481 0.273 0.550 0.346 0.553 0.553 1,860 mech.-(f202-' 0'-273
. --~------ _..- ._- - .. -.3 0.143 0.523 0.413 1.35 0.443 0.624 0.708 0.346 0.710 0.710 3.098
. -- ---- -- _. ---- .. -~--. _... -_.- ----0_0
4 0.143 0.523 0.161 0.413 1.35 0.62 0.696 0.273 0.888 0.346 0.891 0.891 4.336- ----- ~~ - - _. - .
5 0.143 0.523 0.132 0.413 1.35 0.797 0.733 0.273 1.083 0.346 1.087 1.087 5,573..__ ..-" -----.-~- ..~--_. ·_·___4~ -----_. - -- ---"- .- ... ~ . _._...- --- ._.'._- - -----_. 1 ..• _____ • - ._~--...... .- - _. - - ".".
-- - --- - - ._ ..• o' - _ .. . - .- .. -_. ..
beam H,3P- . ...
hale .Y..'!~t!Y.~ V~r!V!_ ~~f!'~~ ~'Ihf'!! P ~~!~~M~ ~~~/~~ V,••lVer ~~~~~~ ~~.!~~~ .~I~!/~~", Max ~,.!/~p- test prediction Vp Mp-- - --- - -- --
~k~:~ratio over over ~~~)... .. '00- __ •
" .... - ._ .........- .. . - --~ - . _.. ._-- • 0 .. -----~- ..._0_ .. - _.- ...
~,~~IVf!. theory- > .. 1· 0 • . -
1.35.-0.206 0.252 0.436 0.343 0,437 0.437 0.629 1.062 388.91 0.143 0.568 0.328 0.417 1.35 0.09 shear 131,6- _..
.... -
2 0.143 0.568 0,288 0,417 1.35 0.27 0.543 0.252 0.497 0.343 0.497 0.497 1.888 mech,o 0 _
~
3 0.143 0.568 0.218 0.417 1.35 0.45 0.685 0.252 0.656 0.343 0,657 0.657 3.147-- --
4 0.143 0.568 0,17 0,417 1.35 0,631 0.748 0.252 0,841 0.343 0.844 0.844 4.413• 0 ..
5 0.143 0.568 0.135 0,417 1.35 0,811 0.764 0.252 1.059 0.343 1,062 1.062 5.671_.~~._~- -- -_. . ... - _.'0- •• ~o. '0' - -,. ~- - .._ .... 0 ._--- . ......
. .
. -
"
1 1
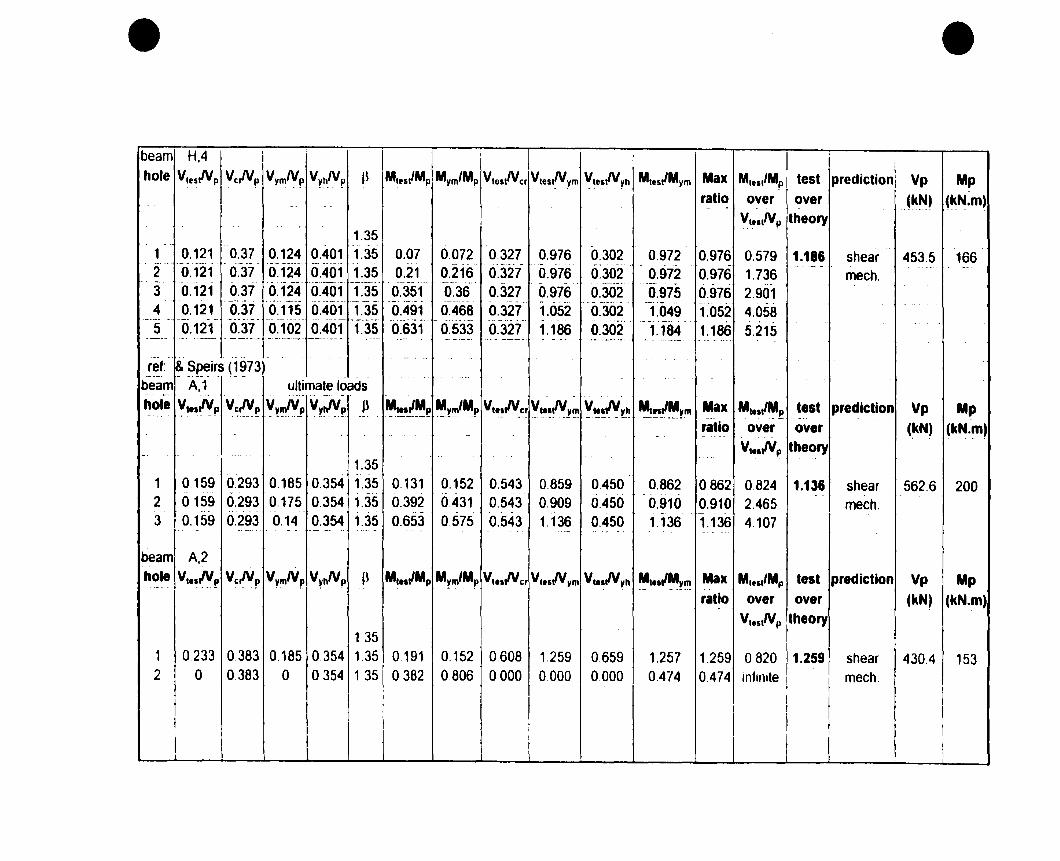
• •beam H,4
1
hale V.eslVp Vc,N~ Vym~p VyhNp 1\ Mtes/Mp Mym/Mp VtestNcr Vtes''!'ym ~te~lVyh Mtest/Mym Max M.est/Mp test prediction Vp Mpratio over over .~~~) i~~·m)-- .. _.
V.",lVp theory. - -
1.35.. .-
1 0.121 0.37 0.124 0.401 1.35 0.07 0.072 0.327 0.976 0.302 0.972 0.976 0.579 1.186 shear 453.5 166-". --~
6:302' .--- ~,- . ........ . .-
2 0.121 0.37 0.124 0.401 1.35 0.21 0.216 0.327 0.976 0.972 0.976 1.736 mech.. . - _.-.-- - -- - -- - - -- - ~ .3 0.121 0.37 0.124 0.401 1.35 0.351 0.36 0.327 0.976 0.302 0.975 0.976 2.901-_... - .. - _. __ 0_- _4 0.121 0.37 0.115 0.401 1.35 0.491 0.468 0.327 1.052 0.302 1.049 1.052 4.058----- - ---- - - ._---_ ... -----5 0.121 0.37 0.102 0.401 1.35 0.631 0.533 0.327 1.186 0.302 1.184 1.186 5.215-_.- ._ ... --~ . ------ _._--_.._. ------ -- ---- ----_.~ - ----- ~ - ----- ..- - --- ".- ,----_.. ~ - _.. _---- .. - -., ~ , ~--'-
~- ~~ir_s J~~7~f- ~. -_....
ref:beam A,1 ultimate loads___ _T_
,-. _.. - ..
hole ~':"~!l ~~r!!!~ ~~~'Y.~ V~tIY~ p ~!!·l~~ ~~~~~ V.e.lVcr V•••lVym ~.~!I.Y.~~ ~!'!~~!" Max Mt••I,!,~ test prediction Vp Mp- .-._. -~~
,.. _.._..__ .
ratio over over (~~) (kN.~).. - ---- -.
V••~lVp theory_. ---- -. -" ...
1.351 0.159 0.293 0.185 0.354 1.35 0.131 0.152 0.543 0.859 0.450 0.862 0.862 0.824 1.136 shear 562.6 200
0.392 0.431..
2 0.159 0.293 0.175 0.354 1.35 0.543 0.909 0.450 0.910 0.910 2.465 mech.3 0.159 0.293 0.14 0.354 1.35 0.653 0.575 0.543 1.136 0.450 1.136 1.136 4.107_. -- -', - -"- -- . • "40 _ --. - ---- "4 •• .. -- - ._ ..
beam A,2hole Vtl'ilY.f! ~cI.YP V't~Np' V~hNfl 1\ Mt.~JMp Mym/Mp Vtl.lYcr V.efiVym V••~IV~h ~...I~~!,! Max M...IMp test prediction Vp Mp
ratio over over ~kN) ~kN.m)
V.estNp theory135
1 0.233 0.383 0.185 0,354 135 0.191 0.152 0,608 1.259 0.659 1.257 1.259 0820 1.259 shear 4304 1532 0 0.383 0 0354 135 0.382 0806 0,000 0000 0.000 0.474 0.474 mflnite mech.
1
1
1
1
1 ! \

• •beam 83 1
1
i1
hole VrestNp VcNp V'ImNp V'IhNp fl M'es~Mp M'Im/Mp Vrn,Ncr V,e~lV~m Vte51V~h Mr••IM'lm Max Mtest/Mp test prediction Vp Mpratio over over ~k~~ . ~~N.m)..
Vt,~lVp theory1.35
- ..
1 0,227 0.433 0.218 0.398 1.35 0,128 0.123 0.524 1.041 0.570 1.041 1.041 0.564 1.196 shear 430.4 153._- .. ~ ----- ...2 0,227 0.433 0.218 0.398 1.35 0.384 0.368 0.524 1.041 0.570 1.043 1.043 1,692 mech......_---- ------- ... - -_.
3 0,227 0.433 0.19 0.398 1.35 0.64 0.535 0.524 1.195 0.570 1.196 1.196 2.819.~- .. _.. _--_._~- -- --~
_...._--- •._-------- --- -_ ..... _-~~-- - - . - --- ..•- . - -,_ .. . ~ .._- ........--- .. -- o- . .. ..
_.. - . . .. - . ...
- .. _. -- . - - .. - . ----- -- .. - - - - -- - - . - .. 1·- -0
- • - . - .. ... 00 . '-- ---
. .. .. .beam G1
---- - ... ...
hole V~_~~f .Vcr!'!f! ~~IfIIVP ~~tlY.P Ji ~'!~~~ ~~!'!'~~ V".IVer V".IV'Im ~,!~,!y~ ~~~~!" Max _"",~!.Mf! test prediction Vp Mp_____ 0'.-· 1-"-,,,,-,,-
~.. .
ratio over over (k~; (~N.~,- ..
V'I./VP theory1.35
1 0.196 0.378 0.308 0.146 1.35 0.105 0.165 0.519 0.636 1.344 0.636 1.344 0,536 1.344 mid-post 430.4 153- .-
2 0.196 0.378 0.305 0.146 1.35 0.315 0.49 0.519 0.643 1.344 0.643 1.344 1.6073 0.196 0.378 0.24 0.146 1.35 0.525 0.643 0.519 0,817 1.344 0.816 1.344 2.6794 0.196 0378 0,185 0,146 1.35 0.735 0,694 0.519 1.059 1.344 1.059 1.344 3,750-
11
i
1i1 1
i
11
1 1 1 111 1 !

• •beam G2
11
hale V'utNp VcIVp V~mNp VyhfVp ~~ M,es"Mp Mym/Mp Vt••,Ner V,.stNym V"SIV~h M'.s,/M~m Max M,es,/Mp test prediction Vp Mpratio over over (~~) - (~N'rn)- - --- -
Vte.IVp theory.. . .
1.351 0.198 0.443 0.318 0.173 1.35 0.071 0.114 0.447 0.623 1.146 0.623 1.146 0.359 1.146 mjd-po~ 430.4 153_.
T _ _ •
2 0.198 0.443 0.318 0.173 1.35 0.212 0,341 0.447 0.623 1.146 0.622 1.146 1.071- • - -o_ - . _. - ._"- .
3 0.198 0.443 0.31 0.173 1.35 0.354 0.554 0.447 0.639 1.146 0.639 1.146 1.788------_._.--6.495 - - ~- -- - - - . -. .
4 0.198 0.443 0.258 0.173 1.35 0.645 0.447 0.767 1.146 0.767 1.146 2.500. _._- - - - - ._ .... .,'
5 0.198 0.443 0.225 0.173 1.35 0.637 0.723 0.447 0.880 1.146 0.881 1.146 3.217.- _. "---_. _. -- ..6 0.198 0.443 0.183 0.173 1.35 0.778 0.719 0.447 1.082 1.146 1.082 1.146 3.929.__ ..... -------_...- ----...---- ._--.._.- .. - - -~- - - ~ - - - .- - - ~ - - - . .. .. -" _.__ ._.- - ~ --~.- .. -~- .--
'(;3-- ... - ' ...
beam---- --- -_.. .- . ' .
hale ~~~r'p _y~P ~~~~f! ~y~f! Il ~~~~fl ~!m!~ Vte.IVe, ~~!~{\!Y'!' y.,!~,!!~~ ~!~~~!"' Max Mte~~~p test prediction Vp Mpratio over over (k~) (k~.~,- ,
.. __ . - - ._--V~.~~p theory
1.35- . .-
1 0.221 0.384 0.323 0.188 1.35 0.044 0.0865 0.576 0.685 1.178 0.508 1.178 0.199 1.20B shear 523.2 1862 0.221 0.384 0.323 0.188 1.35 0.133 0.2597 0.576 0.685 1.178 0.512 1.178 0.601 mech.3 0.221 0.384 0.323 0.188 1.35 0.221 0.4328 0.576 0.685 1.178 0.511 1.178 0.999
- . ... --
4 0,221 0.384 0.308 0.188 1.35 0.309 0.5778 0.576 0.718 1.178 0.535 1.178 1,397- . . -
5 0,221 0.384 0.268 0.188 1.35 0.398 0.6464 0.576 0.825 1.178 0.616 1.178 1.8006 0.221 0.384 0,235 0.188 1.35 0.486 0.6928 0.576 0.941 1.178 0.702 1.178 2.1987 0.221 0.384 0.208 0.188 1.35 0.575 0.7247 0.576 1.063 1.178 0.793 1.178 2.6008 0.221 0.384 0.183 0.188 1.35 0.663 0.7356 0.576 1.208 1.178 0.901 1.208 2.998
1
1 1
1
11

• •beam/ A,1 Tangential Loads i
1
h()le Vle!.tlVp VerNp'VrmlVp VrhlV~ ~ Mtes~Mp Mrm/Mp VlosNer VtestlVrm VtesNYh Mtes~Mrm Max Mtest/Mp test prediction Vp Mpratio over over (kN) (~~._m)-- - - .- - -.. --
'J~'~~p theory- -
1.351 -'()j48 0.293 0.185 0.354 1.35 0.122 0.1516 0.505 0.800 0.418 0.805 0.805 0.824 1.051 shear 562.6 200. . - -~--. ---~. -- -~-_. ."-' .. _,'--- -- ._-_. , .-'- --~.- - ....-~2 0.148 0.293 0.18 0.354 1.35 0.364 0.4424 0.505 0.822 0.418 0.823 0.823 2.459 mech.
'-'-'- --
ô:soi- -. --. _. ~ _.'.. - ~ -.- . - - . . ... -.- -'"
3 0.148 0.293 0.141 0.354 1.35 0.5775 0.505 1.050 0.418 1.051 1.051 4.101--. ---- .'-----. _. ___4. -- _._-- --~.- --.---- ..-~-~-- .._-"-- ._~
.. __ ._-~ ~ ---_ ... - - ._- .-- - ------- .--_. - .-- -
- .-.. - - .- - _.- .. - - - ._--- - - .. -_. .- .- -_. .. ". -'-~-~ ----- --- ... .,
beam A,2- . ".> • -- ... - - - - ... - --- .- - -
hole ~!!~!'!.J! ~~".'!p .V't~P V~~~ P ~!~~1 ~,~~.,~ Vle.lVer '!.~.~~,!, ~~/'!~~ M~.~~~~~ Max ~~·~~fl test prediction Vp Mp..- ~-. - ~.
ratio over over {~~t _(~~:'!'). - ---- . - . 1 - .. - . - - -- .. .._- --'--- - - ..~- - --
Vl!~"'p th.ory--- "- - - - _. -". - - .- -- - . - ...
1.35--,..
1 0.214 0.383 0.185 0.354 1.35 0.176 0.152 0.559 1.157 0.605 1.158 1.158 0.822 1.158 shear 430.4 153- - -.-- ._.,- _. ~ .. --- +- _ .•
--~
2 0 0.383 0 0.354 1.35 0.352 0.806 0.000 0.000 0.000 0.437 0.437 Infinite mech.• - • - - # .- ----. ----- - _.", ... _-- --- - ----- - . --. -... -----~-- ~---. - --.--- - _._. --
-~- -- - - -
beam 83._.
hole VI!If!~ Ver!'!'!. VY,-"~f! V~htV.f! P ~t~!~~~ ~!m/Mf! V'e.lVer V~~f!!m V.I!~I."~h ~~~~M~~ Max "'!~~~~f! test prediction Vp Mp. . . - -
ratio over over (kN) (kt4.m)-. - ....
v.t!~!.VP theory1.35
1 0.216 0.433 0.218 0398 1.35 0.122 0.123 0.499 0.991 0.542 0.992 0.992 0.565 1.137 shear 4304 1532 0.216 0.433 0218 0.398 1.35 0.365 0.368 0.499 0.991 0.542 0.992 0.992 1.690 mech.3 0.216 0.433 0.19 0.398 1.35 0.608 0.535 0.499 1.137 0.542 1.136 1.137 2.815
1
l1 1
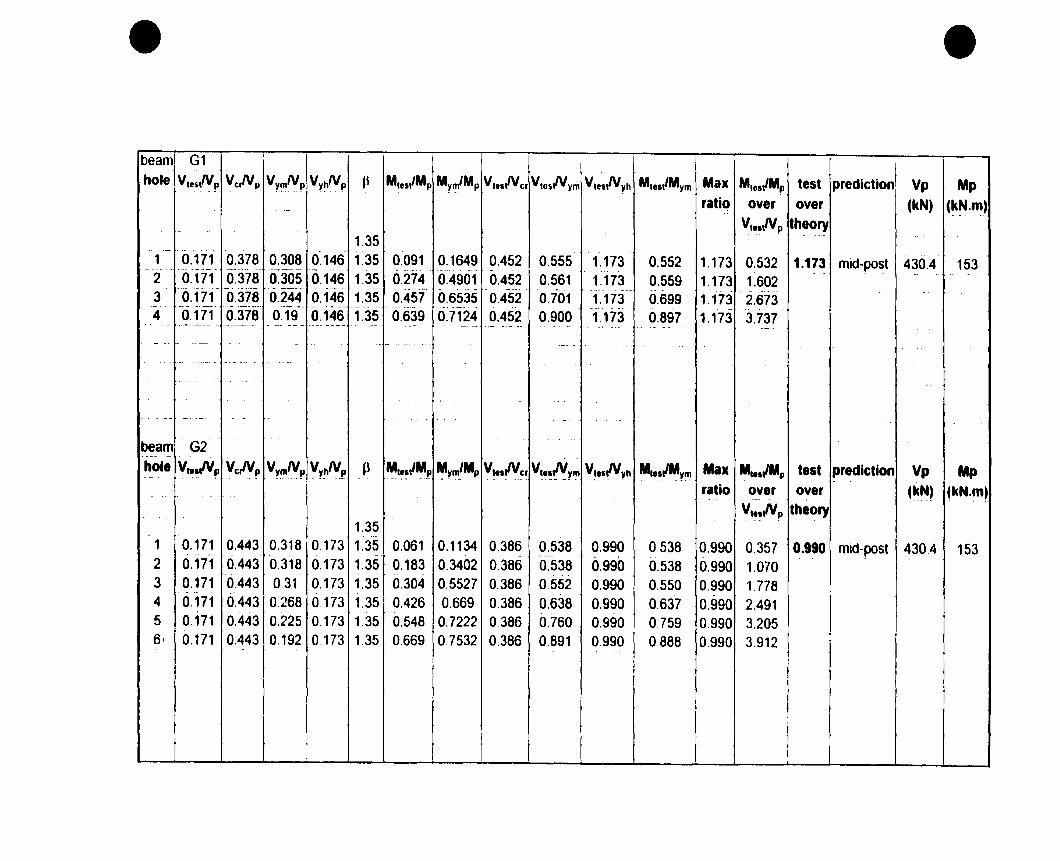
• •beam G1hole V,ulVp Vc,!Vp VymNp Vy~,!,p Ji M,eslMp My,!,/Mp V,estNer VtosNym VteslVyh M,eslMym Max MI8st/Mp test prediction Vp Mp
ratio over over ~~~) (~~.m_).-
.. V,~sJVp theory1.35
- -1.35 0.091 0.16491 0.171 0.378 0.308 0.146 0.452 0.555 1.173 0.552 1.173 0.532 1.173 mid.po~t 430.4 153
- - -'- ----2 0.171 0.378 0.305 0.146 1.35 0.274 0.4901 0.452 0.561 1.173 0.559 1,173 1.602--- --_. -_.-
·û.4si . - ~- - . -.- - ..
3 0.171 0.378 0.244 0.146 1.35 0.6535 0.452 0.701 1.173 0.699 1.173 2.673-0.146 1.35 0.639 0.7124 0.452 0.900 1.1734 0.171 0.378 0.19 0.897 1.173 3.737.. -_. - u~··· ___ ~ __
~----
r ~. ___ _. -- ._._-- . ~- -~- --------- _. -- ..- --~-- . - - .. _.- -- -- -- -
- -- - _. __o. -------.- - - -- -- -
_. - -. - --- . , ... .-
- ----,- .- -
- - - - . - . --- - - . ..
- - __ o. -- --- - - - . - - , .. -
. -beam G2.. -- ".- . ~.- -..
hole ~'!~.!. ~~IYP Vy~~p V~~~]J J} ~t!~/~fI ~~m!~p V'.sNer V,.~~y~ V~!I(V~~ ~~!/M~~ Max Mte~/Mp test prediction Vp Mpratio over over (~N) ~kN.m).. - .
Vt~~lVp theory- .
1.351 0.171 0.443 0.318 0.173 1.35 0.061 0.1134 0,386 0.538 0.990 0.538 0.990 0.357 0.990 mid-post 430.4 153. . ~ .. ----
2 0.171 0.443 0.318 0.173 1.35 0.183 0.3402 0.386 0.538 0.990 0.538 0,990 1.0703 0.171 0.443 0.31 0.173 1.35 0.304 0.5527 0.386 0.552 0.990 0,550 0.990 1.7784 0.171 0.443 0.268 0.173 1.35 0.426 0.669 0.386 0.638 0.990 0.637 0,990 2.4915 0.171 0.443 0.225 0.173 1.35 0.548 0.7222 0.386 0.760 0,990 0.759 0.990 3.2056· 0.171 0.443 0.192 0173 135 0669 0,7532 0.386 0.891 0,990 0888 0.990 3.912
r
11
1
11
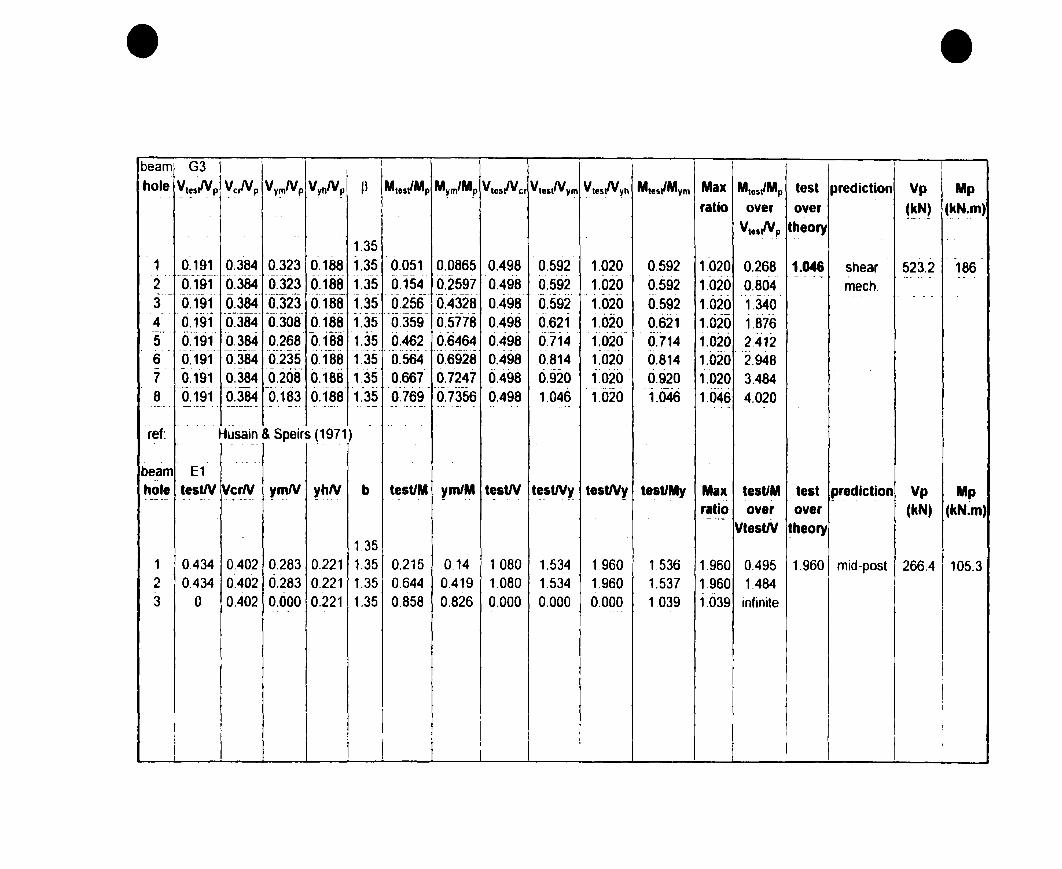
e e
beam G3 1 1
hole ~1!sIYP Ve,Np Vy~lVp VyhNp Il M,es~Mp Mym/Mp VtosNer V,estNym ~lestNYh Mtes~Mym Max MteslMp test prediction Vp Mpratio over over !~~) !kN.m)
- -. Vt..lVp theory1.35... .-
1 0.191 0.384 0.323 0.188 1.35 0.051 0.0865 0.498 0.592 1.020 0.592 1.020 0.268 1.046 shear 523.2 186-~-~~--- --. -- -- ." . . - .
2 0.191 0.384 0.323 0.188 1.35 0.154 0.2597 0.498 0.592 1.020 0.592 1.020 0.804 mech.---------" _.. -
3 0.191 0.384 0.323 0.188 1.35 0.256 0.4328 0.498 0.592 1.020 0.592 1.020 1.340-- .. - ..._,---~-4 0.191 0.384 0.308 0.188 1.35 0.359 0.5778 0.498 0.621 1.020 0.621 1.020 1.876-- _.5 0.191 0.384 0.268 0.188 1.35 0.462 0.6464 0.498 0.714 1.020 0.714 1.020 2.412- -- -_. -- --.-
0.6928 0.498 1.0206 0.191 0.384 0.235 0.188 1.35 0.564 0.814 0.814 1.020 2.948-- -----
7 0.191 0.384 0.208 0.188 1.35 0.667 0.7247 0.498 0.920 1.020 0.920 1.020 3.484- - - - - ~ - ;
8 0.191 0.384 0.183 0.188 1.35 0.769 0.7356 0.498 1.046 1.020 1.046 1.046 4.020_ 4_ • . -- -_.- -~._-_ .. .- .. _ ..-.- .- -----. . --- ~. ... - - -- - ~ -- .. _.-- - .. -
- ...
ret: H~~~i!, & §E.~irs (~971 )
beam E1..
!VerNhale lest/V .y~N ~hlV b tesllM ym/M test/V test/V~ testNl te~~~l Max tesllM lest prediction Vp Mp. ---- -. -- 1· _ .• _ ••
ratio over over (kN) (kN.m)- -.-VlestN theory
1.351 0434 0.402 0.283 0.221 1.35 0.215 0.14 1.080 1.534 1.960 1.536 1.960 0.495 1.960 mid-post 266.4 105.32 0.434 0.402 0.283 0.221 1.35 0.644 0.419 1.080 1.534 1.960 1.537 1.960 1.484
..
3 a 0.402 0.000 0.221 1.35 0.858 0.826 0.000 0.000 0.000 1.039 1.039 Infinite..
1
1
,
1
1 1
1
1
i !i
11 1
,11

• •beam E2hale tesW VerN ymN yhN b testiM ym/M tesW testIVy t~s~y t!'&tJ~ Max testiM test prediction Vp Mp· -- .-.- -' - .
ratio over over ~~~t {~~~~)- 0- ____ ... . ..
VtesIN I~~o~. - -, -- ~ - - - --._- - .. -_. " . l' . -- - ~ - --1.35
1 0.267 0.402 0.283 0.221 1.35 0.132 0.14 0.664 0.943 1.206 0.943 1.206 0.494 1.811 mid~post 266.4 105.3-_.~- --- ----_.- ------ ___ ~.n ----- .- .- --~-~ -_.-----. - - . - _. -. ------_. ~
'.' _._......~- - - . - ,.----- . -- -," - .-., _._".-.'- - .- ---
2 0.267 0.402 0.283 0.221 1.35 0.396 0.419 0.664 0.943 1.206 0.945 1.206 1.483------- --_. .'--..__._.- .. . --- . ._---~.~ -- - ... _._..
3 0.401 0.402 0.283 0.221 1.35 0.330 0.233 0.998 1.417 1.811 1.416 1.811 0.823~.. ------ -----_.- ._-- ._- --- .~-_ .. .._---- ---...----- ---~-- ------_ .. .0·--_·- - - --.. - -,----
.. ' _._-_.'-_. . - ,_ 4 ••• . -...... . .- - ... .
beam E3..-~_.-
~érN••• A __ .~~_ _ ...
hole tesIN Y"!1\!_ y~~. b lestiM .y~M tesIN tes~l.. ~~~Wï..~~U~ Max lesUM test prediction Vp ~p.__._- -------. - ---. -~------ -- - ---- --~ ._. -
ratio over over (~~, j~~.~J.-- · -.-_. -- . - ...._- . . . - ~- -- ... .. - _o. ~
VlestJV ~~!'~~•• __ 4 - -.- . - -- ~~.-- - . . ..-- . .-
1.35_. -- ...... _-1 0.398 0.465 0.283 0.22 1.35 0.207 0.147 0.856 1.406 1.809 1.408 1.809 0.520 1.809 m!d-p~~t 291 109.1- --_. - ---- ...
2 0.398 0.465 0.283 0.22 1.35 0.621 0.442 0.856 1.406 1.809 1.405 1.809 1.560._- ~-- .-.--- -_.- -~ .. - ••4_.' __ - ---- - --_ . . __.- ~4_____ • -- - --.,.- -- -_ .._.- - - .._--~~ ... _.. _.'-. - -. ---- - .- ..... l'
. ,.- - · .... . - -. - . ._ •• _ .• _4 _ _. - - - . . 1·· .. ..
beam F1_....... .. . .- - .. ,
hole .~'!!~~ ~c~p V~f!'N~ '!l~tyf» P .ft4I!~!~~~ ~~~/~~ V...lVcr Vl!~tv~'!' ~~!I~!.h .~~~~~~!'! Max MI••IMp lest prediction Vp Mpratio over over (~N) ~kt4.~)- ._-- .. .. - - _..... . .-
~1!'lVp theory1.35
1 0.289 0.522 0.303 0.257 1.35 0.096 0.1 0.554 0.954 1.127 0960 1.127 0.332 1.497 mid-post 291 109.12 0.289 0.522 0.303 0.257 1.35 0.287 0.3 0.554 0.954 1.127 0.957 1127 0.993
- -- _.-.- -.
3 0.289 0.522 0.303 0.257 1.35 0.478 0.5 0.554 0.954 1.127 0.956 1.127 1.654..
4 0.384 0.522 0.303 0,257 1.35 0.447 0.353 0.736 1.267 1.497 1.266 1.497 1.164. -
1
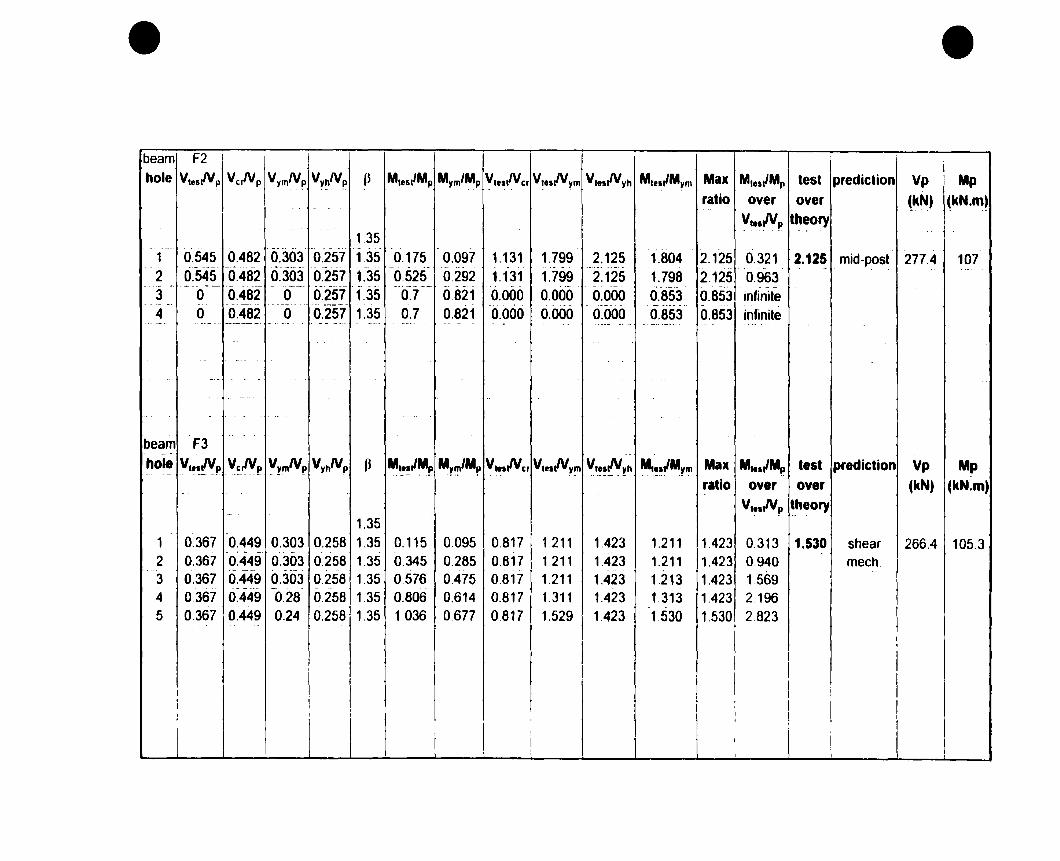
• •beam F2 1
1
hole V,e$IV~ VelVp VYmf\Jf V~~IVp' J} M,es,/Mp Mym/MpV,es,lVer V,,,,lVym V'eslVYh M'e~IM~m Max Mtes,/Mp test prediction Vp Mpratio over over (k~) (kN.m~.. - -
- . - - . - .- ~'e.;Vp theory-
1.35. --- ·1--
1 0.545 0.482 0.303 0.257 1.35 0.175 0.097 1.131 1.799 2.125 1.804 2.125 0.321 2.125 mid-post 277.4 107.. ...... -_.. - - .. - - - .- . - '.--" _. - -
2 0.545 0.482 0.303 0.257 1.35 0.525 0.292 1.131 1.799 2.125 1.798 2.125 0.963- ---. -._. . _.' "0_ ,r_ .• ____
3 0 0.482 0 0.257 1.35 0.7 0.821 0.000 0.000 0.000 0.853 0.853 infinite. -.- _. -4 a 0.482 0 0.257 1.35 0.7 0.821 0.000 0.000 0.000 0.853 0.853 infinite. ~. -'---'- -----~. .- ...-_ ... .. _._~~.-
_... -_.. -- -- - - - - .- - - .... -..._... ". - ~ ... _--- - . --
_o. ---- ...
_. _.- -- - ..
'" - - ._ .. ~
..
beam F3_..-- --- ..
hole Vt~~p .~~_!.V.~ ~~"!.Nf! VyhNf! ~J ~,!~/~p ~~!!l/Mf! V'e.lVer V'"!V'Im ~'.!~t!.".~h ~,!~~Mym Max MleslM~ lesl prediclion Vp Mpralio over over (kN) (kN.m)
Vt~.lVp theory-
1.351 0.367 0.449 0.303 0.258 1.35 0,115 0.095 0.817 1.211 1.423 1.211 1.423 0.313 1.530 shear 266.4 105.3- . - -2 0.367 0.449 0.303 0.258 1.35 0.345 0.285 0.817 1211 1.423 1.211 1.423 0.940 mech.3 0.367 0.449 0.303 0.258 1.35 0.576 0475 0.817 1.211 1.423 1.213 1.423 1.5694 0.367 0.449 0.28 0.258 1.35 0.806 0,614 0,817 1.311 1.423 1.313 1.423 21965 0.367 0.449 0,24 0.258 1.35 1.036 0677 0.817 1.529 1.423 1.530 1,530 2.823
1
1
1
1
1 11
! 1
1 1
1
11 1
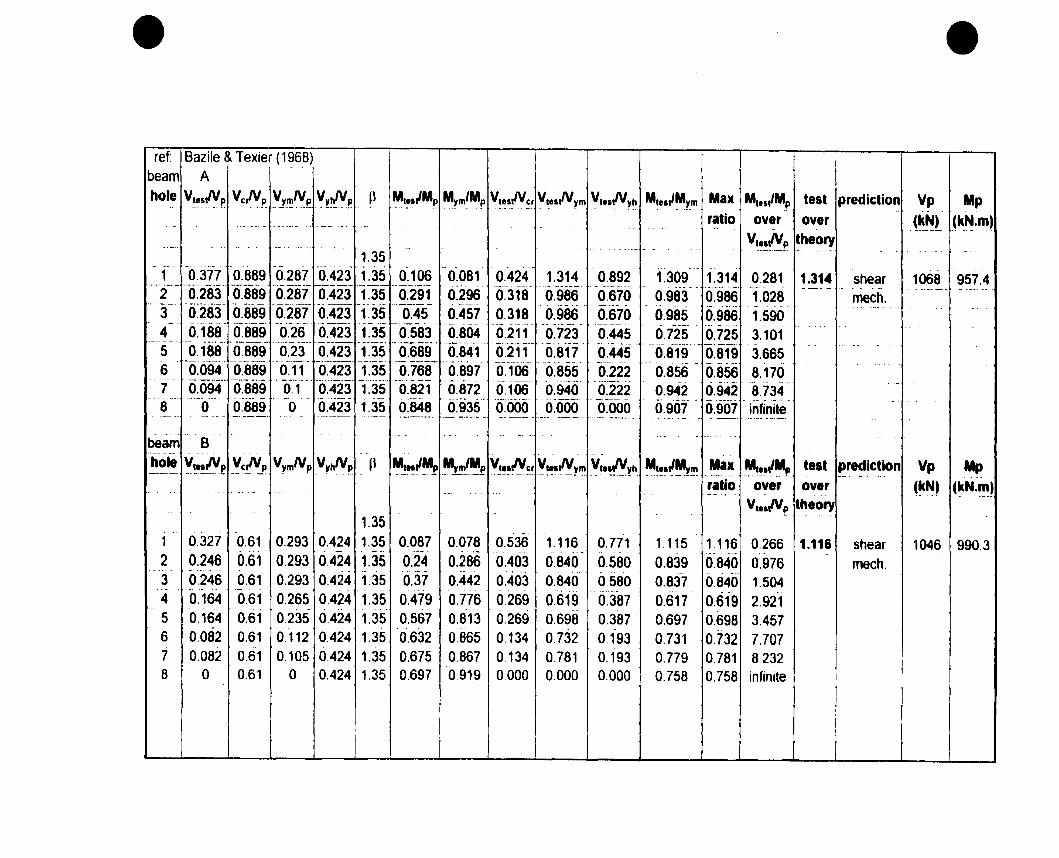
• •ref: Bazile &lexier (1968) 1
!
1t -.
beam Ahole V!~5fYP. Vc~p' ,!,!IT}.~f!. _~~~_~p. J\ ~~.~IMp M~m~Mp V1urNcr Y~u~,!'!l ~t!s!N~~ '!1~.lt/~~_m Max M,ul~~ test prediction Vp Mp- - - --
ratio over over _(~~t .(~~.~)._. - - . --- ---- . - - --- - .- --- -_. -'- -4_- __ . -
1- • - - - ._ •• V~~t!'!'! theory._. -- - _.- -~ -. - - _.. _ .. _- .. . . - - --- - .-1.35- ... _. -
'0.423 ";:35 ._- --1 0.377 0.889 0.287 0.106 0.081 0.424 1.314 0.892 1.309 1.314 0.281 1.314 shear 1068 957.4---_._--- 1------- _._-- ._-_._~-- -[200' . -- ----_. .-._--_.- -- ----~--- _. -_._-- - .- - _. -~-- -.- - -.------ - -_ ... ~.2 0.283 0.889 0.287 0.423 1.35 0.291 0.318 0.986 0.670 0.983 0.986 1.028 mech.
--O~283' 0.423 'O~45-.- '. -._-.'..
0.670'- _... - --- - 4 • _ •• ~ _ _. - .3 0.889 0.287 1.35 0.457 0.318 0.986 0.985 0.986 1.590
fàs '-0~583 . 'o~i:rf-.~---_ .._._- .- - .- ... - .
4 0.188 0.889 0.26 0.423 0.804 0.211 0.445 0.725 0.725 3.101------ - -0.689- .--.------ -. ..- . '--- - .._. ----_. _.- ......-. __ ... - - .. -. -.' --5 0.188 0.889 0.23 0.423 1.35 0.841 0.211 0.817 0.445 0.819 0.819 3.665_ .. _-_.-. _._--
-~- ------ -- ----_ ...- -6 0.094 0.889 0.11 0.423 1.35 0.768 0.897 0.106 0.855 0.222 0.856 0.856 8.170
6:8'72- - . - ._.- .---- . -.
7 0.094 0.889 0.1 0.423 1.35 0.821 0.106 0.940 0.222 0.942 0.942 8.734'0.423 1.35 0:848- "- _.-.....---- -_ ..
'0.000 0:000 (fooo~ - 0.967" 0:907- -
8 0 0.889 0 0.935 infinite------- ._-~_.--- --- ---~- .~.-_. ---- - - ---_.---- -
!-- . - - ..--., . -- --- . . - - - .- -_ ... _ ..
beam B-.. -"- - -
hole ~~'II'!P. ~ct'.J! ~~rn~J! '~~!'!!J!. ~\ ~.!!~~~J! .~Lnl~J! VtlllVer ~~~I~~~ .~tl~/Y~h ~~!1~~1~ Max .~!~~~~ test prediction Vp Mp-- - .. -
ratio over over (~~~ (~N.~)- _.. - -_. -- -_ ... - . _.._--
Vt!lfVJ! theory..
1.35- -
1 0.327 0.61 0.293 0.424 1.35 0.087 0.078 0.536 1.116 0.771 1.115 1.116 0.266 1.116 shear 1046 990.3- -- . --.
2 0.246 0.61 0.293 0.424 1.35 0.24 0.286 0.403 0.840 0.580 0.839 0.840 0.976 mech.. - 0.37- 0.8403 0.246 0.61 0.293 0.424 1.35 0.442 0.403 0.580 0.837 0.840 1.504. - - -- -
0.6194 0.164 0.61 0.265 0.424 1.35 0.479 0.776 0.269 0.387 0.617 0.619 2.921. -
5 0.164 0.61 0.235 0.424 1.35 0.567 0.813 0.269 0.698 0.387 0.697 0.698 3.4576 0.082 0.61 0.112 0.424 1.35 0.632 0.865 0.134 0.732 0.193 0.731 0.732 7.7077 0.082 0.61 0.105 0.424 1.35 0.675 0.867 0.134 0.781 0.193 0.779 0.781 8,2328 0 0.61 a 0.424 1.35 0.697 0.919 0.000 0.000 0.000 0.758 0.758 infinite
1 1
,

• •beam! E 1 1
1 1
hale V,es,Np VelVp Vymtyp VyhNp li M'es,/Mp M~m/Mp V'osIVer V'85,Nym V"SJVYh Mle5~Mym Max M'es~Mp test prediction Vp Mpratio over over (kN) (kN.m)
V'II{VP theory1.35
1 0.219 0.296 0.287 0.509 1.35 0.098 0.121 0.740 0.763 0.430 0.810 0.810 0.447 0.942 flexural 640.2 295.52 0.296 0.287 0.509 1.35 0.27 0.444 0.554 0.571 0.322 0.608 0.608
-- .0.164 1.646 mech.. --~--_._----
3 0.164 0.296 0.287 0.509 1.35 0.417 0.61 0.554 0.571 0.322 0.684 0.684 2.543., .~ _. --- - -
4 0.109 0.296 0.26 0.509 1.35 0.54 0.74 0.368 0.419 0.214 0.730 0.730 4.954____ 0-
5 0.109 0.296 0.23 0.509 1.35 0.638 0.758 0.368 0.474 0.214 0.842 0.842 5.853-- .. ._..... _..- --- - - .-.- - -- - -_._-
6 0.055 0.296 0.11 0.509 1.35 0.711 0.794 0.186 0.500 0.108 0.895 0.895 12.927- . . ---
7 0.055 0.296 0.1 0.509 1.35 0.76 0.807 0.186 0.550 0.108 0.942 0.942 13.818. - - - - . --. --
8 0 0.296 0 0.509 1.35 0.785 0.851 0.000 0.000 0.000 0.922 0.922 intinile- . .- _. -. .. . . - .. - -- -- .',.-
Ret: Halleux (1967)--_.- . .. - - -
beam 1hole V"'~p Vc,Np V~"'.Np V';hNp JI M,••I~p' "',;m/Mp Vt••lVer ~...lVy"! ,!'~'~~h Mtll~M~m Max MtlllMp test prediction Vp Mp
ratio over over (kN) (kN.m)
V.IIlVp theory1.35
1 0.268 0.814 0.095 0.433 1.35 0.11 0.039 0.329 2.821 0.618 2.821 2.821 0.410 2.821 shear 481.7 280.12 0.268 0.814 0.095 0.433 1.35 0.331 0.118 0.329 2.821 0.618 2.805 2821 1.235 mech
-
3 0.268 0.814 0.095 0.433 1.35 0.552 0.196 0.329 2.821 0.618 2.816 2.821 2.060- .
4 0.268 0.814 0.095 0.433 135 0.773 0.274 0.329 2.821 0.618 2.821 2.821 2.8845 0 0.814 0 0.433 135 0.884 0.778 0.000 0.000 0.000 1.136 1.136 infinite6 0 0.814 0 0.433 1.35 0.884 0.778 0.000 0.000 0.000 1.136 1_136 Infinite
1
11
1
1
1 1,
1
1 11
1
1
1
t,1
1
11 1 1
1
1 i 1
1
1
11
1
1J 1

• •beam 18
1
1
hole V'e~~lVp Ve'/vp V'I'!1lVp V~hlVp l' M,es,/Mp M'Im/Mp VlesllVef VlesllVym V,eslV'Ih Mles,/M'Im Max M.es,/Mp test prediction Vp Mpratio over over (kN) (kN.m)
V,,~lVp theory..
1.35..- ~
1.35 0.072 0.024 0.617 2.941 0.456 3.000 3.000 0.3601 0.2 0.324 0.068 0.439 3.000 shear 674.3 452.1••• - 'o. ~---" -_..- ..__ . . ..
~ - .-
2 0.2 0.324 0.068 0.439 1.35 0.215 0.073 0.617 2.941 0.456 2.945 2.945 1.075 mech.--,- ..
3 0.2 0.324 0.068 0.439 1.35 0.359 0.122 0.617 2.941 0.456 2.943 2.943 1.795-._.-. ". ..
4 0.2 0.324 0.068 0.439 1.35 0.502 0.17 0,617 2.941 0.456 2.953 2,953 2.510- . . - .
5 0 0.324 0 0.439 1.35 0.574 0.685 0.000 0.000 0.000 0.838 0.838 infinite- ------ - - - - .. - "~ _.- . . .. - .- . - -
6 0 0.324 0 0.439 1.35 0.574 0.685 0.000 0.000 0.000 0.838 0.838 intinite. _ .. - --- _. - -- --- . -- ---_. - .... .. '-' - -- - .. - - .. -_. - --~. - . - ---
beam 3-- --~ -hole ~~~~~ V~r!"P- V~f!!NfJ ~~~~ Il ~~J_~~ "'~.m/~~ V•••lVer ~!!~fV~rfI V'.~!Y~~ ....!~!~~_m Max M,~,J~p test prediction Vp Mp
ratio over over (~~) (kN.m~.. . - ~ .'. - - .. •. -- -
V,!~IV~ theory1.35
-.0.19 0.103 0.371 1.845 1.046 1.845 1.845 0.433 2.090 shear 423.9 2351 0.439 1.184 0.238 0.42 1.35
-
2 0.439 1.184 0.238 0.42 1.35 0.569 0.309 0.371 1.845 1.046 1.841 1.845 1.296 mech,3 0.439 1.184 0.238 0.42 1.35 0.949 0.515 0.371 1.845 1.046 1.843 1.845 2.1624 0.439 1.184 0.21 0.42 1.35 1.329 0.636 0371 2.090 1,046 2.090 2.090 3.0275 0 1.184 0 0.42 1.35 1.519 0.872 0.000 0.000 0,000 1.742 1.742 infinite6 a 1 184 0 0.42 1.35 1.519 0.872 0.000 0.000 0.000 1.742 1.742 infinite..
1 j1 i
1
1 11
1 11
1
1! , ; 1 !1 1
i
11
l J 1
;1 !
1 1 1 1
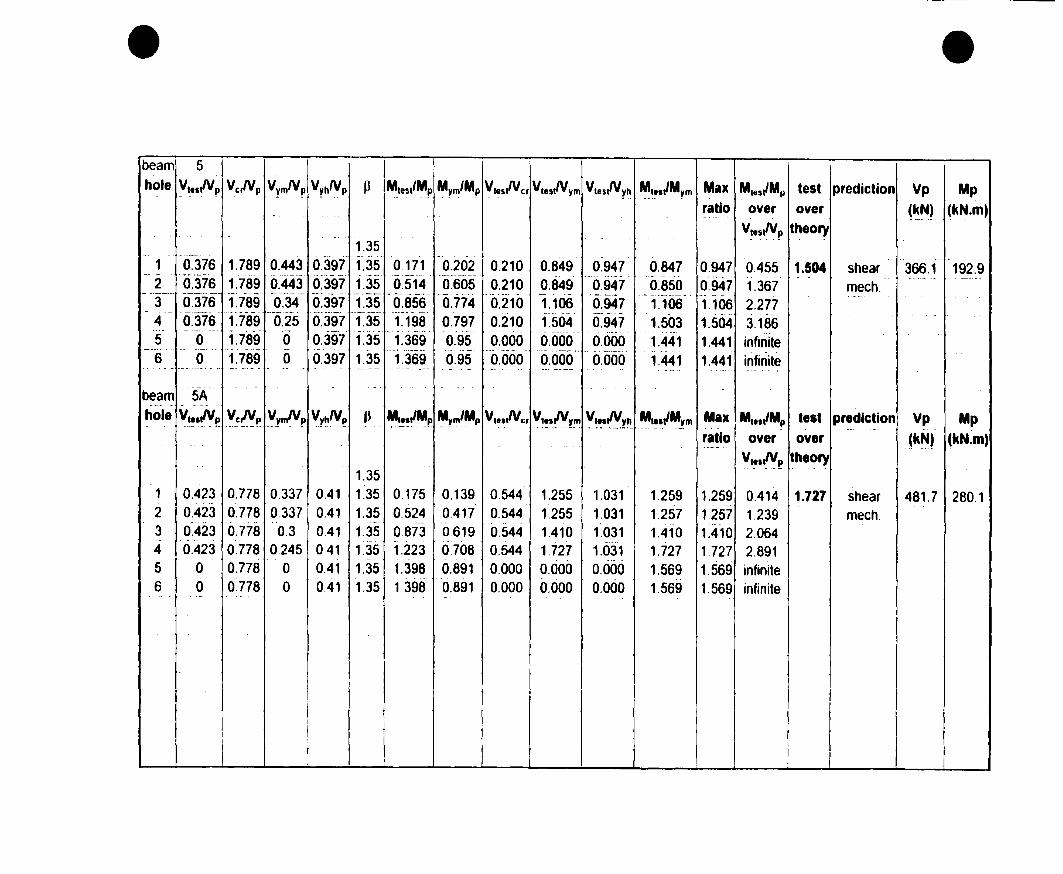
• •beam 5hale Yt~~lVp Vc,/Vp V~mIVp V~h,,!~ P ~,es,/Mp Mym/Mp V,es,IVer Vt"lVym Vle~tfV~h ~,~./M~m Max M.es/Mp test prediction Vp Mp
ratio over over (kN) (kN.m)- . -_.-
"p •• V!..lVp theory1.35
1 0.376 1.789 0.443 0.397 1.35 0.171 0.202 0.210 0.849 0.947 0.847 0.947 0.455 1.504 shear 366.1 192.9-- - . .-.". ... - - .
0~947- . _ ...- '. ---- ..
2 0.376 1.789 0.443 0.397 1.35 0.514 0.605 0.210 0.849 0.947 0.850 1.367 mech.~ ~---- -----
'0:941". - _. __._----- ...
3 0.376 1.789 0.34 0.397 1.35 0.856 0.774 0.210 1.106 1.106 1.106 2.277- -- --- ---_._- - .•4 0.376 1.789 0.25 0.397 1.35 1.198 0.797 0.210 1.504 0.947 1.503 1.504 3.186.... - ...... -_.... .. __ ._- .-
5 0 1.789 0 0.397 1.35 1.369 0.95 0.000 0.000 0.000 1.441 1.441 infinite-.- -_.- - - . - - -_._ ....
6 0 1.789 0 0.397 1.35 1.369 0.95 0.000 0.000 0.000 1.441 1.441 infinite---'-' ~ - -- _.. _-- .-- -- -- _.. _- - -- ... • . ___ o. ---- .. ---~-~-- . -,.. -..- -~ .' - --- ._---- . - ~_. -~_ .. ... - .....
. , . - . - .. '
beam 5A- -- -
hole V},!I~p' .~~r!'!..p. YymIVp ~~~IVJ! Il ~.~!~~J! ~~m'~J! Vt••lVer ~t!·fV~!" Y!..·I.'!~~ ~t!,-~Mlm Max Mt..~Mp test prediction Vp Mpratio over over (k~) (kN.m).. - - "
V,~,IVJ! theory..1.35
1 0.423 0.77B 0.337 0.41 1.35 0.175 0.139 0.544 1.255 1.031 1.259 1.259 0.414 1.727 shear 481.7 280.12 0.423 0.778 0.337 0.41 1.35 0.524 0.417 0.544 1.255 1.031 1.257 1.257 1.239 mech.-- .. -3 0.423 0.778 0.3 0.41 1.35 0.873 0.619 0.544 1.410 1.031 1.410 1.410 2.0644 0.423 0.778 0.245 0.41 1.35 1.223 0.70B 0.544 1.727 1.031 1.727 1.727 2.8915 0 0.778 0 0.41 1.35 1.398 0.891 0.000 0.000 0.000 1.569 1.569 infinite6 0 0.778 0 0.41 1.35 1.398 0.891 0.000 0.000 0.000 1.569 1.569 intinite. ~. . ' " . '. , . • _"0 - ..
1

• •eries 2 jbeam 1hole Y"'-'!P ~~r!VP Vy~'Y.P ~y~'YJ' P ~.~s"~~ Mym/Mp V1eslVcr V.eslYym Vle~eN~h ~!ISI~~ Max M.eslMp test prediction Vp Mp
ratio over over ~~~) . ~~~.m). . . - .. - ..
-1·· . . . .- . ~...IV~ theory----- - ._,,-- -- r __ ... _ -- ~ - ~ . - - .. . --
1.35----- _. - ---- .. - - - -_. - --- . _.
1 0.214 0.822 0.076 0.435 1.35 0.117 0.041 0.260 2.816 0.492 2.854 2.854 0.547 2.854 shear 482 280.1-ô.3K- . -' ._. -- ~ - - - ._- - _. -~. ~ _.- -.. _. - .- _. . .. ,
2 0.214 0.822 0.076 0.435 1.35 0.124 0.260 2.816 0.492 2.823 2.823 1.636 mech..----~_.-0.207 0.260 2.816
.....3 0.214 0.822 0.076 0.435 1.35 0.584 0.492 2.821 2.821 2.7294 0 0.822 0 0.435 1.35 0.706 0.778 0.000 0.000 0.000 0.907 0.907 infinite_.... -- ... -.._- - .-
5 0 0.822 0 0.435 1.35 0.706 0.778 0.000 0.000 0.000 0.907 0.907 Infinite--" ... -"._-_ ... _- ._._.-.- - --- -_. -- -- - - ---~--
_T'_ .. ___ .__ .~ .. -- .-._. __.- ---- .... --- -" - -- - -- .-
-.0." __ ..
... -
- .. . -. - . ..- -- . ...
beam 3---- _. -
hole ~.e'~p ~crIYP V'/mNp V~hNp P M.esl~~ MYIn/M~ V.es.eNcr V.e,t!Vym V.e~fVy~ M.e~~My,!, Max M.es/Mp test prediction Vp Mpratio over over ~kN) (kN.m)...
V...lVp theory1.35
1 0.343 1.153 0.199 0.42 1.35 0.197 0.114 0.297 1.724 0.817 1.728 1.728 0.574 2.181 shear 423.9 2352 0.434 1.153 0.199 0.42 1.35 0.59 0.342 0.376 2.181 1.034 1.725 2.181 1.359 mech-3 0.343 1.153 0.199 0.42 1.35 0.983 0.57 0.297 1.724 0.817 1.725 1.725 2.8664 0 1.153 0 0.42 1.35 1.189 0.872 0.000 0.000 0.000 1.364 1.364 infinite5 0 1.153 0 0.42 1.35 1 189 0.872 0.000 0.000 0.000 1.364 1.364 infinile 1
1
1 1 11
11
111
1
i 1
1
1
j 1
1 1 1 1
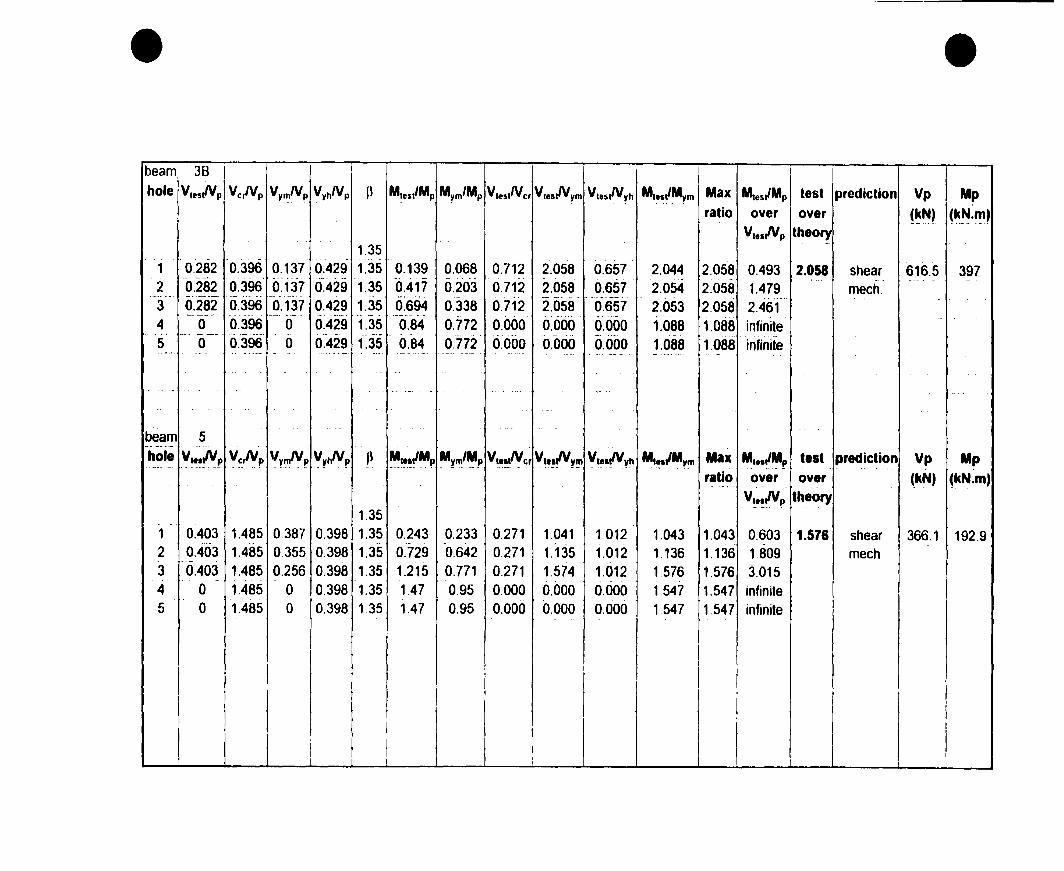
• •beam 38 1
hole V'eslVp VclVp V~~lVp V'IhlVp l' M'IlS,'Mp M'Im'MpV'eslVcr V,e.lV'ImV'eSIV'Ih M,es~~ym Max M'es,'Mp test prediction Vp Mpratio over over (~~) ~~_~.'!1)
V,~·lVfJ theory.-.
1.35• ·4 •
1.35 0.712 2.058 0.657 2.0581 0.282 0.396 0.137 0.429 0.139 0.068 2.044 0.493 2.058 shear 616.5 397- -- --_.'-- - ....
~ -~. - --- ...
2 0.282 0.396 0.137 0.429 1.35 0.417 0.203 0.712 2.058 0.657 2.054 2.058 1.479 mech.2.058' "tf6Si
- -.*. . . , .
3 0.282 0.396 0.137 0.429 1.35 0.694 0.338 0.712 2.053 2.058 2.461. _.-_._~ .- .--_ .• - -
6.000., .
4 a 0.396 a 0.429 1.35 0.84 0.772 0.000 0.000 1.088 1.088 infinite... _.- ---.--
0.0005 0 0.396 0 0.429 1.35 0.84 0.772 0.000 0.000 1.088 1.088 infinite- ..- ... - -- - - . ~.- .,_ .. _- - - -. -'- .......~- - -- . - -------- . .... _.... - - ---- . - .... -_.~ .. - - --~ .. .- - - ..
.. _. . ' . . .
. - ~. -- - .. . 1· 0-- __ ... 4_ ••
. -
..
beam 5_..__ 0_-
hale ~~"-~!'!fJ ~~rN.fJ Vy"'.~p ~ytIVp P ~,~~~Mp My"!''!'p VI••lVer VI'~(V~f!' ~'!.f'.~h "'!./~ym Max Il'··~~fJ test prediction Vp Mpratio over over (.kH) ~~N.m)-- --.~ . -
V~.~f.VJJ theory1.35
, .
0.243 0.271 1.041 1012 1.043 0.603 1.576 shear 366.1 192.91 0.403 1.485 0.387 0.398 1.35 0.233 1.0432 0.403 1.485 0.355 0.398 1.35 0.729 0.642 0.271 1.135 1.012 1136 1.136 1.809 mech3 0.403 1.485 0.256 0.398 1.35 1.215 0.771 0.271 1.574 1.012 1.576 1.576 3.015
- ..
4 0 1.485 a 0.398 1.35 1.47 0.95 0.000 0.000 0.000 1.547 1.547 intinite..
1.47 0.000 0.000 0.000 1.547 1.547 infinite5 0 1.485 0 0.398 1.35 0.95..
11 11 1

• •ret: Sherbourne (1965) 1
beam E1 Ultjmate loadshole ,~~!..lYp VerNp. ~ymtye ~"tt1'!J! ' P M,es~~!, NI~.m/~!, V'eselVer V.I!'fJy'!' V~e~cI"~~ ~l!'~~~m Max ~,e,~Mp test prediction Vp Mp
ratio over over (k_~~ . !~~~~~- .- . - ._- ... ---- -. ' , .-
- .- -- -.-' -- - - . ~-~-- .~ .-. - .. . -.. _ .~!!'~f!. theory1.35
" , - - - - - - ... -
..-._._--0.29 0.082
..
1 0.434 1.631 0.289 1.35 0.123 0.266 1.502 1.496 1.500 1.502 0.283 1.503 shear 218.1 63.37------- --[289'- .__._~----- -~--._----_ . ._~ ------- - - _. - ~_..
~ .- -- - ____~.a._._ ._---- .-._---- .----_. -2 0.434 1.631 0.29 1.35 0.3689 0.246 0.266 1.502 1.496 1.500 1.502 0.850 mech.
-~ ---_.- ._---._---~.- . .. _. '0•• 0 -- .,.. - - - - -
3 0.434 1.631 0.289 0.29 1.35 0.6149 0.409 0.266 1.502 1.496 1.503 1.503 1.416--" ------
0.2'89-- -.---.- . --- ---~ - - -. -~-- -- .. ._--
4 0.434 1.631 0.29 1.35 0.6555 0.573 0.266 1.502 1.496 1.144 1.502 1.510------- _ ....... --- --- ---.-._. '-- ._---- -'- ----- _.------. --, ------ ---- -_._-~~-- -~----- --"-- --. - -._--- _.- ~.- "-_. - . ~ - -., _. . ---- .. ..
-- ~.. , . -- . .. _.. . ..
beam E2----~~.-
- _. __... . . . .. ' . . .~- . - _.
hole ~tnt!'!f ~~,Nf!. ~rr.n."!p Vtt{'!~ p ~••I~f ~~~!' VI••lVer "-~~~'!' ~~~r~ .~~!Ml~ Max ,~!·lM~ test prediction Vp Mp- - ...-. . --
ratio over over ~~~)- (~~:~" - -- -- - " ~ -- "- ~. .. - - . . .. ~ ~ - --- .. ~ ._.~~-~- - -- •.. -
. , .~~!.fV..J!. theory._, ..-
1.35. -- - ._ .
1 0.471 1.631 0.289 0.29 1.35 0.1333 0.082 0.289 1.628 1.621 1.626 1.628 0.283 1.630 shear 218.1 63.37.. '
0.289 '0.3999 0.246 1.628.... ----- ..- -
2 0.471 1.631 0.29 1.35 0.289 1.621 1.626 1.628 0.850 mech.3 0.471 1.631 0.289 0.29 1.35 0.6665 0.409 0.289 1.628 1.621 1.630 1.630 1.416
(3:7999'. - ~- -- . . ,-
4 0 1.631 0 0.29 1.35 0.869 0.000 0.000 0.000 0.920 0.920 infinite.- ~ & •• . - - --- -- .... _.. -------- -_. - - --- -~- ~ ....- .-_. - -- . - - .. ---. ,-_.
. .beam E3
, .. , .. -hole Vt,,~t!V.f! ~e.,Np V'/m~p V'/hNp . Ji '!1t~'~~f Mym/Mp V,e.lVer VI.~!V~m VI.~~~!l M'e~IM~m Max ~l.~~~p test prediction Vp Mp
'.110 over over (kN) (kN.m)- - _.."~ ' ..-Vt.~lVp th.ory
1.351 0.491 1.631 0.289 0.29 1.35 0.1391 0.082 0.301 1.700 1.692 1.697 1.700 0.283 1.700 shear 218.1 63.372 0.491 1.631 0289 0.29 1.35 0.4174 0.246 0.301 1.700 1.692 1697 1.700 0.850 mech.3 0 1.631 0 0.29 1.35 0.5566 0.869 0.000 0.000 0.000 0,640 0.640 infinite4 0 1.631 0 0.29 1.35 0.5566 0.869 0.000 0.000 0.000 0.640 0.640 infinite
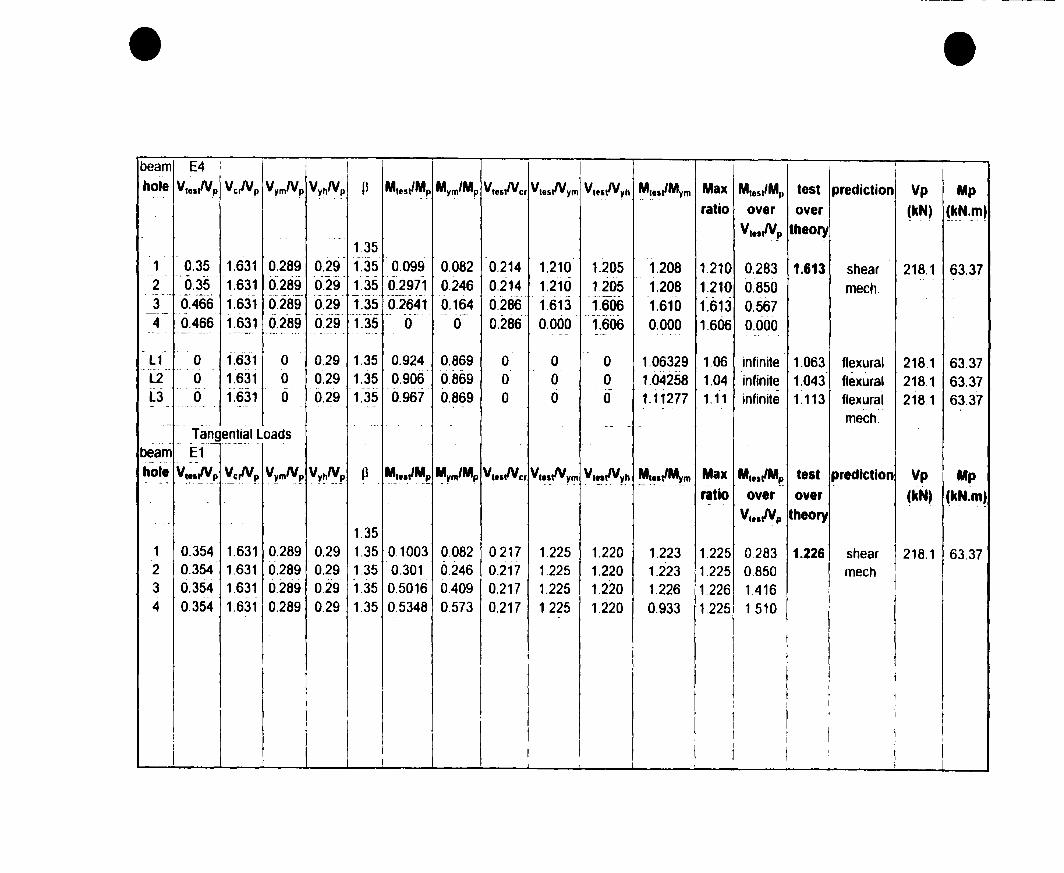
• •beam E4 1
1..hole VteltN.p Vc,/Vp V~mNp V~~'YP f~ Mtest/Mp Mym/Mp Vter.rNcr V,esrNym Vtt,rNYh ~'tlJMym Max M,es,/Mp test prediction Vp Mp
ratio over over (kN) (~N.~)
Vtt.Np theory- .
1.35..
1 0.35 1.631 0.289 0.29 1.35 0.099 0.082 0.214 1.210 1.205 1.208 1.210 0.283 1.613 shear 218,1 63.370.289 0.29 1.35 0.2971 0.246 0.214 1,210
.. . -- ..
2 0.35 1.631 1.205 1.208 1.210 0.850 mech.- -- _.- - - - -- _.._~.- - ,. _.~--
3 0.466 1.631 0.289 0.29 1.35 0.2641 0.164 0.286 1.613 1.606 1.610 1.613 0.567~-- ~.' - - - " . .. _." .".. ' .4 0.466 1.631 0.289 0,29 1.35 0 0 0.286 0.000 1.606 0.000 1.606 0.000- ~. - . _... ----- - --_._.. . a_.." _ .'-'-. - -" . ~ .--- -- -- - .. - ..
. - .
0 1.35 0.924 0.869 0 0 0 1,06329 1.06 infinite 1.063 218.1L1 0 1.631 0.29 flexural 63.37L2 0 1.631 a 0.29 1.35 0:906 0.869 0 0 0 1.04258 1.04 infinite 1.043 flexural 218.1 63.37L3 0 1.631 0 0.29 1.35 0.967 0.869 0 0 0 1.11277 1.11 infinite 1.113 flexural 218,1 63.37-- . - ._,~ - -- - _.. -
l' ._. ...mech.-.-.- --- ~ - -- -
Tangential Loads-- - ------" .. ---- . - .
beam El~ - -. -- --
hole V~~~tvy '!.c/Yr}. V~mNJ! V~~f\!P P . ~tel~~~ ~ym/Mp V1tlrNcr Vt!~lVym VI!.lfVy~ ~~!.~~_m Max MtesJM" lesl prediction Vp Mpratio over over (kN) (k~.m~..
VtlllVp theory1.35
1 0.354 1.631 0,289 0,29 1.35 0,1003 0.082 0,217 1.225 1.220 1,223 1.225 0.283 1.226 shear 218.1 63.372 0.354 1.631 0.289 0.29 1.35 0,301 0.246 0.217 1,225 1,220 1.223 1.225 0.850 mech3 0.354 1.631 0.289 0,29 1.35 0.5016 0.409 0.217 1.225 1.220 1.226 1,226 1.4164 0.354 1.631 0.289 0,29 1.35 0,5348 0.573 0.217 1.225 1.220 0.933 1.225 1.510
1 11
1,j 1
1 1
1 1
1
11
11 r
1j 1
11 1
!1 1 1 1

e e
beam E2hale '!!~~IYP V_c,IVP- Y~~~p. V·!l'!J! P Mles~"'p Mym/Mp VleslVcr V,,~~fV~~ VI·~fV~h ~1.~/M~m Max M1es',.p test prediction Vp Mp
ratio over over (~~) (~~.!!,)- o. _ ..• -- - - -~ - - ..~ -- --- --
--- -- - -V.tlfJJ! theory
0- __ •~--
- -1.35~ - - - - - --
1 0.4 1.631 0.289 0.29 1.35 0.1132 0.082 0.245 1.383 1.377 1.381 1.383 0.283 1.384 shear 218.1 63.37'Ô~29
--- ~-.__.- --_ ..._-~ - . ... _- - _. - .... -- ---2 0.4 1.631 0.289 1.35 0.3397 0.246 0.245 1.383 1.377 1.381 1.383 0.850 mech,----- -_._--~ .. _-1:35
-_._._~--- - ·-'.-0 ___ -_._- - .... - - _. - -- ...3 0.4 1.631 0.289 0.29 0.5662 0.409 0.245 1,383 1.377 1.384 1.384 1.416- - - 0._ .. -- -_._-
'-1:35'.. - .- ----- .. - - ~ ---......- ... - ..
infinite4 0 1.631 0 0.29 0.6795 0.869 0.000 0.000 0.000 0.782 0.782- .~- -----' -~.. . - .. -- -- . ----- ----- ------ - - .-.-- -- - - _. -.-_.~--- -- .~ ---....- . • •• ____ 04 -. ---- 0- .•.••••• _ .
- - - .....- - - - -_. -- . 0·_ .. __ ..__ - . -_. "- -- -- • - -beam E3- .. _-_.- .~- .- - -- .... - .hole ~':!~!'!!!. Y~fJ. ~~mN.f! '!!~!Ye p ~Itll~~ _"'t~/~p V.e.IVer ~!t~~~"Y. ~~fV~!! ,.~~~"'~m Max ~..~I~!, test prediction Vp Mp
. ._- -- -_.ratio over over (~N~ (~N.~~--, - .- .. - - ~ - . -- .. -- -- -- .._.~- .. ~ - ._ ..- -
~~~~p._ theory- - . -f35 - -
- --
1 0.411 1.631 0.289 0.29 1.35 0.1165 0.082 0.252 1.423 1.417 1.421 1.423 0.283 1.423 shear 218.1 63.37----
2 0.411 1.631 0.289 0.29 1.35 0.3495 0.246 0.252 1.423 1.417 1.421 1.423 0.850 mech.- . -
3 a 1.631 0 0.29 1.35 0.466 0.869 0.000 0.000 0.000 0.536 0.536 infinite4 0 1.631 0 0.29 1.35 0.466 0.869 0,000 0.000 0.000 0.536 0.536 infinite. _.- - - - - ---- _.- -- -- --- -. - -
---
- -
1 1
i [1
111

• •beam E4..hole V~I5IY.~ VclVp VymNp V~~Np ~} M_,e~IMp Mym/Mp V1e5IVcr V,.~,N~m Vle~IN~h M,esl~y!" Max MI8$I/Mp test prediction Vp Mp
ratio over over (~NJ ~~~.~~_00 .. _.
V1!,.tVP theory--- ~ -.. . - ._. - -~ -- 00_ .0
1.35- ----- .- ... ~- . . .' -
1.082 1.077 1.080 0.2831 0.313 1.631 0.289 0.29 1.35 0.0886 0.082 0,192 1.082 1.442 shear 218,1 63.37. . - ._- ••a~a~~·___ .. -- ---- - .- -- - . - -_. -' .2 0.313 1.631 0.289 0.29 1.35 0.2657 0.246 0.192 1.082 1.077 1.080 1.082 0.850 mech.
01361 1.436.. -
3 0.417 1.631 0.289 0.29 1.35 0.164 0.256 1.442 1.440 1.442 0,567._ 0 .._.- --, .. 0-
4 0.417 1.631 0.289 0.29 1.35 0 0 0.256 0.000 1.436 0.000 1.436 0,000. _.~ --~ ---_..~--_.~ .--. -_. ,- --" ..._---- -_.- ---. ---- ._. . ._-- ---- . ----- ~ ....... -_.. -. --- -'- ----... 0- • _ ••• o_
l1 0 1.631 0 0.29 1.35 0.924 0.869 0.000 0.000 0.000 1.063 1.063 Infinite 1.063 f1exural 218.1 63,37... __...
0.000 0.000 0.000 1.043 infiniteL2 a 1.631 0 0,29 1.35 0.906 0.869 1.043 1.043 flexural 218.1 63.3710
'0- • ____
1.631 a 0.29 1.35 ·0:967 - 0.869 0.000 0.000 0.000 1.113 1.113 infinite 1~113 f1exural 218.1 63,37L3 a.. _-,.~ - -. _... _-_." . _.. -._- - -_.- --- - - .._- .. --- . --- - -- --.. - - _._- . ._---- '. -. - .0
--~- ... o' .- - ~ ,. -.
."... - ~- - - -
ref: _.~pr~c & f~o_~~J1~~~) ..
beam 0._-- .. _.~ .. - -. ..
hole o'!~~I,V,f! ~~~f V~~N~ vyhryp Jl ~!'~~J» ~~,"/M~ V.e,lVer Vle~/Y~rn ~'e'~lh ~t!,~M~m Max ~'e,IM~ lesl prediclion Vp Mp. ~ ~ .-
ralio over over (~-~~ (k~.mt- - - . .. ---
Vte~"Yp Iheory.'. - - .
1.351 0.162 0.381 0.21 0,204 1.35 0.087 0.112 0.425 0.771 0,795 0.777 0.795 0.537 0.956 tlexural 243.7 82.71
,. -'-
2 0.162 0.381 0.21 0.204 1.35 0.26 0.336 0.425 0,771 0.795 0.774 0.795 1.605 mech,o. ..3 0.162 0.381 0,202 0.204 1.35 0.433 0,538 0.425 0.802 0,795 0.805 0.805 2.673-
0,606 0.425 0.953 0.795 0.956 0.956 3.7414 0.162 0.381 0.17 0,204 1.35 0.6345 0.081 0,381 0,085 0.204 1.35 0.72 0.754 0,213 0.953 0.397 0.955 0.955 8,8896 0 0,381 0 0.204 1.35 0,744 0.779 0,000 0.000 0.000 0.955 0.955 intinite
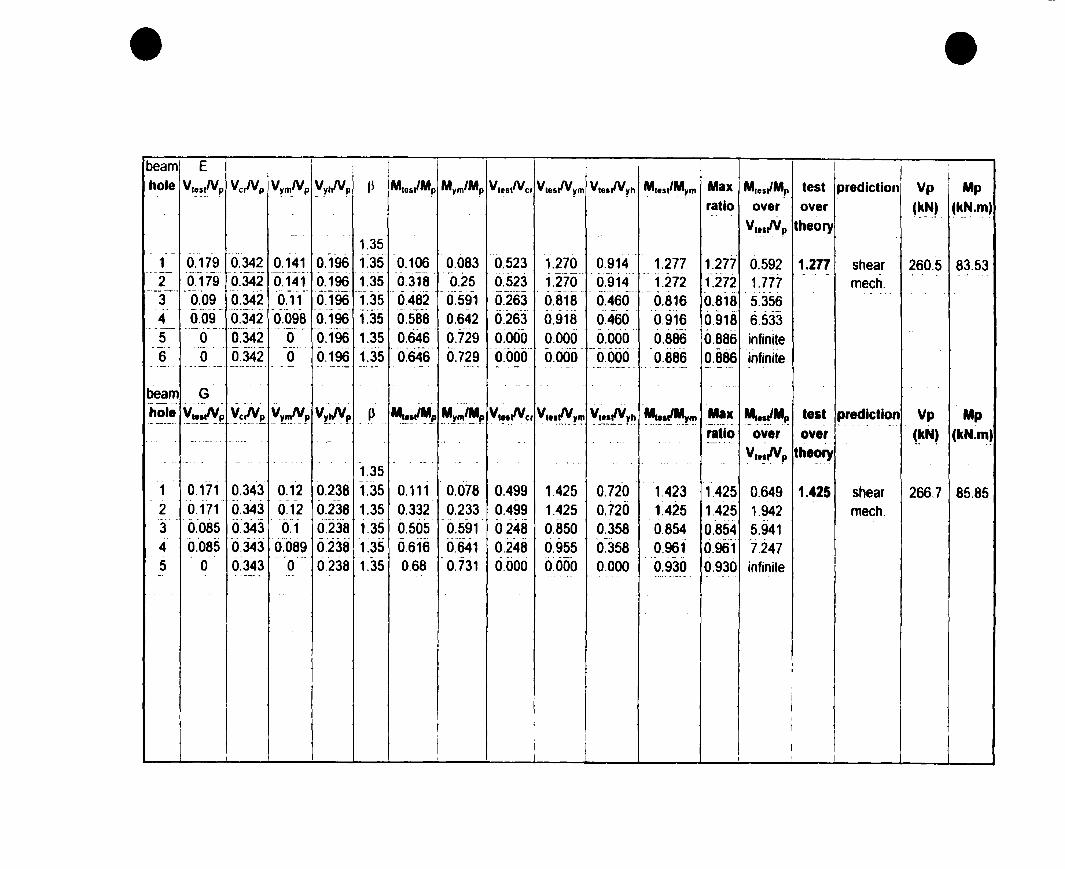
• •beam E 1
1 1
hole VI,!~rNl' Vc,!Vp V~m.Np ,!VhNp Il Mres"Mp Mym/Mp VreslVcr VleslV~m VlellV~h ~1e5,/M~m Max MIUlMp test prediction Vp Mpratio over over (~~). ~~~.m)
V,eslVp theory~ -- . ~
1.35" , ,.'~., _.
'0.523 1.270 0.914 1.277 1.2771 0.179 0.342 0.141 0.196 1.35 0.106 0.083 0.592 1.277 shear 260.5 83.53- - --.- - -- ~ -' '. - - ._---. ...
2 0.179 0.342 0.141 0.196 1.35 0.318 0.25 0.523 1.270 0.914 1.272 1.272 1.777 mech.'0.482
. _.~---- - ----- - -~.- ~ ..... ~--_.. - . - _ ..
3 0.09 0.342 0.11 0.196 1.35 0.591 0.263 0.818 0.460 0.816 0.818 5.356... -- -- - ~ - ----
4 0.09 0.342 0.098 0.196 1.35 0.588 0.642 0.263 0.918 0.460 0.916 0.918 6.5335 0 0.342 0 0.196 1.35 0.646 0.729 0.000 0.000 0.000 0.886 0.886 infinite
----.. ---. .'():646" . - ----_ .. --. - .... _ .
6 0 0.342 a 0.196 1.35 0.729 0.000 0.000 0.000 0.886 0.886 infinite- --- .. -_. --- ____ r __ ·' •
".- --- ---- ---~ -- -- - --.._-- -- - --, ..~ - . - - -- -. -- - -_." .._._-.. - --- _.- ._- _ •. _ 0_. . -_.---
- .. --- ..
beam G----- - .. - .
hole ~'!~~ ~~t!P.. \l't"-,-~P V't.~p. P M~~~~l' ~~/~~ V,••lVer ~~~f!~"!- .'!!~tY~~ ~~t~~m. Max ~~11~~~ test prediction Vp Mp.. -- --- ~ .. -. - -' .
ratio over ove, (~N~ (kN.m)--, ._- .. .....- " ,.. .. - . - ~. . . --~-._~- -
~,·~I!'P theory. . -. --" - - . ~ -.- . . - . ~ - ..
1.35.. . ..
1 0.171 0.343 0.12 0.238 1.35 0.111 0.078 0.499 1.425 0.720 1.423 1.425 0.649 1.425 shear 266.7 85.85.. - .
2 0.171 0.343 0.12 0.238 1.35 0.332 0.233 0.499 1.425 0.720 1.425 1.425 1.942 mech.-
3 0.085 0.343 0.1 0.238 1.35 0.505 0.591 0.248 0.850 0.358 0.854 0.854 5.941'_0'--
0.616 0.641 0.248 0.955 0.358 0.961 0.961 7.2474 0.085 0.343 0.089 0.238 1.35, ..
a 0 0.238 1.35 0.68 0.731 0.000 0.000 0.000 0.930 0.930 infinite5 0.343_. - -.~.- . --- .. - - --- -- . -- . - . ••• _~ _ ,_._ 4 - .
;1
1
1
ij 11
1

• •beam H
v".I\I,.i M.../M,m
1
hole V'es!Vp Vcr'~ V~mIVJl V~hlVp l' M'e5,/Mp Mym/MpV'es,lVcr V'e5,IV~m Max M,es~Mp test predictionl Vp Mpratio over over (k~) tk~.m)- ~" ..
V,eslYp theory... .0.-
1.35- ... - ..
1 0.217 0.448 0.315 0.178 1.35 0.093 0.134 0.484 0.689 1.218 0.694 1.218 0.429 1.218 mi~.post 225.3 71.51---~---. --. . .' - _._- - _.. --
. -2 0.217 0.448 0.315 0.178 1.35 0.278 0.403 0.484 0.689 1.218 0.690 1.218 1.281
- ----_.~. ...._----_._-- . - 0_- _." ___" ... . .
3 0.217 0.448 0.293 0.178 1.35 0.463 0.624 0.484 0.741 1.218 0.742 1.218 2.134lf60S'
.- _.- .. _.
4 0.109 0.448 0.14 0.178 1.35 0.781 0.243 0.779 0.612 0.775 0.779 5.5505 0.109 0.448 0.125 0.178 1.35 0.698 0.803 0.243 0.872 0.612 0.869 0.872 6.4046 0.109 0.448 0.11 0.178 1.35 0.791 0.801 0.243 0.991 0.612 0.988 0.991 7.257
. .- .. . --- ..- .7 0 0.448 0 0.178 1.35 0.843 0.836 0.000 0.000 0.000 1.008 1.008 infinite8 0 0.448 0 0.178 1.35 0.843 0.836 0.000 0.000 0.000 1.008 1.008 infinile- .. . - _. -_ .. --- .... . - - -"- ... - - --... -- ~ -- -- ... . . _. - --- - .,. - -- - .. . .. _--
beam 1. --- . " . . ,. ..
hole ~.~t!"p V~,,-,!~ Y'ImlVp V~hlV~ P ~~~!~~J» ~~~/~p V'tllYcr V~..~~,!, ~~~~~~ ,..!'IM'Im Max M••11,.,p. test pred~ct~on Vp Mpratio over over (kN) (kN.m)_.. ..
V'e~lVp theory- -.- .
1.351 0.162 0.268 0.09 0.13 1.35 0.094 0.052 0.604 1.800 1.250 1.808 1.808 0.580 1.808 shear 285 94.5._.- .-2 0.162 0.268 0.09 0.13 1.35 0.282 0.157 0.604 1.800 1.250 1.796 1.800 1.741 mech..._-
3 0.081 0.268 0.09 0.13 1.35 0.413 0.46 0.302 0.900 0.625 0.898 0.900 5.099..
0.302 0.625 6.2594 0.081 0.268 0.085 013 1.35 0.507 0.533 0.953 0.951 0.9535 0 0.268 0 0.13 1.35 0.545 0.664 0.000 0.000 0.000 0.821 0.821 infinite
- ...
1
1
1
1
1
1
1
rt
1
1 i j, !
1 11
11

• •ref: AUifillisch, Toprac & Cooke (1957)
1
beam A- .
hole V~e~f.Vp V~r!'!~ Y~~!,p y~~~ .. ~\ M,.~!/~p ~~!'l~"'i> VteslVer ~,·~fV~!" ':J!.~~~h_ ~t.~JPt1~m Max M'.sJ~p test prediction Vp Mpratio over over tk_~~ (k~.m)-"~ ... - . - _. - • ~ - . . ---
V~e~~~. theory... __ - -0 --. ~ - ~_._. ---~ --_.- ... - . - ._-- - -, - --- ... ..
1.35- ·p-P ••• ---- - ..,- .. . - - .-.
1 0.184 0.413 0.45 0.308 1.35 0.098 0.239 0.446 0.409 0.598 0.410 0.598 0.533 0.887 flexural 284.7 88.45Cf308" 135 . -------~-~ . -- .._----- ----_.+_. - ---- _. --_ .. ._.. _-- --- a. __ .·_•• .... _-. ---
2 0.184 0.413 0.388 0.293 0.619 0.446 0.474 0.598 0.473 0.598 1.592 mech.f--_ .• -.- ------ -- . -~_._--- . -- -._- .... --.- "'-.'- - . ---- ---p - -3 0.184 0.413 0.268 0.308 1.35 0.448 0.712 0.446 0.687 0.598 0.629 0.687 2.435----_.._-- , - -_._--_ .... - -- ..-.- ~ .. . --- --'--'~ .--- _._._--- - . -4 0.184 0.413 0.213 0.308 1.35 0.683 0.792 0.446 0.864 0.598 0.862 0.864 3.712
-------~ -r35 '·0:803 ----_.- ...--- --~.- ... _-- --..-.---_.- ._- _._~.--_.- - ..- .. "'
5 0 0.413 0 0.308 0.905 0.000 0.000 0.000 0.887 0.887 infinite___ A • ___ 0
'0:000- .. ' .._-_ .. ..
6 a 0.413 0 0.308 1.35 0.803 0.905 0.000 0.000 0.887 0.887 infinite. -----
1.35- -- --- .... ---- ... _---~~-.
7 0 0.413 0 0.308 0.803 0.905 0.000 0.000 0.000 0.887 0.887 infinite_._..---~- - ------- - --_..
8 a 0.413 0 0.308 1.35 0.803 0.905 0.000 0.000 0.000 0.887 0.887 infinile-_..-- ---~&_-- ----- , ._-- ---« .. _- .- -.-_.--.,-.-_. --_ . .__ ..-~- .-.__ ..~4_~_._ .. _. -~~- -- ---- .. --- -----
...
beam C---~ .. -- ... ~ ... .,.
hole ~~lVp "~~!V..p. Y'!".!fY.P. V'1h/Y1! P ~.-,-~MI! ~lrn~~P VtellVer Vt!~!y,!!!! '!~~~t.'- ~..!"~'!rn Max~I'~"~~
test prediction Vp Mpratio over over ~~N) (kN.m).. .-
Vt.~!Vp theory~ ..-
1.351 0.147 0.186 0.141 0.23 1.35 0.106 0.102 0.790 1.043 0.641 1.039 1.043 0.721 1.122 shear 355.9 123.5. _.2 0.147 0.186 0.141 0.23 1.35 0.318 0.306 0.790 1.043 0.641 1.039 1.043 2.163 mech.3 0.147 0.186 0.131 0.23 1.35 0.531 0.474 0.790 1.122 0.641 1.120 1.122 3.612.. . - .- <fooo4 a 0.186 0 0.23 1.35 0.639 0.711 0.000 0.000 0.899 0.899 infinite5 a 0.186 a 0.23 1.35 0.639 0.711 0.000 0.000 0.000 0.899 0.899 infinite
•
•
APPENDIXC
Elastic and Plastic Theoretical Computations
This Appendix contains aIl calculations in deriving the Buckling loads under the ~ffect of
Inelasticity on the Ultimate Strength.
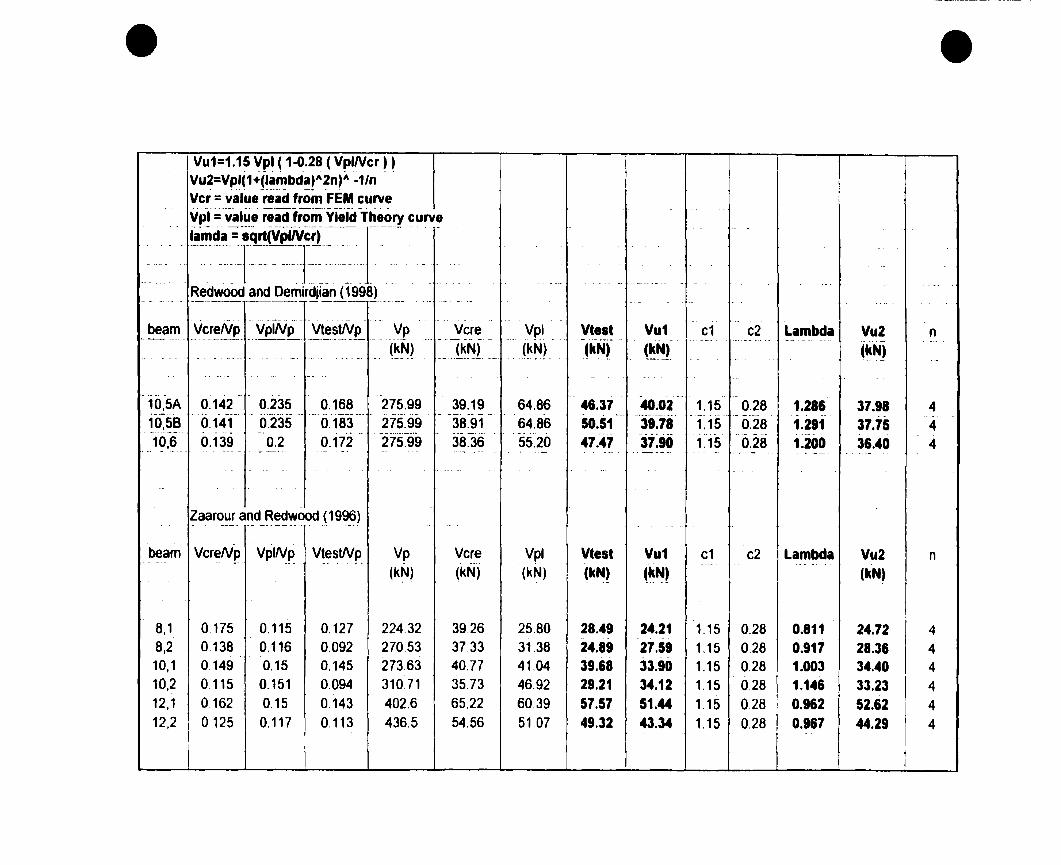
• •Vu1=1.1~ Vpl ( 1-0.28 (VpINer) )Vu2=\I~1(1+~~~bd~~A~n)A -1/nVer = value read from FEM curveVpl~~valuerëadfronlVI.ïël -Thèory curve
.. . - ..iamda =Sq-rtivpwcr)--r-- - ....
-
- - -: -[- --~I_-_ .- .- . . - ~ .....• - - -
-_... - ---- ~ ~~ --'--- - - - - .- . - - -~-. . . --
_. _. ,_. -. -. Redwood and Demirdjian (1998)- ---- _. - .. -.--~--- ------ - --- _._- --- ...- .. ~
. ~. '-' - .. , .......- -... - - . - .. ~. . ..
beam VereNp ._Vp~~. ~~~~~ __'J.P ... Vere __ Vpl . Vtest Vu1 e1 e2 Lambda Vu2 n------- _. - -- --'"- - .. _- - -- _. - - ._-- .. ----- -- - . .... _.- ..... -- ------.- _.- -
- .. - .- - .. - .. ". • .,. o ••• o' (~~~ __ J~~l __ .J~~)_ . l~~J _ .(kNl. - - (~~J ..-
- ~ - - - -.. _. - - .. - - _·"'-_0' • ,. - - ...
- -- _.- - . ~ . -- _.. _. - - .. _. . --10,5A 0.142 0,235 0,168 275,99 39.19 64.86 46.37 40.02 1.15 0.28 1.286 37.98 4
- . -- - -- ---- - ._-•.-..---- '.. ~- .. - --~- --- --" --- -- - -.. - .- .--- ~ .. _. -._.-.__ .... _.
10,58 0.141 0,235 0,183 275.99 38.91 64.86 50.51 39.78 1.15 0,28 1.291 37.75 4- -"- . -_ ....._-_.-~ -.- -_.-.
-37:90 1.20010,6 0.139 0.2 0.172 275.99 38,36 55.20 47.47 1.15 0,28 36.40 4... _.-'- -- . -- -- -- _.~ .... -- .. _~--- _.0'·__ -··_--.- - ._- '•• *- . ~ _.-- -- . - • ~.. . ------ - -- .- .- ~ -~-- . ~---- . ~ - _.-
- .. - ~ .. . .. • - F .•• _. . -- . - . ,- .
..
?a~r~~~_a~d~~~~~C?OdJ19~)- ~
-
beam Vcr~--',!p Vel~p' . V~~~tNp~ Vp Vere Vpl Vtest Vu1 e1 e2 Lambda Vu2 n. --- - '-" ...
(kN) (kN) (kN) (kN) (k~~ (kN)
8,1 0175 0.115 0,127 224,32 39.26 2580 28.49 24.21 1.15 0.28 0.811 24.72 48,2 0.138 0.116 0,092 270.53 37.33 31,38 24.89 27.59 1,15 0.28 0.917 28.36 4..
10,1 0.149 0,15 0,145 273,63 40,77 41.04 39.68 33.90 1.15 0,28 1.003 34.40 410,2 0.115 0.151 0.094 310,71 35.73 46.92 29.21 34.12 1.15 0,28 1.146 33.23 412,1 0162 0.15 0,143 402.6 65.22 60.39 57.57 51.44 1.15 0.28 0.962 52.62 412,2 0125 0.117 0,113 436,5 54.56 51.07 49.32 43.34 1.15 0,28 0.967 44.29 4
j t1

• •Husain and Speirs (1973)
beam VcreNp Vell'{e Yt,~sYVp Vp Vere Vpl Viesi Vu1 c1 e2 Lambda Vu2 n
.. - - (kN) (kN) (kN) (kN) (kN) ~~~!...
- - - - -- --- .- - . . .
-, . ,
G2 0.375 0.173 0.171 430.38 161.39 74.46 73.59 74.56 1.15 0.28 0.679 73.64 4._-_.__ . . - .- - -- -_.-_.~-. - -0- _._ .•._____ _._- --_. -- _.. 0_- ____________ . -._~- ---_._--~ . ··----._0 .. .,
- .- - - . . ---- _._-. - ,.' ... - . -- ._-- -- ----- ._.~ • 0_ •• '. 0'_-. - --- . '- . -. - - -~-~. - . - -- - ."--'" . - -- . -- . - ,.
__ o. ___ - .. -- -"-- -- -... ,- -------. - .- -- . - .--- ----- .. - ---- - . .. --
-~-}~~r!lOunlë-ll~~L_. :- ,,- -'- -- ---.. - ..'. - ---- .. -- --.-. - - __ 'A " ... , ,
- .. ' ... -- .._. -.- . "0'--- --
- -". - -.-... - - . . -beam ,'{C!f!'Yp.. y'p!'Y-.P. Y~f!~~P ... YP.., Vere ,!p-I. _, Vtest Vu1 c1 c2 Lambda Vu2 n._---- . _. - . ___ ... __ 'F .. - --_... _-- .. ., . - - "-_.' -----
Jk~~ ,-- ._--~ .~-
.__ .. . _. -- -- _.- o ••• ~~~J_ ... ~~NL , ,{~_N.L __ ~~) i~~L...- -'.- .-_. - ---- . -- ... .- . .-. - -
-- - - ---68.45
-El 1.449 0.289 0.354 218.13 316.07 63.04 77.22 1.15 0.28 0.447 63.01 4- ._,--~-- _. - ...-. ---
E2 1.449 0.289 0.3998 218.13 316.07 63.04 87.21 68.45 1.15 0.28 0.447 63.01 4-1.'449' - --.. ---
E3 0.289 0.411 218.13 316.07 63.04 89.65 68.45 1.15 0.28 0.447 63.01 4"1.449
- . . _. .. ---- -
E4 0.289 0.417 218.13 316.07 63.04 90.9& 68.45 1.15 0.28 0.447 63.01 4-_.--- .. 0'_.--. _._ - - ... ....... .. - - - - ..~ - - ...- -- -_.- ..."- -, - .
beam ~~~'.Mp- ~pl/Mp Mtestl~p Mp . Mer Mpl Mtesl Mu1 cl e2 Lambda Mu2 n(kN.m~ (kN.m) (kN) (~~). ~kN) ~kN)
II 13.268 0.869 0.924 63.37 840.79 55.07 58.55 62.17 1,15 0.28 0.256 55.07 4l2 13.268 0.869 0.906 63.37 84079 55.07 57.41 62.17 1.15 028 0.256 55.07 4
1
l3 13.268 0.869 0.967 63.37 840.79 55.07 61.28 62.17 1.15 0.28 0.256 1 55.07 4
Top Related